 G. D. A. Topé
 G. Alory
 S. Djakouré
 C.Y. Da-Allada
 J. Jouanno3
- 1International Chair in Mathematical Physics and Application (ICMPA)-UNESCO Chair/University of Abomey Calavi (UAC), Cotonou, Benin
- 2Laboratory of Matter, Environment and Solar Energy Sciences, Félix Houphouët Boigny University in Abidjan, Abidjan, Côte d’Ivoire
- 3Centre National d’Etudes Spatiales CNES, Centre National de la Recherche Scientifique (CNRS), Institut de Recherche pour le Développement (IRD), Université Paul Sabatier (UPS), Laboratoire d’Etudes en Géophysique et Océanographie Spatiales (LEGOS), University of Toulouse, Toulouse, France
- 4Laboratoire de Géosciences, de l’Environnement et Applications (LaGEA)/Ecole Nationale Supérieure des Travaux Publics (ENSTP)/Université Nationale des Sciences, Technologies, Ingénierie et Mathématiques (UNSTIM), Abomey, Benin
- 5Laboratoire d’Hydrologie Marine et Côtiére (LHMC)/Institut de Recherche Halieutique et Océanologique du Benin (IRHOB), Cotonou, Benin
To highlight the processes by which the Niger River warms the coastal waters in the eastern part of the northern Gulf of Guinea upwelling, two simulations of the NEMO model at high resolution were used over the period 2010 - 2017. The first simulation is realistic while the second is a simulation in which the effects of the Niger River are not taken into account. The first step was to evaluate the outputs of the models, using satellite products and in situ observations. The average states of the Sea Surface Temperature, Salinity, Height, zonal current and vertical profiles of temperature and salinity showed the ability of the model to reproduce correctly the physical characteristics of the study area. The analysis of the heat balance terms of the two simulations showed that vertical diffusion and meridional advection processes are the causes of the warming induced by the Niger River. The stratification and vertical shear of the horizontal currents reveal that the river acts by inhibiting the upwelling of cold water induced by vertical diffusion. The river reinforces the stratification and prevents vertical shearing of horizontal currents at the bottom of the mixed layer.
1 Introduction
The Northern Gulf of Guinea (NGG, 15°W-15°E, 10°S-8°N) is a region of the tropical Atlantic Ocean where coastal waters are subject to temperature changes caused mainly by a seasonal coastal upwelling, extending from Côte d’Ivoire to Nigeria and reaching its highest intensity in boreal summer from July to September (e.g., Djakouré et al., 2014; Djakouré et al., 2017; Sohou et al., 2020). This upwelling plays a key role on primary production, local fisheries and thus on the economy of the countries bordering the NGG (Koné et al., 2017; Yago, 2021). It has also been shown that this coastal upwelling can influence the regional climate, in particularly rainfall along the coast, by interacting with the West-African Monsoon flux at seasonal and interannual timescale (Ali, 2009; Tanguy et al., 2021).
East of Cape Three-Points at 2°W, the coastal upwelling is wind-driven (Djakouré et al., 2017). East of 2°E, near the Niger River plume, the upwelling sharply weakens. Freshwater plumes have important effects on marine ecosystems. Indeed, they can significantly modify stratification, nutrient inputs, light penetration and ocean circulation (Hickey et al., 2005). Low salinity river plumes create lateral pressure gradients, inducing geostrophic surface currents oriented towards the coast, to the right of the estuary in the northern hemisphere (Fong and Geyer, 2002). These currents can then converge towards the coastal upwelling zone, in the Niger River case, potentially compensating the wind-driven upwelling (Marchesiello & Estrade, 2010). Therefore, quantifying the impact of the Niger River plume on the seasonal variability of the NGG coastal ocean dynamics is essential for a better understanding of the marine ecosystem evolution.
Previous investigations using ocean simulations have shown that the mixed layer would deepen in the absence of the Niger River in the NGG (Da-Allada et al., 2013). Recently, Alory et al. (2021) showed that the river has no direct effect on the vertical velocities associated with the upwelling, although it warms the upwelling area up to 1°C at the surface. Their study did not identify the mechanisms driving this river-induced coastal warming. These authors suggest that this warming could be explained by geostrophic currents that bring warmer offshore waters toward the coast. Also, stratification enhancement, associated with the plume, could contribute by trapping solar heat near the surface and reducing vertical mixing.
The main objective of this study is to determine the physical processes by which the Niger River warms the NGG coastal waters and to quantify their relative contribution. To achieve this, we will use simulations of a regional numerical model covering the NGG area, preliminary validated with observations.
The rest of the manuscript is organised as follows: the model description, the observation data and the methodology used are described in Section 2. The results including the evaluation of the model, simulated river-induced coastal warming, and the heat budget to identify physical processes that drive this warming are presented in section 3. Finally, discussion and conclusion are given in Section 4.
2 Data and methods
2.1 Observations
Different in situ and satellite datasets were used to evaluate the model.
Sea surface temperature (SST) in situ measurements are based on four coastal stations equipped with ONSET sensors installed along the NGG coast at Sassandra in Côte d’Ivoire (6.08°W; 4.95°N), Takoradi in Ghana (1.73°W; 4.88°N), Cotonou in Benin (2.67°E; 6.52°N) and Lagos in Nigeria (3.41°E; 6.42°N) in the framework of the Research Program in Physical Oceanography in West Africa (PROPAO). The in situ ONSET sensor hourly data series are available over the period 2008–2012 (Sohou et al., 2020). We also used the monthly version of the Moderate Resolution Imaging Spectroradiometer (MODIS-AQUA, L3, v2019, https://oceandata.sci.gsfc.nasa.gov ) SST, with a spatial resolution of 4 km over the time period 2007-2017. We prefer to use this infrared SST product rather than blended satellite products that can underestimate SST cooling in coastal upwelling regions (Meneghesso et al., 2020). Sea surface salinity (SSS) satellite data were collected from the Soil Moisture Active Passive (SMAP) v5 product, with a 0.25° and 8-day resolution, which benefits from a correction of systematic biases near the coasts and adjustment of the long term mean in dynamical areas like river plumes (Dossa et al., 2021). We also used SSS measurements collected in situ from underway thermosalinographs (TSG) during eight cruises or crossings of French research and commercial ships in the Gulf of Guinea during the summer season between 2000 and 2018 (Gaillard et al., 2015; Bourlès et al., 2019; Alory et al., 2021).
As for the sea surface height (SSH), it was evaluated using the CMEMS (Copernicus Marine Environment Monitoring Service) product, combining data from several satellite missions interpolated daily on a quarter degree (1/4°) resolution grid (Le Traon et al., 1998; Ducet et al., 2000).
In addition, we used monthly averages of in situ National Oceanic and Atmospheric Administration (NOAA) surface drifters data for the assessment of the zonal surface current (Laurindo et al., 2017).
Finally, subsurface temperature and salinity were extracted from the World Ocean Atlas (WOA; Locarnini et al., 2018; Zweng et al., 2019). We used the seasonally averaged climatological product, with 0.25° horizontal resolution and a 5 m vertical resolution in the upper 100 m.
2.2 Numerical model
The numerical setup is based on the Nucleus for European Modeling of the Ocean (NEMO; Madec, 2016) model. The model solves in a Cartesian coordinate system the primitive equations discretised in an Arakawa C grid. The regional configuration covers the tropical Atlantic at 1/36° horizontal resolution (10°S - 6.5° N and 10.5° W - 13° E), with 50 vertical levels (12 levels within the first 20 m and 22 levels in the upper 100 m). At the surface, the model is forced with the DFS 5.2 product (Drakkar Forcing Set version 5.2, Dussin et al., 2016) and the nonsolar heat fluxes are provided by bulk formulae (Large and Yeager, 2009). A river flow based on data from Dai and Trenberth (2002) is prescribed near the river mouths as a surface freshwater flow, associated with vertical mixing over a characteristic 10 m depth, which decreases exponentially river waters has not been prescribed in the model. It is similar to that of the oceanic surface waters. A reference simulation (“REF”) was carried out over the period 2005-2017, as well as a twin simulation (“noRIV”) over the period 2008-2017, where river runoff is not taken into account. In the latter, vertical mixing near the river mouths is maintained to ensure that differences between the simulations are only due to changes in freshwater flux. Both simulations follow a 2-year climatological spin up. Their monthly mean seasonal climatology will be compared over the common 2010-2017 period. The mixed layer depth (MLD) is defined as the depth at which the density has increased by 0.03 kg. m-3, with reference to the density at 10 m. This criteria is recommended by De Boyer Montégut et al. (2004) and has been previously used in several studies in the region (e.g. Jouanno et al., 2011; Da-Allada et al., 2014; Jouanno et al., 2017; Alory et al., 2021; Da-Allada et al., 2021; Kanga et al., 2021). In particular, N’Guessan et al. (2019) show from visual inspection of more than 500 density profiles that it is the best suited criteria to determine the MLD in the Gulf of Guinea. The mixed layer is located between 9.5m and 12m in “REF” and between 10m and 13.5m in “noRIV” simulation, which means it extends over 9 or 10 model depth levels. These simulations were used for the first time in this work and have not been validated before.
2.3 Mixed layer heat budget
To examine the causes of the surface warming induced by the Niger River, a mixed-layer heat budget is used, in both the REF and noRIV simulations, which can be written as follows (Jouanno et al., 2011; Jouanno et al., 2017; Da-Allada et al, 2021):
With
where, T is the model potential temperature, the surface reference density (set to 1,021 kg. as in Li et al., 2013), Cp the heat capacity (set to 3984 J as in Wade et al., 2011), h MLD, the nonsolar surface heat flux (sum of the net longwave radiation, the sensible and latent heat fluxes), the net shortwave radiation, the fraction of the shortwave radiation that reaches the MLD, (u, v, w) the velocity components, the vertical diffusion coefficient for tracers and the lateral diffusion operator. The total temperature trend on the left-hand side of equation (1) is thus controlled from left to right by zonal and meridional advection (XAD and YAD respectively), lateral diffusion (LDF), vertical advection (ZAD), vertical diffusion (ZDF), entrainment (RES) at the base of the mixed layer, and finally the net air-sea heat flux (ATMOS). We group oceanic processes into two categories: horizontal processes as HORIZ (HORIZ=XAD+YAD+LDF) and vertical processes as VERTIC (VERTIC=ZAD+ZDF+RES). All terms in equation (1) are computed explicitly in the model, except for the entrainment term (RES) which is estimated as a residual. For the investigation of the causes of the variation in meridional advection, we used the following decomposition:
where Δ represents monthly seasonal variations and< > represents annual means.
The meridional current is decomposed into geostrophic and Ekman components. The geostrophic component is calculated as follows:
Where SSH is sea level and f the Coriolis parameter. The Ekman velocity is obtained from the difference between the total velocity and the geostrophic velocity. The Brunt Vaïsala frequency N² (T, S) is decomposed into its components to describe the temperature stratification N²(T) and the salinity stratification N²(S). N² (T, S) is calculated as follows (e.g. Da-Allada et al., 2021):
where g is gravity, α is the coefficient of thermal expansion, β is the coefficient of haline contraction, and , the vertical temperature and salinity gradients. The shear parameter is used to analyse the vertical shear of horizontal currents. is calculated as follows (e.g., Da-Allada et al., 2021):
3 Results
3.1 Model validation
This section evaluates the ability of the model to reproduce the main characteristics of the NGG. Only a lower (1/12°) resolution regional NEMO version was previously validated (Alory et al., 2021).
a. Seasonal cycle of SST
The SST of the model was evaluated in comparison with the ONSET sensor data of the PROPAO program (Figure 1). The model reproduces well the average seasonal cycle of the SST of the ONSET sensors. However, we observe differences in SST between the model and the in situ observations, which are more pronounced in boreal summer (up to 2°C at the Sassandra station). These differences could be due to small-scale near-shore dynamics not simulated in the model. The model is slightly warmer than the in situ measurements for all stations but the one in Nigeria where it is slightly colder, especially in summer. The later could be due to the fact that the temperature of the river waters, potentially warmer than the ocean, is not taken into account. These differences reach a maximum during the July-August-September (JAS) upwelling season, which timing is very consistent between the model and Onset sensors.
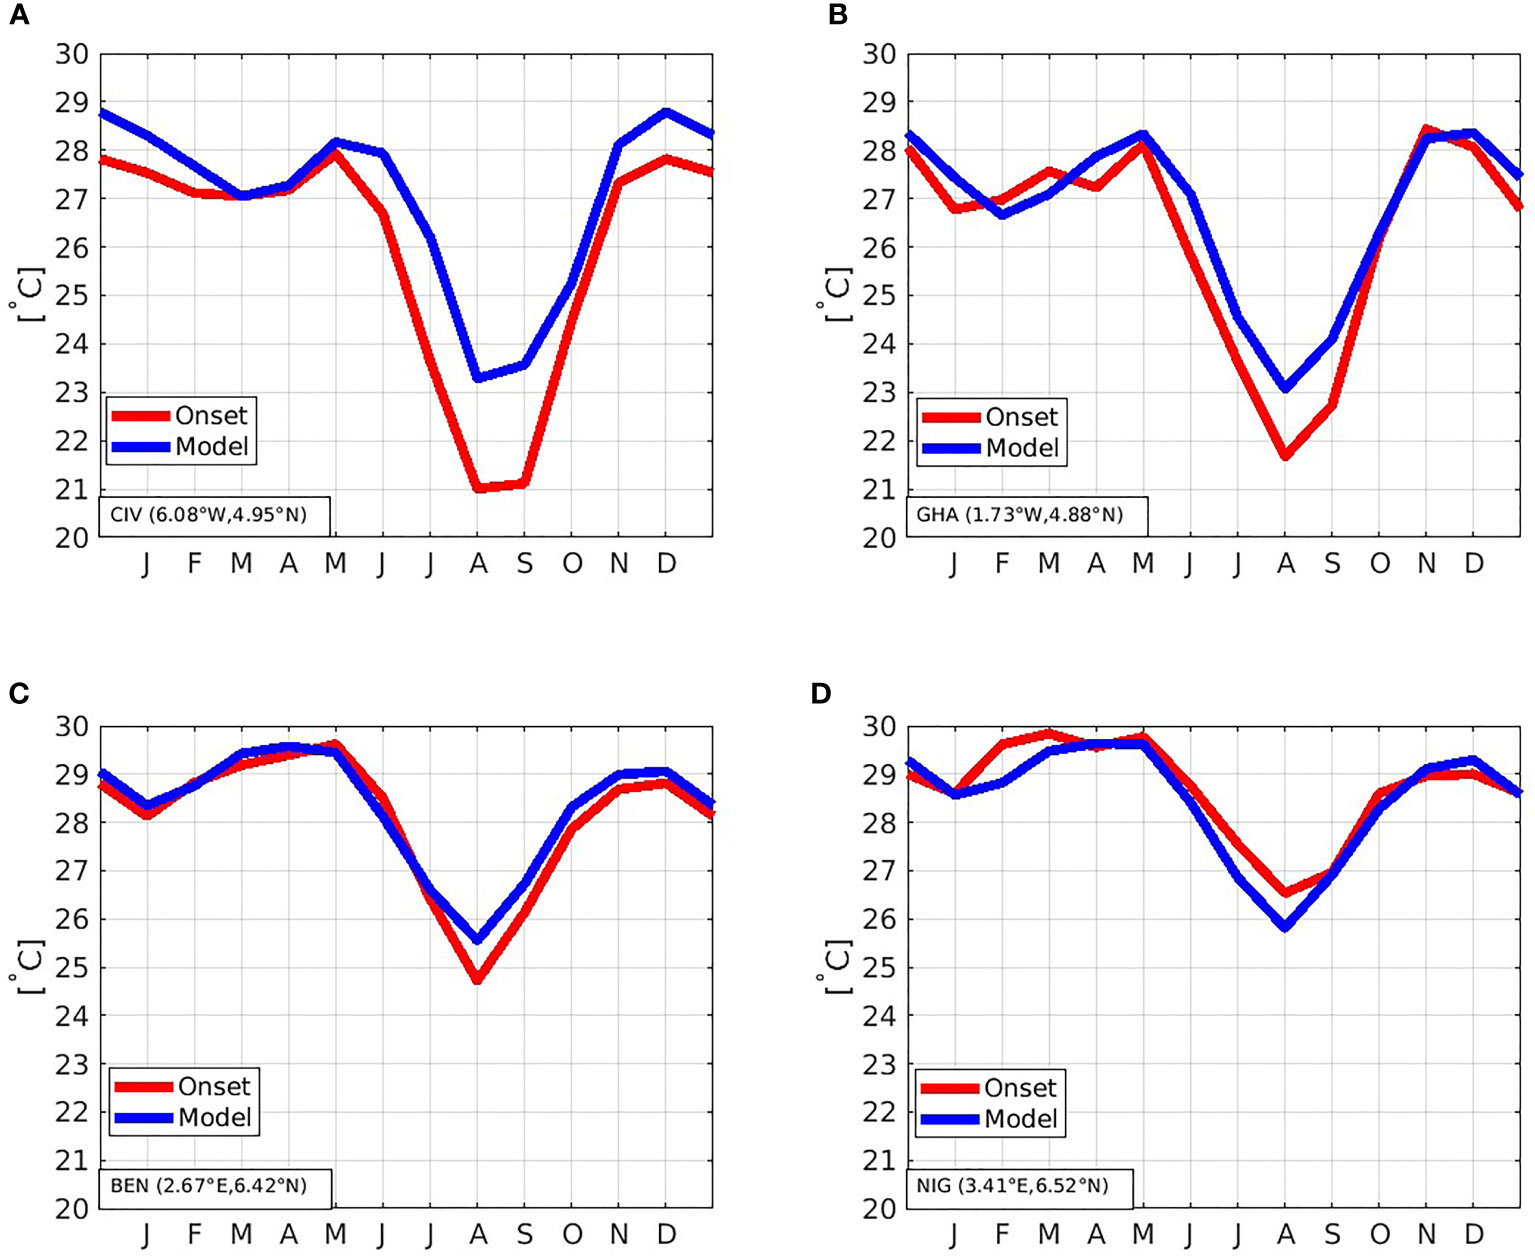
Figure 1 Seasonal cycle of the model SST (in blue) and the ONSET sensors SST (in red) over the period 2008-2012 at PROPAO stations: (A) Côte d’Ivoire; (B) Ghana; (C) Benin; (D) Nigeria.
b. Summer climatology of SST, SSS, SSH and zonal surface current.
The climatological mean summer SST for both the model and the MODIS product for the 2007-2017 period are compared in Figures 2A, B. The model reproduces the main features of the NGG SST. The upwelling cells west and east of Cape Three Points are well represented. Both satellite and model show that the eastern cell is colder than the western cell downstream of Cape Palmas, as found by Djakouré et al. (2014). However, the model shows a cold bias in the coastal upwelling area relative to the satellite data, contrary to its warm bias relative to coastal stations. This suggests the satellite data may have deficiencies near the coast.
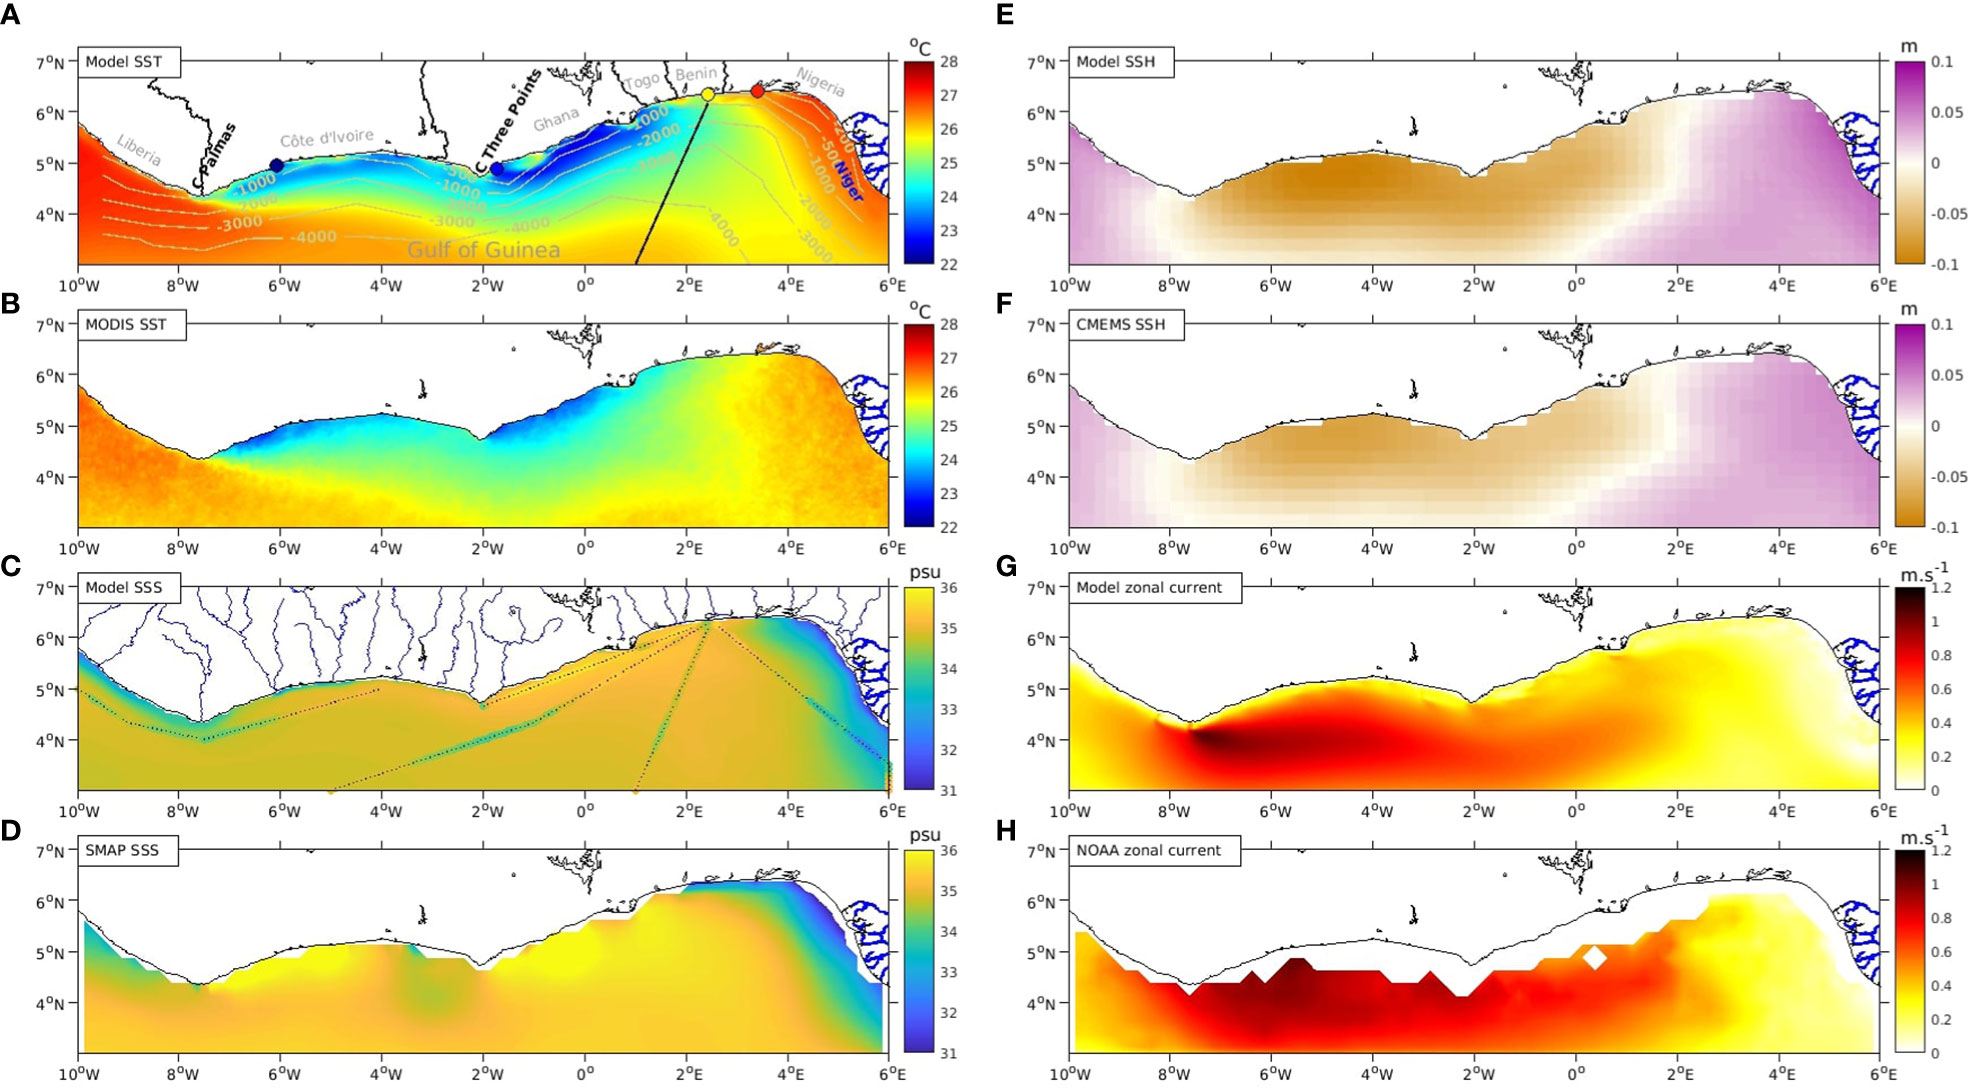
Figure 2 Summer mean (July-August-September) for the period from 2010 – 2017 (except for MODIS data): (A) Model SST, and location of coastal PROPAO stations (dots in blue, yellow and red colors near coast), cross-shore section used in Figure 3 (black line) and study area bathymetry (contours), (B) MODIS SST, (C) Model SSS and repeated 2000–2018 TSG transects (colored tracks), (D) SMAP SSS, (E) Model SSH, (F) CMEMS SSH, (G) Model zonal current, (H) NOAA drifter’s zonal current.
The model SSS is compared with the SMAP product in Figures 2C, D. The model reproduces roughly the SSS observed by the SMAP satellite, in particular the SSS minimum extending from 4°E to 6°E and associated with Niger River plume (Alory et al., 2021). However, salinity differences are observed, particularly in coastal upwelling area, East of capes where differences reach + 2 psu in SMAP product. Moreover, coastal freshening associated with rivers in western part of NGG are weaker in SMAP.
These differences are probably due to the difficulty of the satellite to observe salinity gradients near the coast (Dossa et al., 2021). Model SSS is also in good agreement with the TSG transects, with differences that may be due to interannual variability inherent to the sparse sampling (Alory et al., 2021).
The SSH of the model was also evaluated by comparison with the CMEMS altimetry data (Figures 2E, F). As expected, low SSH between longitudes 7°W and 2°E, is largely associated with cooling in the upwelling area. SSH increases eastward from 2°E with a maximum in the Niger River plume, due to steric variations associated with both temperature and salinity changes (Alory et al., 2021).
Finally, the zonal surface current is compared between the model and the drifters (Figures 2G, H). The model reproduces very well drifters’ observations. The eastward Guinea Current intensifies between the Capes (7°W-2°W) then weakens until it disappears around 4°E.
c. Vertical sections of temperature and salinity
In addition to the surface data, south-north vertical temperature and salinity sections of the model are compared to the WOA climatological data along 0°E (Figures 3A, B). The model reproduces well the vertical temperature section. The warm surface waters are isolated from the cold bottom waters by the thermocline (approximated by the 20°C isotherm).
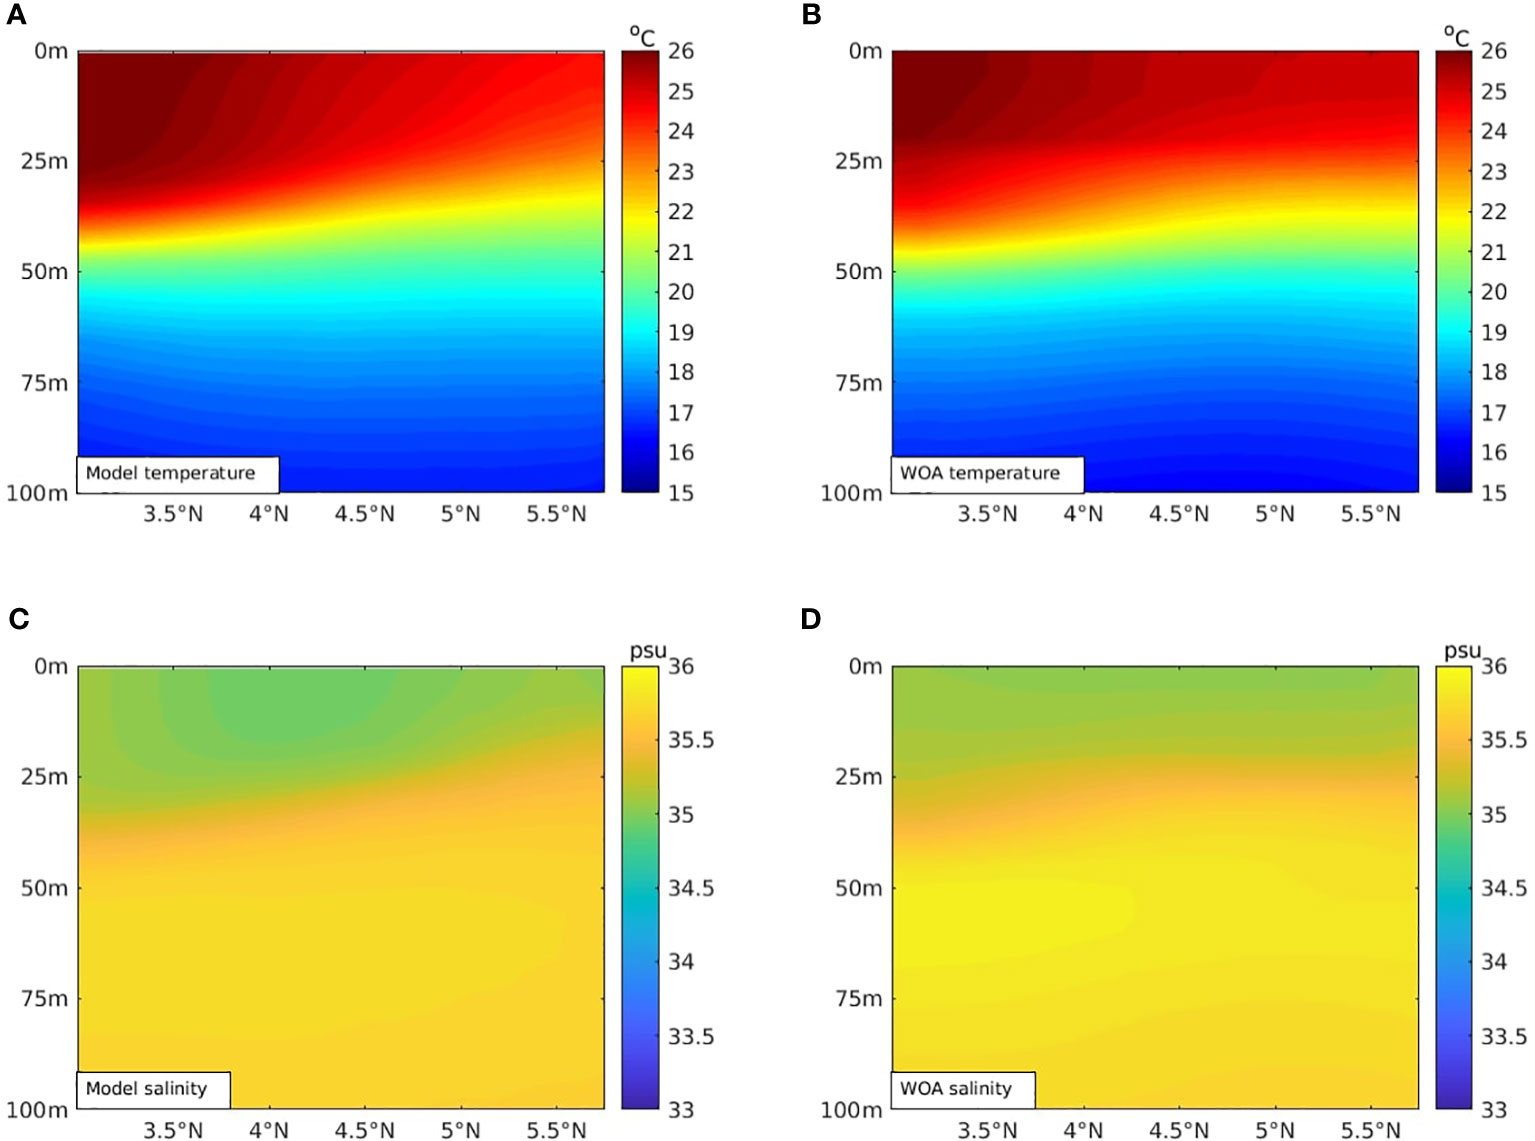
Figure 3 Mean summer cross-shore 0-100 m vertical sections: (A) Model temperature, (B) WOA temperature, (C) Model salinity, (D) WOA salinity. Temperature and salinity data from the model cover the period 2010-2017. The climatologies of vertical temperature and salinity sections of the WOA product are made for the periods 1955-2017 and 2005-2017 respectively.
There is also an upward movement of the thermocline from the open ocean to the coast which is consistent with coastal upwelling. Also, the model reproduces well the vertical salinity section (Figures 3C, D), with a slope of the halocline (in this case the 35.5 psu isohaline) similar to the thermocline slope. However, the steepening of the thermocline and halocline seen in the model between 5°N and the coast, where upwelling is particularly strong, is not seen in WOA, probably due to a poor density of observations near the coast.
3.2 Observed warming induced by the Niger river
Figures 4A, B show the summer SST climatologies of the REF and noRIV simulations, respectively. Differences between these climatologies show a clear warming effect induced by the Niger River, with a maximum of around 0.5°C between 2°E and 4°E near the coast (Figure 4C). This warming confirms the results of Alory et al. (2021), although it was stronger and with a larger extension in their lower resolution simulation (1/12°).
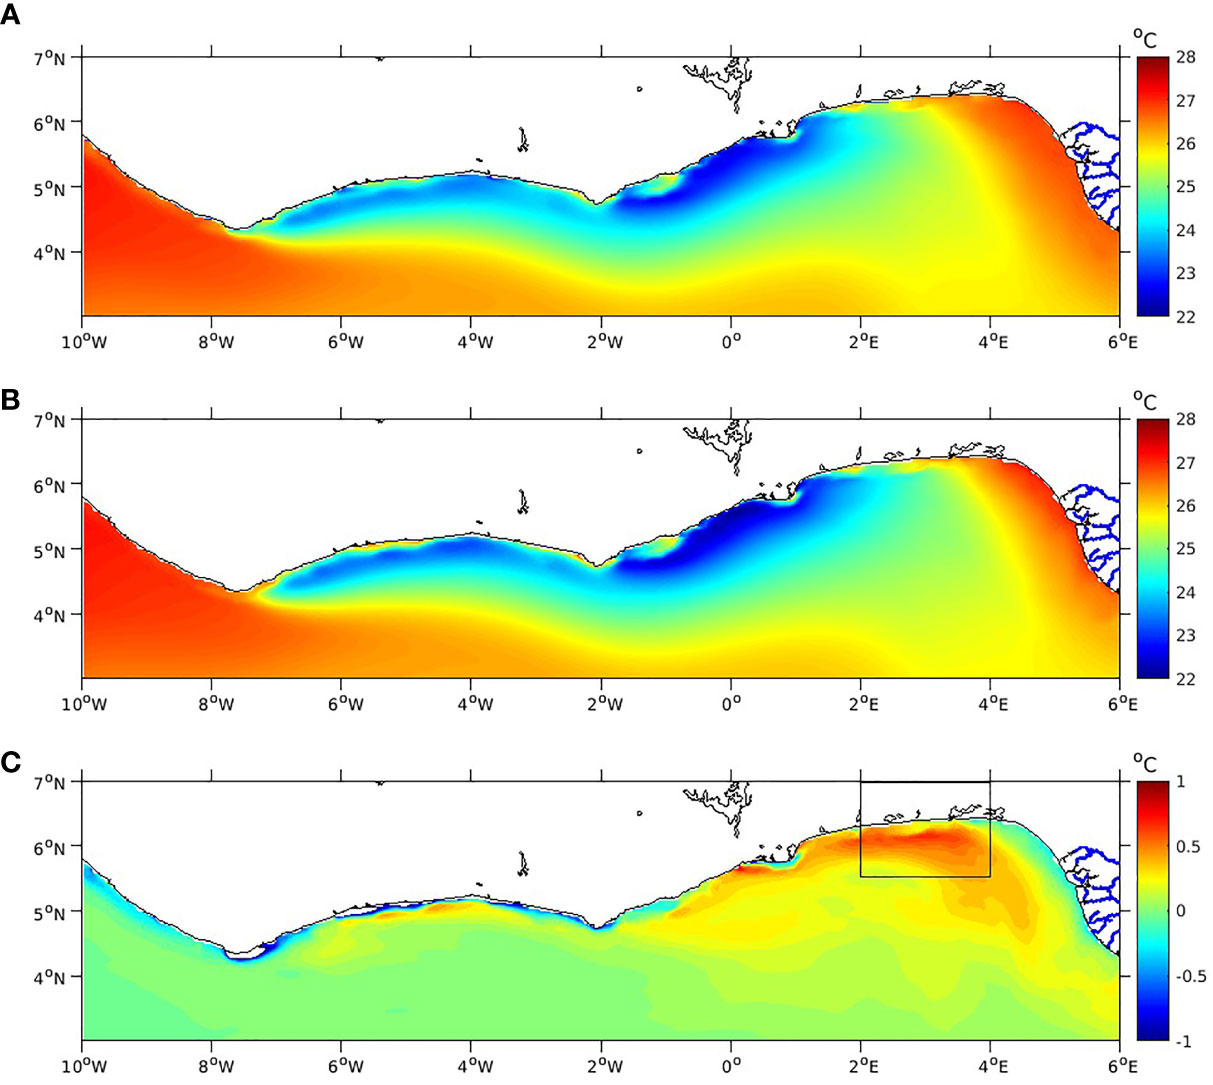
Figure 4 Mean summer (July-August-September) of SST over the period 2010-2017: (A) REF, (B) noRIV, (C) REF-noRIV.
In the following, we investigate the heat budget in the box bordered by 2°E - 4°E; 5.5°N – 7°N (Figure 4C), where the warming reaches its maximum.
3.3 Processes involved in warming
Processes influencing the temperature of the mixed layer can be classified into three categories: horizontal processes (zonal and meridional advection, lateral diffusion), vertical processes
(vertical advection, vertical diffusion and entrainment) and atmospheric processes (solar and nonsolar fluxes). Figure 5A shows their relative contribution to the total temperature tendency of the REF simulation mixed layer. Atmospheric and vertical processes are the main contributors to the mixed layer temperature trend.
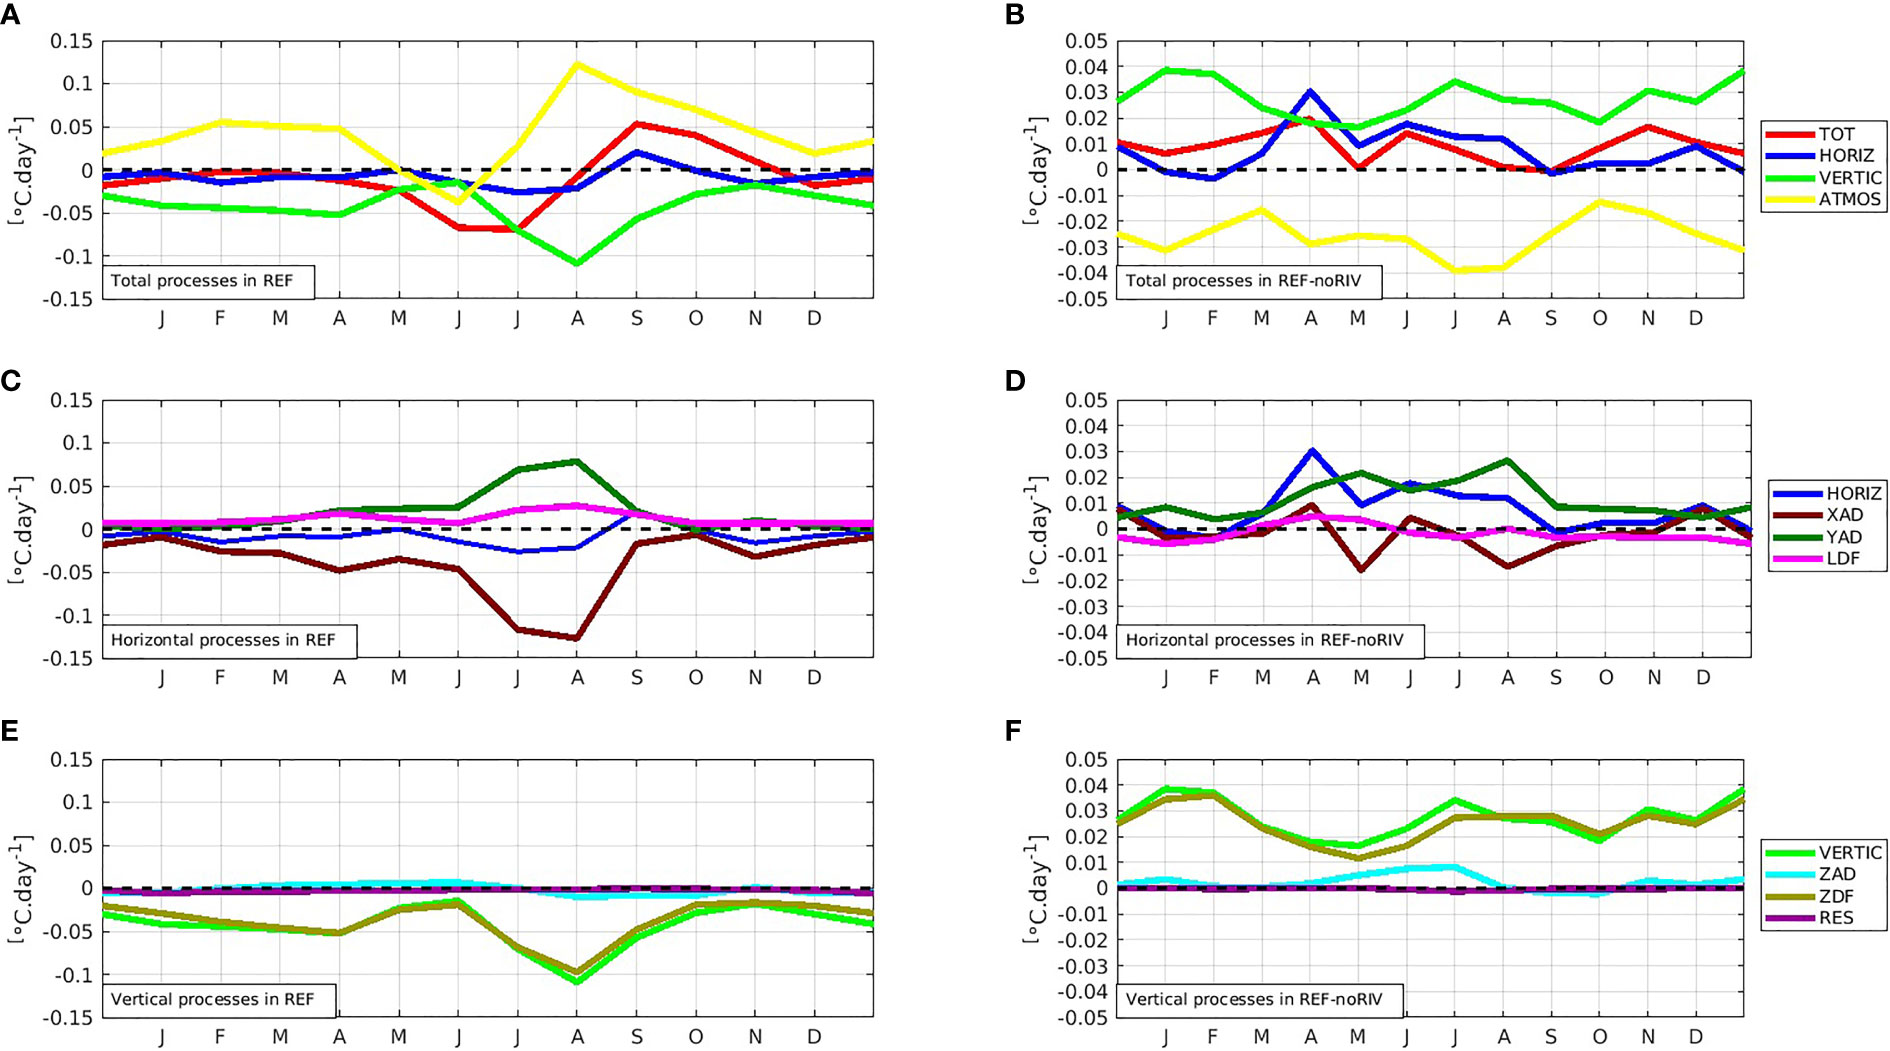
Figure 5 Mean seasonal cycles in REF and REF-noRIV for the period 2010-2017: (A, B) Total processes (TOT) with its components: horizontal processes (HORIZ), vertical processes (VERTIC), atmospheric processes (ATMOS), (C, D) horizontal processes with its components: zonal advection (XAD), meridional advection (YAD), lateral scattering (LDF), (E, F) vertical processes and its components: vertical advection (ZAD), vertical diffusion (ZDF), and entrainment (RES).
Atmospheric processes warm the upper ocean all year long except in June, with a maximum contribution larger than 0.1°C.day-1 in August. Vertical processes have always a cooling effect, peaking below -0.1°C.day-1 in August too. Horizontal processes have a relatively small contribution, with absolute values always lower than 0.04°C.day-1. The maximum cooling in June-July is mainly due to vertical processes as expected in a coastal upwelling region, but atmospheric processes contribute (in June) and also horizontal processes.
Figure 5B presents the REF-noRIV difference of the simulations with and without the Niger River. It shows that the river affects the 3 categories of processes. The river attenuates the cooling associated with horizontal and vertical processes, leading to warming. It also reduces the warming associated with atmospheric processes, which leads to cooling.
The warming prevails over the cooling most of the year. Thus, the net effect of the Niger River is to warm coastal waters, exclusively through oceanic processes (horizontal and vertical). The decomposition of each category of oceanic processes, into its different components, will allow to identify the terms of the heat balance through which the Niger River warms the coastal waters.
a. Horizontal processes
The contributions of zonal advection (XAD), meridional advection (YAD) and lateral diffusion (LDF) to horizontal processes (HORIZ) in the REF simulation are shown in Figure 5C. With minima below -0.1°C.day-1 reached in July-August, zonal advection is the main horizontal process influencing the temperature of the mixed layer, partly compensated by meridional advection, which reaches 0.075°C.day-1. Lateral diffusion has a weak contribution throughout the year. The REF-noRIV difference in horizontal processes (Figure 5D) reveals that meridional advection is the only horizontal process through which the Niger River warms the coastal waters. The seasonal signal of meridional advection shows two peaks, with the highest peak during the upwelling season in August (~0. 027°C.day-1).
b. vertical processes
Figure 5E shows the contributions of vertical advection (ZAD), vertical diffusion (ZDF) and entrainment (RES), to vertical processes (VERTIC) in the REF simulation. Vertical diffusion largely dominates the vertical processes, with vertical advection and entrainment relatively negligible. The REF-noRIV difference (Figure 5F), shows that river-induced changes in vertical processes are also almost entirely due to changes in vertical diffusion. The river thus contributes to mixed layer warming by limiting the cooling induced by vertical diffusion.
As vertical diffusion and meridional advection are the heat budget terms through which the Niger River warms the coastal waters, we proceed to examine in more details these warming terms.
3.4 Study of the processes associated with the warming induced by the Niger river
a. Vertical diffusion
Vertical diffusion is modulated by two mechanisms with opposite effects: stratification of the water column and vertical shear of horizontal currents.
Stratification isolates the surface waters, which are less salty and warmer, from the colder and saltier subsurface waters. On the contrary, vertical shear of the horizontal currents favours the upwelling of the subsurface water towards the mixed layer. To study the respective effects of these two mechanisms on vertical diffusion, we use the parameters (T), (S) and detailed in Section 2, calculated for each of the two simulations. The impact of the Niger River on vertical diffusion is evaluated from the REF-noRIV difference in the three parameters mentioned above. Figures 6A, B show the temperature stratification in the water column over the upper 100 m in the REF simulation and the REF-noRIV difference.
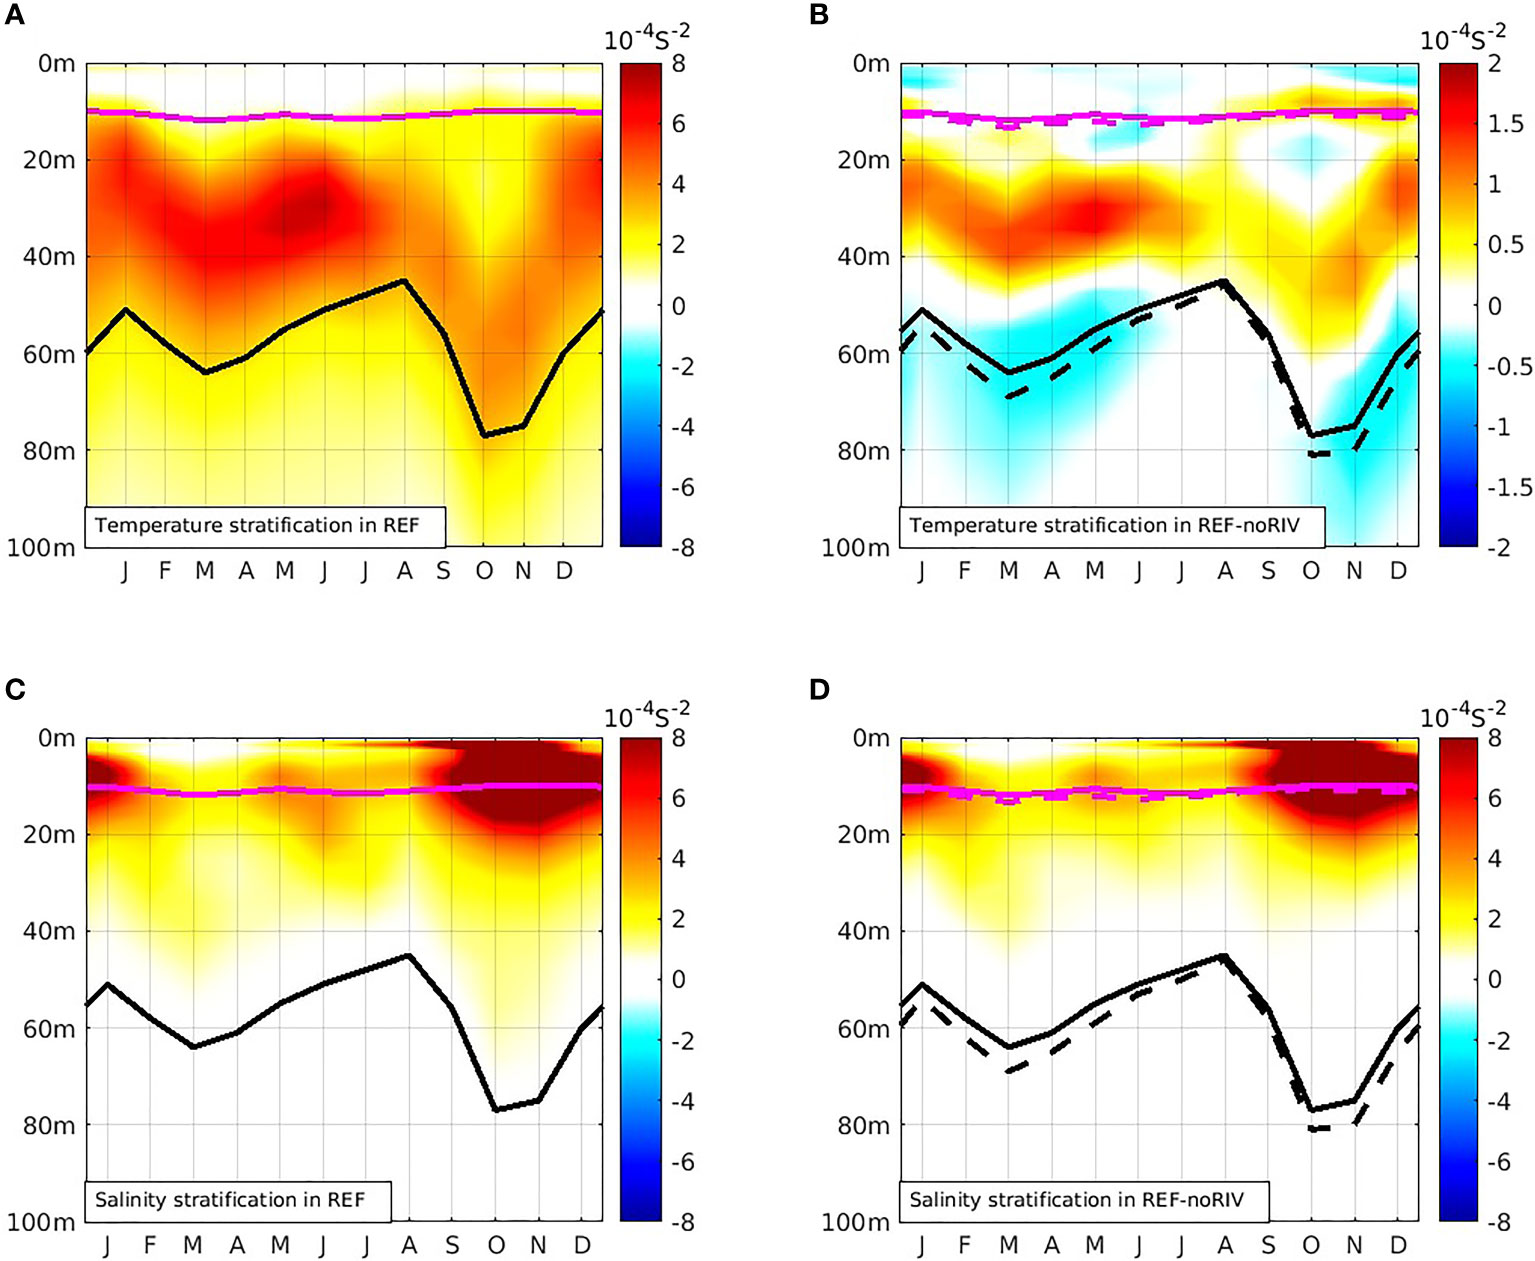
Figure 6 Seasonal cycle of vertical stratification in REF and noRIV for the period 2010-2017: (A, B) temperature stratification, (C, D) salinity stratification. The magenta lines (full line for REF and dashed line for noRIV) represent the depth of the mixed layer. The black lines represent the thermocline.
In REF, the strongest temperature stratification is observed between March and May, with values reaching 7*10-4 S-2 around a depth of 30 m. The positive stratification values in the REF-noRIV difference map show that stratification is stronger with the river at this depth. The river enhances by almost 60% the maximum temperature stratification between 20 m and 40 m depth.
Indeed, in the absence of a river, only solar radiation warms the waters of the mixed layer. In REF, in addition to the solar radiation, the stratification is reinforced by the freshwater input from the river plume. It also causes the mixed layer and thermocline to rise by a few metres as observed in Figure 6B.
The vertical stratification of salinity parameter N2(S), calculated in the two simulations, reveals that the salinity stratification is almost entirely due to the river’s freshwater inputs. Indeed, the similarity of Figures 6C, D indicates that salinity stratification is very weak in the noRIV simulation. The salinity at the surface is almost the same at 100 m. But in the presence of the Niger River (REF), the water column becomes very stratified in the upper 20 m. The river contributes to the maximum salinity stratification about 91%. As the salinity stratification caused by the river is much higher than temperature stratification (Figures 6B, D), we conclude that the strong salinity gradient induced by the river’s freshwater plume is the main cause of NGG sea water’s stratification.
We have also diagnosed the influence of the Niger River on the vertical shear of the horizontal currents (Figures 7A, B). The shear remains almost the same in the mixed layer of both simulations, except between August and October, where it is reinforced by about 40% (Figure 7B). In the REF simulation (Figure 7A), no values are observed at the bottom of the mixed layer. On the other hand, negative values are observed at the bottom of the REF-noRIV mixed layer (Figure 7B). These values indicate the entrainment of subsurface water in the mixed layer of the noRIV simulation. The stratification induced by the fresh river water thus prevents the entrainment of the subsurface water into the mixed layer.
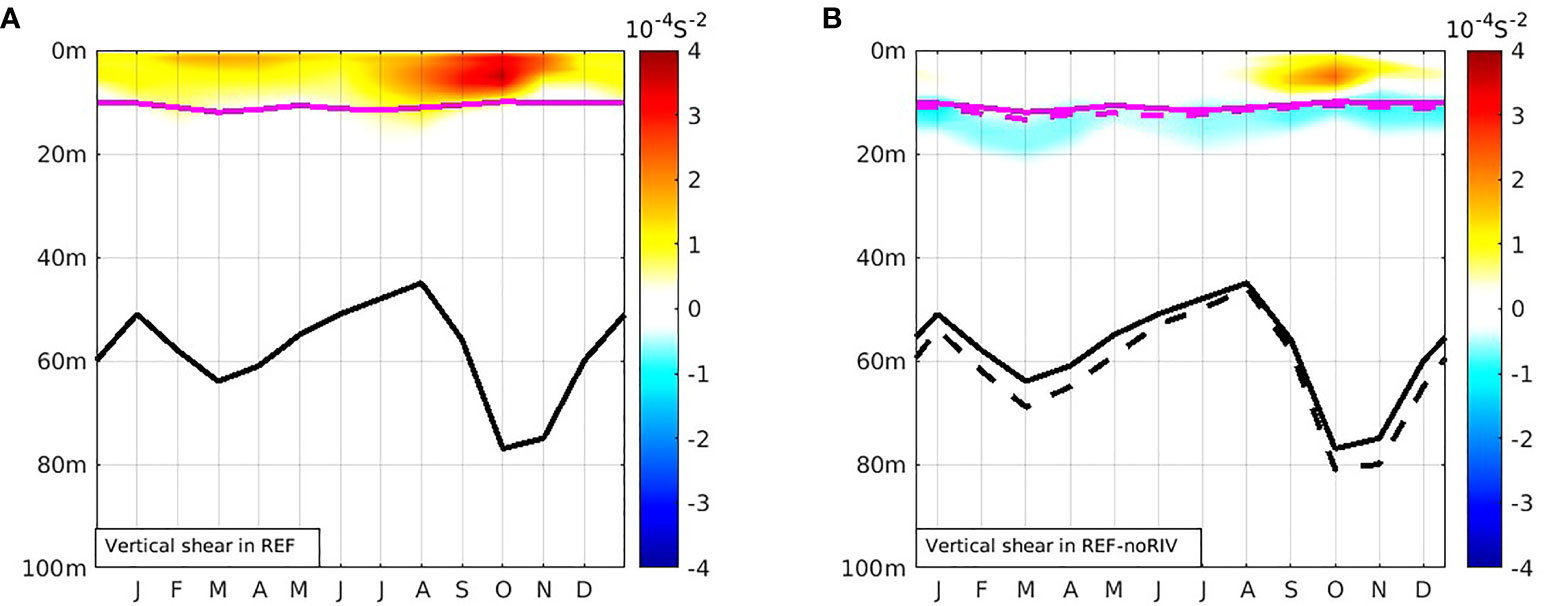
Figure 7 Mean cycle of vertical shear of horizontal currents for the period 2010-2017 in REF (A) and REF-noRIV (B). The magenta lines (full line for REF and dashed line for noRIV) represent the depth of the mixed layer. The black lines represent the thermocline.
b. Meridional advection
The previous sections showed that meridional advection is one of the processes explaining the warming induced by the Niger River. In this section, we investigate the potential causes of its variation, namely meridional current and meridional temperature gradient (Figure 8).
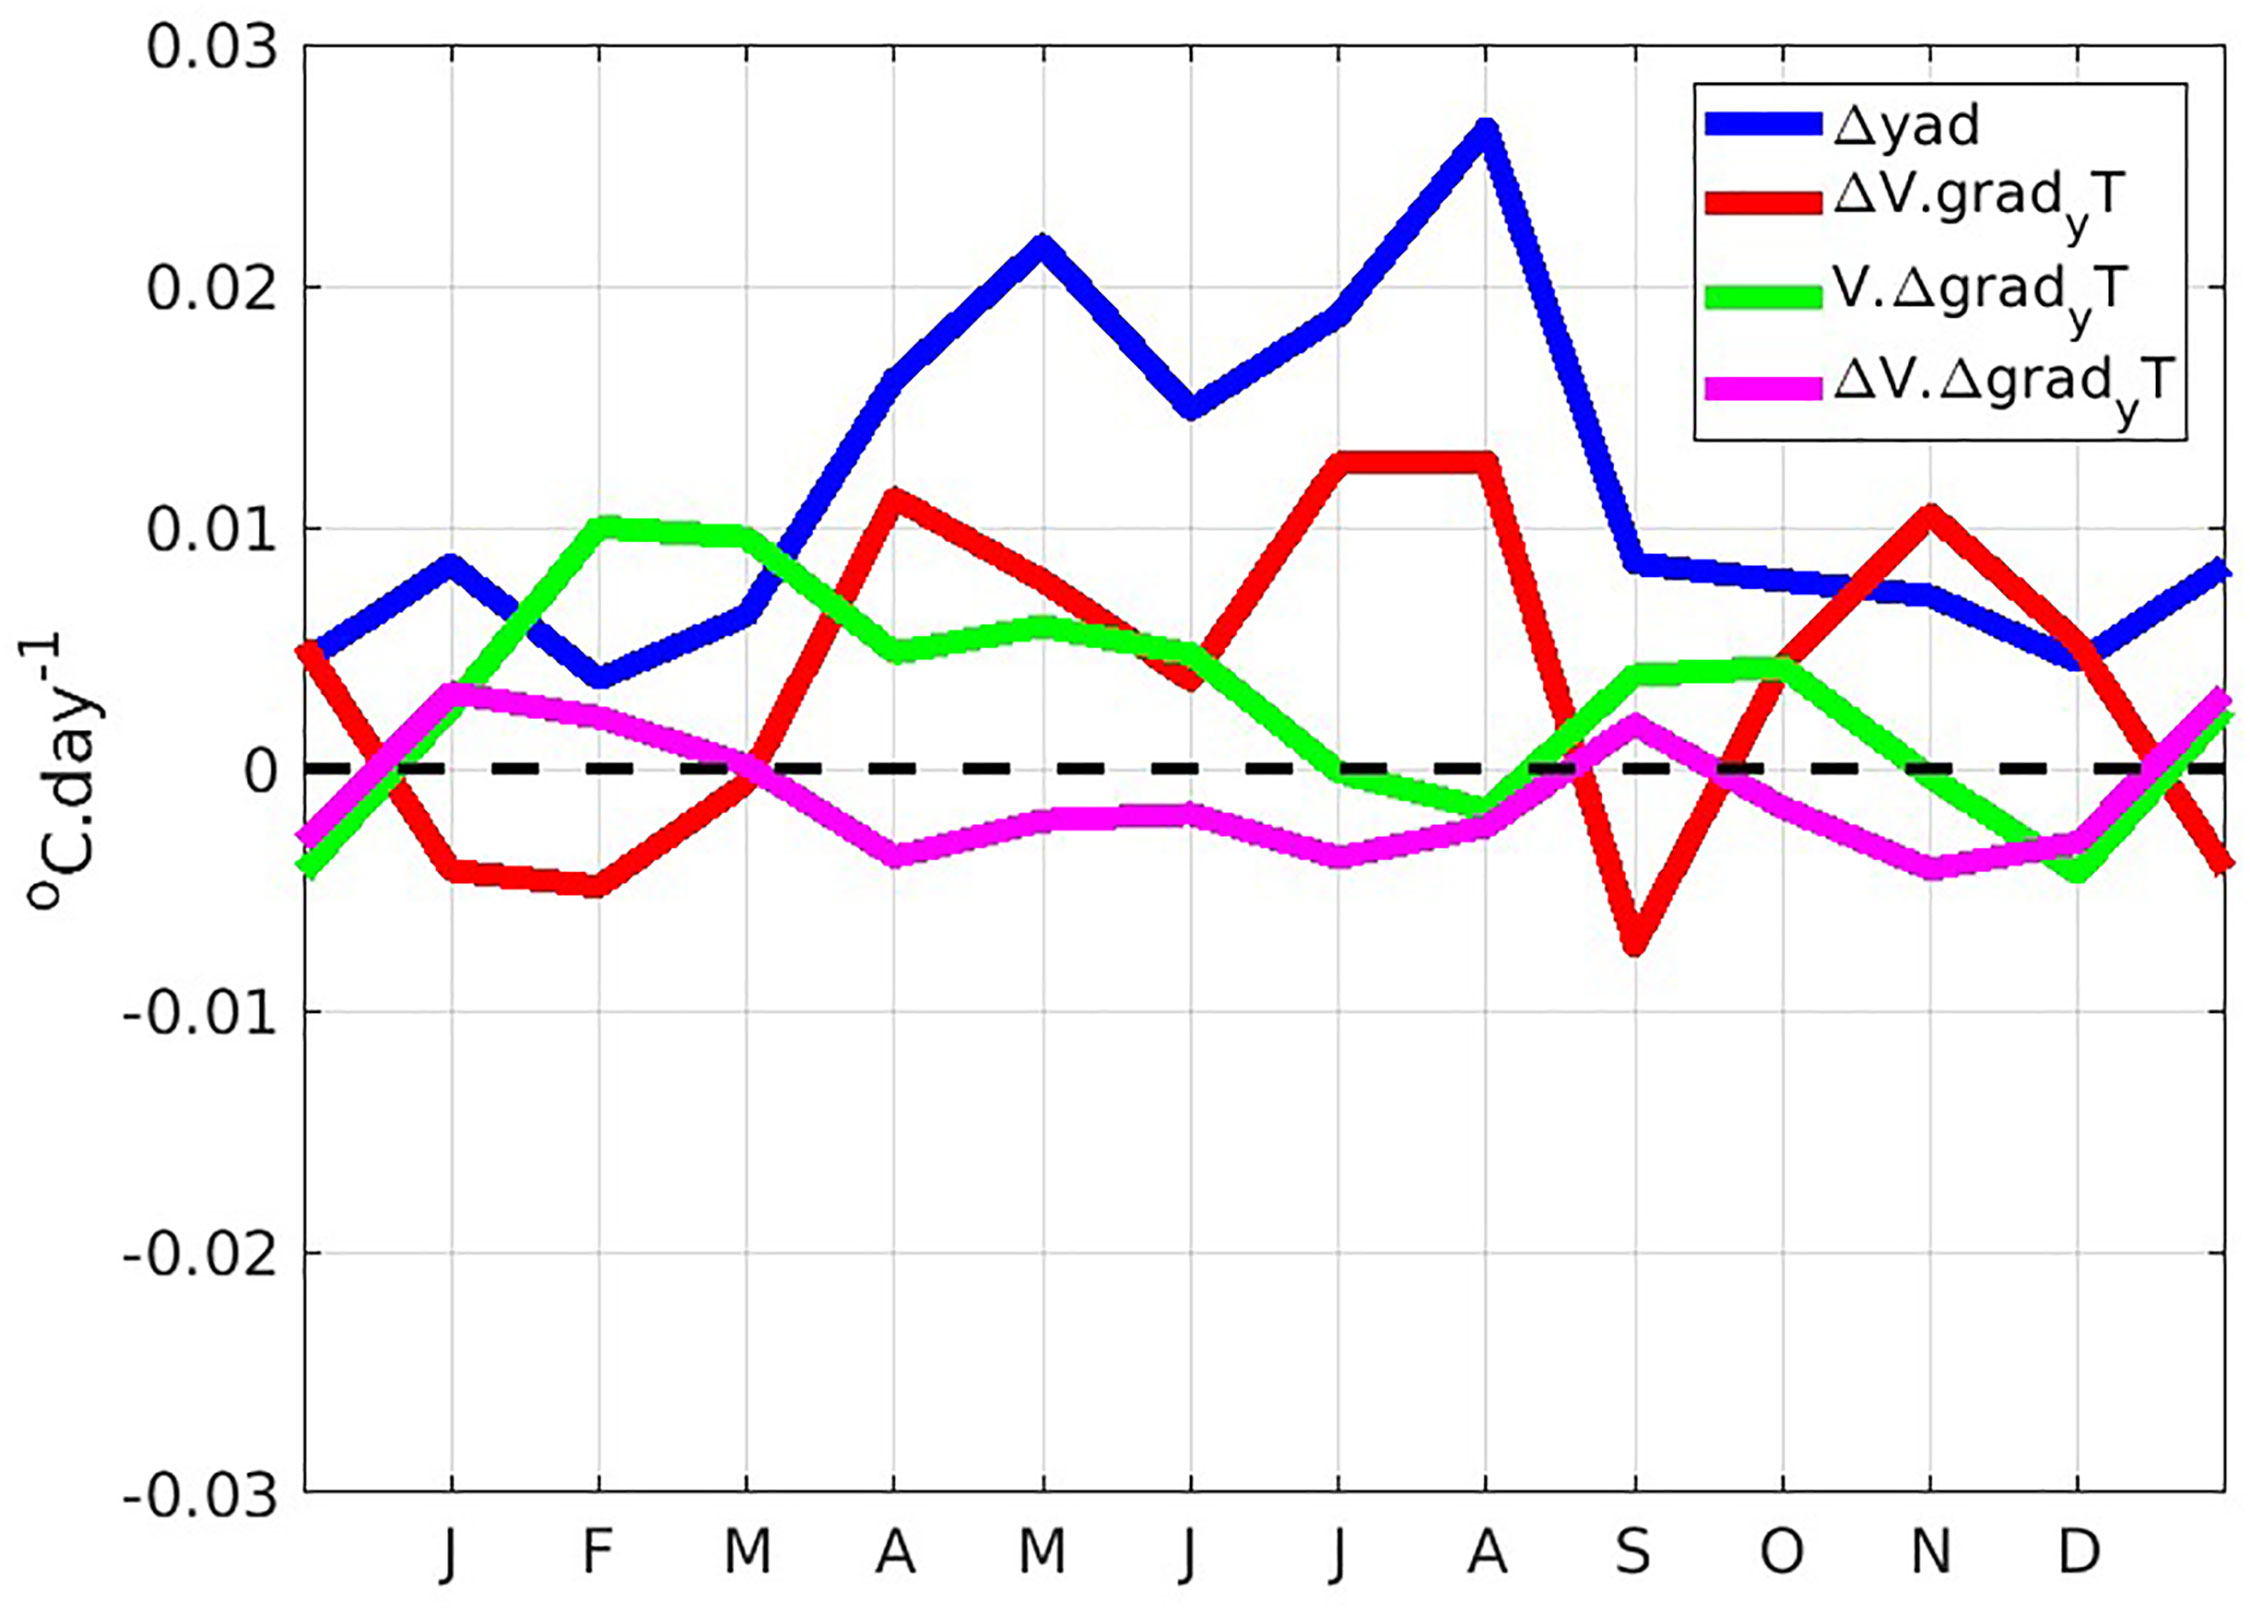
Figure 8 REF-noRIV seasonal variations of the meridional advection (blue), decomposed into components due to seasonal variations of the meridional current (red), of the meridional temperature gradient (green), or of both (pink), for the period 2010-2017.
The computation of the correlation coefficients shows that the changes in the meridional advection are strongly linked to the variation of the meridional current. Indeed, meridional current is the main driver of the variation in meridional advection (correlation r=0.61 between
the two-time series), with a weak contribution from the meridional temperature gradient (r=-0.10). Thus, the Niger River contributes to the advection of warm waters towards the coast by reinforcing the meridional current.
Regarding the changes in the meridional current, they are related to the variations of the two components (Figure 9). Between January and March and September to October, the geostrophic component dominates the changes in the meridian current while the Ekman component takes over from March to August and October to December.
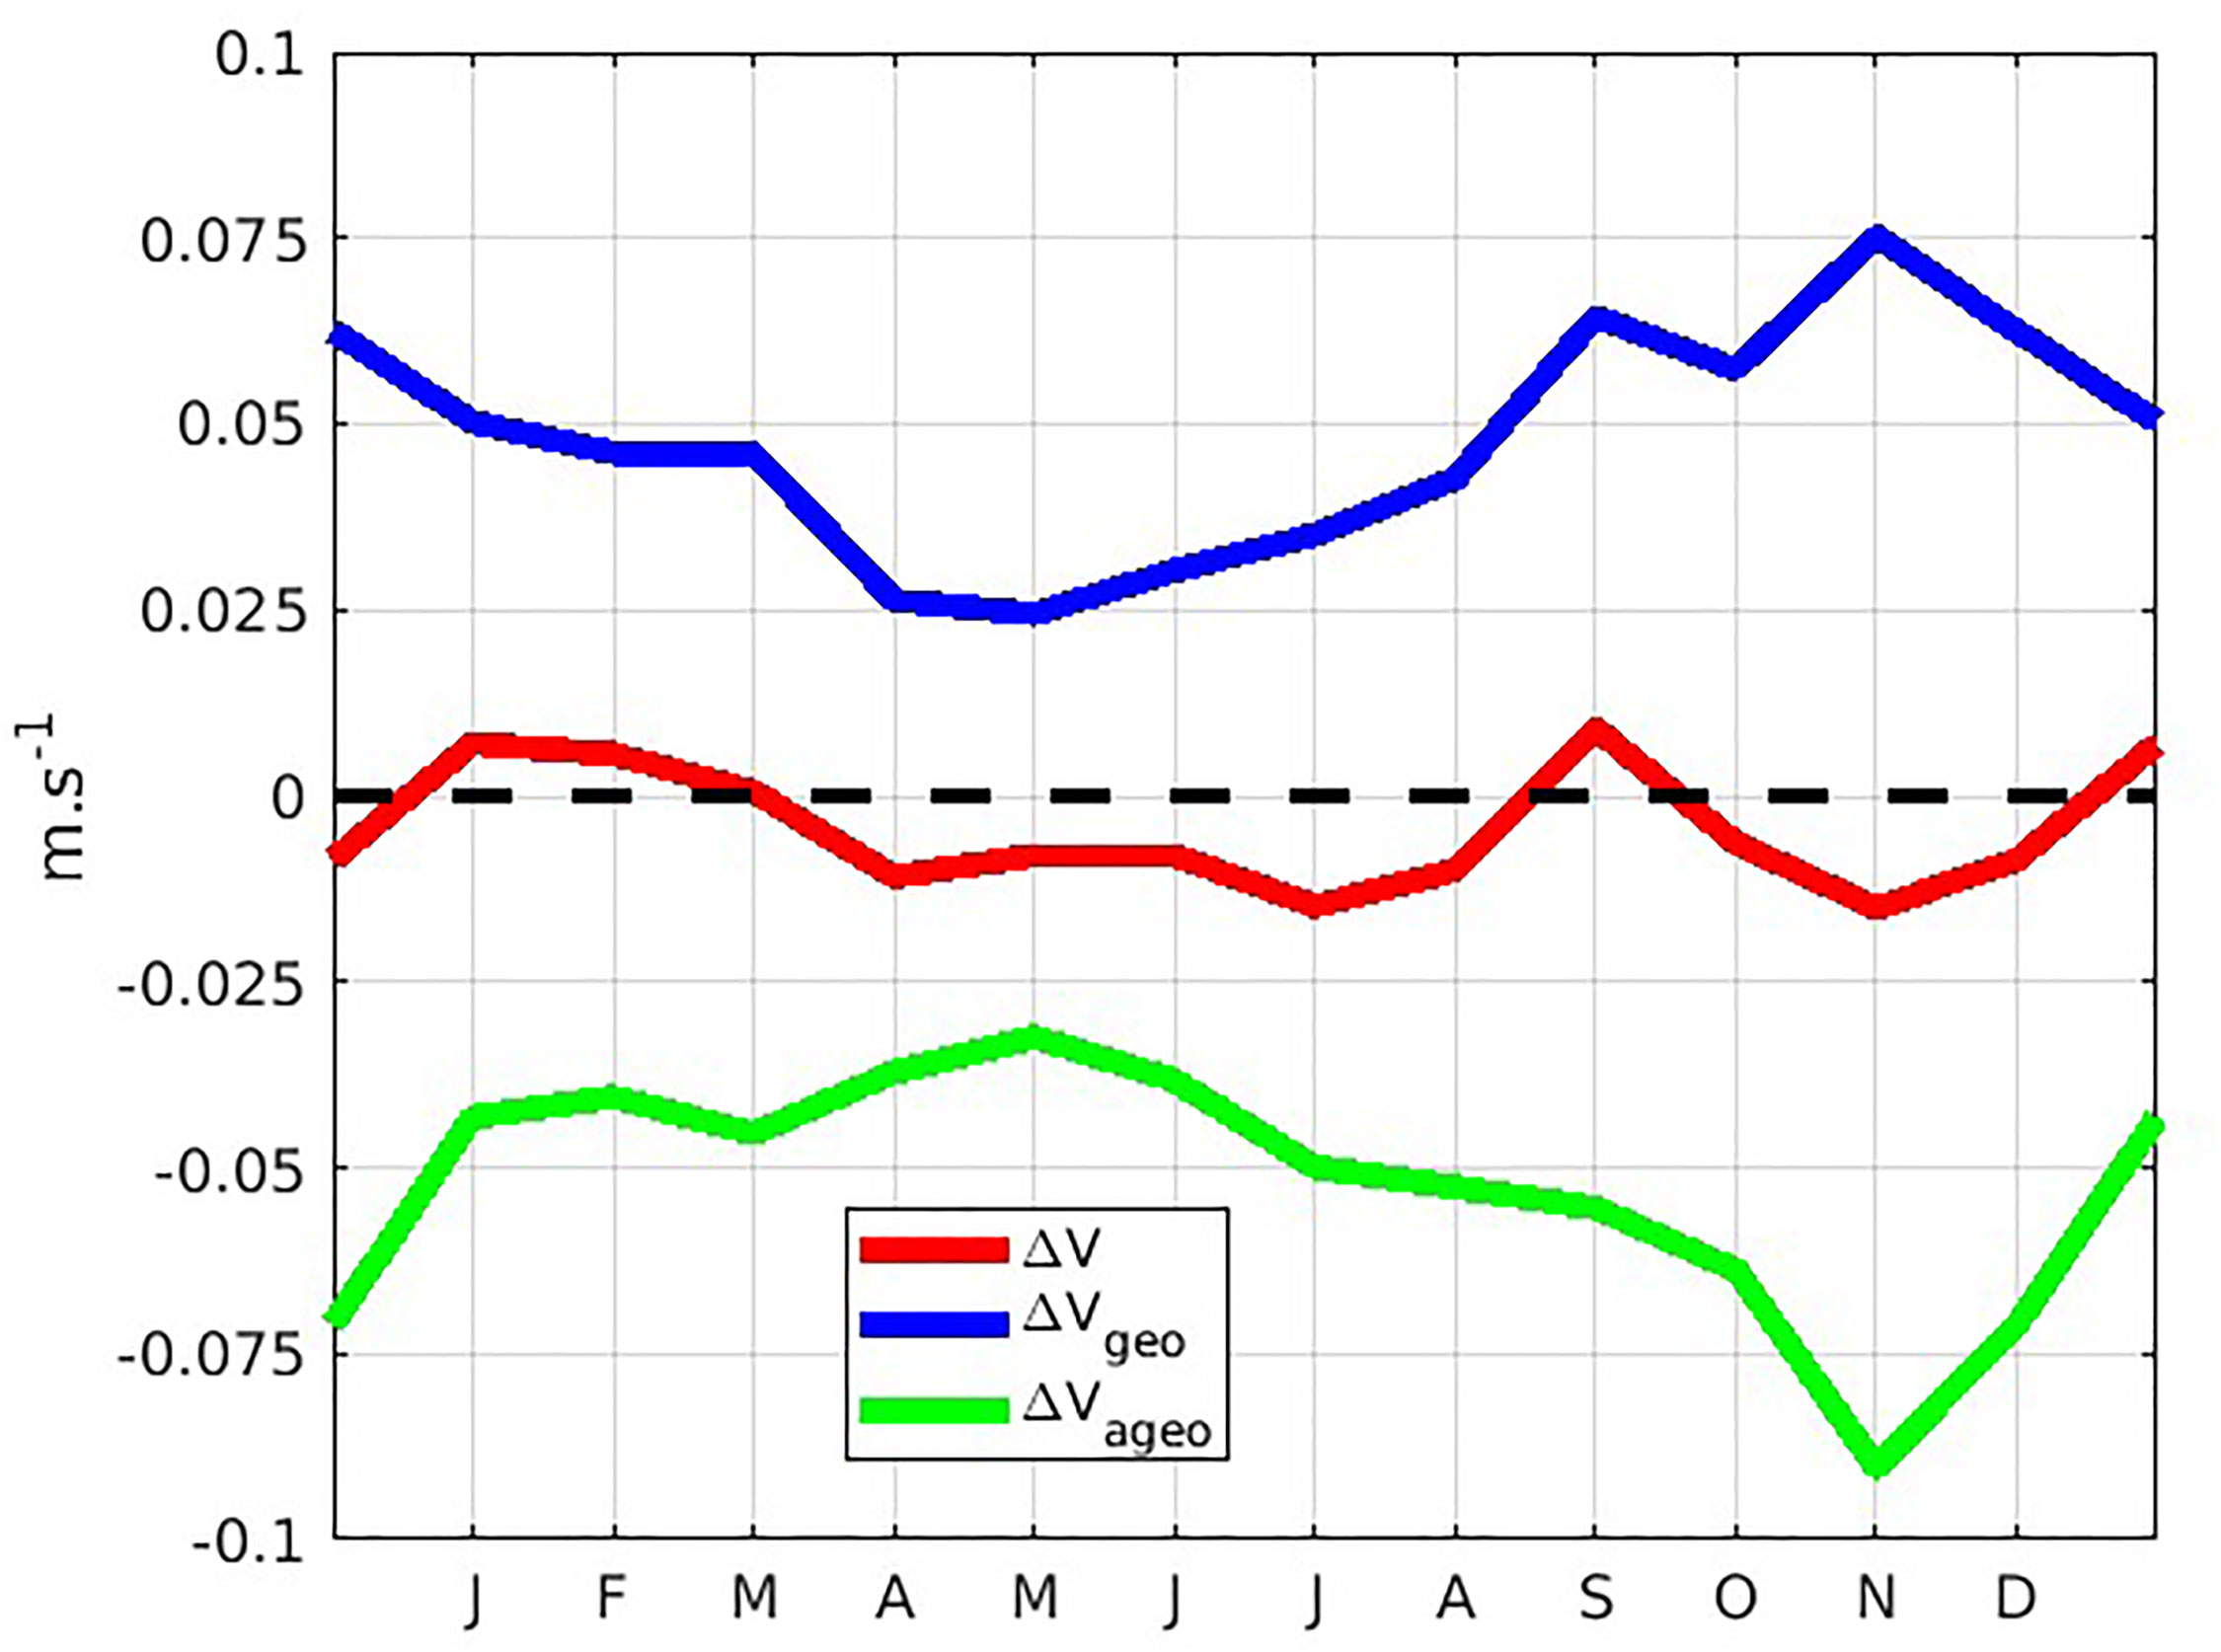
Figure 9 REF-noRIV seasonal variations of the meridional current (red), decomposed into its geostrophic (blue) and Ekman (green) components, for the period 2010-2017.
4 Discussion and conclusion
We analysed the mechanisms explaining warming effect induced by Niger River in Northern Gulf of Guinea. As the temperature of the riverine waters is not taken into account in the model, only dynamical processes explaining this warming are considered. In terms of periodicity and spatial distribution, the model is in line with most of the products and observations used. The differences in salinity observed between the SMAP product and the model (Figures 2C, D) are due to the difficulty of the satellite to reproduce salinity gradients near the coast (Dossa et al., 2021). The data at the coast were calculated by extrapolating measurements made by the satellite further offshore; this explains the difficulty of the satellite in accounting for the desalination caused by coastal rivers near the coast.
A similar explanation applies to observations from NOAA’s drifting buoys, which are located further offshore than at the coast (Figures 2G, H). The analysis of the heat balance terms showed that vertical diffusion is the main process explaining the warming effect induced by the Niger River. The Niger River freshwater plume creates a strong vertical stratification of the water column, which prevents vertical shearing of the horizontal currents at the bottom of the mixed layer. The stratification caused by the Niger River plume acts as a barrier, preventing the upwelling of cold and nutrient-rich waters. The reduction in upwelling intensity has a net warming effect on surface, which is more pronounced in the boreal summer.
Another unexpected result is the vertical diffusion as the main driver of the cooling of coastal waters in the northern Gulf of Guinea. Indeed, in the classical theory, the wind-induced divergence of the surface waters is balanced by the upward vertical velocities. That is the case for most of the main upwelling systems, especially on the eastern boundary. In the northern Gulf of Guinea, vertical advection has a relatively small contribution compared to vertical diffusion in each simulation (Figures 5E, F). This confirms the importance of vertical diffusion for mixed layer temperature/salinity variations in the Gulf of Guinea (Jouanno et al., 2011; Da-Allada et al., 2014). In addition, the investigation of the causes of the changes in the meridional current showed a change in both components, especially the Ekman component. As the model is forced, the wind forcing is the same in both simulations. We expected the Ekman component to be identical in REF and noRIV, and thus to have a zero difference between them, which is not the observed case (Figure 9). This difference could be due to the effects of surface density fronts which modify the classical Ekman response to wind forcing. Indeed, In the classic Ekman theory, the fluid is homogenous and the wind stress induces an ageostrophic shear those accounts for the total surface shear. However, in frontal regions, the shear that balances the wind stress will have a geostrophic component and only a portion of the wind stress induces the ageostrophic surface shear and Ekman spiral. The wind stress should therefore be corrected by the stress associated with the pressure gradient-induced geostrophic shear. Cronin and Tomoki. (2006) have shown that these frontal effects cannot be neglected in tropical regions.
Data availability statement
The raw data supporting the conclusions of this article will be made available by the authors on demand, without undue reservation.
Author contributions
GA conceptualized the study, GDAT produced the figures, did analysis and wrote the manuscript under supervision of GA, SD and CD. JJ performed the model experiments and GM ran simulations. All authors contributed to the article and approved the submitted version.
Funding
This work was supported by the TRIATLAS project, which has received funding from the European Union’s Horizon 2020 research and innovation program under grant agreement 817578.
Acknowledgments
It also contributes to the IRD JEAI IVOARE-UP and JEAI SAFUME projects. Supercomputing facilities were provided by the GENCI project GEN7298.
Conflict of interest
The authors declare that the research was conducted in the absence of any commercial or financial relationships that could be construed as a potential conflict of interest.
Publisher’s note
All claims expressed in this article are solely those of the authors and do not necessarily represent those of their affiliated organizations, or those of the publisher, the editors and the reviewers. Any product that may be evaluated in this article, or claim that may be made by its manufacturer, is not guaranteed or endorsed by the publisher.
References
Ali K. (2009). Relation entre les variations de la température de la surface de la mer et des précipitations le long de la bande côtière du nord du golfe de guinée (Abidjan, Côte d’Ivoire: Université de Cocody (LAPA).
Alory G., Da-Allada C. Y., Djakouré S., Dadou I., Jouanno J., Loemba D. P. (2021). Coastal upwelling limitation by onshore geostrophic flow in the gulf of Guinea around the Niger river plume. Front. Mar. Sci. 7. doi: 10.3389/fmars.2020.607216
Bourlès B., Araujo M., McPhaden M. J., Brandt P., Foltz G. R., Lumpkin R., et al. (2019). PIRATA: a sustained observing system for tropical Atlantic climate research and forecasting. Earth Space Sci. 6, 577–616. doi: 10.1029/2018EA000428
Cronin M., Tomoki T. (2006). Steady staye ocean response to wind forcing in extratropical frontal regions. Sci. Rep. 6, 288842. doi: 10.1038/srep28842
Da-Allada C. Y., Alory G., du Penhoat Y., Kestenare E., Durand F., Hounkonnou N. M. (2013). Seasonal mixed-layer salinity balance in the Tropical Atlantic Ocean: Mean sate and seasonal cycle. J. Geophys. Res. Oceans 118, 332–345. doi: 10.029/2012JC008357
Da-Allada C. Y., Agada J., Hounkonnou M., Jouanno J., Alory G. (2021). Causes of the northern gulf of Guinea cold event in 2012. J. Geophysical Research: Oceans 126, e2021JC017627. doi: 10.1029/2021JC017627
Da-Allada C. Y., Du Penhoat Y., Jouanno J., Alory G., Hounkonnou N. M. (2014). Modeled mixed-layer salinity balance in the gulf of Guinea: seasonal and interannual variability. Ocean Dyn. 64 (12), 1783–1802. doi: 10.1007/s10236-014-0775-9
Dai A., Trenberth K. (2002). Estimates of freshwater discharge from continents: latitudinal and seasonal variations. J. Hydrometeorol. 3, 660–687. doi: 10.1175/1525-7541(2002)003,0660:EOFDFC.2.0.CO;2
De Boyer Montégut C., Madec G., Fischer S., Lazar A., Iudicone D. (2004). Mixed layer depth over the global ocean: an examination of profile data and a profile-based climatology. J. Geophys. Res. 109, C12003. doi: 10.1029/2004JC002378
Djakouré S., Penven P., Bourlès B., Koné V., Veitch J. (2017). Respective roles of the Guinea current and local winds on the coastal upwelling in the northern gulf of Guinea. J. Phys. Oceanogr. 47, 1367–1387. doi: 10.1175/JPO-D-16-0126.1
Djakouré S., Penven P., Bourlès B., Veitch J., Koné V. (2014). Coastally trapped eddies in the north of the gulf of Guinea. J. Geophys. Res. Oceans 119, 6805–6819. doi: 10.1002/2014JC010243
Dossa A., Alory Gaël., da Silva A., Dahunsi A., Bertrand A. (2021). Global analysis of coastal gradients of Sea surface salinity. Remote Sensing. 13, 2507. doi: 10.3390/rs13132507
Ducet N., Le Traon P., Reverfdin G. (2000). Global high-resolution mapping of ocean circulation from TOPEX/Poseidon and ERS-1 and-2. J. Geophys. Res. 105, 19,477–19,498. doi: 10.1029/2000JC900063
Dussin R., Barnier B., Brodeau L., Molines J. M. (2016). The making of the drakkar forcing set DFS5. DRAKKAR/MyOcean report. Available at: https://www.drakkar-ocean.eu/publications/reports/report_DFS5v3_April2016.pdf.
Fong A., Geyer W. R. (2002). The alongshore transport of freshwater in a surface-trapped river plume. J. Phys. Oceanogr. 32, 957–972. doi: 10.1175/1520-0485(2002)032<0957:TATOFI>2.0.CO;2
Gaillard F., Diverres D., Jacquin S., Gouriou Y., Grelet J., Le Menn M., et al. (2015). Sea surface temperature and salinity from French research vessels, 2001–2013. Sci. Data 2, 1–19. doi: 10.1038/sdata.2015.54
Hickey B. M. S. L., Geier S., Kachel N., et MacFadyen A. (2005). A bi-directional river plume: the Columbia in summer. Cont. Shelf Res. 25, 1631–1656. doi: 10.1016/j.csr.2005.04.010
Jouanno J., Hernandez O., Sanchez-Gomezet E. (2017). Equatorial Atlantic inter-annual variability and its relation to dynamic processes. Earth Syst. Dyn. 8, 1061–1069. doi: 10.5194/esd-8-1061-2017
Jouanno J., Marin F., du Penhoat Y., Sheinbaum J., Molines J.-M. (2011). Seasonal heat balance in the upper 100 m of the equatorial Atlantic ocean. J. Geophys. Res. 116, C09003. doi: 10.1029/2010JC006912
Kanga D. K., Kouassi M. A., Trokourey A., Toualy E., N'Guessan B. K., Brehmer P., et al. (2021). Spatial and seasonal variability of mixed layer depth in the tropical Atlantic at 10°W using 40 years of observation data. Eur. J. Sci. Res. 158 (3), 207–217.
Koné V., Lett C., Penven P., Bourlès B., Djakouré S. (2017). A biophysical model of s. aurita early-life history in the northern gulf of Guinea. Prog. Oceanogr. 151, 83–96. doi: 10.1016/j.pocean.2016.10.00
Large G., Yeager S. (2009). The global climatology of an interannually varying air–sea flux data set. Clim. Dyn. 33, 341–364. doi: 10.1007/s00382-008-0441-3
Laurindo C., Mariano J., Lumpkin R. (2017). An improved near-surface velocity climatology for the global ocean from drifter observations. Deep Sea Res. Part I Oceanographic Res. Papers 124, 73–92. doi: 10.1016/j.dsr.2017.04.009
Le Traon P., Nadal F., Ducet N. (1998). An improved mapping method of multisatellite altimeter data. J. Atmos. Ocean. Technol. 15, 522–534. doi: 10.1175/1520-0426(1998)015<0522:AIMMOM>2.0.CO;2
Li Y., Wang F., Han W. (2013). Interannual sea surface salinity variations observed in the tropical north pacific ocean. Geophysical Res. Lett. 40, 2194–2199. doi: 10.1002/grl.50429
Locarnini M., Mishonov V., Baranova K., Boyer P., Zweng M., Garcia E., et al. (2018). World ocean atlas 2018, (Silver Spring, Maryland: National Centers for Environmental Information), Vol. 81. 52.
Madec G. (2016) NEMO ocean engine. Available at: https://www.nemo-ocean.eu/wp-content/uploads/NEMO_book.pdf.
Marchesiello P., Estrade P. (2010). Upwelling limitation by onshore geostrophic flow. J. Mar. Res. 68, 37–62. doi: 10.1357/002224010793079004
Meneghesso C., Seabra R., Broitman B., Wethey D., Burrows M., Chan B., et al. (2020). Remotely-sensed L4 SST underestimates the thermal fingerprint of coastal upwelling. Remore Sens. Environ. 237, 111588. doi: 10.1016/j.rse.2019.111588
N’Guessan B. K., Kouassi A. M., Trokourey A., Toualy E., Kanga D. K., Brehmer P. P. (2019). Eastern Tropical Atlantic mixed layer depth: assessment of methods from In situ profiles in the gulf of Guinea from coastal to high Sea. Thalassas: Int. J. Mar. Sci. 36, 20112. doi: 10.1007/s41208-019-00179-7
Sohou Z., Koné V., Da-Allada C. Y., Djakouré S., Bourlès B., Racape V., et al. (2020). Seasonal and inter-annual ONSET Sea surface temperature variability along the northern coast of the gulf of Guinea. Regional Stud. Mar. Sci. 35, 101129. doi: 10.1016/j.rsma.2020.101129
Tanguy M., de Coëtlogon G., Eymard L. (2021). Sea Surface temperature impact on diurnal cycle and seasonal evolution of the Guinea coast rainfall in boreal spring and summer. Eur. J. Res. 158 (3), 207–217. Available at: http://www.europeanjournalofscientificresearch.com.
Wade M., Caniaux G., du Penhoat Y. (2011). Variability of the mixed layer heat budget in the eastern equatorial Atlantic during 2005-2007 as inferred using argo floats. J. Geophysical Res. 116, C08006. doi: 10.1029/2010JC006683
Yago A. (2021). Modélisation biophysique de la dispersion et de la croissance des larves de sardinelles dans le golfe de guinée. ecosystèmes (Français: Sorbonne Université ; Université Félix Houphouët Boigny (Abidjan, Côte d’Ivoire).
Keywords: coastal upwelling, Niger river plume, Gulf of Guinea, heat balance, tropical Atlantic
Citation: Topé GDA, Alory G, Djakouré S, Da-Allada CY, Jouanno J and Morvan G (2023) How does the Niger river warm coastal waters in the northern Gulf of Guinea? Front. Mar. Sci. 10:1187202. doi: 10.3389/fmars.2023.1187202
Received: 15 March 2023; Accepted: 03 May 2023;
Published: 19 May 2023.
Edited by:
Francisco Machín, University of Las Palmas de Gran Canaria, SpainReviewed by:
Ebenezer Nyadjro, Mississippi State University, United StatesPeng Bai, Zhejiang Ocean University, China
Copyright © 2023 Topé, Alory, Djakouré, Da-Allada, Jouanno and Morvan. This is an open-access article distributed under the terms of the Creative Commons Attribution License (CC BY). The use, distribution or reproduction in other forums is permitted, provided the original author(s) and the copyright owner(s) are credited and that the original publication in this journal is cited, in accordance with accepted academic practice. No use, distribution or reproduction is permitted which does not comply with these terms.
*Correspondence: G. D. A. Topé, dG9wZWd1eTk3QHlhaG9vLmNvbQ==