 Haihang Zeng
 Mingming Jia1,3*
 Rong Zhang
 Zongming Wang
 Dehua Mao
 Chunying Ren
 Chuanpeng Zhao
- 1Key Laboratory of Wetland Ecology and Environment, Northeast Institute of Geography and Agroecology, Chinese Academy of Sciences, Changchun, China
- 2College of Resources and Environment, University of Chinese Academy of Sciences, Beijing, China
- 3International Research Center of Big Data for Sustainable Development Goals, Beijing, China
Mangrove forests are one of the most biologically diverse and productive ecosystems on Earth. They are important breeding and nursing grounds for amphibians, invertebrates, birds, fish, etc. Light pollution may cause serious degradation of biodiversity in the ecosystem. A report of the long-term holistic views of light pollution changes is essential for sustainable management of mangrove ecosystems. However, to date, such studies have rarely been carried out. This study aimed to monitor the long-term light pollution changes of China’s mangrove forests. To achieve this goal, we used time-series nighttime light (NTL) data to build continuous light pollution data. NTL maps made with DMSP-OLS (DNL) or NPP-VIIRS (VNL) are widely utilized in research on human activity. However, DMSP and VIIRS images are different in spatial resolution, radiation resolution, and data saturation. Thus, this study innovatively set an optimal threshold for generating consistent light pollution data in mangrove areas from 1992-2020. The results showed that: (1) the proportion of light-polluted mangrove forests in China increased from 12% in 1992 to 52% in 2020; (2) the largest net increase occurred in Guangxi with an area of 4,086 ha, followed by Guangdong (3,365 ha) and Hainan (2,944 ha); (3) Zhejiang had the largest proportion of net growth (from 0% in 1992 to 99% in 2020), followed by Hainan (66%) and Fujian (59%). Mangrove forests have been protected and restored for decades in China; this study indicates that the establishment of nature reserves is effective in preventing the light pollution of mangroves and provides the first long-term multi-temporal dataset of light pollution in China’s mangrove forests. This comprehensive information could support related studies and facilitate the development of applicable coastal management strategies in China.
1 Introduction
Mangrove forests are trees and shrubs that grow along tropical and subtropical coastlines, mudflats, and river banks (Wang et al., 2019). These forests are ecologically and socioeconomically important due to their crucial roles in coastal ecosystem protection (Jia et al., 2018; Zhang et al., 2022). Moreover, mangrove forests sequester large quantities of organic carbon (Bouillon et al., 2008), protect shoreline ecosystems from erosion, and are habitats for many terrestrial and aquatic species (Bernardino et al., 2022). Therefore, mangrove forests play an essential role in guaranteeing a sustainable future for all. Though mangrove forests have shifted from being one of the fastest diminishing ecosystems to one of the most protected, they still face intensive threats from surrounding land covers, such as aquaculture ponds and built-up lands (Valiela et al., 2001; Jia et al., 2021). A report about the long-term holistic views of threats that mangrove forests face could support sustainable management of the ecosystem.
To our knowledge, most existing studies focused on mapping and analyzing mangrove extents at world, national or regional scales (Jia et al., 2023, 2021; 2018; Chen et al., 2017; Yang et al., 2022; Zhang et al., 2022). For example, Jia et al. indicated China’s mangrove forests declined from 48,801 ha to 18,702 ha between 1973 and 2000, then partially recovered to 28,010 ha in 2020 (Jia et al., 2021). After achieving some success in mapping the horizontal extent of mangroves in the past three decades, the focus of mangrove studies has turned to the retrieval of 3D parameters, more specifically the estimation of height and biomass (Wang et al., 2019; Potapov et al., 2021). In addition, the vulnerability of mangrove ecosystems has become a recent concern of researchers (Wang et al., 2019). Because mangroves are in the marine-terrestrial confluence zone, they are under pressure from both environments and human activities (Valiela et al., 2001), such as natural disasters (Vizcaya-Martínez et al., 2022), sea level rise (Lovelock et al., 2015), agriculture and aquaculture expansion (Wang et al., 2023), and tourism and urban development (De et al., 2023), as well as changes in rainfall and exacerbated drought derived from urbanization (Huang et al., 2023). However, factors related to mangrove vulnerability are still not fully understood. For example, light pollution, which is related to ecosystem exposure, has not been studied (Hölker et al., 2010).
Light pollution can be defined as “the alteration of natural light levels in the night environment produced by the introduction of artificial light” (Falchi et al., 2011). Artificial light can alter species abundance or behavior due to changes in their circadian rhythms or due to their attraction to or repulsion from light (Levin et al., 2020). Artificial light at night is known to cause a plethora of environmental impacts from altering organism physiology to changing the structure of communities, such as effecting the flowering process and altering vegetation species composition and phenology (Bennie et al., 2018; Davies and Smyth, 2018; Viera-Pérez et al., 2019). The diversity of species affected continues to grow, including birds (La Sorte et al., 2017; Cabrera-Cruz et al., 2018), amphibians (Davies and Smyth, 2018), and invertebrates (Gorbunov and Falkowski, 2002; van Langevelde et al., 2011), as well as other common consumers. As important breeding and nursing grounds for amphibians, invertebrates, birds, fish, etc. (Craft, 2022), mangrove ecosystems could experience serious degradation of biodiversity from light pollution, further increasing the vulnerability of mangrove ecosystems. Recently, the environmental impacts of artificial light at night have been a rapidly growing field in global change science (Davies and Smyth, 2018). For example, several studies have used the mosaics of DMSP/OLS stable lights (as one of several variables) to globally map the human footprint in terrestrial areas (Sanderson et al., 2002; Venter et al., 2016; Levin et al., 2020) and to map the human impact in marine areas (Halpern et al., 2015). Therefore, it is necessary and feasible to investigate the light pollution of mangrove ecosystems caused by nighttime light.
Thus, this study aims at: (1) developing a consistent light pollution mapping method based on nighttime light (NTL) images and producing time-series light pollution maps of China’s coasts from 1992-2020; (2) overlapping time-series light pollution maps with mangrove distribution maps to obtain areal extents and spatial distributions of light-polluted mangrove forests in China; (3) statistically analyzing the temporal and spatial variations of light-polluted mangrove forests. The data set generated in this study will be freely distributed through the Google Earth Engine cloud platform so that it can be used for other studies of mangrove conservation and management in China as well as globally.
2 Materials and methods
2.1 Study area
The study area (Figure 1) encompassed six coastal provinces (Guangxi, Guangdong, Fujian, Zhejiang, Hainan, and Taiwan), and two Special Administrative Regions (Hong Kong and Macao). The geographical range of the study area is between 18°12′–28°25′N and 108°03′–122°00′E. Climates in this area vary from tropical monsoon to subtropical monsoon climate. Sanya (Hainan Province) is the southernmost city where mangrove forests grow in China. Fuding (Fujian Province) is the northern boundary of naturally grown mangroves in China, with the lowest monthly mean temperature of 8.4°C (Jia et al., 2018).
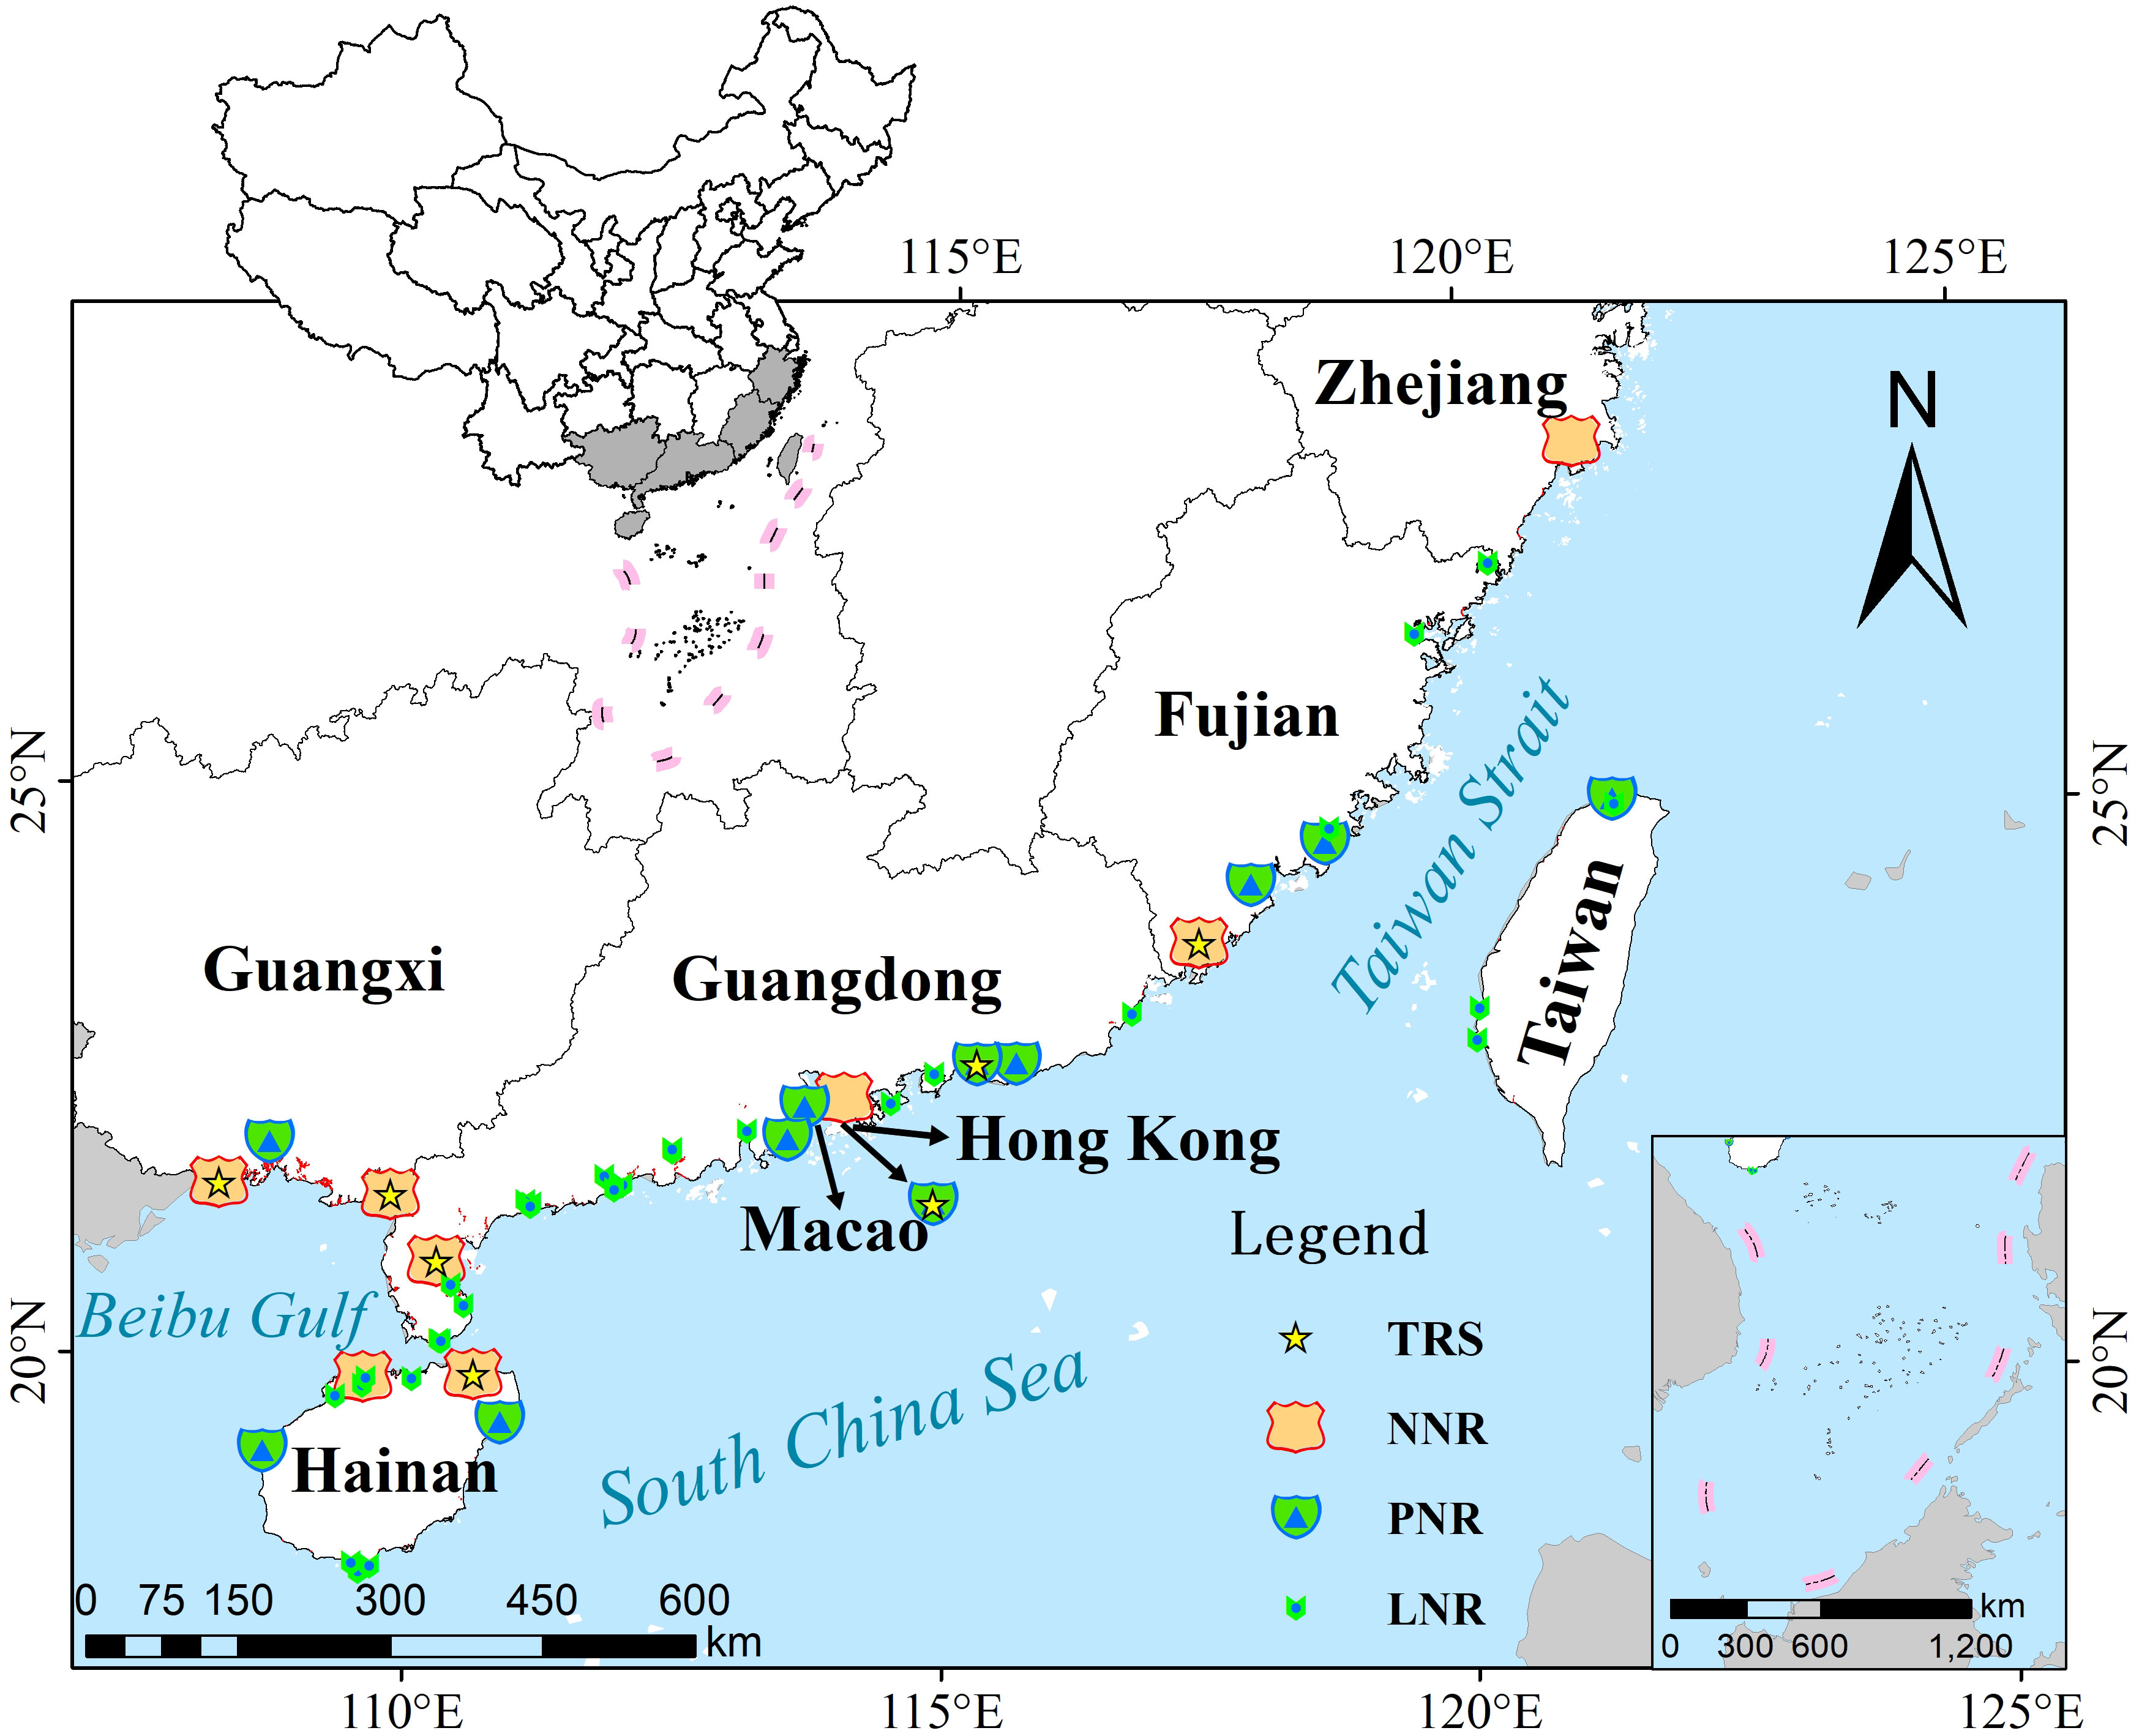
Figure 1 Location of the study area and distribution of mangrove reserves. (NNR, national nature reserve; PNR, provincial nature reserve; LNR, local nature reserve; TRS, The Ramsar Site).
Figure 1 also shows locations of the 48 mangrove reserves, including eight national nature reserves (NNRs, five of which are Ramsar sites), eleven provincial nature reserves (two of which are Ramsar sites), and twenty-nine local nature reserves. Approved by the State Council, China’s NNRs receive priority financial and political support. Detailed information about the mangrove NNRs’ establishment and development is listed in Table 1 (Jia et al., 2021).
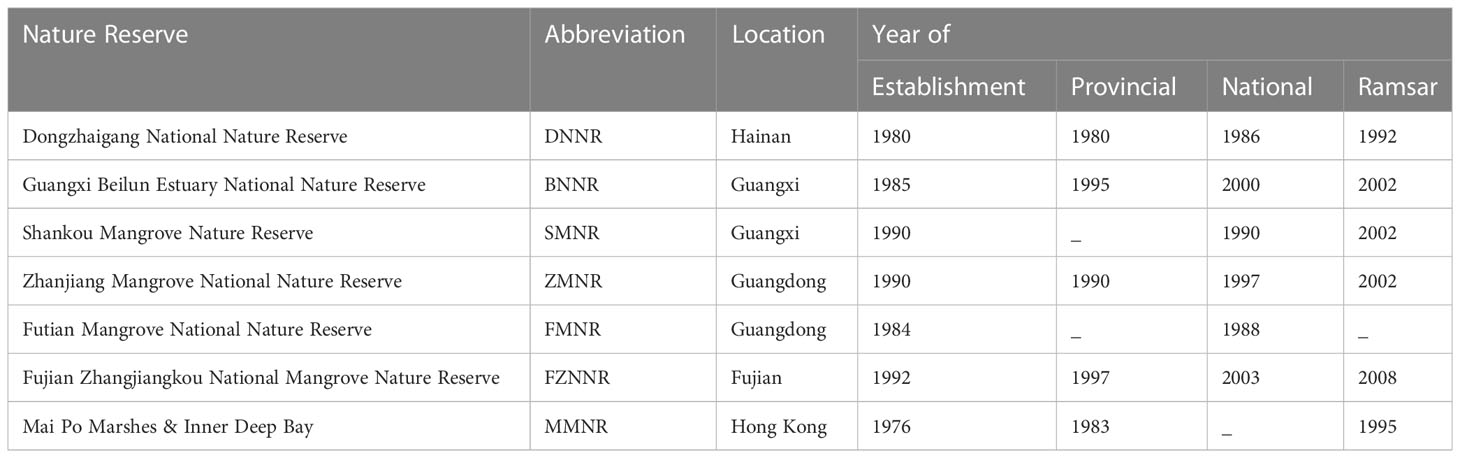
Table 1 The establishments and developments of mangrove NNRs in China.
2.2 Spatial distribution of China’s mangrove forests
Mangroves in China are mainly distributed in eight provinces along the southeast coast, among which Guangdong, Guangxi, and Hainan provinces rank in the top three, with the total mangrove area in China at 28,010 ha in 2020. Areal extents and spatial distributions of China mangrove forests were obtained from a data set called the Chinese Academy of Sciences Mangroves (CAS_Mangroves) (Jia et al., 2018; Jia et al., 2021). CAS_Mangroves provided the first multi-temporal data set of China’s mangrove forest distribution from 1973-2020. It was built based on Landsat imagery and object-based classification approach. Mapping accuracy of the years 1990, 2000, 2010, and 2020 was 87%, 89%, 92%, and 96%, respectively.
2.3 Nighttime light data
The Defense Meteorology Satellite Program (DMSP) was launched in 1962, and its satellites with Operational Linescan Systems (OLS) have been a source of valuable nighttime light (NTL) data of the Earth’s surface since then. Beginning in 1992, DMSP satellite-broadcast digital imagery was post-processed by the NOAA Earth Observation Group (EOG) into global annual averaged and background-removed NTL maps. With annual data stretching from 1992 to 2013, DMSP Nighttime Lights is the longest data series available for the nocturnal remote sensing of human activities (Elvidge, 1997; Nechaev et al., 2021). In 2011, the Suomi NPP (SNPP) satellite with the Visible Infrared Imaging Radiometer Suite (VIIRS) was launched. The VIIRS instrument is also capable of detecting dim light sources at night (Nechaev et al., 2021). Annual VIIRS maps of nighttime lights have been published from 2012 to the present (Elvidge et al., 2021). NTL maps made with DMSP (DNL) or VIIRS (VNL) are widely utilized in research on human activity, economy, and ecology (Levin et al., 2020).
The NTL data are generated by integrating DMSP-OLS and NPP-VIIRS, but there are significant differences in spatial resolution, radiation resolution, and data saturation which need further attention during the research process (Elvidge et al., 2021; Nechaev et al., 2021). Although researchers extended the DMSP Nighttime Lights Time Series beyond 2013, the local overpass times (Figure 2) changed significantly (Ghosh et al., 2021).
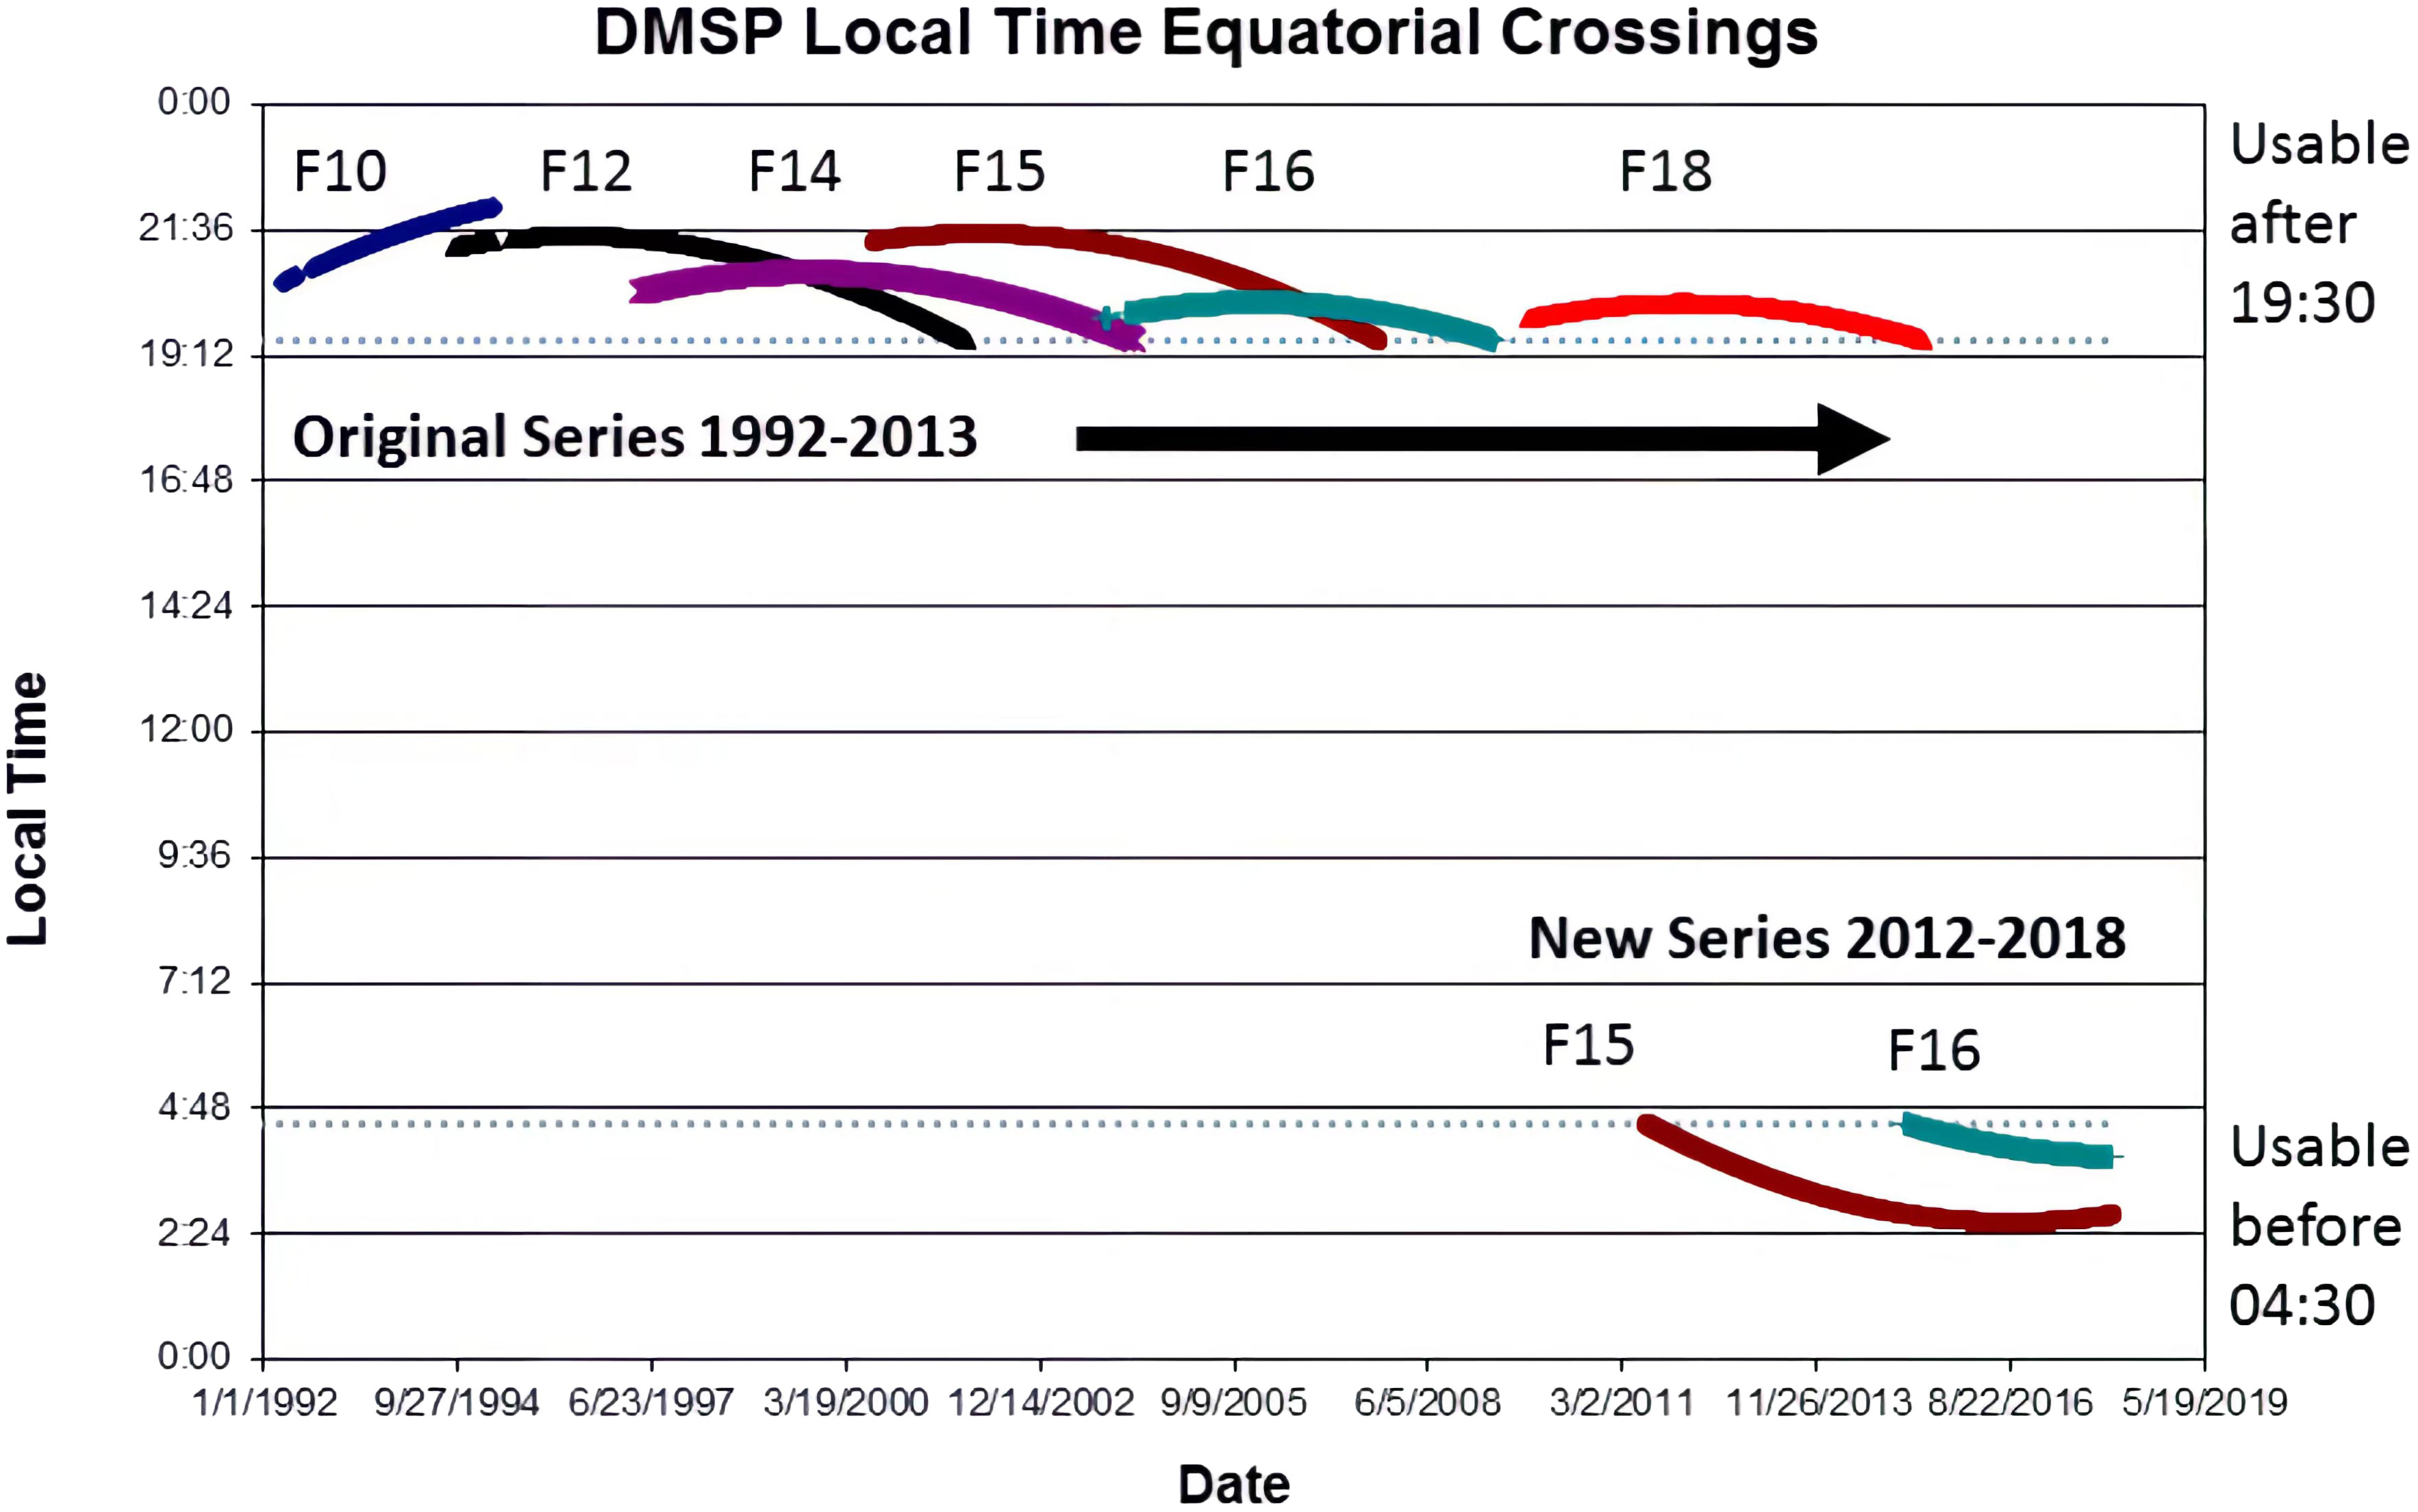
Figure 2 DMSP-OLS Nighttime overpass (local time): ~19:30 until 2013, ~4:30 after 2012.
Due to the lack of an on-board calibration mechanism, the DMSP Nighttime Light product does not report values as radiance, but in digital numbers (DN). To perform sensible comparison between images of different years, users are encouraged to perform intercalibration before carrying out time series analysis (Hsu et al., 2015). Therefore, we downloaded the intercalibrated stable lights average DN GeoTIFF files from the Earth Observation Group. Considering all these conditions, the NTL data used in this study are shown in Table 2.
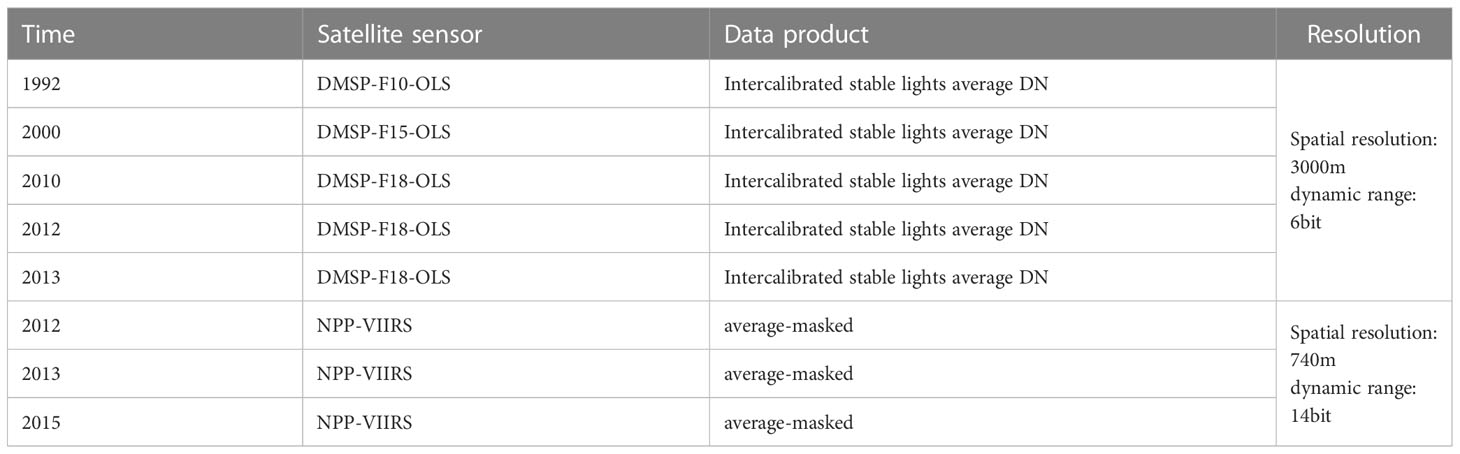
Table 2 Valuable nighttime light data.
There are numerous other space-born sensors for night-light mapping besides DMSP (DNL) and VIIRS (VNL), but other data are not suitable for the task of this study. For example, Jilin-1 (JL1-3B) (launched in 2017), JL-07/08 (launched in 2018), and LuoJia-01 (launched in 2018) have higher spatial resolution but lack historical images (Levin et al., 2020).
2.4 Threshold segmentation to build consistent light pollution data
In this study, we chose two types of data products, i.e., annual DMSP-OLS inter-calibrated stable lights average DN and NPP-VIIRS average-masked data. The inter-calibrated stable light data of DMSP-OLS provides relative brightness, but lacks quantitative indicators for night light (Nechaev et al., 2021). The NPP-VIIRS average-masked data can quantify the night light intensity (unit nm/cm2/Sr) and eliminate the interference of sunlight, moonlight, cloudy pixels, and unstable light sources (Elvidge et al., 2021). In this study, the light pollution area will be extracted by the threshold segmentation of night light. Therefore, we took NPP-VIIRS average-masked data as the standard and affirmed that the NPP-VIIRS data with ground light greater than 0 nm/cm2/Sr indicates that the location is polluted by artificial light to different degrees, and vice versa. Several attempts were made to cross-calibrate the NTL products from VIIRS and DMSP sensors (Li et al., 2013; Zheng et al., 2019; Tu et al., 2020). These studies show that there is no linear or geometric connection between the two types of sensors. Therefore, if there is a certain threshold that can distinguish whether a certain area is polluted by light through DMSP data, then the error of the classification result relative to the classification result of VIIRS can be considered as random. After the polluted and unpolluted areas are determined according to the VIIRS data, the DN values of DMSP data pixels in the two areas are statistically analyzed. The technical process is shown in Figure 3.
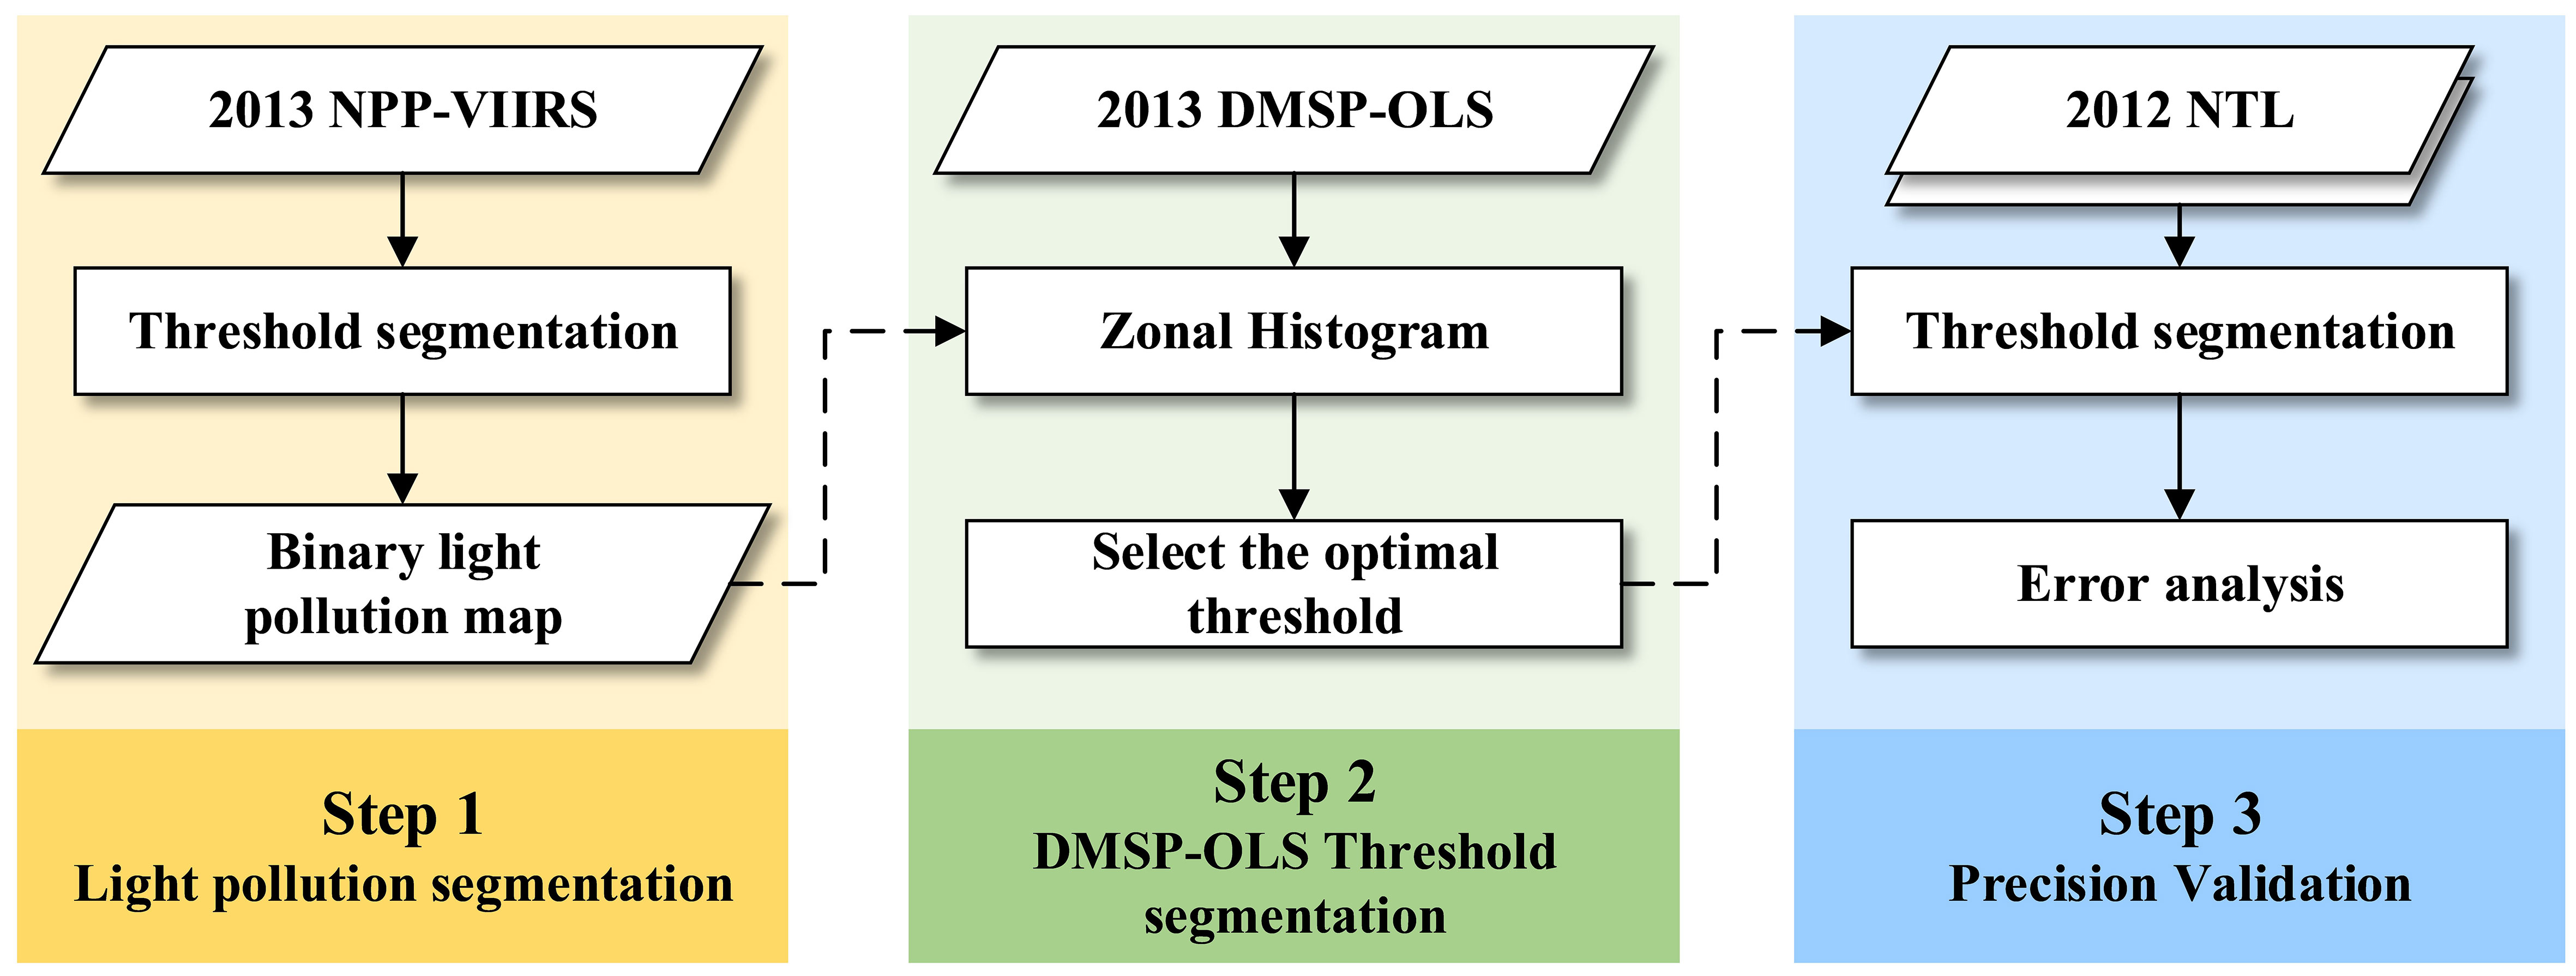
Figure 3 Determining DMSP-OLS light pollution threshold.
From April 2012 to December 2013, two generations of NTL satellites were in normal operation (Elvidge et al., 2021; Ghosh et al., 2021). Therefore, 2013 NTL data were selected to determine the segmentation threshold. First, the 2013 NPP-VIIRS was segmented with 0 as the threshold to draw the standard light pollution distribution map (Figure 3.Step 1). Then, according to the standard segmentation results, the zonal histogram statistics of DMSP-OLS data in 2013 were carried out to determine the optimal segmentation threshold of DMSP-OLS data (Figure 3.Step 2). As shown in Figure 4, the DN value range of DMSP data in the standard polluted area (0-63DN) overlaps with the unpolluted area (0-55DN), indicating that there were two types of errors at this time. The first type of error is called a type I error. This error occurs when we incorrectly decide to reject a true null hypothesis. The second type of error is called a type II error. This error occurs when we fail to reject a false null hypothesis (Alkarkhi, 2021). As shown in Figure 4, the two lines representing the proportion intersect at 8.65DN. In order to minimize the probability of two types of error in the hypothesis test, we set the segmentation threshold to 8.65 DN. Then, the optimal threshold was substituted into the NTL data in 2012 to verify the accuracy (Figure 3.Step 3). Finally, threshold segmentation method was used to process NTL data and get consistent light pollution maps.
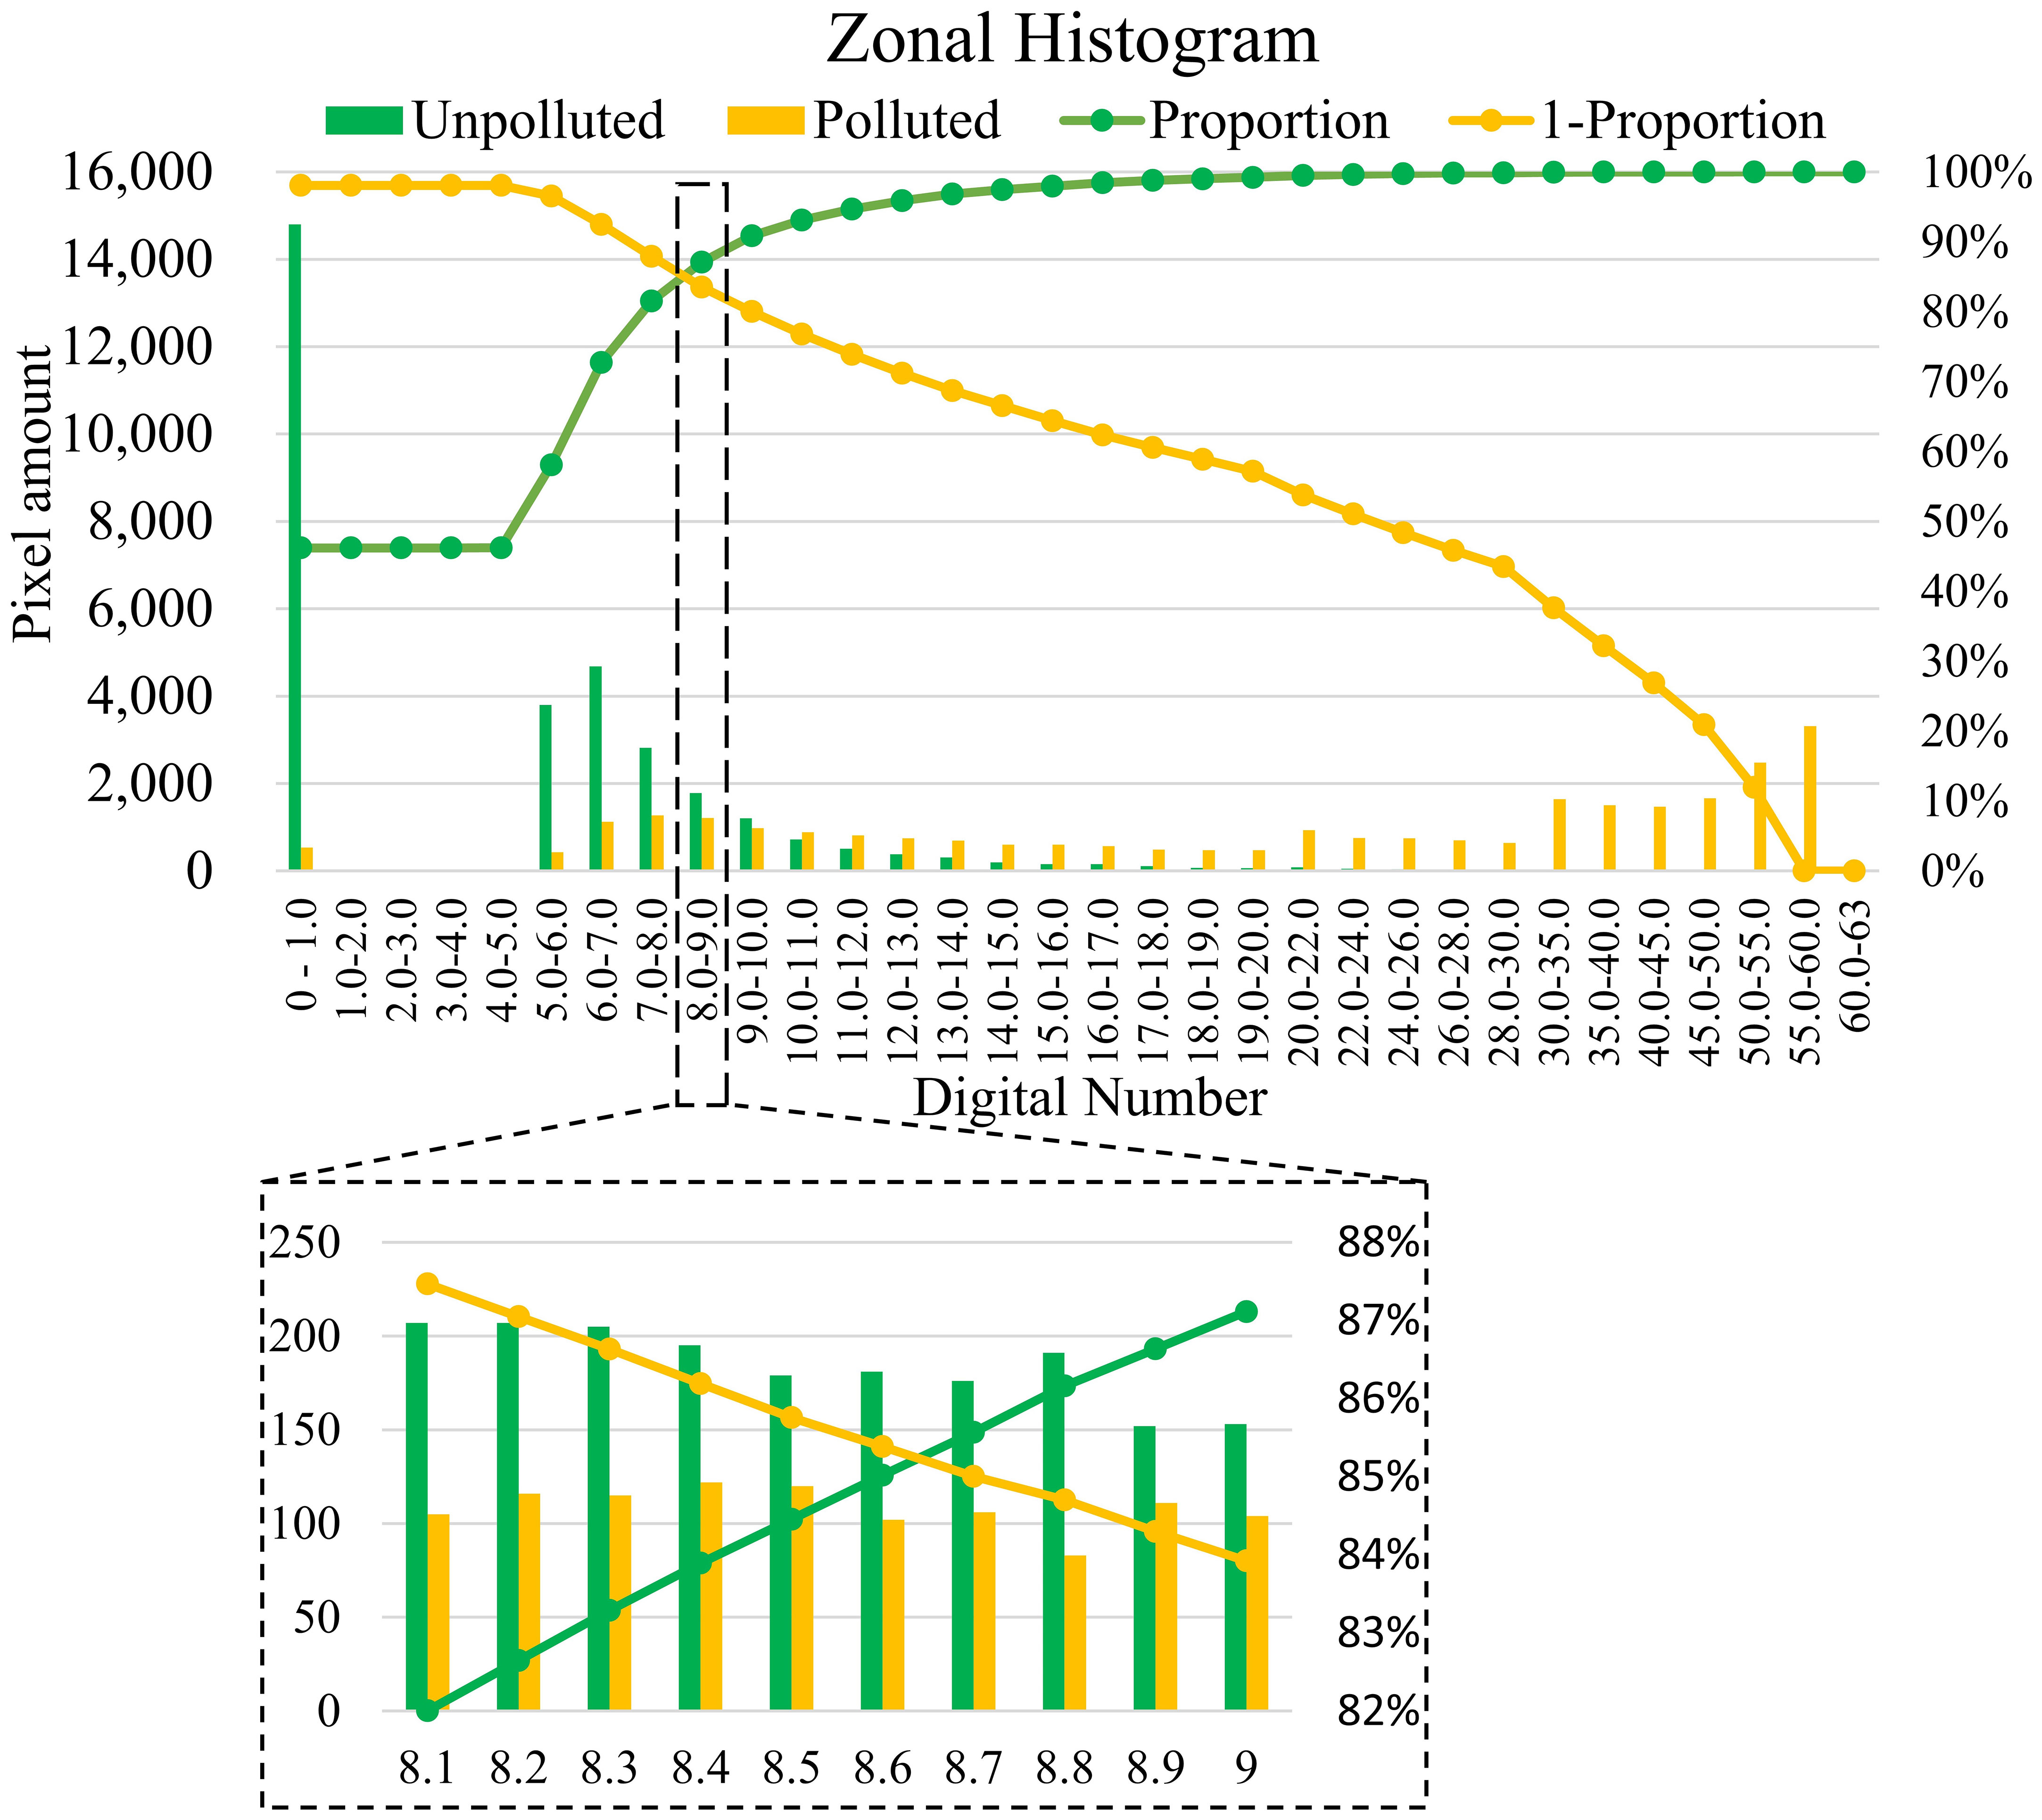
Figure 4 Zonal histogram statistics.
3 Results
3.1 Accuracy assessment
The optimal threshold was substituted into NTL data in 2012 for precision validation; the confusion matrix is shown in Table 3. The overall accuracy was 86%, the F1 scores of unpolluted areas and polluted areas were 0.88 and 0.84 respectively, and the Kappa was 0.72, which proved that the spatial distribution of the two groups of data is highly consistent. At the same time, considering that there were great differences in spatial resolution and radiation resolution between the two groups of data, such an accuracy level is acceptable, thus 8.65 DN is determined as the light pollution segmentation threshold of the DMSP-OLS series data.
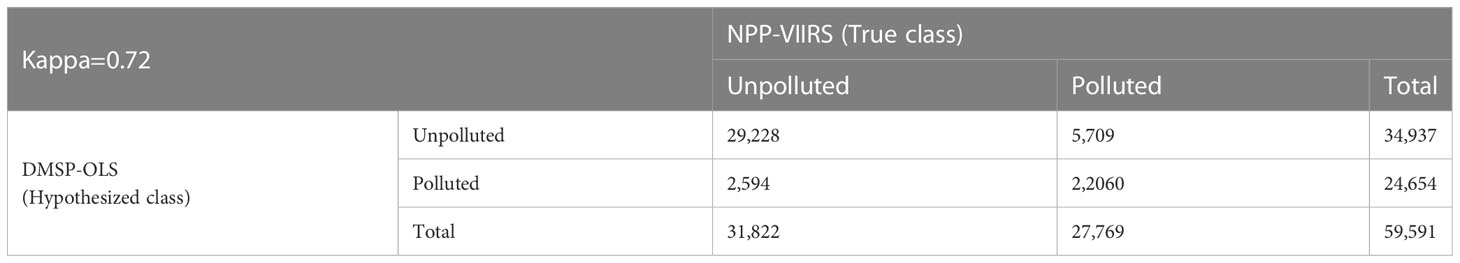
Table 3 2012 Nighttime light data confusion matrix.
3.2 Statistical analysis on light pollution of mangrove forests in China
The light pollution maps were overlayed with the CAS_Mangroves data set. We determined the time-series area statistics of mangrove forests affected by light pollution in China from 1992-2020 (Figure 5).

Figure 5 Statistics on light pollution of mangrove forests in China from 1992-2020.
As shown in Figure 5, the total area of mangrove forests in China shows a decreasing trend from 1992-2000 and then an increase from 2000-2020. The area affected by light pollution increased continually, from 2,450 ha in 1992 to 14,562 ha in 2020. The proportion of light-polluted mangrove forest in China also increased, from 12% in 1992 to 52% in 2020. Figure 6 shows the condition of light pollution in China’s mangrove forests in 2020.
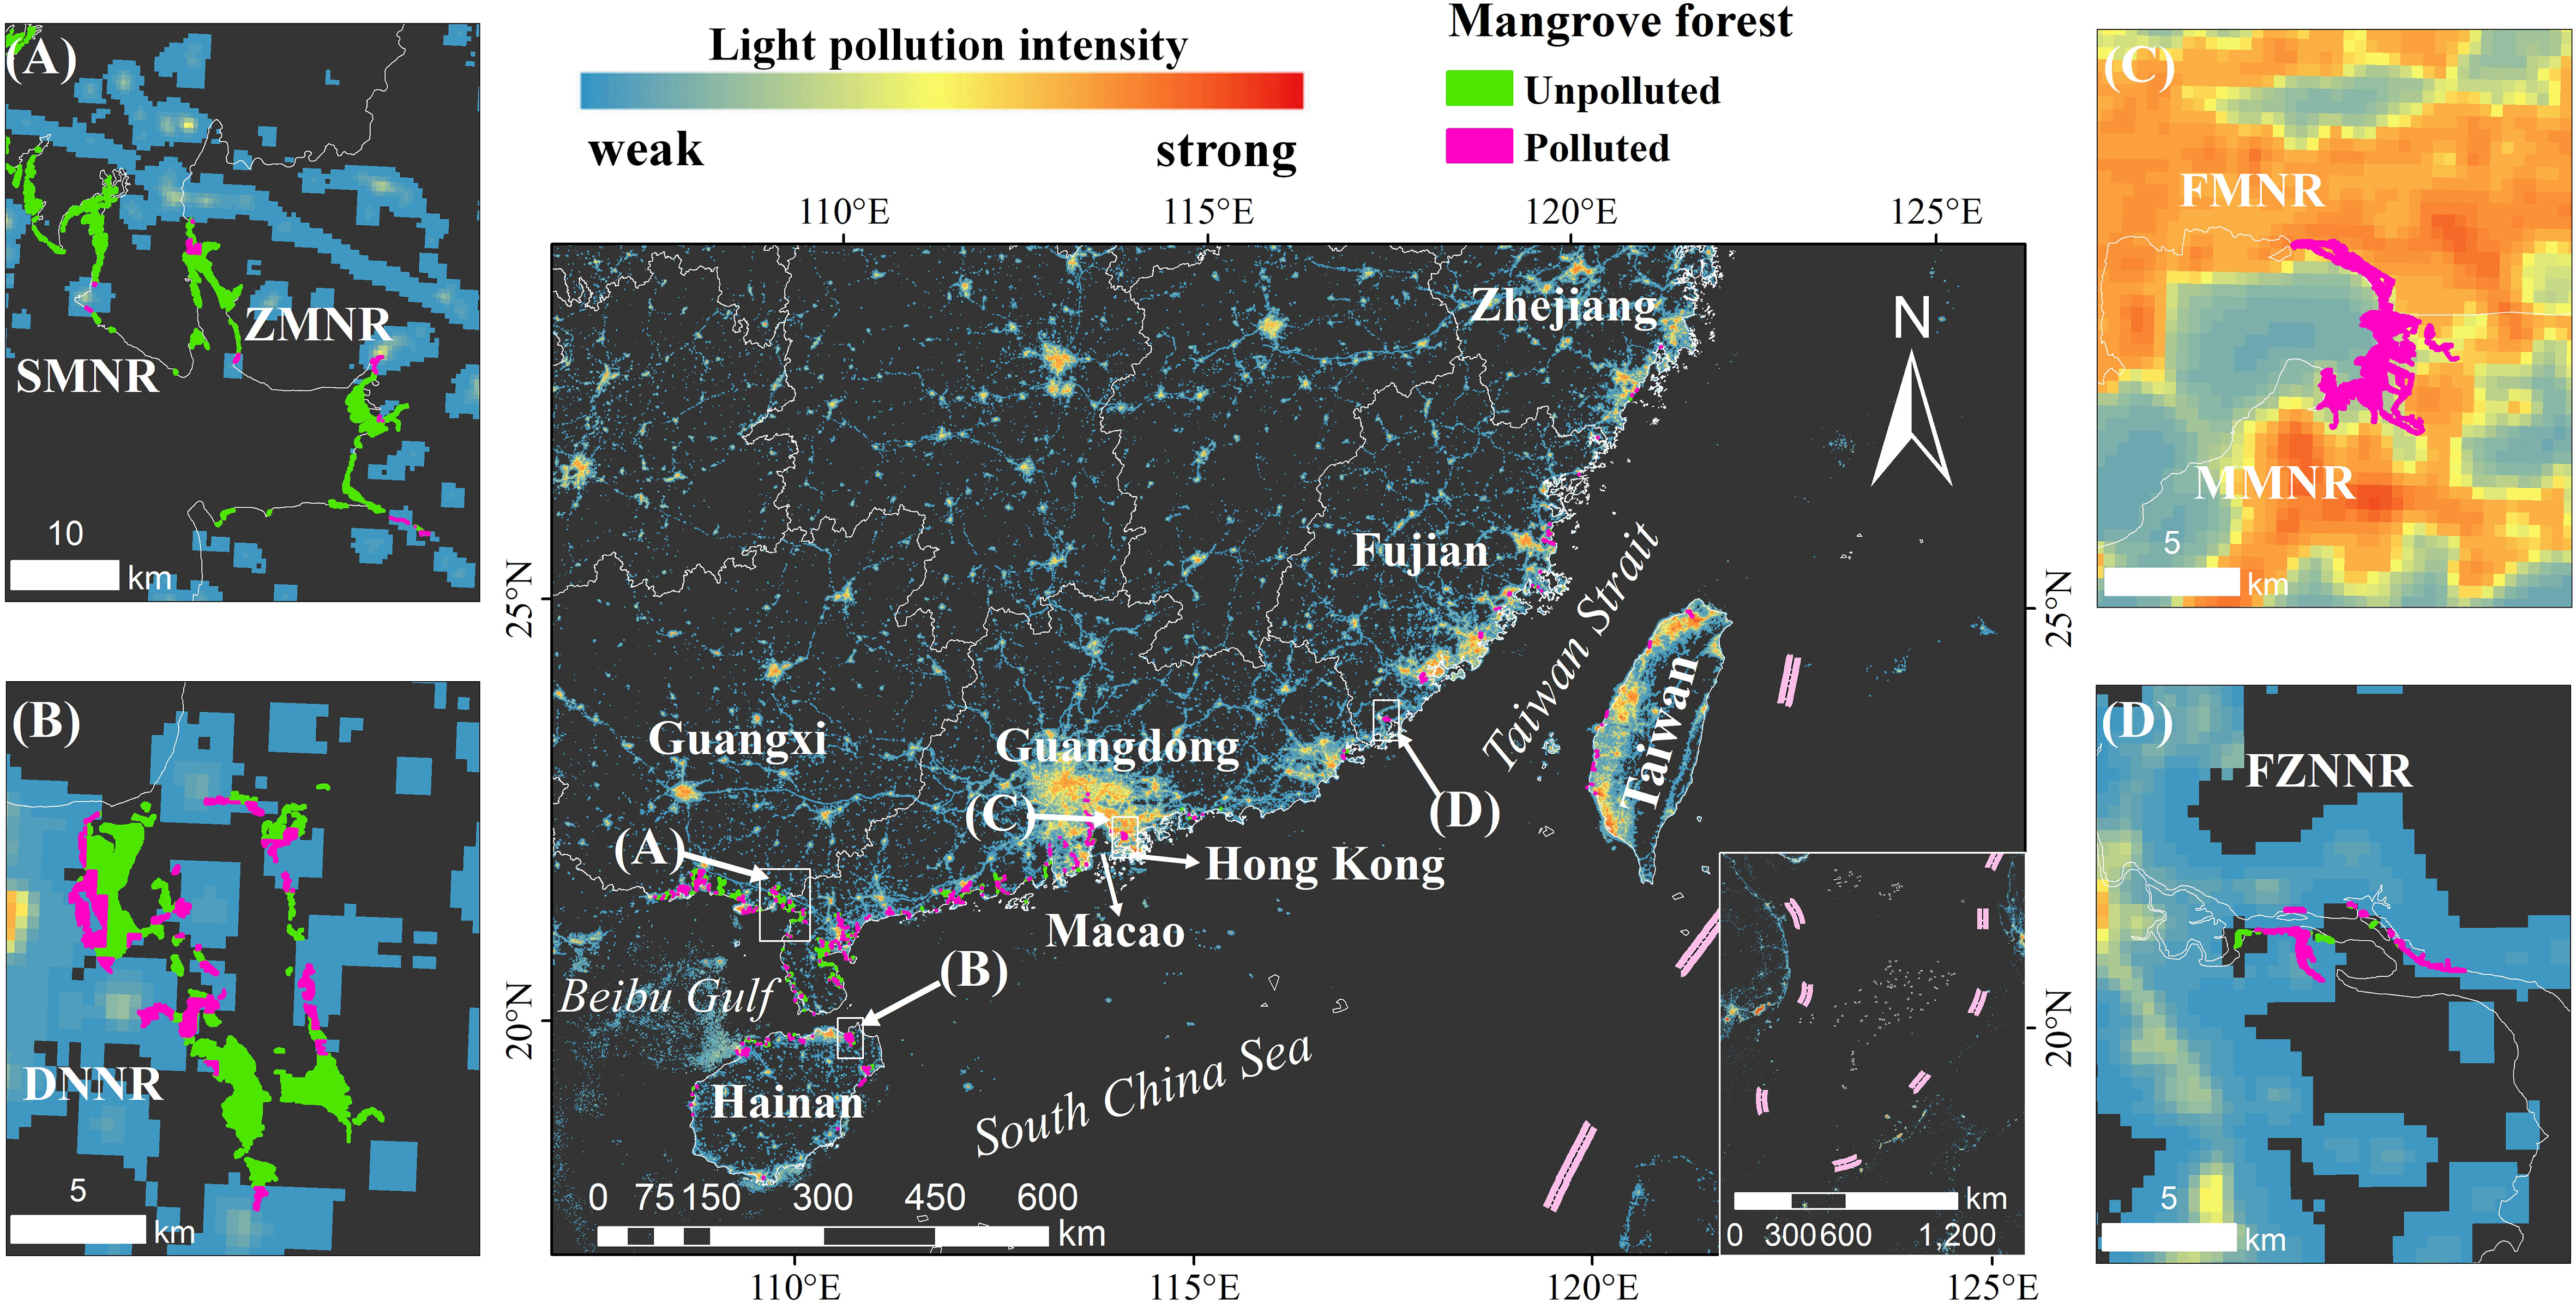
Figure 6 Conditions of light pollution in China’s mangrove forests in 2020.
3.3 Statistical analysis of light pollution in different regions
Temporal changes of light-polluted mangrove forests in each province or district are shown in Supplementary Table 1. The mangrove forests polluted by light in all provinces (districts) have an obvious upward trend due to economic growth. In Guangdong (including Hong Kong and Macao), the proportion of light pollution increased from 1992 (14%) to 2020 (43%). By 2020, the total area of mangrove forests affected by light pollution in Guangdong had reached 4,965 ha, a net increase of 3,365 ha compared with 1992. The light pollution of the mangrove forest area in Guangxi increased significantly, and the net increase reached 4,086 ha during the last three decades, with the proportion of the light-polluted area also increasing rapidly from 2% to 46%. In Hainan, the proportion of the light-polluted area increased sharply from 2% to 68%, and the net area growth reached 2,944 ha. In Fujian, the proportion of the light-polluted area quickly increased from 33% to 92%, and the net area growth reached 523 ha. In Taiwan, the proportion of light pollution increased from 87% to 100% from 1992 to 2010 and has since remained stable. In Zhejiang, the proportion increased from 0% to 99%. However, the polluted area maximum was 178 ha in 2010, which then decreased with the reduction of the total area of mangrove forest.
4 Discussion
4.1 Mangrove forests conservation efforts in China
In China, the important ecological and economic values of mangrove ecosystems were not recognized by the public until the early 1990s (Chen et al., 2009). To date, there are seven national nature reserves with tourism having been developed in these reserves. A study shows that the establishment of nature reserves can effectively protect the area of wetland plants (Sun et al., 2023). However, the conditions of light pollution in these reserves were not clear. Supplementary Table 2 shows the light pollution in different reserves. DNNR has been affected by light pollution since 2010 (1%), with the proportion of light pollution reaching 53% by 2020. BNNR has been affected by light pollution since 2015 (1%), with the proportion of light pollution reaching 31% by 2020. SMNR has been threatened by light pollution since 2015 (~0%), with the proportion reaching 4% by 2020. ZMNR has been affected by light pollution since 2015 (2%), with the proportion of light pollution reaching 20% by 2020. FZNNR has been exposed to light pollution since 2000 (30%), and it was most serious in 2020 with the proportion of light pollution reaching 97%. FMNR and MMNR are located in the Guangdong-Hong Kong-Macao Greater Bay Area and are affected by the blooming effect (Zhao et al., 2020). Since 1992, almost all areas have been affected by light pollution.
Comparing the light pollution of mangrove forests in seven nature reserves and their corresponding provinces, we found that the polluted proportion in four nature reserves (DNNR, SMNR, BNNR, and ZMNR) was lower than the provincial average, with the remaining nature reserves seriously affected by light pollution because they were too close to cities, such as FMNR, MMNR, and FZNNR. However, from the perspective of the net increase of pollution proportions, the net increase of six nature reserves in addition to FZNNR was less than the provincial average. This indicates that the establishment of mangrove nature reserves not only protected the mangrove forest areas, but also reduced the risk of light pollution, which could effectively protect the mangrove ecosystem.
4.2 Reliability and uncertainties of mangrove forests light pollution monitoring
The reliability of our mangrove forests light pollution monitoring could be attributed to three factors. The NPP-VIIRS average-masked data is stable and accurate, the threshold segmentation algorithm is simple and efficient, and the mangrove distribution data set is complete and accurate. Firstly, for NPP-VIIRS average-masked data products, the interference of sunlight, moonlight, cloudy pixels, and unstable light sources can be eliminated, and the artificial light range can be accurately identified (Elvidge et al., 2021). Secondly, the threshold segmentation method is applied to two generations of NTL sensors. Based on the segmentation result of NPP-VIIRS, the overall accuracy of DMSP-OLS can reach 86%, showing that this method is simple, effective, and accurate. Moreover, the accuracy of CAS_Mangroves mapping in 1990, 2000, 2010, and 2020 was 87%, 89%, 92%, and 96%, respectively, which provides accurate mangrove distribution information for this study. Therefore, mangrove forest light pollution monitoring is reliable.
The uncertainties regarding mangrove forests light pollution monitoring were mainly caused by three factors. First, there is a large gap between the NTL data and CAS_Mangroves data source in spatial resolution, leading to inaccurate light pollution ranges. Second, the DMSP-OLS data lacks accurate calibration, so NTL data from 2010 and prior were not very accurate. Third, in this study, the artificial night sky brightness was not considered, and it was considered that there was no light pollution if there was no direct artificial light irradiation. In fact, artificial night sky brightness also affects some animals to some extent. Due to the lack of field observation to verify artificial night sky brightness, this study neglected artificial night sky brightness.
5 Conclusions
Mangrove forests provide important breeding and feeding grounds for marine species, and light pollution can lead to severe degradation of ecosystem biodiversity. In this study, temporal and spatial monitoring of the light pollution of mangrove forests in China from 1992 to 2020 was performed using time-series NTL data and mangrove forest distribution provided by CAS_Mangroves. The results showed that the area of mangrove forests in China polluted by light increased by 12,112 ha from 1992 to 2020, with the proportion increasing from 12% to 52%, which was directly related to coastal urbanization of southeast China.
Among the provinces and regions in China, the largest net increase of polluted areas occurred in Guangxi with an area of 4,086 ha, followed by Guangdong (3,365 ha) and Hainan (2,944 ha). The largest proportion of net growth was in Zhejiang which reached 99%, followed by Hainan (66%) and Fujian (59%). Taiwan is the most seriously affected by light pollution. In Taiwan, 87% of mangroves were polluted by light in 1992. Since 2010, all mangroves in Taiwan Province have been affected by light pollution. For the light pollution proportion of the seven nature reserves, four (DNNR, SMNR, BNNR, and ZMNR) of them were less than the provincial average data and three (FMNR, MMNR, and FZNNR) were greater than the provincial average. More significantly, the net increases in pollution proportions in six nature reserves (DNNR, SMNR, BNNR, ZMNR, FMNR, and MMNR) were less than that in their own provinces. Therefore, the establishment of nature reserves is effective in preventing light pollution from mangrove forests. This study is the first overview of the light pollution status of mangrove forests in China from 1992-2020. This comprehensive information can support relevant research and facilitate the formulation of applicable management strategies in coastal zones of China and other developing countries.
Data availability statement
The datasets presented in this study can be found in online repositories. The names of the repository/repositories and accession number(s) can be found in the article/Supplementary Material.
Author contributions
HZ and MJ designed the research, processed the data, and wrote the manuscript draft. ZW and RZ contributed to designing the research and reviewing the manuscript. DM contributed to image analysis and reviewing the manuscript. CR contributed to image analysis, fieldwork, and reviewing the manuscript. CZ contributed to reviewing the manuscript. All authors contributed to the article and approved the submitted version.
Funding
This work is jointly supported by the National Natural Science Foundation of China (42171372, 42171379, 42101399 and 42001383), the Youth Innovation Promotion Association of the Chinese Academy of Sciences (2021227), and the National Earth System Science Data Center (www.geodata.cn).
Conflict of interest
The authors declare that the research was conducted in the absence of any commercial or financial relationships that could be construed as a potential conflict of interest.
Publisher’s note
All claims expressed in this article are solely those of the authors and do not necessarily represent those of their affiliated organizations, or those of the publisher, the editors and the reviewers. Any product that may be evaluated in this article, or claim that may be made by its manufacturer, is not guaranteed or endorsed by the publisher.
Supplementary material
The Supplementary Material for this article can be found online at: https://www.frontiersin.org/articles/10.3389/fmars.2023.1187702/full#supplementary-material
References
Alkarkhi A. F. M. (2021). “Introduction to statistical hypothesis testing,” in Applications of hypothesis testing for environmental science (Amsterdam, Netherlands: Elsevier), 1–12. doi: 10.1016/B978-0-12-824301-5.00006-X
Bennie J., Davies T. W., Cruse D., Bell F., Gaston K. J. (2018). Artificial light at night alters grassland vegetation species composition and phenology. J. Appl. Ecol. 55, 442–450. doi: 10.1111/1365-2664.12927
Bernardino A. F., Mazzuco A. C. A., Souza F. M., Santos T. M. T., Sanders C. J., Massone C. G., et al. (2022). The novel mangrove environment and composition of the Amazon delta. Curr. Biol. 32, 3636–3640.e2. doi: 10.1016/j.cub.2022.06.071
Bouillon S., Borges A. V., Castañeda-Moya E., Diele K., Dittmar T., Duke N. C., et al. (2008). Mangrove production and carbon sinks: a revision of global budget estimates: GLOBAL MANGROVE CARBON BUDGETS. Global Biogeochem. Cycles 22, n/a–n/a. doi: 10.1029/2007GB003052
Cabrera-Cruz S. A., Smolinsky J. A., Buler J. J. (2018). Light pollution is greatest within migration passage areas for nocturnally-migrating birds around the world. Sci. Rep. 8, 3261. doi: 10.1038/s41598-018-21577-6
Chen L., Wang W., Zhang Y., Lin G. (2009). Recent progresses in mangrove conservation, restoration and research in China. J. Plant Ecol. 2, 45–54. doi: 10.1093/jpe/rtp009
Chen B., Xiao X., Li X., Pan L., Doughty R., Ma J., et al. (2017). A mangrove forest map of China in 2015: analysis of time series landsat 7/8 and sentinel-1A imagery in Google earth engine cloud computing platform. ISPRS J. Photogrammetry Remote Sens. 131, 104–120. doi: 10.1016/j.isprsjprs.2017.07.011
Craft C. (2022). “Mangroves,” in Creating and restoring wetlands (Amsterdam, Netherlands: Elsevier), 297–336. doi: 10.1016/B978-0-12-823981-0.00008-3
Davies T. W., Smyth T. (2018). Why artificial light at night should be a focus for global change research in the 21st century. Glob Change Biol. 24, 872–882. doi: 10.1111/gcb.13927
De K., Sautya S., Dora G. U., Gaikwad S., Katke D., Salvi A. (2023). Mangroves in the “Plasticene”: high exposure of coastal mangroves to anthropogenic litter pollution along the central-West coast of India. Sci. Total Environ. 858, 160071. doi: 10.1016/j.scitotenv.2022.160071
Elvidge C. D. (1997). Mapping city lights with nighttime data from the DMSP operational linescan system. Photogrammetric Eng. Remote Sens. 63, 727–734.
Elvidge C. D., Zhizhin M., Ghosh T., Hsu F.-C., Taneja J. (2021). Annual time series of global VIIRS nighttime lights derived from monthly averages: 2012 to 2019. Remote Sens. 13, 922. doi: 10.3390/rs13050922
Falchi F., Cinzano P., Elvidge C. D., Keith D. M., Haim A. (2011). Limiting the impact of light pollution on human health, environment and stellar visibility. J. Environ. Manage. 92, 2714–2722. doi: 10.1016/j.jenvman.2011.06.029
Ghosh T., Baugh K. E., Elvidge C. D., Zhizhin M., Poyda A., Hsu F.-C. (2021). Extending the DMSP nighttime lights time series beyond 2013. Remote Sens. 13, 5004. doi: 10.3390/rs13245004
Gorbunov M. Y., Falkowski P. G. (2002). Photoreceptors in the cnidarian hosts allow symbiotic corals to sense blue moonlight. Limnol. Oceanogr. 47, 309–315. doi: 10.4319/lo.2002.47.1.0309
Halpern B. S., Frazier M., Potapenko J., Casey K. S., Koenig K., Longo C., et al. (2015). Spatial and temporal changes in cumulative human impacts on the world’s ocean. Nat. Commun. 6, 7615. doi: 10.1038/ncomms8615
Hölker F., Wolter C., Perkin E. K., Tockner K. (2010). Light pollution as a biodiversity threat. Trends Ecol. Evol. 25, 681–682. doi: 10.1016/j.tree.2010.09.007
Hsu F.-C., Baugh K., Ghosh T., Zhizhin M., Elvidge C. (2015). DMSP-OLS radiance calibrated nighttime lights time series with intercalibration. Remote Sens. 7, 1855–1876. doi: 10.3390/rs70201855
Huang S., Gan Y., Zhang X., Chen N., Wang C., Gu X., et al. (2023). Urbanization amplified asymmetrical changes of rainfall and exacerbated drought: Analysis over five urban agglomerations in the yangtze river basin, china. Earth’s Future 11. doi: 10.1029/2022EF003117
Jia M., Wang Z., Mao D., Huang C., Lu C. (2021). Spatial-temporal changes of china’s mangrove forests over the past 50 years: an analysis towards the sustainable development goals (SDGs). Chin. Sci. Bull. 66, 3886–3901. doi: 10.1360/TB-2020-1412
Jia M., Wang Z., Zhang Y., Mao D., Wang C. (2018). Monitoring loss and recovery of mangrove forests during 42 years: the achievements of mangrove conservation in China. Int. J. Appl. Earth Observation Geoinformation 73, 535–545. doi: 10.1016/j.jag.2018.07.025
Jia M., Wang Z., Mao D., Ren C., Song K., Zhao C., et al. (2023). Mapping global distribution of mangrove forests at 10-m resolution. Sci. Bull., S2095927323003110. doi: 10.1016/j.scib.2023.05.004
La Sorte F. A., Fink D., Buler J. J., Farnsworth A., Cabrera-Cruz S. A. (2017). Seasonal associations with urban light pollution for nocturnally migrating bird populations. Global Change Biol. 23, 4609–4619. doi: 10.1111/gcb.13792
Levin N., Kyba C. C. M., Zhang Q., Sánchez de Miguel A., Román M. O., Li X., et al. (2020). Remote sensing of night lights: a review and an outlook for the future. Remote Sens. Environ. 237, 111443. doi: 10.1016/j.rse.2019.111443
Li X., Chen X., Zhao Y., Xu J., Chen F., Li H. (2013). Automatic intercalibration of night-time light imagery using robust regression. Remote Sens. Lett. 4, 45–54. doi: 10.1080/2150704X.2012.687471
Lovelock C. E., Cahoon D. R., Friess D. A., Guntenspergen G. R., Krauss K. W., Reef R., et al. (2015). The vulnerability of indo-pacific mangrove forests to sea-level rise. Nature 526, 559–563. doi: 10.1038/nature15538
Nechaev D., Zhizhin M., Poyda A., Ghosh T., Hsu F.-C., Elvidge C. (2021). Cross-sensor nighttime lights image calibration for DMSP/OLS and SNPP/VIIRS with residual U-net. Remote Sens. 13, 5026. doi: 10.3390/rs13245026
Potapov P., Li X., Hernandez-Serna A., Tyukavina A., Hansen M. C., Kommareddy A., et al. (2021). Mapping global forest canopy height through integration of GEDI and landsat data. Remote Sens. Environ. 253, 112165. doi: 10.1016/j.rse.2020.112165
Sanderson E. W., Jaiteh M., Levy M. A., Redford K. H., Wannebo A. V., Woolmer G. (2002). The human footprint and the last of the wild. BioScience 52, 891. doi: 10.1641/0006-3568(2002)052[0891:THFATL]2.0.CO;2
Sun C., Li J., Liu Y., Zhao S., Zheng J., Zhang S. (2023). Tracking annual changes in the distribution and composition of saltmarsh vegetation on the jiangsu coast of china using landsat time series–based phenological parameters. Remote Sens. Environ. 284, 113370. doi: 10.1016/j.rse.2022.113370
Tu Y., Zhou H., Lang W., Chen T., Li X., Xu B. (2020). A novel cross-sensor calibration method to generate a consistent night-time lights time series dataset. Int. J. Remote Sens. 41, 5482–5502. doi: 10.1080/01431161.2020.1731935
Valiela I., Bowen J. L., York J. K. (2001). Mangrove forests: one of the world’s threatened major tropical environments. BioScience 51, 807. doi: 10.1641/0006-3568(2001)051[0807:MFOOTW]2.0.CO;2
van Langevelde F., Ettema J. A., Donners M., WallisDeVries M. F., Groenendijk D. (2011). Effect of spectral composition of artificial light on the attraction of moths. Biol. Conserv. 144, 2274–2281. doi: 10.1016/j.biocon.2011.06.004
Venter O., Sanderson E. W., Magrach A., Allan J. R., Beher J., Jones K. R., et al. (2016). Sixteen years of change in the global terrestrial human footprint and implications for biodiversity conservation. Nat. Commun. 7, 12558. doi: 10.1038/ncomms12558
Viera-Pérez M., Hernández-Calvento L., Hesp P. A., Santana-del Pino A. (2019). Effects of artificial light on flowering of foredune vegetation. Ecology 100, e02678. doi: 10.1002/ecy.2678
Vizcaya-Martínez D. A., Flores-de-Santiago F., Valderrama-Landeros L., Serrano D., Rodríguez-Sobreyra R., Álvarez-Sánchez L. F., et al. (2022). Monitoring detailed mangrove hurricane damage and early recovery using multisource remote sensing data. J. Environ. Manage. 320, 115830. doi: 10.1016/j.jenvman.2022.115830
Wang L., Jia M., Yin D., Tian J. (2019). A review of remote sensing for mangrove forests: 1956–2018. Remote Sens. Environ. 231, 111223. doi: 10.1016/j.rse.2019.111223
Wang M., Mao D., Xiao X., Song K., Jia M., Ren C., et al. (2023). Interannual changes of coastal aquaculture ponds in China at 10-m spatial resolution during 2016–2021. Remote Sens. Environ. 284, 113347. doi: 10.1016/j.rse.2022.113347
Yang G., Huang K., Sun W., Meng X., Mao D., Ge Y. (2022). Enhanced mangrove vegetation index based on hyperspectral images for mapping mangrove. ISPRS J. Photogrammetry Remote Sens. 189, 236–254. doi: 10.1016/j.isprsjprs.2022.05.003
Zhang R., Jia M., Wang Z., Zhou Y., Mao D., Ren C., et al. (2022). Tracking annual dynamics of mangrove forests in mangrove national nature reserves of China based on time series sentinel-2 imagery during 2016–2020. Int. J. Appl. Earth Observation Geoinformation 112, 102918. doi: 10.1016/j.jag.2022.102918
Zhao M., Zhou Y., Li X., Cheng W., Zhou C., Ma T., et al. (2020). Mapping urban dynamics, (1992–2018) in southeast Asia using consistent nighttime light data from DMSP and VIIRS. Remote Sens. Environ. 248, 111980. doi: 10.1016/j.rse.2020.111980
Keywords: nighttime light, light pollution, mangrove forests, nature reserves, China
Citation: Zeng H, Jia M, Zhang R, Wang Z, Mao D, Ren C and Zhao C (2023) Monitoring the light pollution changes of China’s mangrove forests from 1992-2020 using nighttime light data. Front. Mar. Sci. 10:1187702. doi: 10.3389/fmars.2023.1187702
Received: 16 March 2023; Accepted: 11 April 2023;
Published: 23 May 2023.
Edited by:
Chao Chen, Suzhou University of Science and Technology, ChinaReviewed by:
Qing Xia, Changsha University of Science and Technology, ChinaBolin Fu, Guilin University of Technology, China
Copyright © 2023 Zeng, Jia, Zhang, Wang, Mao, Ren and Zhao. This is an open-access article distributed under the terms of the Creative Commons Attribution License (CC BY). The use, distribution or reproduction in other forums is permitted, provided the original author(s) and the copyright owner(s) are credited and that the original publication in this journal is cited, in accordance with accepted academic practice. No use, distribution or reproduction is permitted which does not comply with these terms.
*Correspondence: Mingming Jia, amlhbWluZ21pbmdAbmVpZ2FlLmFjLmNu