 Julie L. Vecchio
 Walter J. Bubley†
- Marine Resources Research Institute, South Carolina Department of Natural Resources, Charleston, SC, United States
The power of fishery-independent surveys for stock assessments and management decisions is in their consistency over time and space. Although the preference is to limit change to survey execution, such changes may be necessary. In multi-species surveys, changes that improve metrics for one species may be a detriment to survey performance for others. In 2010, the Southeast Reef Fish Survey (SERFS) was formed to better address sampling needs off the U.S. Southeast Atlantic coast by intensifying a historical chevron trap survey (MARMAP), especially at the northern and southern extent of the sampling range. We used several performance metrics (encounter rate, annual coefficient of variability, standard error, and relative abundance index values) to determine the impact of this change in survey coverage on trend estimates for three commonly encountered species with varying centers of distribution in the survey region. Gray Triggerfish (Balistes capriscus) is found throughout the range of both surveys (i.e. centrally-distributed), while White Grunt (Haemulon plumierii) and Red Snapper (Lutjanus campechanus) are centered near the northern and southern extent of the sampling range, respectively. For Gray Triggerfish, the survey intensification had no effect on encounter rate, but reduced the coefficient of variation and indicated that the historical index of relative abundance may have been overestimated. For White Grunt, the survey intensification slightly improved CV but did not affect the index of relative abundance value or encounter rate. For Red Snapper, SERFS increased encounter rates, reduced CV overall, and detected a population increase 5 years earlier than MARMAP. Overall, the intensification of the survey improved at least one performance metric for each species and showed few deleterious effects on performance, suggesting that intensification of the survey was a net-positive for the accurate estimation of population trends in several species of interest.
1 Introduction
Well-regulated fisheries rely on information that can be used to monitor the status of the stock, interpret fisheries landings data, perform stock assessments, and develop regulations for managing fisheries resources (Apostolaki and Hillary, 2009; Hilborn et al., 2020; Gebremedhin et al., 2021). A key data input for these purposes is an index of relative abundance that reflects trends in the population and is proportional to the size of the stock (Hilborn and Walters, 1992). The utility of any fishery data in detecting trends, understanding variability, providing a baseline, and evaluating impacts of natural events or human-related activities, is dependent on consistency of the survey over space and time. Indices of relative abundance can be developed using data obtained by fishery-dependent or fishery-independent sources, but when fisheries are highly regulated, fishery-independent surveys are often the only method available to adequately characterize relative population size due to the limitations of economics, regulation, and recall on fishery-dependent data sources (Potts and Manooch III, 2002; Hamilton et al., 2016).
Marine fishery-independent surveys are often designed to simultaneously capture trends in abundance and life-history characteristics for several managed species concurrently due to cost and overlap of habitat utilization by numerous fishery targets (Dennis et al., 2015; Christiansen et al., 2020). While multi-species surveys are an efficient use of resources, indices of abundance for each target species may be more sensitive, or less sensitive, to population changes based on the relative sampling density in relation to species distribution. In addition, the geographic ranges of economically-important species may not follow previous survey boundaries, and their centers of distribution may change over time, necessitating the re-examination of the assumption of representative sampling for each target (Smart et al., 2020; O'Leary et al., 2021; Damiano, 2023). Surveys may be expanded or intensified due to a recognized need to increase available data for a particular species (Williams and Carmichael, 2009; Schrandt et al., 2021; Thompson et al., 2022), or they may be scaled back due to funding reductions (Zimney and Smart, 2022).
The South Carolina Department of Natural Resources has operated the Marine Resources Monitoring, Assessment, and Prediction Program (MARMAP) fishery-independent chevron trap survey in Atlantic waters off the southeastern United States since 1990 (Collins, 1990; Bubley et al., 2023). Anecdotal evidence suggested an increase in the Red Snapper, Lutjanus campechanus, population in the early 2000’s, during a period when the existing MARMAP survey showed low and stable population numbers (SEDAR, 2009; Williams and Carmichael, 2009). The center of distribution for Red Snapper occurs near the southern terminus of the survey range, where MARMAP sample coverage was relatively poor at the time. To enhance ongoing survey efforts, especially in relation to species with centers of distribution offset from the core of MARMAP sampling, additional resources were incorporated to form the Southeast Reef Fish Survey (SERFS) in 2010. The formation of SERFS increased the density of stations available for sampling through mapping efforts using modern tools such as multibeam bathymetry, submission of potential sampling sites by the fishing industry, and deployments of cameras to confirm potential bottom for reef fish, particularly in areas at the southern and northern extent of the range (Bacheler et al., 2017). The creation of SERFS also allowed the survey to approximately triple the number of chevron traps deployed each year, effectively increasing the breadth of habitat types sampled (Glasgow et al., 2021). The effects of chevron trap survey intensification on the Red Snapper index of relative abundance were explored during a subsequent regional stock assessment (Ballenger et al., 2014). Although similar trends in relative abundance were observed between the full time series (1990-2014) and a time series beginning in 2010 with the inception of the full SERFS effort (Ballenger et al., 2014), the decision was made to use the short, five-year time series (2010-2014) due to decreased uncertainty surrounding the estimates (SEDAR, 2017).
Now that more than a decade has passed since the inception of SERFS, sufficient data are available to explore the effect of the sampling intensification on species-specific indices of relative abundance for several commonly encountered reef fish species. While increasing survey effort may be predicted to result in equivalent or improved estimates of relative abundance over surveys with lower effort, this assumption should be examined on a case-by-case basis to determine appropriate actions. Retrospective analysis provides a means to assess potential biases and ascertain the most appropriate method of employing each single-species index of relative abundance for management decision-making, with options including statistical correction to ensure continuity of the data or breaking the time series, effectively excluding historical data (Brodie et al., 2022; Zimney and Smart, 2022). The decision for appropriate incorporation of an index of relative abundance may vary by species, depending on distribution, habitat use, or behavior (Brodie et al., 2022; Zimney and Smart, 2022). Because the length of the time series is essential for understanding current population levels in relation to long-term trends, care must be taken and a variety of factors must be weighed, before a decision is made.
To examine the effects of survey intensification on indices of relative abundance, we selected three model species. Species whose center of distributions were in the extremes of the survey range to the north (White Grunt, Haemulon plumierii) and south (Red Snapper) and one with a relatively even latitudinal distribution throughout the region (Gray Triggerfish, Balistes capriscus) were chosen to explore a variety of distribution patterns. The goal of this work is to examine an input used in the SEDAR (Southeast Data Assessment and Review) stock assessment process, to provide the best available data for upcoming U.S. federal stock assessments in the South Atlantic region. The results from the current study will be instrumental in understanding the utility of the increase in sampling density on the indices of relative abundance for target species with varying distribution patterns and population trends, while providing guidance on the incorporation of the chevron trap survey time series for upcoming assessments and management actions.
2 Materials and methods
2.1 Sample collections
Throughout the survey period (1990-2022), chevron traps were deployed on randomly selected monitoring stations from a universe of known low- to moderate-relief hard-bottom areas from April through October each year (Collins, 1990). The sampling area included waters of the continental shelf and shelf edge between Cape Hatteras, NC, and St. Lucie Inlet, FL (Figure 1). Although the potential geographic sampling range has not changed since 1990, sampling effort and concomitant sampling density have been a function of available funding. Prior to 2010, realized sampling was concentrated between 31°N and 34°N with substantially fewer deployments in the extreme northern and southern extent of the range. From 2010 to 2022, due to the formation of SERFS, the sampling universe was intensified to ensure that the overall sampling density was approximately even (Figure 1). In the most recent years, the R/V Palmetto, R/V Savannah, and NOAA Ship Pisces have primarily served as the research platforms. Station depths range from 14 to 110 m. Criteria for annual station selection included sampling without replacement and that all sampled stations were farther than 200 m away from all other sampled stations that year.
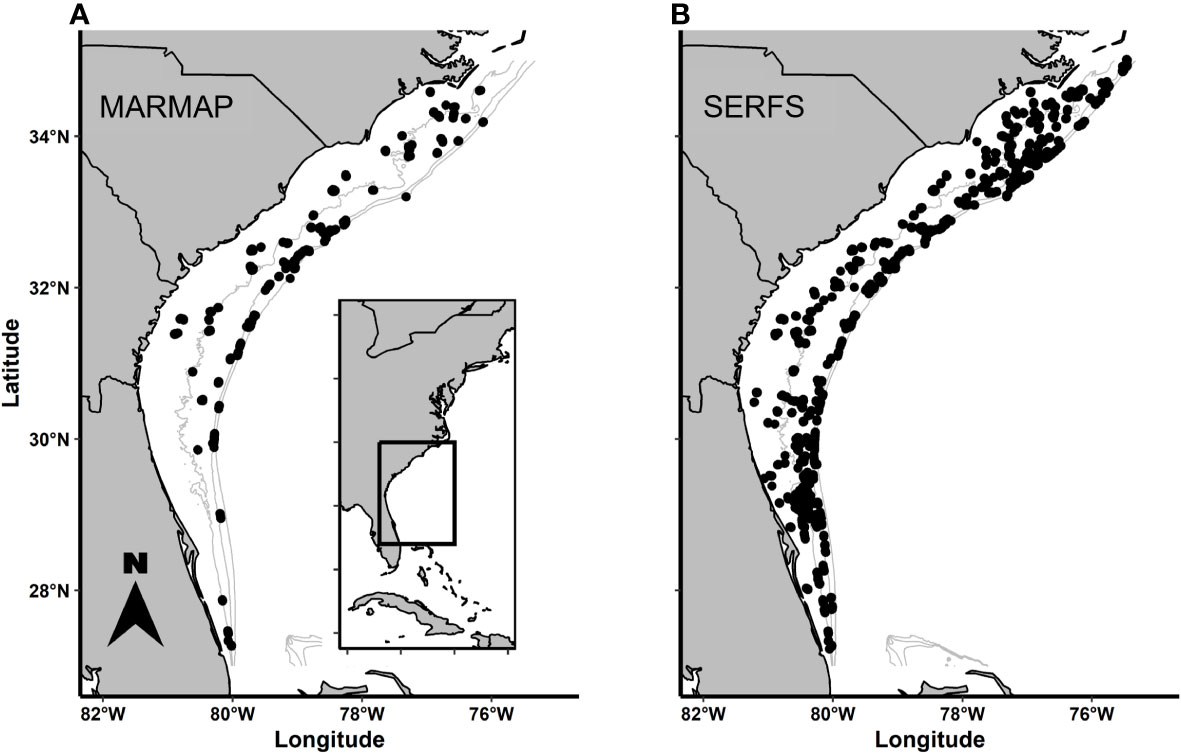
Figure 1 Distributions of: (A) MARMAP and (B) SERFS sampling effort throughout the range. Each dot indicates a single trap deployment during an example year of each survey.. The farthest north and farthest south sampling sites are at approximately the same latitude in each example, but density of sampling differs between the sampling designs, particularly in the northern and southern ends of the range.
Prior to deployment, chevron traps were baited with a combination of whole or cut clupeids (Brevoortia or Alosa spp., family Clupeidae; Collins, 1990). While traps soaked, bottom temperature (within 5 m of the bottom) was recorded using either a SEABIRD Conductivity Temperature Depth recorder or a VEMCO temperature logger. Traps were retrieved after approximately 90 minutes. After collection, all fishes were identified to species, and each species was counted.
2.2 Data analysis
Data were analyzed for the three federally managed species, Gray Triggerfish, White Grunt, and Red Snapper (Figure 2; Bubley et al., 2023). We used two datasets to explore the effect of the increased sampling that began in 2010. One was created using the current version of the sampling universe and encompasses all trap deployments meeting the above criteria over the 32-year time series (no sampling occurred in 2020 due to the COVID-19 global pandemic). This will be referred to as the “SERFS” dataset. The other dataset, referred here to as “MARMAP” was a subset of the SERFS dataset. This subset included stations that were known and sampled prior to 2010 and sampled again in 2010 or beyond, thus mimicking the situation if the sampling universe had not intensified, and the survey continued as it had prior to 2010. For each dataset, we calculated the total numbers of traps deployed each year and the proportion of traps that encountered each of the three selected species. Because the divergence in deployment rate began in 2010, we used t-tests to compare the annual encounter rates for each species from 2010 to 2022 between the SERFS and MARMAP datasets to test for impact of sampling intensification. Additionally, we used t-tests within the MARMAP dataset to test if the annual encounter rate differed between recent years (2010-2022) and older years (1990-2009), as a check for changes in population size rather than survey design (Sokal and Rohlf, 1994).
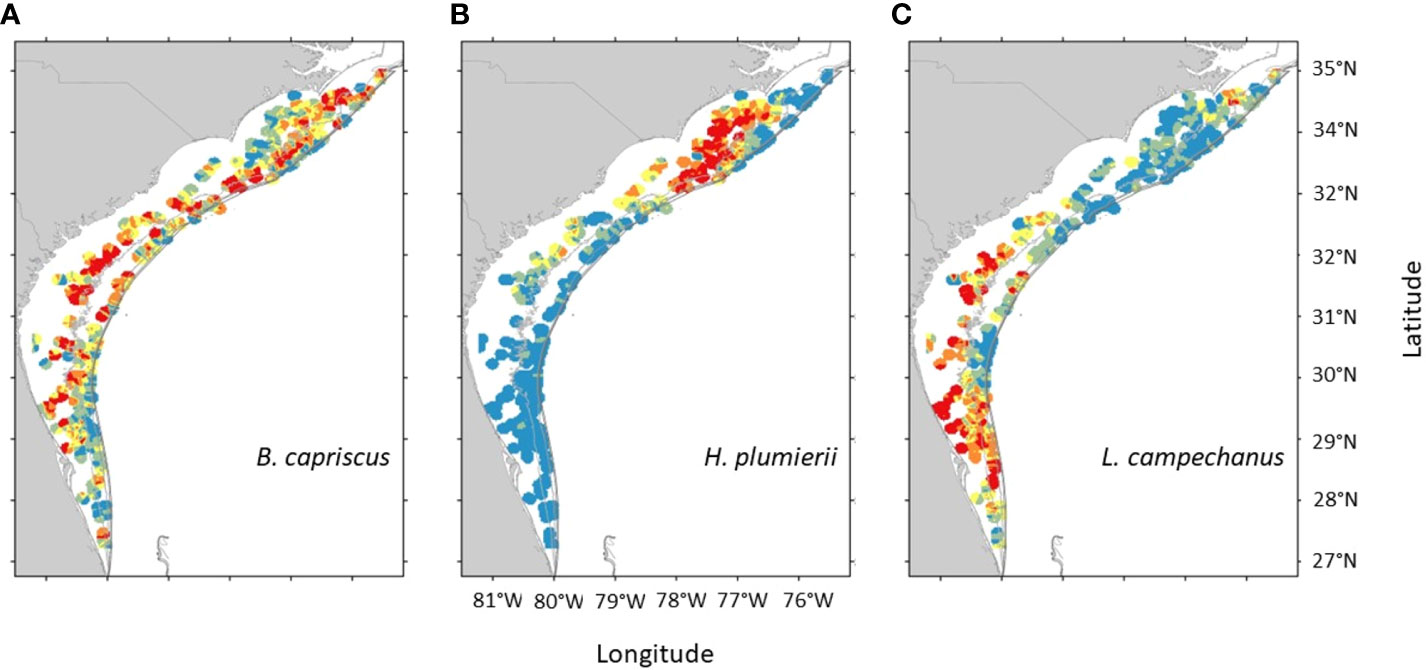
Figure 2 Inverse distance weighted interpolation of chevron trap catches for (A) Gray Triggerfish, (B) White Grunt, and (C) Red Snapper, across the survey range in the most recent five years of sampling (Bubley et al., 2023). The total range of values is species specific. Blue indicates the lowest 20% of catches, red indicates the highest 20% of catches. Green, yellow, and orange are intermediate catch rates.
For each species and dataset (MARMAP and SERFS), we examined the Poisson, negative binomial, zero-inflated Poisson, and zero-inflated negative binomial (ZINB) error distributions for modeled indices of relative abundance using the FishyR package in R statistical software (Ballenger, 2022). Final error distribution (ZINB in all cases) and included covariates were selected by Akaike’s Information Criterion (AIC; Akaike, 1973). ZINB models are frequently used in stock assessments to standardize abundance for the chevron trap survey due to the nature of the survey targeting a suite of species (i.e. not every trap has the same likelihood of encountering the species of interest). Both the SERFS and MARMAP models relied on the independent covariates of latitude (°N), sampling day of year, sample depth (m), and bottom temperature (°C) to estimate changes in total abundance of each species over time (Figures S1 and S2). The covariates for the MARMAP model were taken only from those stations included in the MARMAP dataset, while the covariates for the SERFS model were taken from all stations. The covariate effects in the models were fit with polynomials informed by preliminary generalized additive models (GAMs), allowing continuous covariates to be related to abundance (catch per trap) of each species in a non-linear fashion (Figures S3–S8). Year was fitted as a fixed variable and soak time included as an offset. Maximum order of polynomial allowed were limited to 4 to maintain biological relevance and reduce processing time (Wood, 2011).
Coefficients of variation (CV) and standard error per year for each species and dataset (SERFS or MARMAP) were determined by bootstrapping with 5,000 iterations. Linear regression was used to compare the CV from the full data set against the total numbers of traps deployed each year. T-tests were used to compare the slopes of the regression lines for each species, and significance was determined using a Bonferroni correction (Sokal and Rohlf, 1994). All statistical analyses were conducting in R version 4.2.2 (R Core Team, 2022).
3 Results
Numbers of MARMAP stations sampled between 1990 and 2009 ranged from 224 to 404 annually with a median of 303 (Table 1). The highest concentration of traps during this period was deployed near the center of the geographic range, with less coverage near the northern and southern extent of the range (Figure 1A). Beginning in 2010, total potential sampling stations were increased through extensive habitat exploration, resulting in an approximately evenly distributed sampling effort from north to south (Figure 1B). Total numbers of SERFS stations sampled between 2010 and 2022 ranged from 731 to 1,883 annually with a median of 1,479 (Table 1). Within the MARMAP dataset, the numbers of traps remained below 500 per year throughout the time series, ranging from 319 to 489 with a median of 428 between 2010 and 2022 (Table 1).
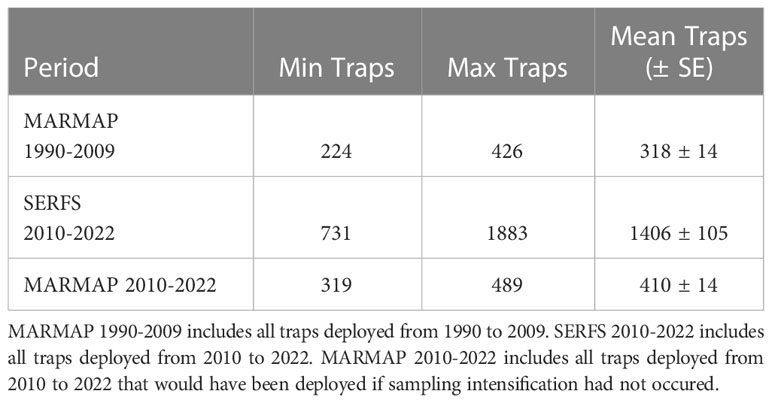
Table 1 Total numbers of traps deployed under two fishery-independent sampling scenarios.
Encounter rate between the MARMAP and SERFS sampling since 2010 varied among species. While the difference in encounter rate between MARMAP and SERFS sampling was not significant for Gray Triggerfish (t = -1.37, p = 0.18) or White Grunt (t = 0.49, p = 0.62), the difference was significant for Red Snapper (t = -4.49, p < 0.001; Table 1; Figure 3). Red Snapper encounter rate nearly doubled with the intensification of sampling (0.07 versus 0.13 in the MARMAP vs SERFS sampling). However, this comparison is confounded by potential increases in Red Snapper relative abundance during the period. For the second encounter rate comparison (MARMAP 1990-2009 versus MARMAP 2010-2022; Figure 4), encounter rates varied significantly for both Gray Triggerfish (t = 4.2, p = 0.001) and Red Snapper (t = -4.0, p = 0.002), but did not differ for White Grunt (t = 1.6, p = 0.1).
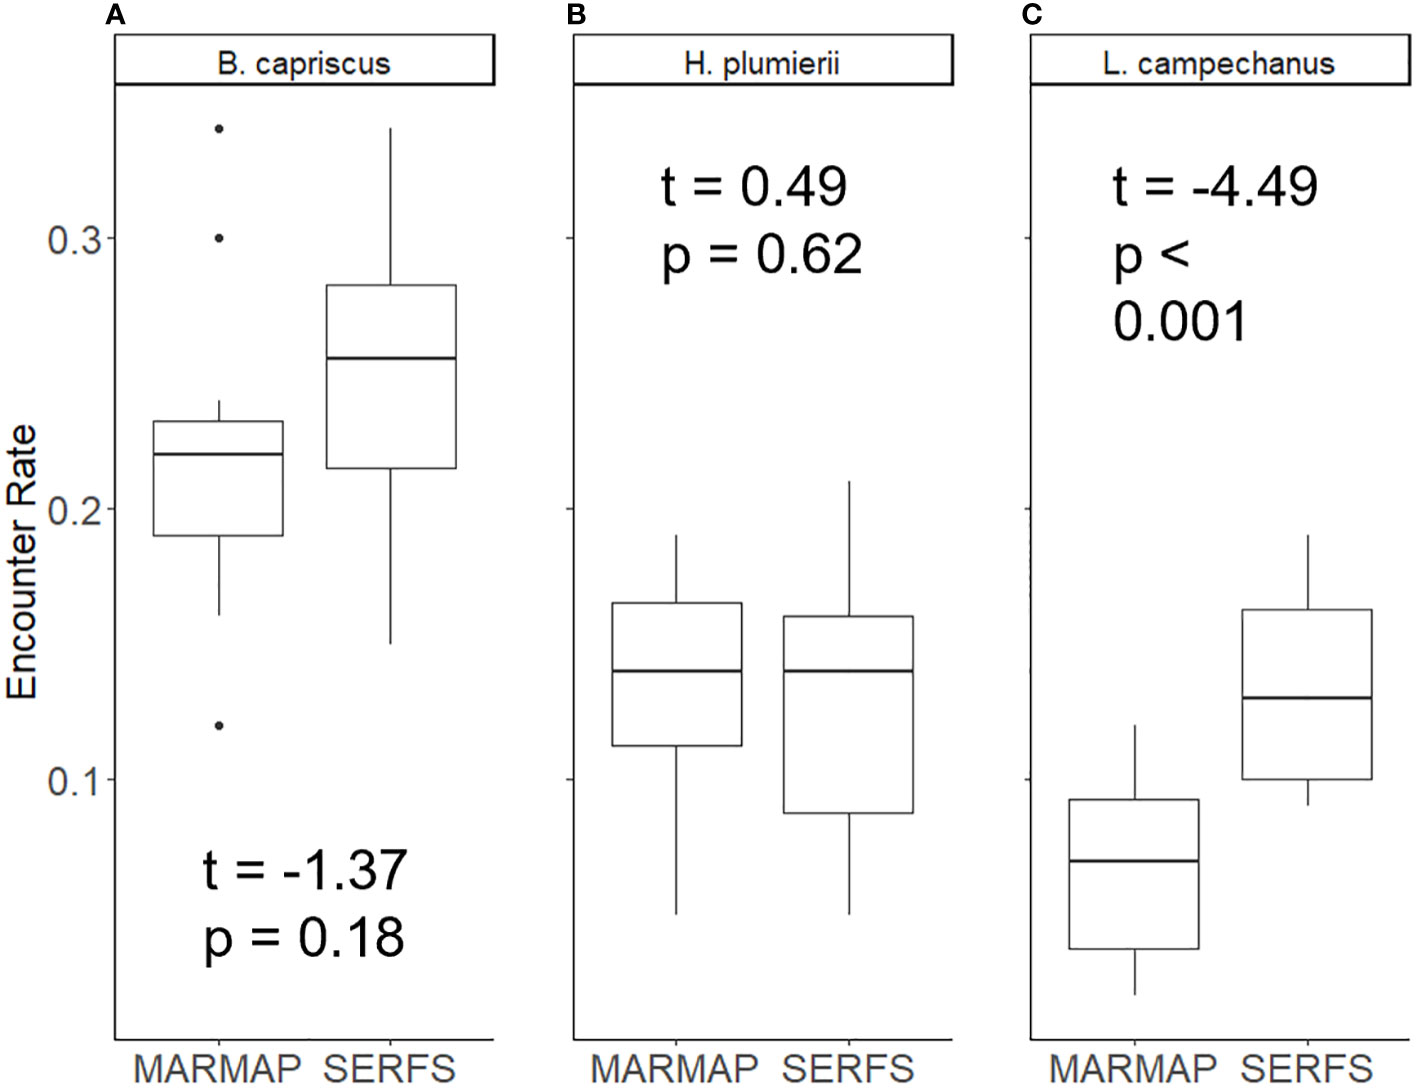
Figure 3 Proportion of traps encountering three species: (A) Gray Triggerfish, (B) White Grunt, and (C) Red Snapper under two conditions: MARMAP (data from traps deployed from 2010 to 2022 that would have been deployed even if there was no increase in sampling effort), and SERFS (full complement of traps 2010-2022). Median is the line inside the box, the edges of the box are 25th and 75th percentiles. Whiskers represent the 95% confidence interval. Dots represent samples outside of 95% confidence. T-test results are shown.
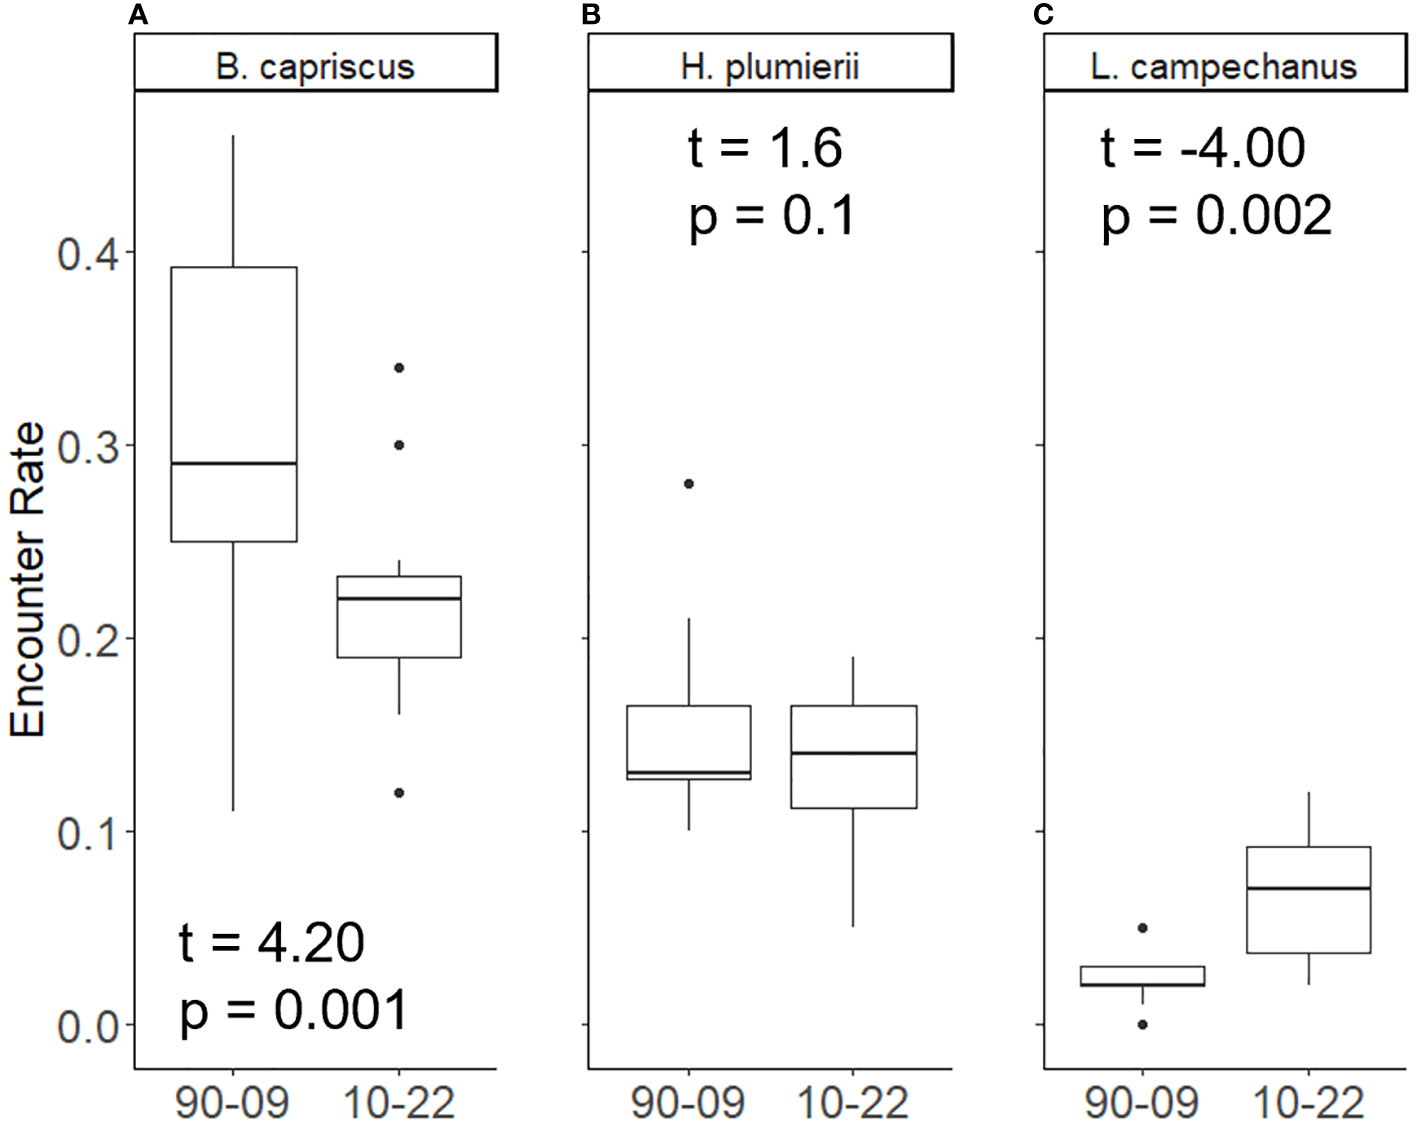
Figure 4 Proportion of traps encountering three species: (A) Gray Triggerfish, (B) White Grunt, and (C) Red Snapper under two conditions: full complement of trap deployments between 1990 and 2009, traps deployed from 2010 to 2022 that would have been deployed even if there was no increase in sampling effort. Median is the line inside the box, the edges of the box are 25th and 75th percentiles. Whiskers represent the 95% confidence interval. Dots represent samples outside of 95% confidence. T-test results are shown.
All species demonstrated a significant, decreasing linear relationship between CV for ZINB-modeled annual index of relative abundance and sample size using all available trap deployments (SERFS dataset; Figure 5). Coefficient of Variation in each species showed the largest amount of variation at low numbers of annual trap deployments (below 500 traps per year). In addition, CV varied considerably among species at low sample size with Red Snapper having the highest annual CV and Gray Triggerfish having the lowest. As number of samples increased, total variability was reduced in all three species, and CV became more similar among species. All linear models were significant, and each accounted for between 35 and 68% of variability for the species (Table 2; Figure 5). T-tests with Bonferroni correction (α = 0.017) indicated that the slope for Red Snapper was different from the slopes for Gray Triggerfish (t = -8.65, p < 0.001) and White Grunt (t = -11.39, p < 0.001), but slopes for White Grunt and Gray Triggerfish did not differ significantly (t = -2.38, p = 0.021).
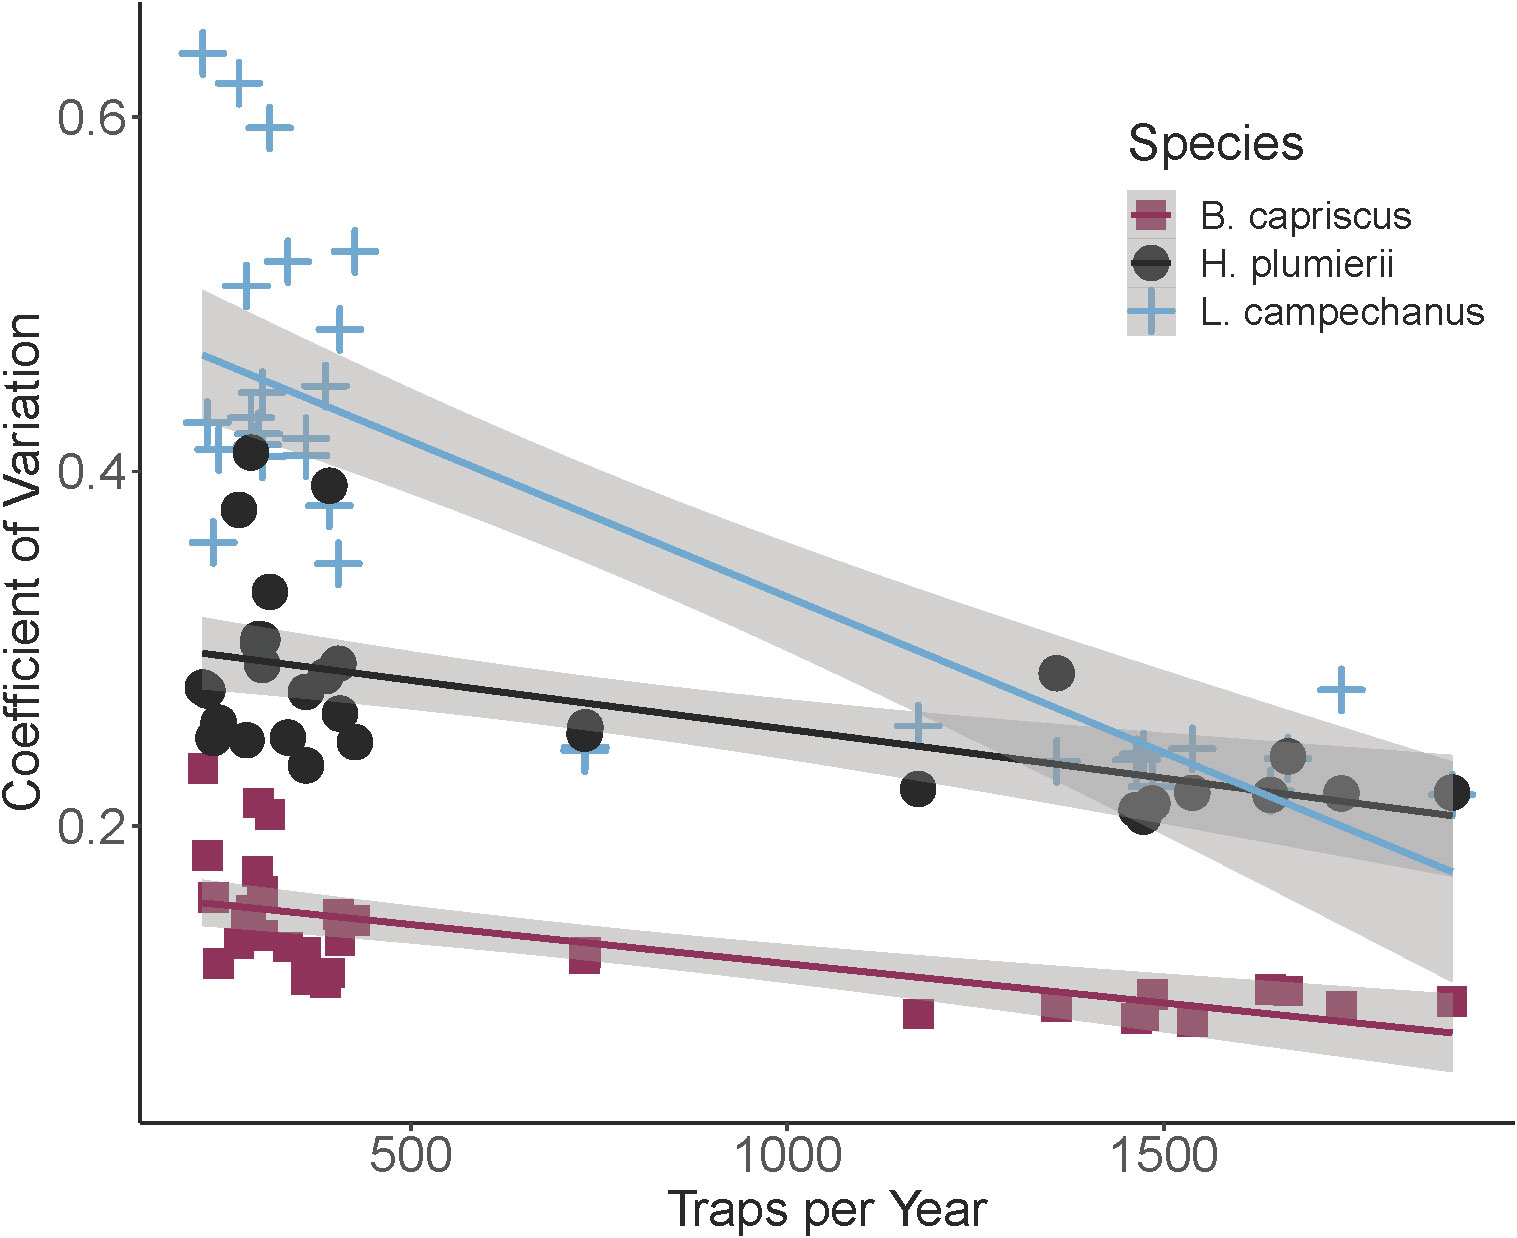
Figure 5 Coefficient of variation for three species as a function of total numbers of trap deployments per year. Species are Gray Triggerfish (B. capriscus), White Grunt (H. plumierii) and Red Snapper (L. campechanus). Each line represents a linear regression of coefficient of variation as a function of traps per year. Gray shaded areas are standard error for each regression.
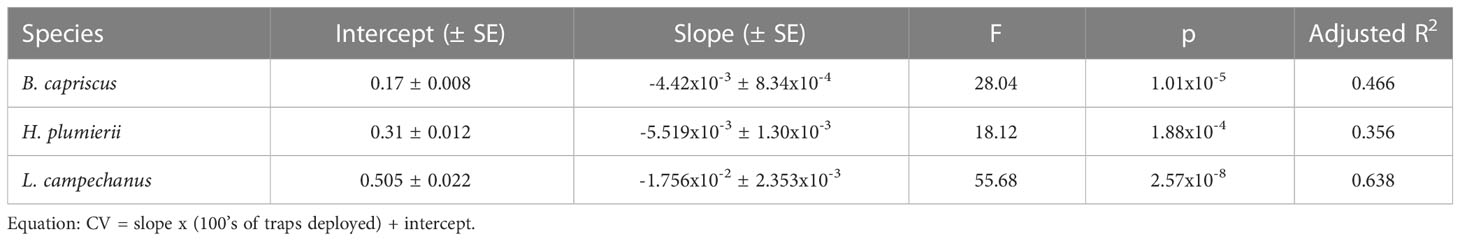
Table 2 Regression parameters for bootstrapped coefficient of variation (CV) as a function of numbers of traps per year for each of three species: Gray Triggerfish (B. capriscus), White Grunt (H. plumierii), and Red Snapper (L. campechanus).
The change in the sampling frame for the trap survey impacted indices of relative abundance in different ways among the species examined. The overall shape of the index of relative abundance was similar between models for Gray Triggerfish (Figure 6A), but the annual mean estimate was higher using the MARMAP dataset than the SERFS dataset for the early part of the time series. Once the sampling frame was intensified (after 2010), the SERFS estimate overlapped with, or tended to be higher than the MARMAP estimate, with standard errors overlapping throughout this most recent period. The White Grunt estimated index of relative abundance did not differ in shape or value between the MARMAP and SERFS models, and the standard error overlapped across the entire time series (Figure 6B). Red Snapper indices of relative abundance overlapped throughout the period 1990 to 2009 (Figure 6C). However, once sampling increased after 2010, the estimates diverged markedly. The SERFS model reflected the increase in Red Snapper abundance as early as 2010 and continued through the end of the time series. The MARMAP model, on the other hand, did not reflect an increase in Red Snapper abundance until 2014 and standard error between the data sets did not overlap until 2021. Although the SERFS model detected the increase in Red Snapper reported elsewhere better than the MARMAP model, the standard errors between 2010 and 2019 were higher in the SERFS model than the MARMAP model (Figure 6C).
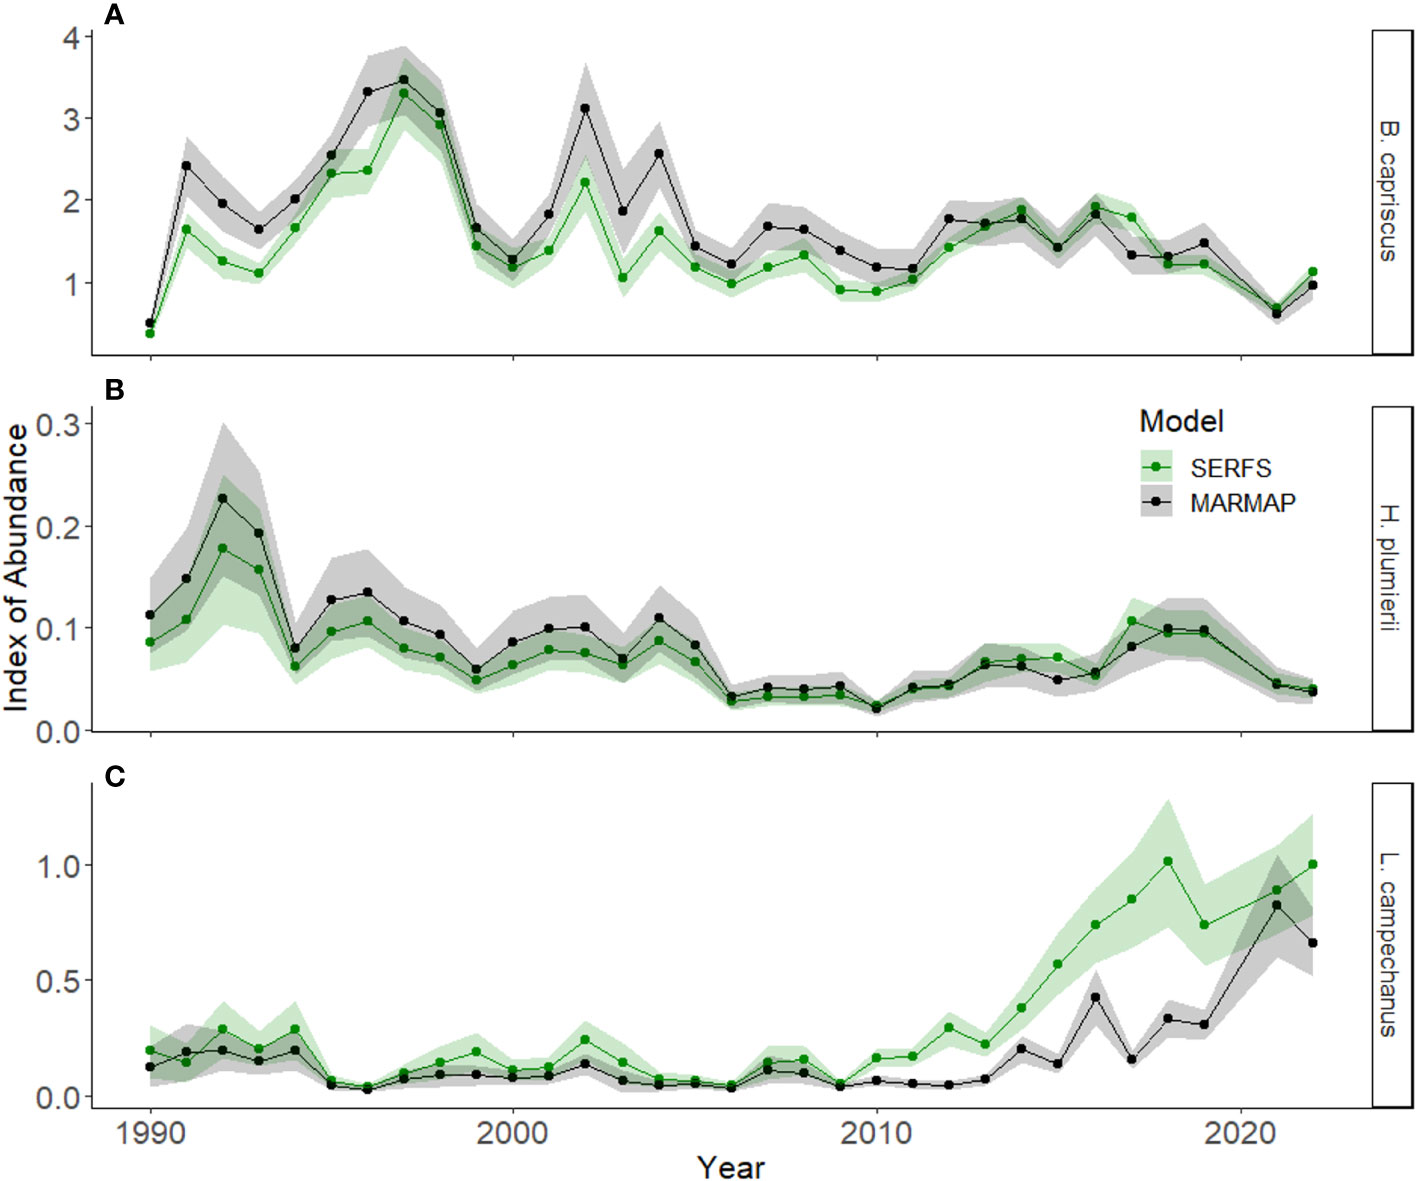
Figure 6 Indices of relative abundance from 1990 to 2022 derived from individuals captured in chevron traps for three species, (A) Gray Triggerfish (B. capriscus), (B) White Grunt (H. plumierii) and (C) Red Snapper (L. campechanus), using two zero-inflated negative binomial models. The SERFS model includes environmental covariates and catch information for all chevron traps deployed throughout the survey timespan. The MARMAP model includes only information from chevron traps deployed at sites that had initially been included in the sampling frame prior to 2010. Mean values each year are represented by dots. The shaded areas are standard error for each model each year.
When summarizing the effect of increased sampling on the performance metrics for each species, we found 89% beneficial or neutral results. For Gray Triggerfish, CV improved with increased sampling, but encounter rate and standard error for the indices of relative abundance were neutral. For White Grunt, the same pattern was observed. For Red Snapper, encounter rate increased between the surveys using the same years of data and CV declined with increasing sample size while the standard error for the index increased. Both relative abundance index value (SERFS vs. MARMAP) and encounter rate between early and late MARMAP time periods decreased for Gray Triggerfish. Both metrics were neutral for White Grunt, and both increased for Red Snapper (Table 3).
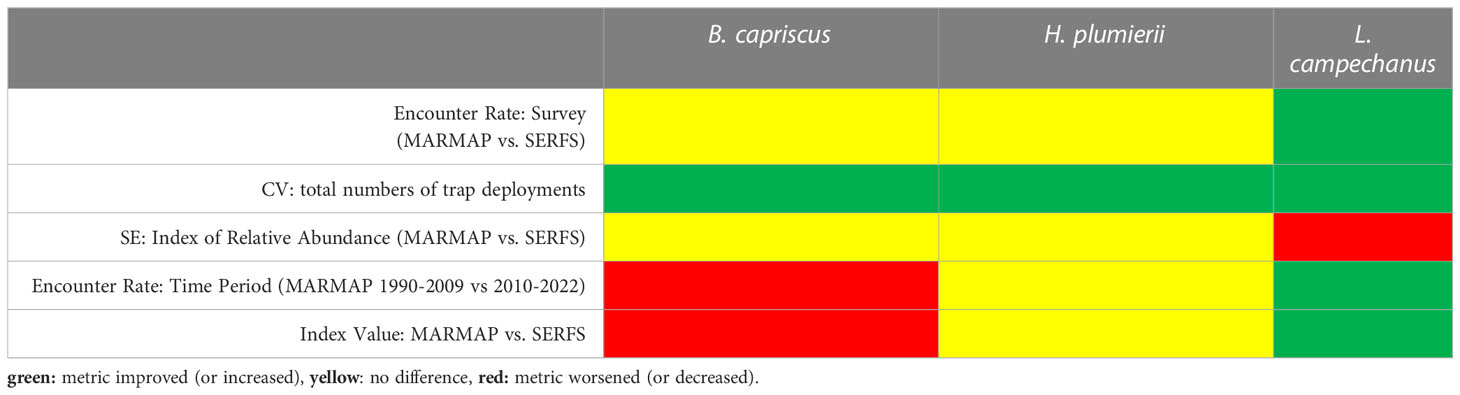
Table 3 Summary of performance metrics for the representation of population trends in three species using two fishery-independent survey designs.
4 Discussion
The current work suggests that increased sampling intensity of an existing multi-species survey can improve detection of a species occupying under-represented geographic locations while showing no negative impacts on the detection of other species. We showed improvements to both probability of capture and annual CV for Red Snapper with increased sampling intensity in areas where Red Snapper are known to be abundant. Meanwhile, we showed no negative impact on probability of capture or CV for White Grunt or Gray Triggerfish. The only metric examined with a detrimental effect on performance for Gray Triggerfish (encounter rate assuming the MARMAP survey design) was most likely due to population decline and not survey design. The Red Snapper standard errors were larger with the intensified design than historically once the population showed a marked increase in abundance. In summary, over 80% of metrics examined were positive or neutral, suggesting that gains outweigh losses in the survey intensification.
Despite the broad geographic range of Gray Triggerfish, annual CV values indicate that an increase in total chevron trap effort (i.e. increased sample size) improved our uncertainty estimates. Encounter rates with SERFS were higher than MARMAP during the same period (although not significantly), while the comparison between encounter rates for MARMAP before and after 2010 indicated a decrease in encounter probability likely due to the overall population decline. Because the MARMAP sampling frame did overlap with the center of abundance for Gray Triggerfish, there was no difference in the timing of observed abundance changes. If we had maintained the MARMAP sampling design, we would have seen a decrease in encounter rate and a decreasing trend in the index of relative abundance. The differences in the overall scale of the index of relative abundance before the survey intensification could be due to the increased specificity of the independent covariates (latitude, sampling day of year, sampling depth, and bottom temperature) informing the model in the SERFS design improving estimate accuracy. The MARMAP design could have been impacted by hyperstability in that it was primarily indexing fish in their core habitat. Including sites in the SERFS design less likely to hold Gray Triggerfish, the index seemed to be more sensitive to a population decline beginning near the margins of suitability for the species (Crecco and Overholtz, 1990; Hilborn and Walters, 1992; Sarah et al., 2015). Overall, the full SERFS time series is likely appropriate to use for Gray Triggerfish with the caveat that the potential overestimate in the historical period should be examined more thoroughly.
White Grunt was included in the study because of the known center of abundance in the northern fringe of the sampling range, which had low sampling intensity prior to 2010. However, differences between the SERFS and MARMAP datasets were minimal for this species, suggesting that despite the mismatch in spatial extent, the MARMAP survey may have been adequately capturing trends in White Grunt abundance over time. Although sampling density in the northern portion of the survey was lower prior to 2010 than after, these results suggest that sampling density was sufficient for White Grunt, possibly due to the consistency of spatial use by this species in that area. The increase in sampling effort to the south where White Grunt do not typically occur could have been detrimental to estimates for this species because of the high likelihood of extra zeroes increasing zero inflation and not being informative (Zuur et al., 2009). However, we did not observe any metric to be negatively impacted. In fact, White Grunt annual CV benefitted from increased sample size. The results here support that an index of relative abundance for White Grunt can and should use the full time series and SERFS sampling domain.
Red Snapper have been undergoing a population recovery over the last 10 to 15 years (SEDAR, 2021); however, the detection of this recovery in the chevron trap survey varied across the survey area. The SERFS dataset reflected an increase in Red Snapper abundance as early as 2010, while the increase did not become apparent in the MARMAP dataset until 2014, and this time lag appears to continue through the end of the time series. The discrepancy in detection is most likely due to the process through which Red Snapper have been undergoing population recovery, consistent with ideas on the interaction between abundance and spatial extent, in particular the basin model (Mccall, 1990), in which both abundance and distribution change in concert. Mostly likely, Red Snapper initially began recovering in the core area of their distribution in the southern region of the survey and, as density increased in that area, fish spilled over into additional areas throughout the region (Alcala et al., 2005). While the original MARMAP survey design might be able to detect early signs of population decline by means of local depletions (Lluch-Belda et al., 1989; Atkinson et al., 1997; Warren, 1997; Mcfarlane et al., 2002), the MARMAP design did not detect the Red Snapper recovery until sufficient range expansion had occurred in the species to reach the region of most intense sampling. The primary recommendation from SEDAR 41 to truncate the index of relative abundance using only SERFS sampling (or split the index of relative abundance into two time periods) is likely appropriate in future assessments based on the results presented here (SEDAR, 2017).
The analyses shown here suggest that the increase in sampling density was an effective tool for monitoring the increase in population density for a recovering species and did not negatively impact the ability of the survey to index relative abundances of other species of interest. In fact, uncertainty metrics in a species assumed to be adequately sampled by the MARMAP survey were improved by the inclusion of additional stations. Many fishery-independent surveys have not been updated due to a concern that the change will negatively impact the quality of the data. However, this study demonstrates that improvements in detection and model fit are both strengthened by the increase in station density, even if the total range of the potential survey stations changes little. For the three species examined here, we observed net positive or neutral impacts to indices of relative abundance performance, though we did not examine length or age compositions which typically accompany an index for stock assessment purposes. The method used here: comparing the estimates produced by the data that “would have been” to the estimates produced by the data that currently is, can be a powerful tool to understand whether a survey change made a major difference in the accuracy and appropriateness of the data being provided to produce management advice.
Data availability statement
The datasets presented in this study can be found in online repository at www.seamap.org. The names of the repository/repositories and accession number(s) can be found in the article/Supplementary Material.
Ethics statement
Ethical review and approval was not required for the animal study because SCDNR is the governing body for this type of permission. Self-regulation is assumed.
Author contributions
JV, WB, and TS contributed to the conception and design of the study. JV and WB performed the statistical analyses. JV, WB, and TS wrote sections of the manuscript. All authors contributed to the article and approved the submitted version.
Funding
Funding was provided by NOAA through the MARMAP (NA21NMF4540294) and SEAMAP-SA (NA21NMF4350372) grants to SCDNR.
Acknowledgments
The authors thank the numerous field biologists with the MARMAP, SEAMAP-SA, and SEFIS programs and vessel crews that collected the data included in this manuscript. The authors would also like to thank reviewers for their comments and constructive criticism to improve this manuscript. This is contribution number 863 for the Marine Resources Research Institute at South Carolina Department of Natural Resources.
Conflict of interest
The authors declare that the research was conducted in the absence of any commercial or financial relationships that could be construed as a potential conflict of interest.
Publisher’s note
All claims expressed in this article are solely those of the authors and do not necessarily represent those of their affiliated organizations, or those of the publisher, the editors and the reviewers. Any product that may be evaluated in this article, or claim that may be made by its manufacturer, is not guaranteed or endorsed by the publisher.
Supplementary material
The Supplementary Material for this article can be found online at: https://www.frontiersin.org/articles/10.3389/fmars.2023.1192739/full#supplementary-material
References
Akaike H. (1973). “Information theory and an extension of the maximum likelihood principle,” in Second international smyposium on information theory. Eds. Petrov B., Caski F. (Budapest: Akademiai Kaido), 267–281.
Alcala A. C., Russ G. R., Maypa A. E., Calumpong H. P. (2005). A long-term, spatially replicated experimental test of the effects of marine reserves on local fish yields. Can. J. Fisheries Aquat. Sci. 62, 98–108. doi: 10.1139/f04-176
Apostolaki P., Hillary R. (2009). Harvest control rules in the context of fishery-independent management of fish stocks. Aqautic Living Resour. 22, 217–224. doi: 10.1051/alr/2009022
Atkinson D. B., Rose G. A., Murphy E. F., Bishop C. A. (1997). Distribution changes of northern cod (Gadus morhua), 1981–1993. Can. J. Fisheries Aquat. Sci. 54, 132–138. doi: 10.1139/f96-158
Bacheler N. M., Geraldi N. R., Burton M. L., Munoz R. C., Kellison G. T. (2017). Comparing relative abundance, lengths, and habitat of temperate reef fishes using simultaneous underwater visual census, video, and trap sampling. Mar. Ecol. Prog. Ser. 574, 141–155. doi: 10.3354/meps12172
Ballenger J. C. (2022). FishyR: functions to facilitate standard analyses conducted in fisheries science. R package version 0.0.0.9001.
Ballenger J. C., Bubley W. J., Smart T. I., Reichert M. J. M. (2014). Red snapper fishery-independent indices of abundance in US south Atlantic waters based on a chevron trap survey (North Charleston, SC: SEDAR), 73.
Brodie R., Solomon J. J., Paperno R., Switzer T. S., Swanson C. E. (2022). Development of survey methods to effectively sample juvenile red snapper along the Atlantic coast of Florida. Trans. Am. Fisheries Society 151 (5), 571–586. doi: 10.1002/tafs.10375
Bubley W. J., Vecchio J. L, Smart T. I. (2023). Trends in relative abundance of reef fishes in fishery-independent surveys in waters off the southeastern United States. MARMAP/SEAMAP-SA Reef Fish Survey Technical Report 2023-002 (Charleston, SC: South Carolina Department of Natural Resources)
Christiansen H. M., Switzer T. S., Keenan S. F., Tyler-Jedlund A. J., Winner B. L. (2020). Assessing the relative selectivity of multipe sampling gears for managed reef fishes in the eastern gulf of Mexico. Mar. Coast. Fisheries 12, 322–338. doi: 10.1002/mcf2.10129
Collins M. R. (1990). A comparison of three fish trap designs. Fisheries Res. 9, 325–332. doi: 10.1016/0165-7836(90)90051-V
Crecco V., Overholtz W. J. (1990). Causes of density-dependent catchability for georges bank haddock melanogrammus aeglefinus. Can. J. Fisheries Aquat. Sci. 47, 385–394. doi: 10.1139/f90-040
Damiano M. D. (2023). In search of novel solutions to emerging challenges in quantitative fisheries management (Raleigh, NC: North Carolina State University). Avaialble at: https://www.lib.ncsu.edu/resolver/1840.20/40706
Dennis D., Plaganyi E. E., Van Putten I., Hutton T., Pascoe S. (2015). Cost benefit of fishery-independentsurveys: are they worth the money? Mar. Policy 58, 108–115. doi: 10.1016/j.marpol.2015.04.016
Gebremedhin S., Brunell S., Getahun A., Anteneh W., Goethals P. (2021). Scientific methods to understand fish population dynamics and support sustainable fisheries management. Water 13, 574. doi: 10.3390/w13040574
Glasgow D. M., Reichert M. J. M., Quattro J. (2021). Effects of environmental factors on reef fish assemblage structure in the southeastern US Atlantic. Mar. Ecol. Prog. Ser. 671, 147–163. doi: 10.3354/meps13764
Hamilton R. J., Almany G. R., Stevens D., Bode M., Pita J., Peterson N. A., et al. (2016). Hyperstability masks declines in bumphead parrotfish (Bolbometopon muricatum) populations. Coral Reefs 35, 751–763. doi: 10.1007/s00338-016-1441-0
Hilborn R., Amoroso R. O., Anderson C. M., Baum J. K., Branch T. A., Costello C., et al. (2020). Effective fisheries management instrumental in improving fish stock status. Proc. Natl. Acad. Sci. United States America 117, 2218–2224. doi: 10.1073/pnas.1909726116
Hilborn R., Walters C. (1992). Quantitative fisheries stock assessment: choice, dynamics, and uncertainty (New York, NY: Springer-Science & Business Media, B.V). doi: 10.1007/978-1-4615-3598-0
Lluch-Belda D., Crawford R. J. M., Kawasaki T., Maccall A. D., Schwartzlose R. A., Smith P. E. (1989). Worldwide fluctuations of sardine and anchovy stocks: the regime problem. South Afr. J. Mar. Sci. 8, 195–205. doi: 10.2989/02577618909504561
Mccall A. D. (1990). Dynamic geography of marine fish population (Seattle, WA: University of Washington Press).
Mcfarlane G. A., Smith P. E., Baumgartner T. R., Hunter J. R. (2002). “Climate variability and pacific sardine populations and fisheries,” in Fisheries in a changing climate. Ed. Mcginn N. A. (Bethesda, MD: American Fisheries Society), 195–214.
O'Leary C. A., Kotwicki S., Hoff G. R., Thornson J. T., Kulik V. V., Ianelli J. N., et al. (2021). Estimating spatiotemporal availability of transboundary fishes to fishery-independent surveys. J. Appl. Ecol. 58, 2146–2157. doi: 10.1111/1365-2664.13914
Potts J., Manooch III C. S. (2002). Estimated ages of red porgy (Pagrus pagrus) from fishery-dependent and fishery-independent data and a comparison of growth parameters. Fishery Bull. 100, 81–89.
R Core Team (2022). R: a language and environment for statistical computing (Vienna, Austria: R Foundation for Statistical Computing). Available at: https://www.R-project.org/.
Sarah S. L., Ralf D., Axel T. (2015). Combining area closures with catch regulations in fisheries with spatio-temporal variation: bio-economic implications for the north Sea saithe fishery. Mar. Policy 51, 281–292. doi: 10.1016/j.marpol.2014.08.017
Schrandt M. N., Shea C. P., Kurth B. N., Switzer T. S. (2021). Amending survey design to improve statistical inferences: monitoring recruitment of juvenile reef fish in the eastern gulf of Mexico. Fisheries Res. 241, 106015. doi: 10.1016/j.fishres.2021.106015
SEDAR (2009). SEDAR 15: stock assessment report 1 south Atlantic red snapper (North Charleston, SC: South Atlantic Fishery Management Council).
SEDAR (2017). SEDAR 41- stock assessment report - revision 1 south Atlantic red snapper (North Charleston, SC: SEDAR).
SEDAR (2021). SEDAR 73 south Atlantic red snapper stock assessment report (North Charleston, SC: SEDAR).
Smart T. I., Bubley W. J., Glasgow D. M., Reichert M. J. M. (2020). Spatial distribution changes and habitat use in red porgy in waters off the southeast U.S. Atlantic coast. Mar. Coast. Fisheries 12, 381–394. doi: 10.1002/mcf2.10135
Sokal R. R., Rohlf F. J. (1994). Biometry: the principles and practices of statistics in biological research third (3rd) edition (New York, NY: W.H. Freeman and Co.).
Thompson K. A., Switzer T. S., Chirstman M. C., Keenan S. F., Gardner C., Overly K. E., et al. (2022). A novel habitat-based approach for combining indices of abundance from multiple fishery-independent video surveys. Fisheries Res. 247, 106178. doi: 10.1016/j.fishres.2021.106178
Warren W. G. (1997). Changes in the within-survey spatio-temporal structure of the northern cod (Gadus morhua) population 1985–1992. Can. J. Fisheries Aquat. Sci. 54, 139–148. doi: 10.1139/f96-147
Williams E. H., Carmichael J. (2009). Final report: south Atlantic fishery independent monitoring program workshp (Beaufort, NC: NOAA-NMFS).
Wood S. (2011). Fast stable restricted maximum likelihood and marginal likelihood estimation of semiparametric generalized linear models. J. R. Stat. Society: Ser. B (Methodological) 73, 3–36. doi: 10.1111/j.1467-9868.2010.00749.x
Zimney A., Smart T. I. (2022). Effects of incomplete sampling and standardization on indices of abundance from a fishery-independent trawl survey off the southeastern united states. Fishery Bull. 120, 252–267. doi: 10.7755/FB.120.3-4.6
Keywords: fishery-independent index, fish population estimate, Red Snapper, fishery-independent sample changes, White Grunt, Gray Triggerfish
Citation: Vecchio JL, Bubley WJ and Smart TI (2023) Increased fishery-independent sampling effort results in improved population estimates for multiple target species. Front. Mar. Sci. 10:1192739. doi: 10.3389/fmars.2023.1192739
Received: 23 March 2023; Accepted: 29 May 2023;
Published: 15 June 2023.
Edited by:
Ben Scoulding, Commonwealth Scientific and Industrial Research Organisation (CSIRO), AustraliaReviewed by:
Chongliang Zhang, Ocean University of China, ChinaJorge Paramo, University of Magdalena, Colombia
J. Marcus Drymon, Mississippi State University, United States
Copyright © 2023 Vecchio, Bubley and Smart. This is an open-access article distributed under the terms of the Creative Commons Attribution License (CC BY). The use, distribution or reproduction in other forums is permitted, provided the original author(s) and the copyright owner(s) are credited and that the original publication in this journal is cited, in accordance with accepted academic practice. No use, distribution or reproduction is permitted which does not comply with these terms.
*Correspondence: Julie L. Vecchio, dmVjY2hpb2pAZG5yLnNjLmdvdg==
†These authors have contributed equally to this work and share first authorship