 Justino Martínez1*†
 Francesca Elisa Leonelli2†
 Emilio García-Ladona1
 Joaquim Garrabou1
 Diego K. Kersting3
 Nathaniel Bensoussan4
 Andrea Pisano2
- 1Institute of Marine Sciences, ICM-CSIC, Barcelona, Spain
- 2Italian National Research Council, Institute of Marine Sciences, CNR-ISMAR, Roma, Italy
- 3Institute of Aquaculture Torre de la Sal, IATS-CSIC, Castello, Spain
- 4Aix Marseille Université, Université de Toulon, CNRS, IRD, MIO UM 110, UMR ´ 7294, Marseille, France
Anomalous warming of the upper ocean is increasingly being observed in the Mediterranean Sea. Extreme events, known as marine heatwaves (MHWs), can have a profound impact on marine ecosystems, and their correct detection and characterization are crucial to define future impact scenarios. Here, we analyze MHWs observed over the last 41 years (1982–2022) in the Mediterranean sea surface temperatures (SSTs). We show that the intensification in frequency, intensity, and duration of Mediterranean MHWs in recent years is mainly due to a shift in SST mean that occurred in the last two decades and largely reduced when analyzing detrended SST data. Detrending thus allows the use of a fixed climatology without overestimating MHW properties over time and distinguishes long-term warming (i.e., trend) from transient and abrupt SST changes. Analogous results are also found over a shorter temporal period, by analyzing 13 years (2007–2020) of in situ data collected at different depths (5 to 40 m) at Columbretes Islands. Additionally, the in situ analysis reveals that atmospheric summer heatwaves could affect a layer of 10 m in depth. Lastly, a catalogue of the major Mediterranean MHWs that have occurred since 1982 is presented. This catalogue evidences an exceptionally long-lasting and intense MHW, starting in May 2022 and persisting, at least, until the end of the year, resulting in the event with the highest cumulative intensity just after the well-known 2003 MHW event.
1 Introduction
Marine heatwaves (MHWs) are prolonged and anomalously ocean-warm events, at a given location, during which temperatures strongly depart from typical conditions. Depending on their intensity and duration, these events can have moderate to extreme impacts on living organisms, marine ecosystems, and the related services they provide (e.g., Eakin et al., 2010; Smale and Wernberg, 2013; Smith et al., 2023). Since the first operational definition and characterization of MHWs (Hobday et al., 2016), there has been a growing interest to advance the understanding of their mechanisms, also considering that concurrent global ocean warming seems to strengthen the occurrence and severity of these events (Holbrook et al., 2019; Oliver et al., 2021).
Given that MHWs are identified by ocean temperatures much higher than typical conditions, generally defined upon a reference climatology, the definition of the latter is crucial, as they will strictly affect the detection’s derived results. This consideration becomes even more compelling under the effect of climate change that produces sustained ocean warming, introducing a positive trend in the temperature time series or, in other words, a shift of typical conditions. The problem is quite general and has been recently shown to affect any percentile-based indices of extreme values (Dunn and Morice, 2022). Indeed, various studies indicate that most of the changes in the variability of MHWs, if defined relative to a fixed temperature climatology, are associated with, and driven by, a slow warming term (Frölicher and Laufkötter, 2018; Frölicher et al., 2018; Oliver et al., 2018; Jacox, 2019; Oliver, 2019; Schlegel et al., 2019; Oliver et al., 2021; Ciappa, 2022; Xu et al., 2022). For example, the work of Oliver et al. (2018) reports how trends in the frequency of MHWs are explainable by the trend in sea surface temperature (SST) over more than 80% of the ocean surface area. Similarly, recent research evidenced that the intensification in the main MHW properties, i.e., intensity, duration, and frequency, is mainly due to the historical trend that, accelerating over the past decades, has shifted the mean SST to become increasingly warmer in most ocean regions (Xu et al., 2022). Thus, the temperature records will move further away from the climatological values as time goes by, even in the absence of extreme events (Chiswell, 2022). This aspect has also been discussed in a very recent work (Amaya et al., 2023). The authors clearly argue how the MHW definition based on a fixed climatology (“extreme conditions compared with historical temperatures”) and the MHW definition based on a shifting baseline (“extreme conditions compared with an evolving ‘new normal’ of rising temperatures owing to climate change”) lead to different interpretations and estimates of the properties and trends of present and future MHWs. Additionally, the authors propose to use the term “marine heatwave” with the shifting baseline definition only, and to use instead “total heat exposure” (long-term warming and variability) with the fixed baseline definition in order to distinguish a temporary and exceptionally warm temperature change (concept at the base of the original MHW definition, Hobday et al., 2016) from the slow long-term increase of temperature, respectively.
The influence of a warming trend becomes remarkable in regions particularly sensitive to climate variability and global warming, as is the case of the Mediterranean Sea. Since 1982, the Mediterranean SST has been warming at a rate of ∼0.4°C/decade (Pastor et al., 2020; Pisano et al., 2020), and this trend is likely projected to increase throughout this century (Galli et al., 2017; Soto-Navarro et al., 2020). The Mediterranean Sea has also experienced many strong anomalous events in the last decades showing an increasing trend in MHWs’ occurrences (Hobday et al., 2016; Bensoussan et al., 2019; Darmaraki et al., 2019; Holbrook et al., 2019; Ibrahim et al., 2021), and MHWs’ intensity is projected to increase in the context of future warming scenarios (Galli et al., 2017; Garrabou et al., 2021).
The influence of a warming trend becomes remarkable in regions particularly sensitive to climate variability and global warming, as is the case of the Mediterranean Sea. Since 1982, the Mediterranean SST has been warming at a rate of ∼0.4°C/decade (Pastor et al., 2020; Pisano et al., 2020), and this trend is likely projected to increase throughout this century (Galli et al., 2017; Soto-Navarro et al., 2020). The Mediterranean Sea has also experienced many strong anomalous events in the last decades showing an increasing trend in MHWs’ occurrences (Hobday et al., 2016; Darmaraki et al., 2019; Holbrook et al., 2019 59; Bensoussan et al., 2019; Ibrahim et al., 2021), and MHWs’ intensity is projected to increase in the context of future warming scenarios (Galli et al., 2017; Garrabou et al., 2021).
The aim of this work is to evaluate the trend-induced effects on Mediterranean MHW properties and provide some guidance in the application of a well-known MHW detection method (Hobday et al., 2016). To this purpose, this detection technique is applied to both original and detrended SST data (hereafter, original and detrended detections), the latter obtained by removing the trend. Both detections are based on fixed climatology baselines over the same period. The purpose of detrending is to separate the effect of continuous warming from abrupt variations. The analyses are carried out by using the Copernicus Marine Service Mediterranean multi-year SST dataset covering the period 1982–2021 and extended to 2022 with the near real-time dataset. The impact of the trend is evidenced in MHWs by analyzing their evolution in terms of frequency, intensity, and duration over the whole 41-year period. We also document a catalogue of the major MHW events that occurred in the Mediterranean Sea during 1982–2022. The catalogue presents 20 MHW events that occurred during the last four decades and highlights the main differences found with the original and detrended detection. In particular, this catalogue identifies a very recent and exceptionally long-lasting MHW event that started in May 2022 and persisted, at least, until December 2022. Lastly, the importance of detrending also for short temporal series is shown by analyzing the Columbretes Islands in situ data collected at depths between 5 and 40 m over the 2007–2020 period.
2 Materials and methods
2.1 Observational datasets
2.1.1 The Copernicus Mediterranean multi-year SST product
This product provides a stable and consistent long-term, namely, multi-year (MY), SST dataset over the Mediterranean Sea specifically designed for climate applications and distributed within the Copernicus Marine Service (see, e.g., Le Traon et al., 2019). It consists of daily optimally interpolated (level 4, L4) satellite-based estimates of the foundation SST (namely, the temperature free, or nearly free, of any diurnal cycle) at a 0.05° resolution grid covering the period from 1 January 1982 to the present (currently up to 6 months before real time). The product (hereafter, Copernicus MY product) is built from a consistent reprocessing of the collated level 3 (merged single-sensor, L3C) climate data record provided by the ESA Climate Change Initiative (CCI) and the Copernicus Climate Change Service (C3S) initiatives (Merchant et al., 2019). This product is freely available through the Copernicus Marine Service catalogue (doi.org/10.48670/moi-00173). Since 2022 was not yet available as a complete year at the time of this study, the MY product has been extended to include 2022 by using the Copernicus Mediterranean near real-time (NRT) SST product (doi.org/10.48670/moi-00172). This product is the operational counterpart of the MY one and provides daily Mediterranean L4 maps of foundation SST reaching one day before real time (Buongiorno Nardelli et al., 2013).
2.1.2 The Columbretes Islands in situ time series
The “Columbretes Islands (Illa-Grossa)” station, located at 39°53′30″N, 0°40′16″E (yellow pointer in Figure 1) in the Columbretes Islands Marine Reserve (CIMR), provides hourly sea temperatures from 5 to 40 m depth (at 5-m intervals). These data are managed by the CIMR and hosted in the regional climate change coastal observation network T-MEDNet (t-mednet.org). Data at depths of 5, 15, 20, 25, and 30 m cover 13 years (10/2007–10/2020), those at 10 and 35 m cover 10 years (03/2009–10/2020), and the 40-m layer covers the 10/2008–10/2020 period. The times series are neither continuous nor uniform in depth (i.e., data are not always available at all depths at the same time). However, the total gaps at each depth level do not exceed 43 h and have been filled using the average of the days and hours of the rest of the series.
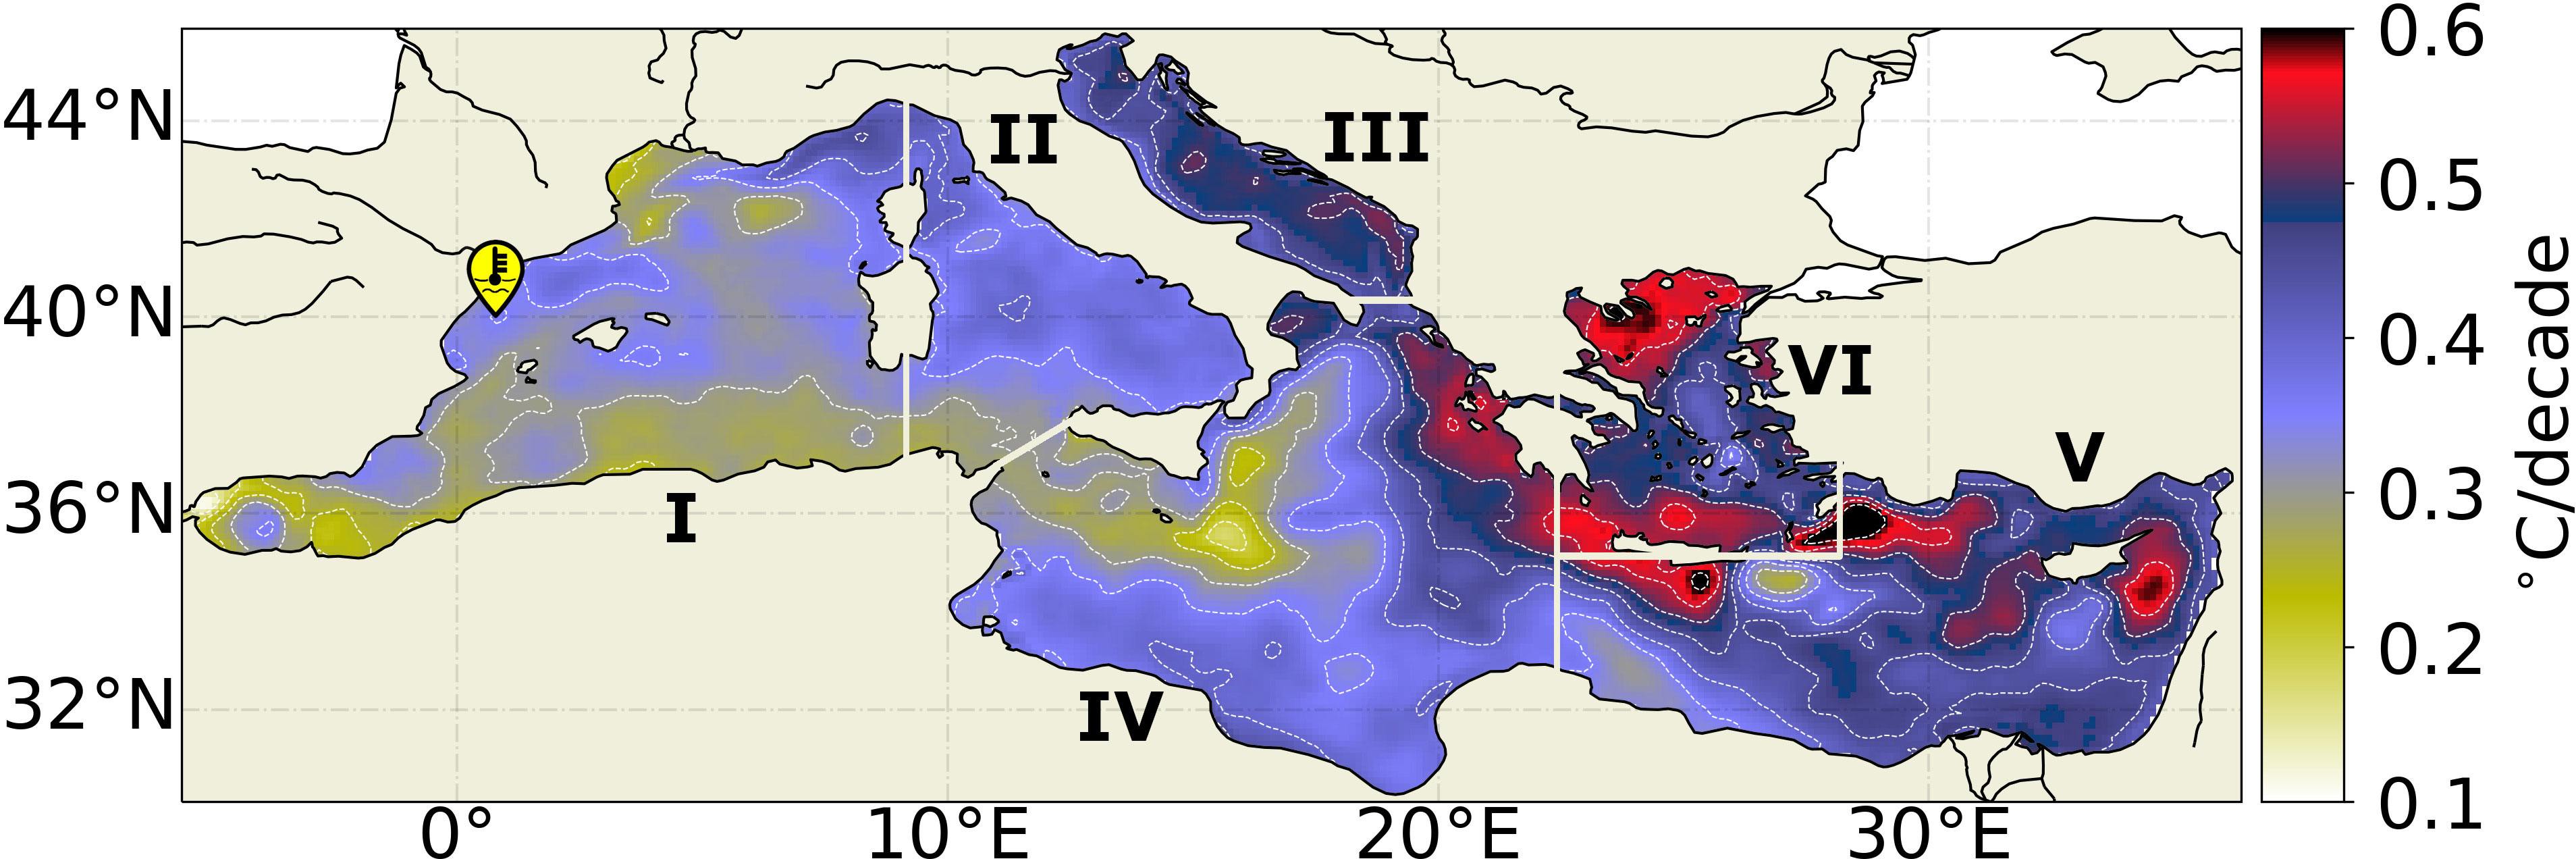
Figure 1 Spatial map of the Mediterranean SST trend (°C/decade) over 1982–2021. The area is divided into sub-basins: I, Western Mediterranean Sea; II, Tyrrhenian Sea; III,Adriatic Sea; IV, Ionian Sea; V, Levantine Sea; and VI, Aegean Sea. The white isolines are plotted every 0.05°C/decade. The yellow pointer corresponds to the Columbretes Islands station. The trend has been computed with SSA by using the Copernicus Mediterranean MY SST dataset.
2.2 Separating long-term trend and extreme variability
To separate the warming trend contribution in the MHW analysis, we apply a detrending pre-processing step before computing the baseline climatology. This consists in computing the pixel-wise trend component over the whole period (see subsection 2.3), removing it from the SST time series (obtaining what we call detrended data) and pursuing detection on such series. In formulas, if is the original SST time series at a given location, the detrended time series, , is computed as
where is the trend component, which is a continuous interannual trend signal, whose slope gives the trend estimate. Hereafter, detection over and will be denoted as original and detrended, respectively. For both time series, the fixed climatology baseline is computed as the daily average over the whole period 1982–2021 (section 2.3). In practice, the average of each calendar day is calculated across all years and the climatology then coincides with the annual cycle.
The trend component has been computed using Singular Spectrum Analysis (SSA), a non-parametric multivariate statistical method (Golyandina and Nekrutkin, 2001; Hassani, 2007; Golyandina and Zhigljavsky, 2013). SSA is a consolidated technique used to identify the main patterns of variability in a given set of observations and has been successfully applied in many contexts including climate series (Ghil and Vautard, 1991; Schoellhamer, 2001; Macias et al., 2014; Beşel and Tanir Kayikçi, 2020; Biriukova et al., 2021; Yi and Sneeuw, 2021). SSA extracts the minimum independent information by which the entire original dataset can be reconstructed. The trend component is identified through the first singular value. The decomposition has been performed using the python kernel provided by D’Arcy (2018).
Additionally, the Mann–Kendall test has been used to assess whether a monotonic upward or downward trend in exists against the null hypothesis of no trend (Mann, 1945; Kendall, 1948), and Sen’s method (Sen, 1968) is applied to estimate the slope of . The trend, obtained as the median of the slopes of all pairs of sample points, provides similar values to those obtained by linear regression. The significance level for the trend estimate has been fixed at 95% ().
Since the SSA decomposition is computationally expensive, the Copernicus MY product has been regridded from 0.05° (original spatial resolution) to 0.125° resolution by using a median resample. The reduction of the spatial resolution does not have a large impact on MHW detection since they are relatively large-scale processes. Lastly, trend and climatology have been computed from the MY product, thus over the period 1982–2021 (Figure 1), while MHW detection has been extended to 2022 by using the NRT product.
The spatial pattern of the Mediterranean SST trend (Figure 1) shows a warming sea where the Adriatic and the eastern basin (Ionian, Aegean, and Levantine) are warming faster than the western basin, which is consistent with recent findings (Pastor et al., 2020; Pisano et al., 2020; Garrabou et al., 2021). In particular, the Aegean–Levantine Sea and the Adriatic Sea are characterized by the most intense trend values ( C/decade). Lower values ( C/decade) are observed in the Gulf of Lion, an area characterized by winter deep water formation events, and from the Alboran Sea (east of Gibraltar) up to the Ionian Sea along the African coast, a pattern that overlaps the spreading of Atlantic waters.
2.3 Climatology definition and MHW detection method
The reference baseline climatology adopted here is defined as the daily pixel-wise average along the whole period of the MY product (1982–2021), following the procedure described by Hobday et al. (2016) and applying a smoothing window of days centered on the time of year, from which the climatological mean and threshold are calculated, as follows:
where and denote starting and ending years of the period under analysis, indicates the day of the year, and is the time step referring to the day of year (e.g., if is 2nd of March and is 2001, then is the time step referring to 2nd of March 2001). For the original detection, is the original pixel-wise SST data, while for the detrended detection, this is substituted with the corresponding detrended pixel-wise SST series given in Equation 1.
Given the baseline climatology as the reference at each grid point, an MHW is detected whenever an SST value (original or detrended) at each grid point exceeds the 90th percentile threshold for at least 5 days (Hobday et al., 2016). If this occurs, a set of metrics characterizing an MHW event can be computed. In the present study, the following are considered:
• Duration of the event, defined as the pixel-wise number of days for which SST exceeds the 90th percentile for each event;
• Frequency, defined as the pixel-wise count of events over the whole period;
• Maximum and mean intensity, defined as the pixel-wise maximum and average of SST anomalies during each event; and
• Cumulative intensity, the pixel-wise integral of the intensity over the duration of the event and expressed in °C day.
From these metrics, temporally and/or spatially averaged information can be given and, thus, a selection criterion of events can be applied, based on the definition of spatial and temporal minimum thresholds on the overall pixel-wise events detected. A severity index of each event can be given throughout four categories (moderate to extreme), identified in terms of multiples of the local difference between the 90th percentile and the climatological values (Hobday et al., 2018).
A catalogue of events is proposed in Table 1, obtained by retaining events impacting at least 10% of the Mediterranean surface, lasting a minimum of 30 days, and reaching the severe category (at least for just 1 day). This choice allows highlighting large-scale and long-lasting MHWs, which reasonably may have substantial impacts on the marine ecosystem. To not exclude shorter but impacting events, the ones having a duration of at least 25 days and persisting over the same area, but separated by less than a week from the longer ones, have also been added.
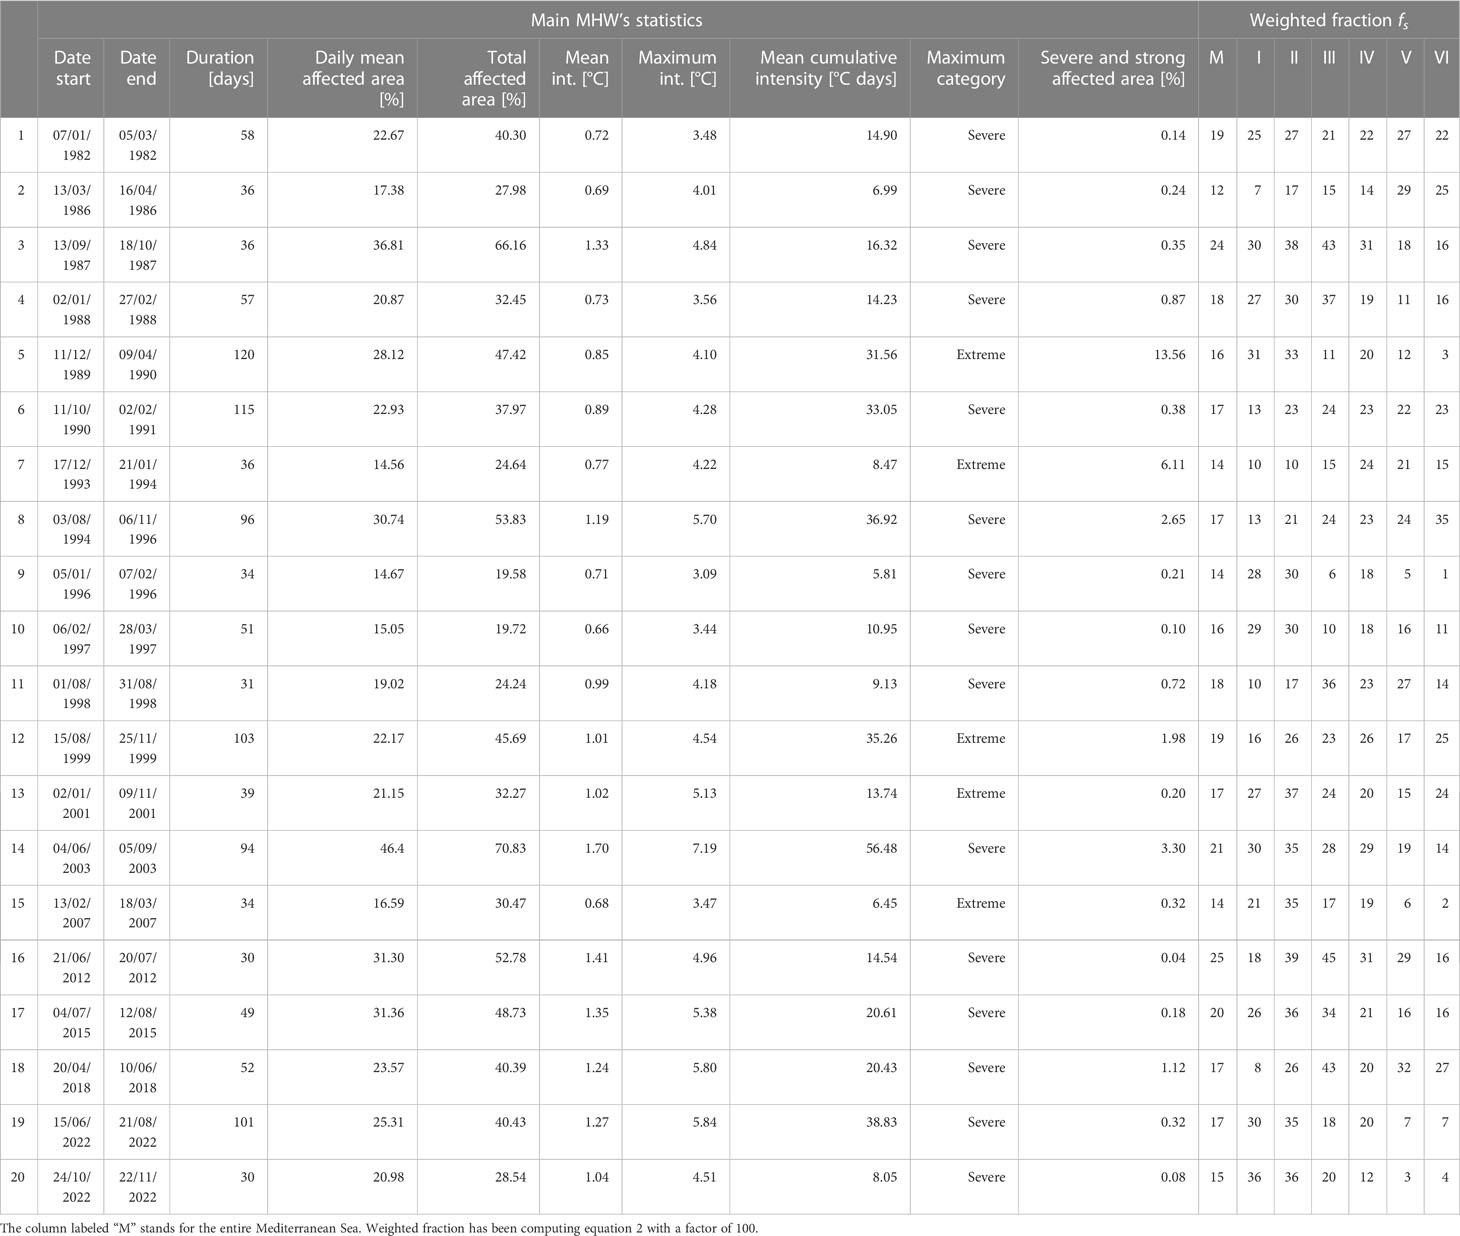
Table 1 Catalogue of the main MHW events detected in the Mediterranean Sea during the period 1982–2022 based on the detrended Copernicus MY dataset (see Figure 1 for sub-basins I–VI schematic definition).
3 Results
3.1 Changes in anomalies distribution: impact of the trend on identifying extremes
We begin by quantifying the impact of a trend on identifying extreme events. To do this, we computed the probability density function (PDF) of daily SST anomalies derived from both original and detrended data, split into two equally populated datasets over the whole Mediterranean Sea and for the different sub-basins (Figure 2). The first dataset corresponds to the period from the beginning of 1982 to half of 2002 while the last one covers the remaining period until the end of 2022.
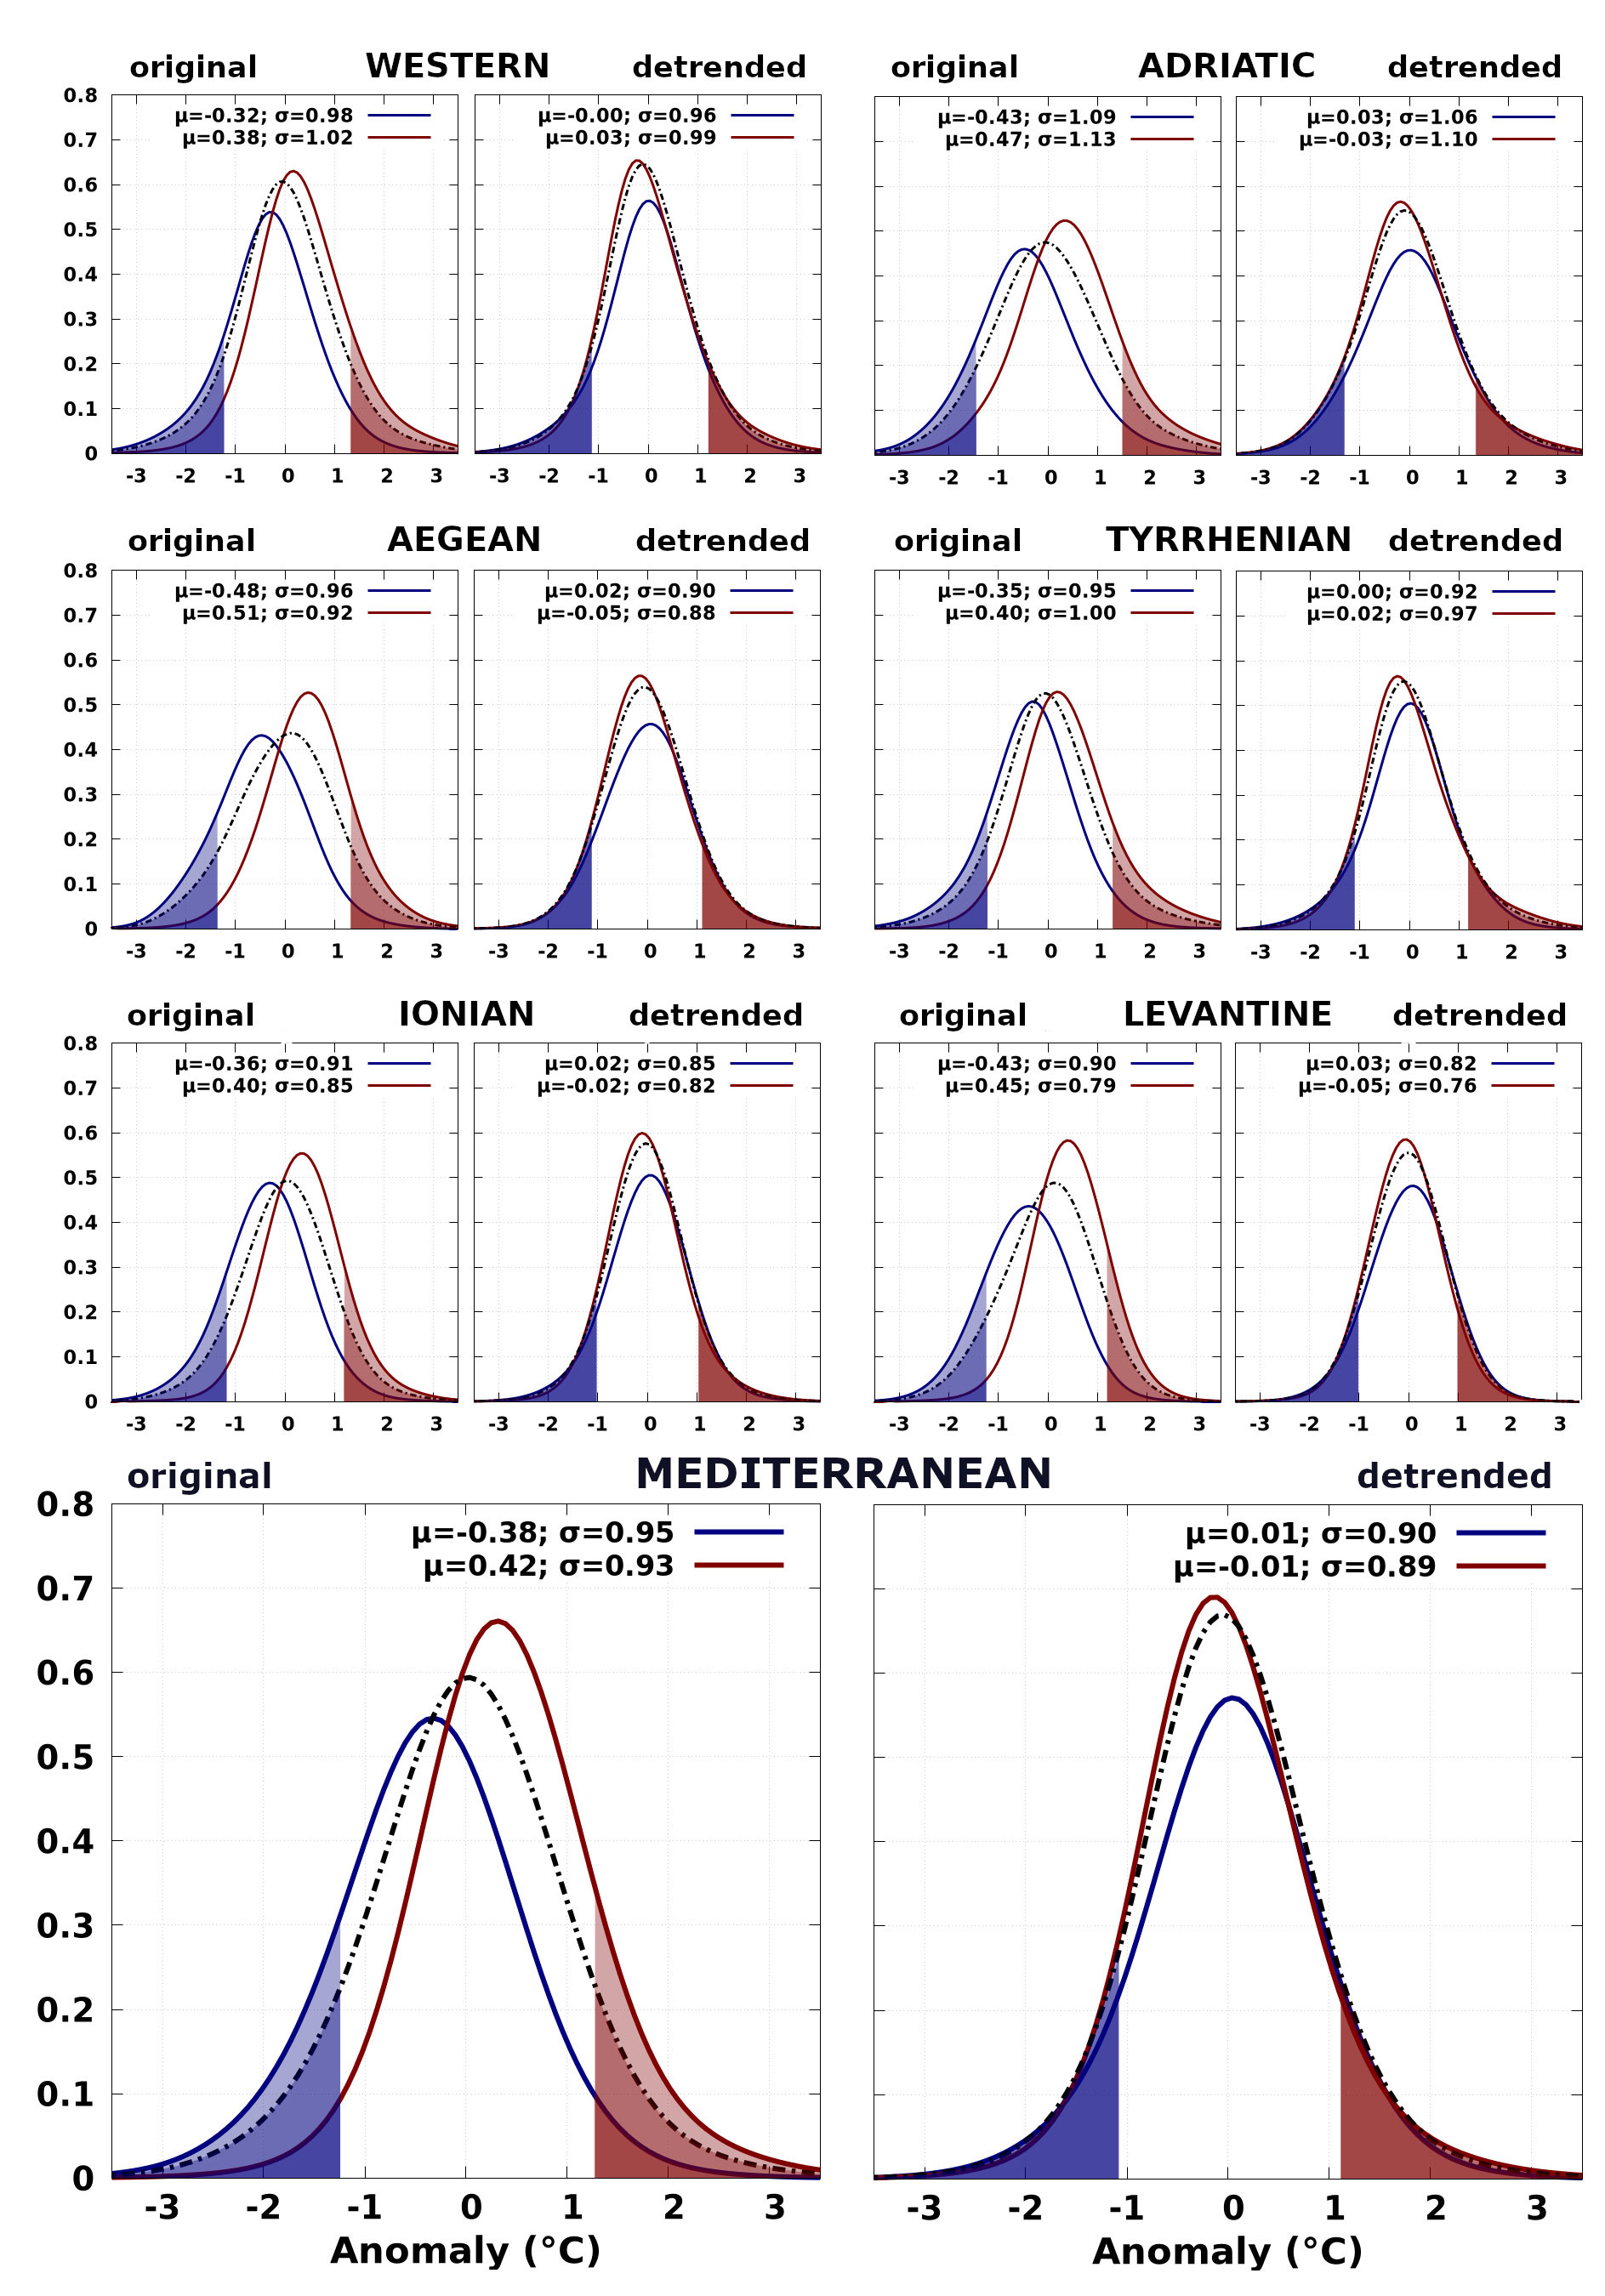
Figure 2 Probability density functions (PDFs) of daily SST anomalies per sub-basin and for the Mediterranean Sea as a whole derived from original and detrended time series (left panels: original distributions; right panels: detrended distributions). For both cases, the anomalies’ distribution is divided into the first (1982–2001, blue lines) and last (2002–2022, red lines) two decades, and considered during the whole period (1982–2022, black dashed lines). The shaded areas correspond to the area above the 90th percentile (red dashed area) and below 10th percentile (blue dashed area). The mean and standard deviation associated with each PDF is reported in the legends.
PDFs of original anomalies clearly evidence a shift in mean SST between the two periods. This shift is well evident either considering the Mediterranean Sea as a whole or its sub-basins. The mean anomaly increases from the first to the second period, and this holds for both the entire area and the sub-basins. The amplitude of the shift is also enhanced in correspondence with the sub-basins experiencing higher trend patterns (Aegean, Levantine, and Adriatic, see also Figure 1). This effect disappears when considering PDFs of detrended anomalies, which instead reveal a generally more stable picture when comparing the two temporal intervals.
PDFs of original and detrended data evidence a decrease in variability towards more recent years though the magnitude of this change is less pronounced compared to that of the shift in the mean and less marked for the detrended data. Looking at the Mediterranean Sea, the standard deviation () switches from , for the 1982–2002 period, to a for the 2002–2022 period, when considering original anomalies. Conversely, a smaller change is seen in PDFs of detrended anomalies, switching from to a . Analogous considerations apply to the eastern Mediterranean sub-basins (Ionian, Aegean, and Levantine) where the standard deviation between the two consecutive periods also decreases. The Levantine basin is the most evident case, experiencing a decrease of % in the standard deviation in the original case in front of a % for detrended anomalies. In contrast, the standard deviation between the two periods increases in the rest of the Mediterranean Sea (Western, Adriatic, and Tyrrhenian). Lastly, the shape of PDFs also presents differences depending on trend removal or not, highlighting the effect of trend in widening the distributions. Overall, this first result shows that the Mediterranean SST trend is responsible for a shift to warmer SST anomalies, with the consequence of increasing the likelihood of extreme warm temperature occurrences.
3.2 Changes in MHW statistics
Here, the objective is to quantify the impact of the observed trend on the intensity, frequency, and duration of Mediterranean MHWs. To achieve this, the Hobday method (section 4.3) has been applied to both original and detrended SST time series, and the results obtained from the two approaches are shown below.
The yearly averaged time series of the main MHW events metrics, obtained from the original and detrended detections, clearly evidence the different impact of the two approaches (Figure 3). When the original detection is applied, a clear positive and statistically significant trend is found for nearly all MHWs statistics (see also Table 2), such as the average MHW duration (+1.54 days/decade), the portion of Mediterranean affected area (+3.61%/decade, daily average), and the mean annual frequency of events (+0.74 events/decade), cumulative intensity (+3.39°C day/decade), and maximum intensity (+0.26°C/decade). The situation is very different for the detrended case, where none of the metrics show statistically significant trends, thus appearing more stable over the whole period. This result is consistent with what was found in the previous section (section 3.1); that is, the increase in MHW occurrence is mainly driven by a temperature trend.

Figure 3 Yearly-averaged time series of the MHWs’ metrics of the original (left panels) and detrended approaches (right panels). Green dashed lines indicate the linear trend whose value is reported in the legends and computed using the Mann-Kendall test. (A) Mean duration of MHW. (B) Area affected by MHW: fraction of the Mediterranean Sea affected every year (gray line and scale at the right axis) and daily averaged fraction (black line and scale at the left axis). (C) Mean events count for affected cells. (D) Mean cumulative intensity of events. (E) Maximum intensity of events, averaged yearly.
Additionally, looking at the mean annual metrics (Table 2), there is no significant difference if these are obtained with the original or detrended approach. Indeed, for both cases, the mean frequency is estimated in events per year, with a mean duration of days, a maximum intensity of C, and a spatial extent of % the Mediterranean basin. The cumulative intensity is the sole metric that evidences a difference of C day between the original and detrended detection. In practice, the removal of the trend redistributes more uniformly to the 90th percentile, thus avoiding assigning to the metrics lower values during the first years and higher during the last ones.
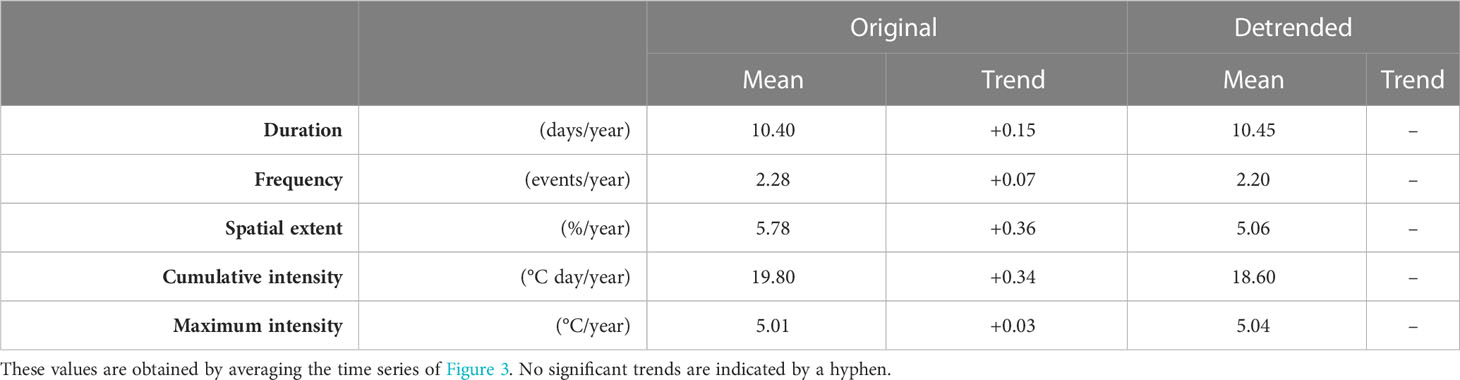
Table 2 Mean annual MHW metrics along with their trend characterizing the Mediterranean Sea over the period 1982–2022. .
This concept is further investigated by analyzing three years (1990, 2003, and 2022) corresponding to the beginning, middle, and end of the period (Figure 4). When the original detection is applied, the daily affected area shows a drastic increase from the beginning to the end of the period, changing from a mean value of 4.6% (in 1990) to 26.9% (in 2022). When detrending is applied, the affected area is respectively higher in 1990 (16.2%) and lower in 2022 (12.5%) with respect to the original detection. In the middle (2003), the behavior is similar for both procedures.
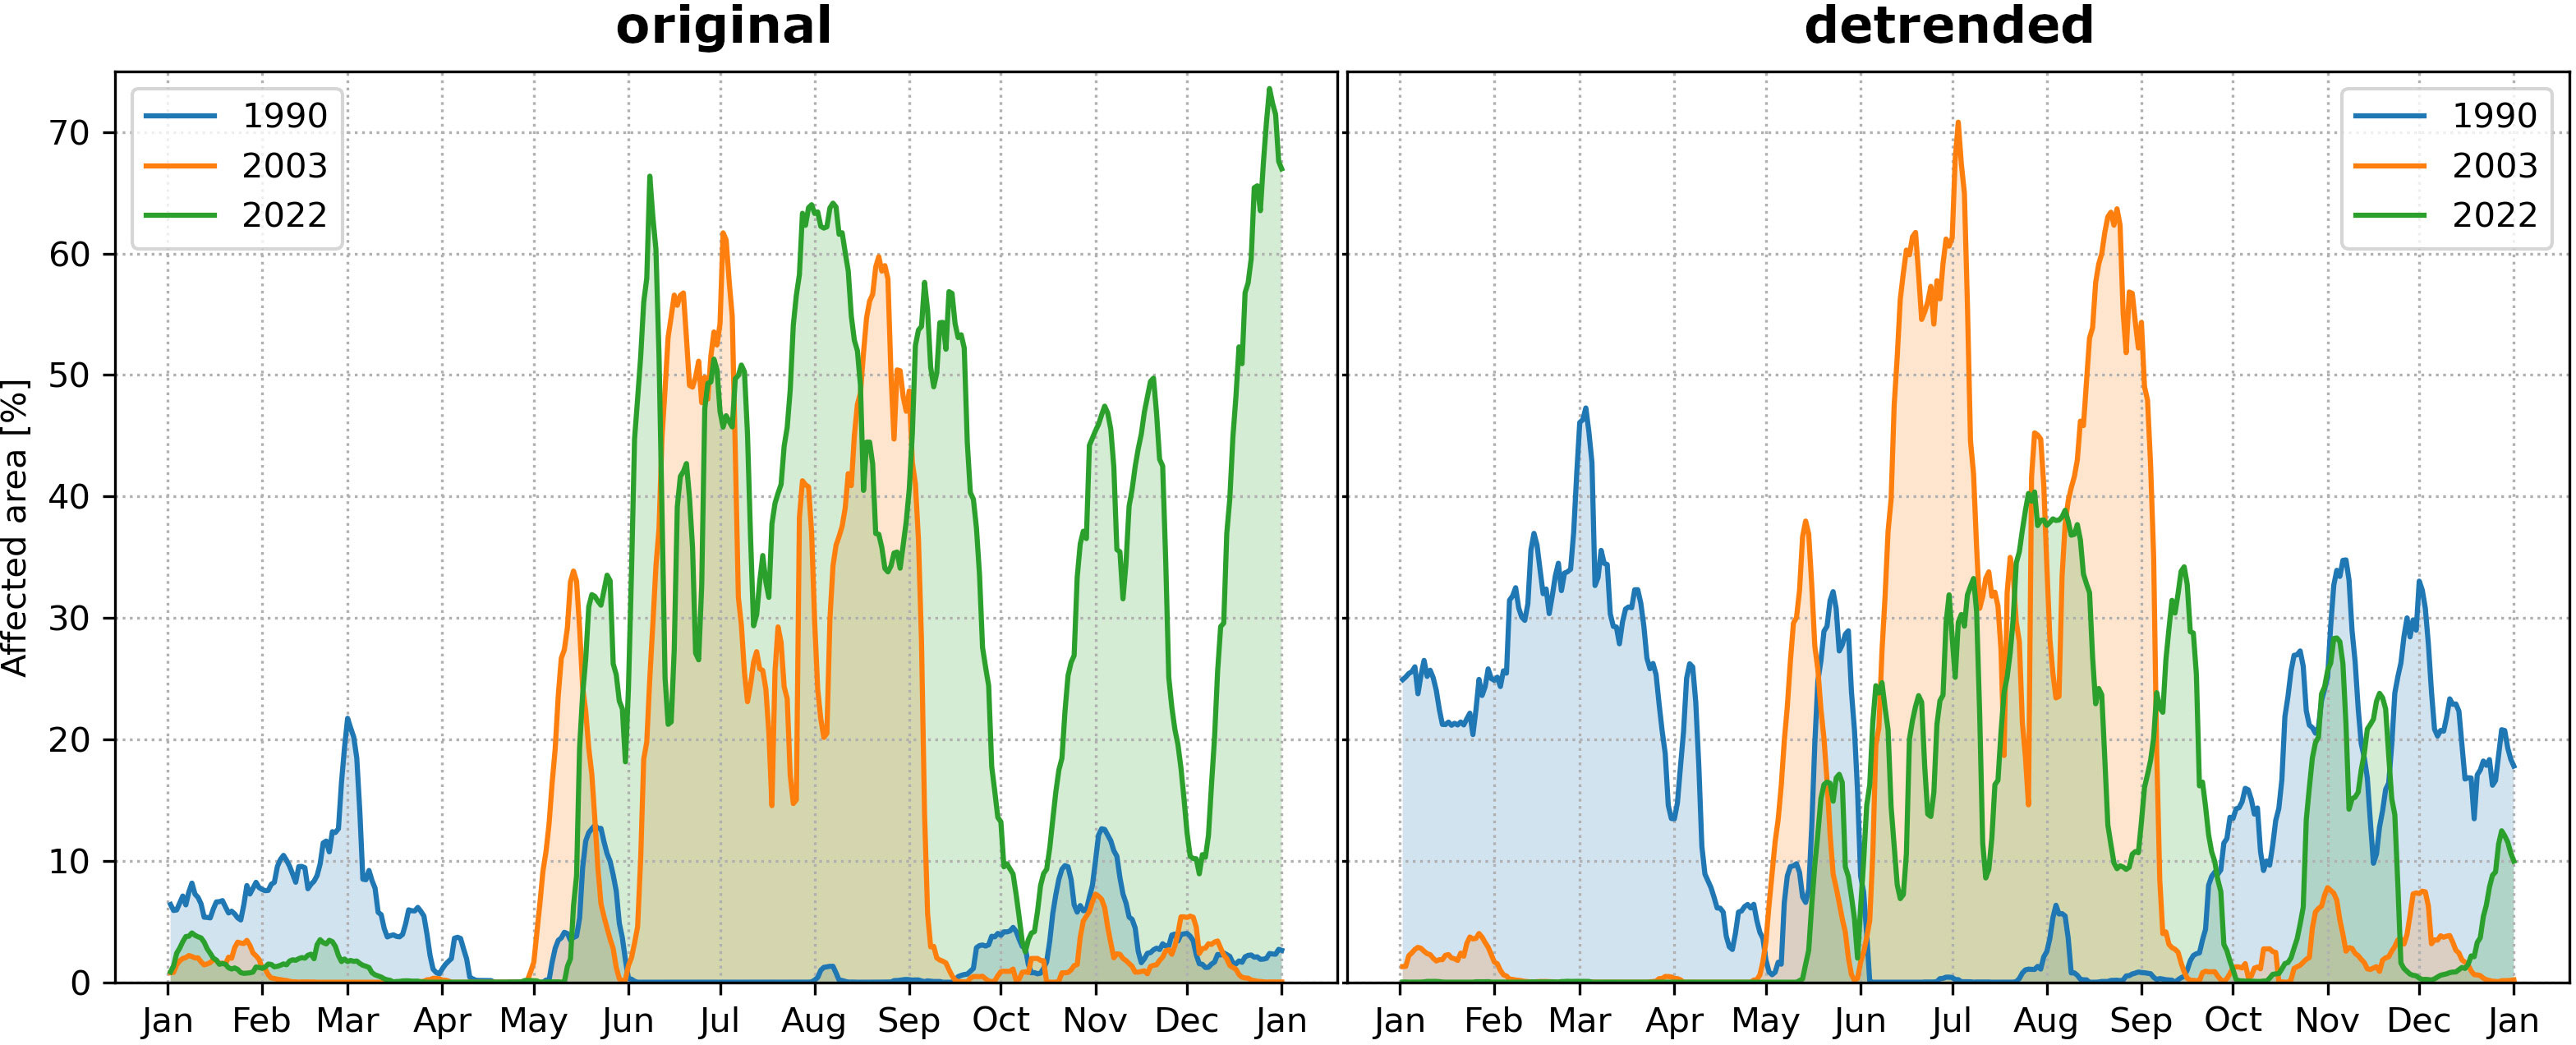
Figure 4 Daily area affected by MHWs for 3 years (1990, 2003, and 2022) chosen as representative of the beginning, middle, and end of the 1982–2022 period. Left: using original detection. Right: using detrended detection.
3.3 The Mediterranean MHW catalogue (1982–2022)
Twenty major events have been found from 1982 to 2022 in the Mediterranean Sea (Table 1). Among them, the one affecting the largest area occurred during the summer of 2003 (hereafter, MED-MHW-2003). The daily mean Mediterranean Sea area impacted during this event was 46.41%. During the evolution of this strong event, 70% of the Mediterranean Sea presented at some point warm anomalies, as the cumulative area affected during the event. In practice, MED-MHW-2003 impacted all sub-basins and was characterized by a mean intensity of 1.70°C and a maximum of 7.19°C during its duration of almost 100 days. Although the event is not the longest, nor does it appear categorized as extreme, the MED-MHW-2003 event results with the highest cumulative intensity (56.48°C day).
The most recent observed events (MED-MHW-2022), starting in May 2022 and persisting at least until December 2022, is divided into two major events taking place in summer and autumn (see Figure 4 and Table 1 MHW labeled 19 and 20). The summer MED-MHW-2022 event lasted a few days more than MED-MHW-2003. This event has been categorized as severe and, just after MED-MHW-2003, is the second with the largest cumulative intensity (38.83°C day) and maximum intensity (5.84°C).
MED-MHW-1989/90 and MED-MHW-1990/91 are the longest-running events that took place. Their duration was 120 and 115 days, respectively. More than 47% of the Mediterranean Sea was affected by the extreme MED-MHW-1989/90 event having a severe impact on 13.54% of the basin’s surface.
The impact of an MHW in a given region is related to the total intensity acting over it during the period of persistence of the event. In order to compare the impact of an MHW in the different sub-basins regardless of their total size, it is advisable to weigh the sum of the intensities by the duration of the MHW () and the sub-basin area (). Additionally, by weighting this magnitude with a measure of its dispersion, we obtain an approximation of its relative variability. The simplest measure of the dispersion () is obtained from the total range of intensity affecting the region. A magnitude in such a way provides insight into how many single intensity values are close to the intensity maximum across different sub-basins. Therefore, let be the time steps interested by a major event. We define the intensity normalization factor as follows:
where is the MHW intensity at the time step at location of a given sub-basin. Therefore, the weighted fraction of each sub-basin characterized by the MHW can be computed as:
To have a simultaneous visualization of the main metrics (maximum and cumulative intensity, mean and affected area, and duration) associated with each catalogue event, a spider diagram is provided (Figure 5). The events reported in this diagram also include those computed with original detection and have been grouped over two periods, namely, October–March and April–September, which can be considered respectively representative of winter and summer conditions. In the spider plot, the larger the area covered by the polygon (associated with a MHW), the stronger the event. The diagram evidences that summer MHWs usually occur with higher cumulative intensity, maximum intensity, and mean affected area than winter ones. Additionally, MHW events are found over the whole 1982–2022 period when detrending is applied, whereas the evidence of MHW events in the original detection starts from the second half of the period (after 2002). This result extends what was found by analyzing three specific years, chosen as representative of the beginning, center, and end of a time series (Figure 4). The most recent MED-MHW-2022 event appears to be as relevant as the MED-MHW-1989/90 in terms of daily percentage of affectation area.
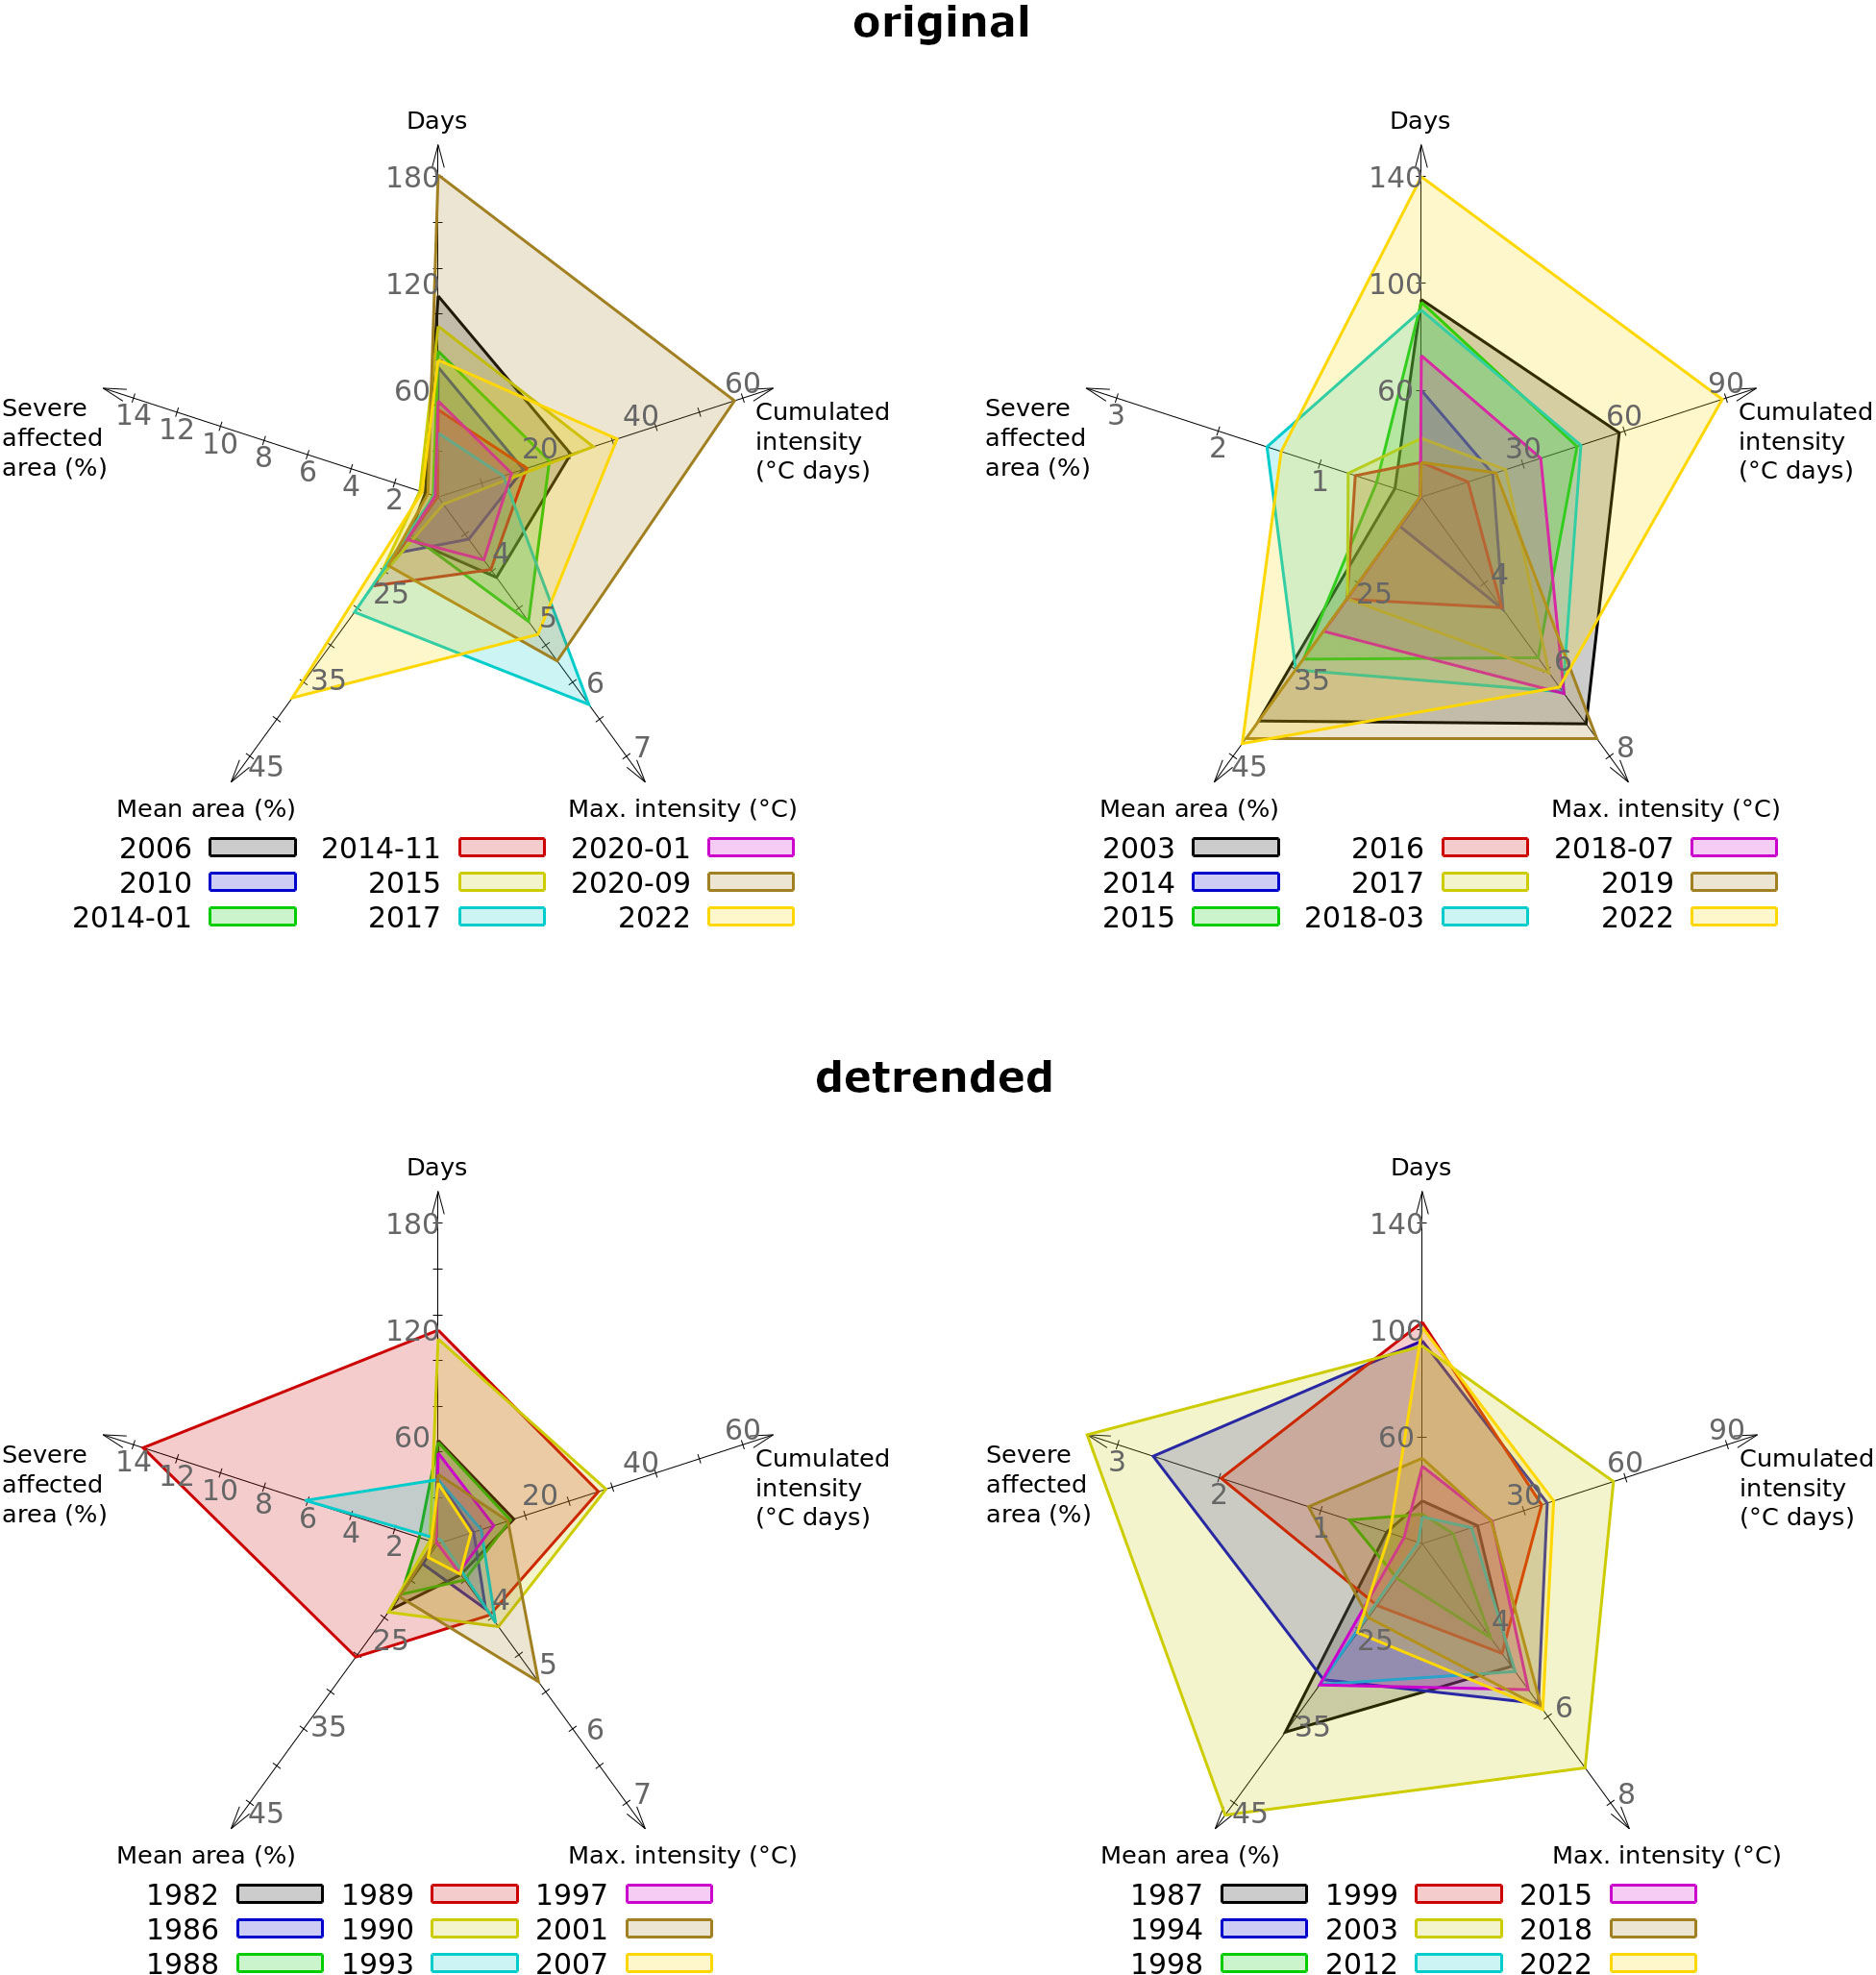
Figure 5 Main MHW events. Upper images: original detection. Lower images: detrended detection. Left: during winter (October-March). Right: during summer (April-September).
Based on original detection, the MED-MHW-2022 is found to have the most impact, covering the largest area in the spider diagram (Figure 5), followed by the MED-MHW-2003 and MED-MHW-2018 events. Based on detrended detection, the above-cited list of more impacting events changes by showing the MED-MHW-2003 as the strongest one, followed by the MED-MHW1989/90 event, while the MED-MHW-2022 appears to be an exceptional persisting event (from May 2022 to at least January 2023) though interrupted during the first half of October and December 2022 (see also Figure 4).
3.4 Detrending short temporal series in the upper-most ocean layer
The original and detrended detections are here applied to in situ data collected at different depths (5 to 40 m) from the Columbretes Islands station (see Figure 1) The Copernicus MY data have also been used to detect MHWs at the surface over the station location and to compute the SST trend over the period 2008 to 2020 (to account for complete years), estimated in 0.097°C/year.
The time series of 12 complete years (depths of 5, 15, 20, 25, and 30 m), 11 years (40 m), and 10 years (10 and 35 m) show significant positive trends, respectively, estimated in 0.12, 0.13, 0.13, 0.13, 0.14, 0.11, 0.08, and 0.11°C/year. Results of the original detection evidence a positive trend in the number of annual days experiencing MHWs at 5 m (61 days/decade), 20 m (23 days/decade), 30 m (37 days/decade), and 40 m (47 days/decade), which instead is not present (i.e., no significant trend) in the detrended temporal series (Figure 6). When detrending is applied, an abrupt increment in the number of days having MHW is found during the first year (2008). This effect is also visible in the temperature time series (Figure 6A). In this case, the detrended time series exceeds the 90th percentile during February and April 2008, thus detecting an MHW, while the original one does not reveal any event being below this threshold.
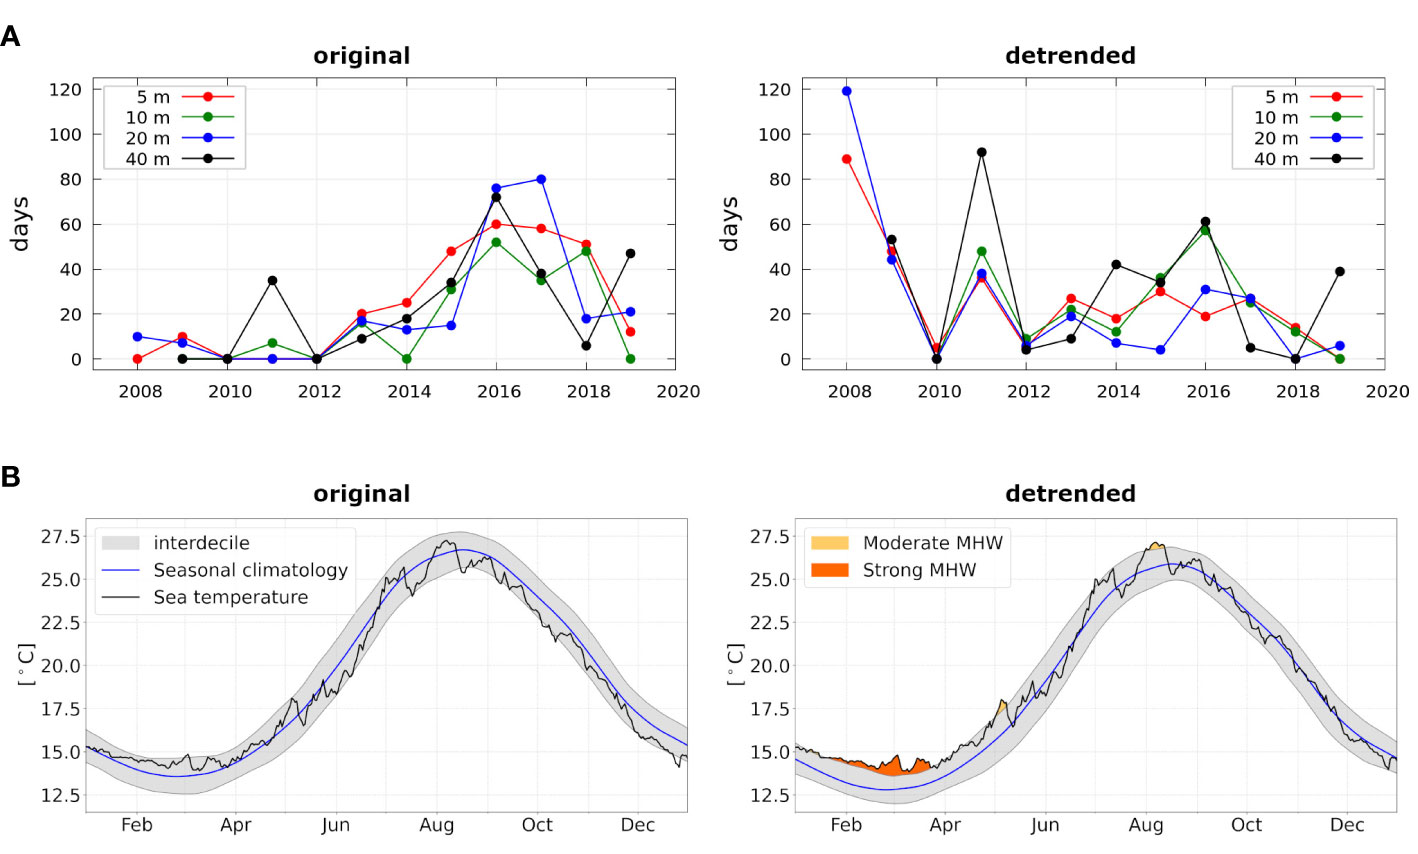
Figure 6 Evolution of MHW for Columbretes dataset. (A) Number of days by year experiencing MHWs at different depths according to in situ data. (B) Detail of the 2008 MHW events at 5 m depth exceeding the 90th threshold.
A specific analysis has been carried out for the year 2017 (Figure 7) when the Northwestern Mediterranean Sea experienced several strong MHW events during summer (Bensoussan et al., 2019). The first two MHW events are detected by the original method, both on the surface and in the lower layers, in April (strong event) and at the end of May (moderate event) by the original method. They are largely reduced, and even undetected in some depths with the detrended approach. However, the two methods agree on the strong MHW that occurred in June 2017, from the surface down to 15 m depth. The event persists as strong down to 10 m and is practically extinguished at a 15-m depth. An exceptionally intense atmospheric heatwave (AHW) occurred during the same month affecting southern Europe (Otto et al., 2017; Kew et al., 2019), and was the earliest European summer mega-heatwave over the period 1948–2017 (Sánchez-Benítez et al., 2018). The 2017 AHM could have thus triggered the MHW and, considering that the Mediterranean Sea mixed layer is never thinner than at 10 m during summer (Houpert et al., 2015), it has also affected the layers below the surface. The evolution in depth of the MHW detected in June in the 0–10 m range (Figure 8) is consistent with such atmospheric origin. It is evident how the sea surface starts heating around June 9 (the MHW starts on June 12) and the water gradually warms below the surface down to 10 m. Approximately 10 days later, the water column cools rapidly. A deeper layer of warm water (between 15 and 20 m) at the beginning of the month that seems to be not correlated to surface warming is also evident, suggesting a different origin, which would require a dedicated analysis
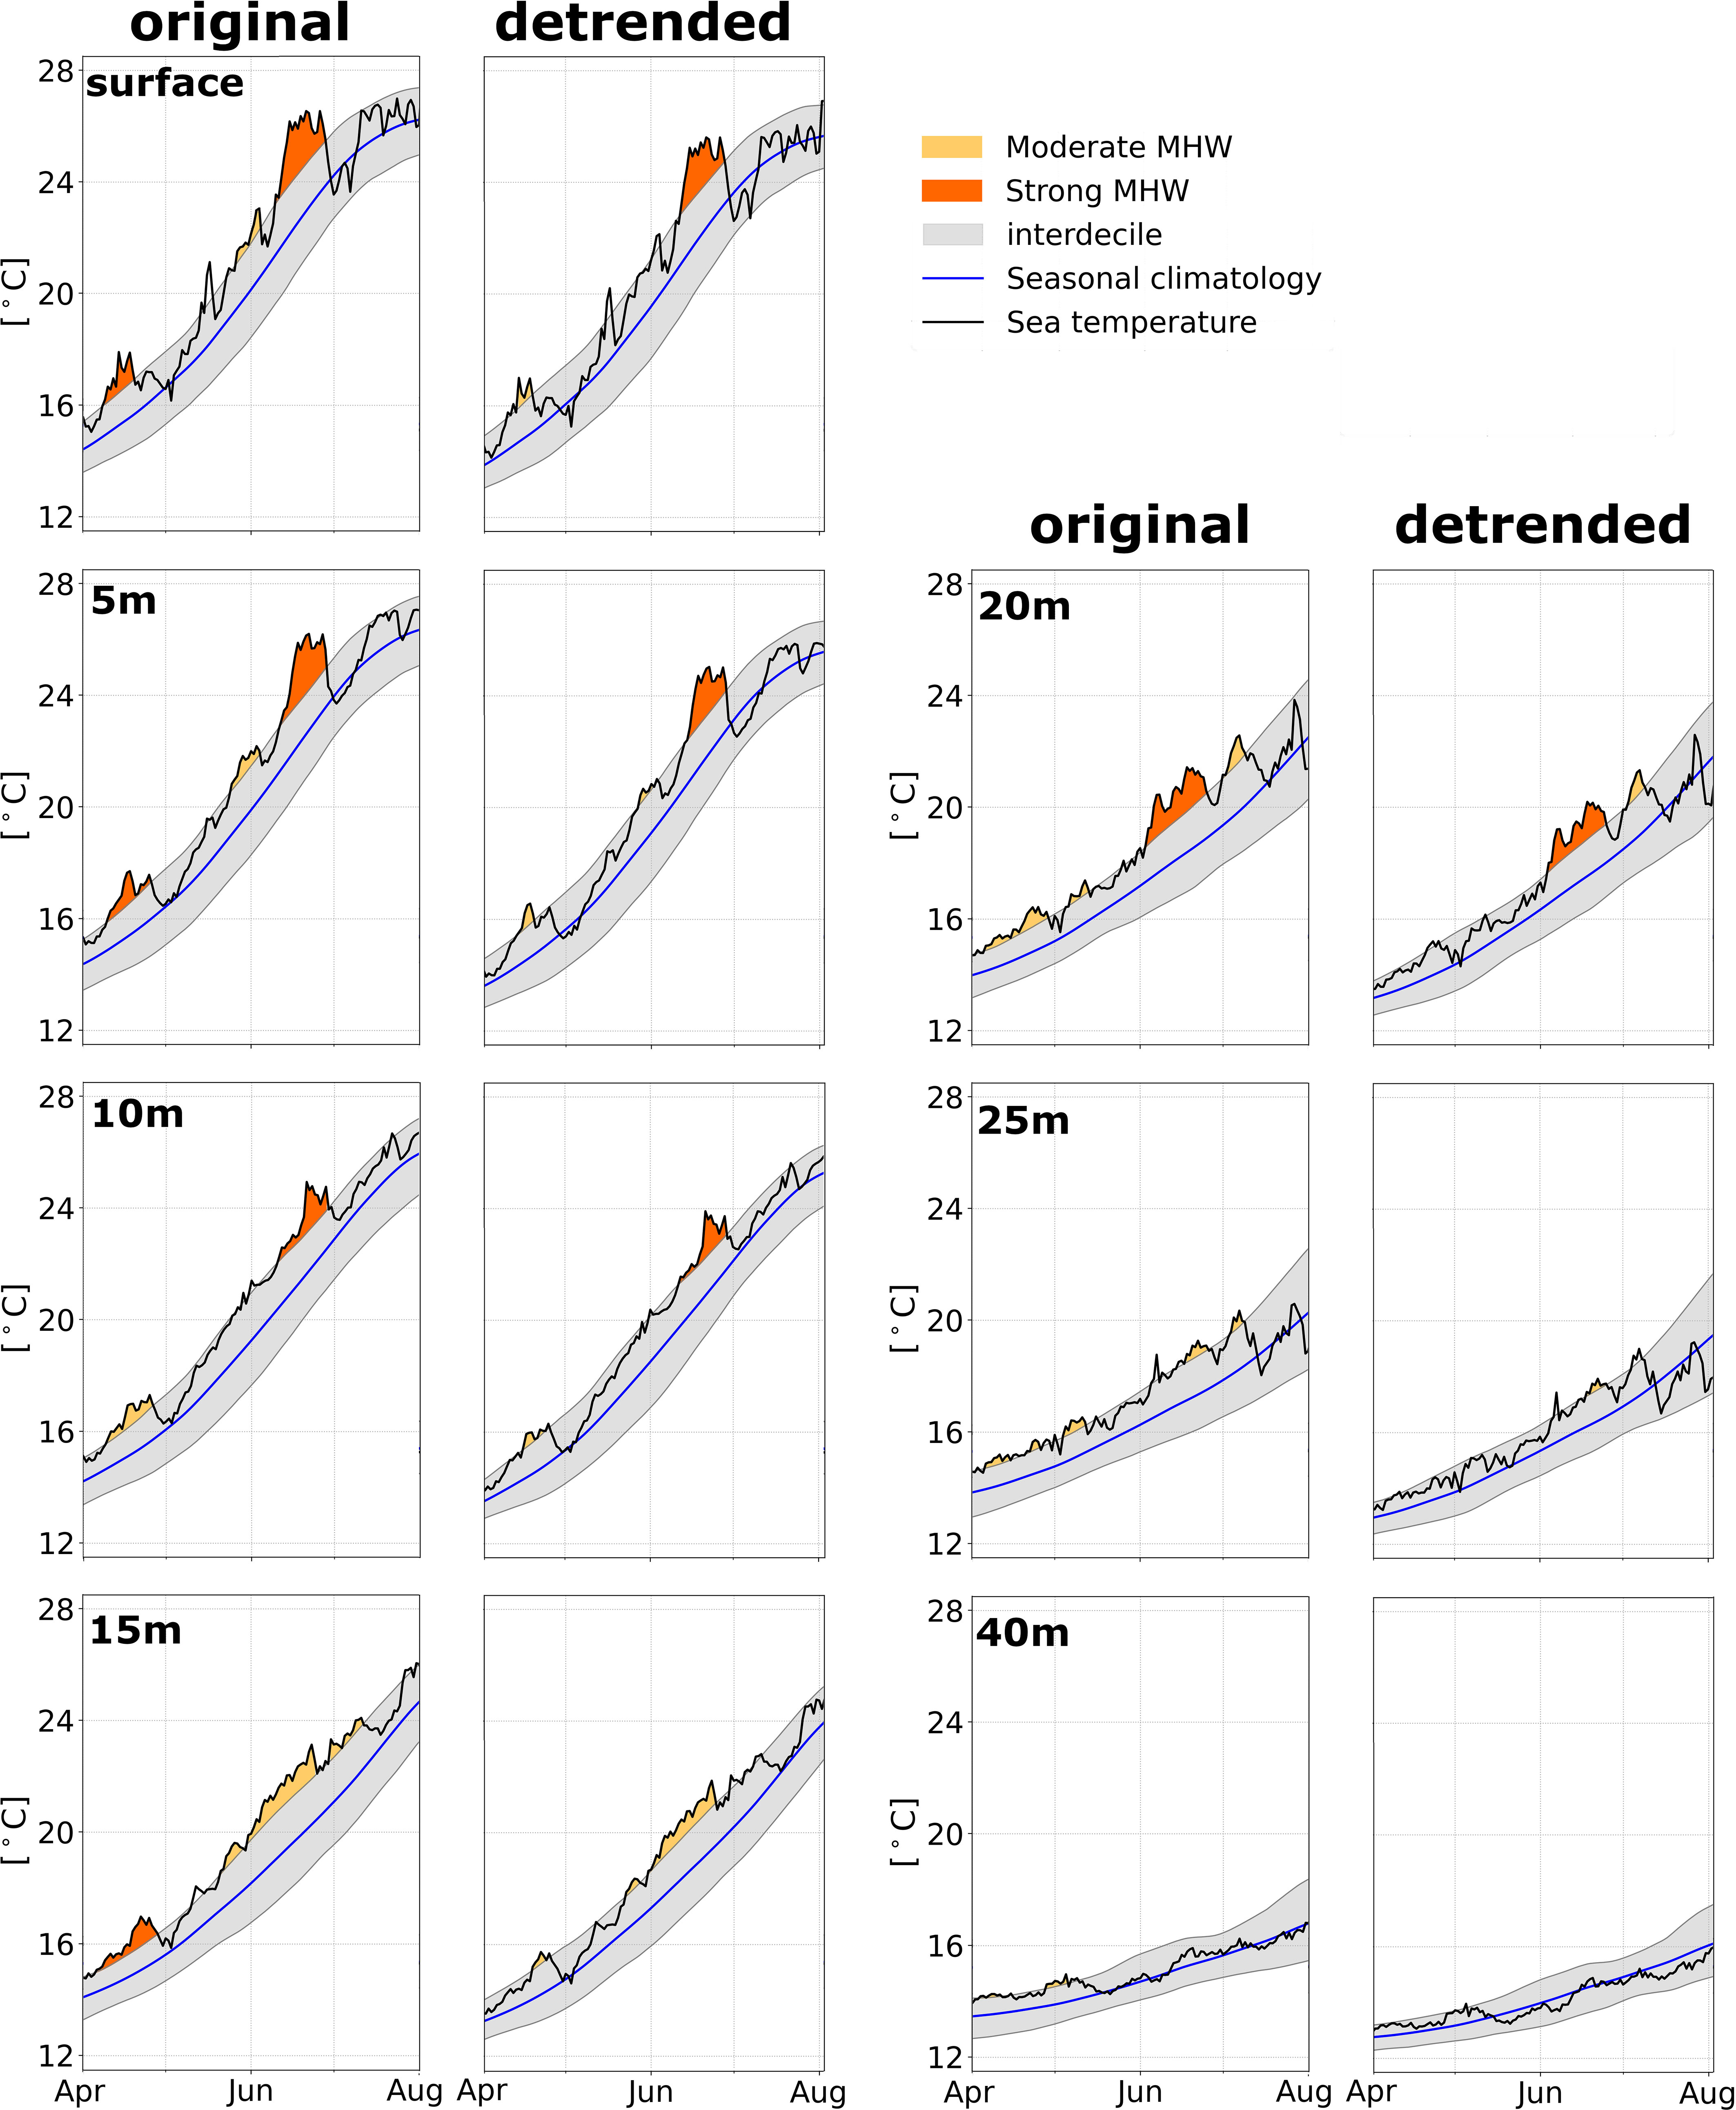
Figure 7 Vertical structure of the 2017 MHW events exceeding the 90th at the Columbretes Island site. From top to bottom, the temperature series at different depths. All data come from in situ measurements except for the surface where Copernicus MY data are used. At a given depth, the left panels show the original detection, whereas the right panels show detrended detection.
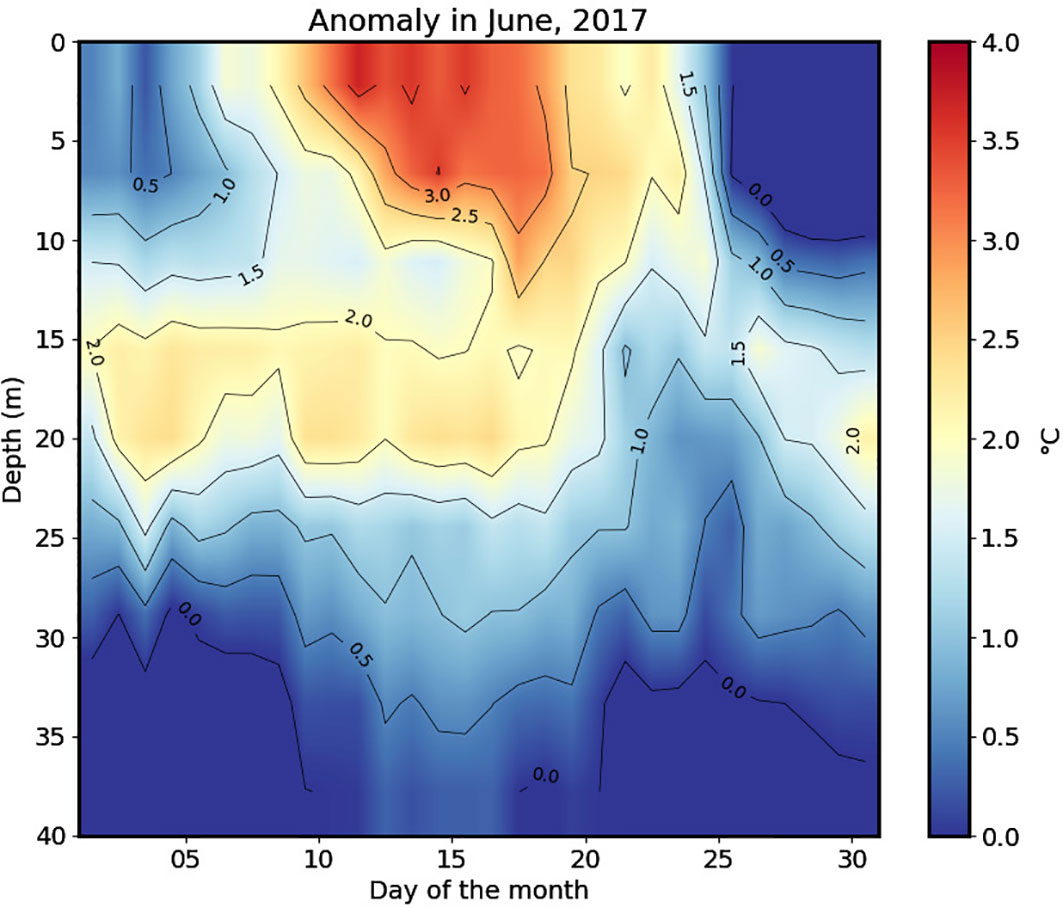
Figure 8 Time evolution of the vertical structure of temperature anomalies from Columbretes Island station data in June 2017.
4 Discussion and conclusion
Understanding if changes regarding extreme events are linked to changes in the mean, variance, or shape of anomalies’ distributions is essential to correctly interpret their impacts in terms of adaptation (Collins et al., 2019). The analysis of the Mediterranean SST anomalies’ distributions over 41 years (1982–2022), split into two consecutive periods of 20.5 years each, evidenced a shift to warmer SSTs and an increase in variance during the second period (Figure 2). This effect disappears when the trend is removed, thus suggesting that the trend is mainly responsible for increasing the likelihood and severity of extreme occurrences. The changes in the mean and variance of anomalies distributions are particularly evident in correspondence with the Mediterranean sub-basins (Ionian, Aegean, and Levantine) experiencing more intense warming trends (Figure 1).
The impact of the trend in MHW detection has been investigated by applying the Hobday method (Hobday et al., 2016) to original and detrended SST data, covering the whole period (1982–2022). When the detection method is applied to original data, almost all MHW metrics—such as average intensity, frequency, duration, and fraction of the basin affected by events—show significant positive trends (Figure 3). Conversely, the same metrics do not present any significant change when the temperature trend is removed (before applying Hobday’s detection). The presence of a warming trend thus effectively leads to an increase in the occurrence and intensity of these events. These results are consistent with recent works indicating that the observed increase in MHWs (and their metrics) results from regional trends that alone increase the probability of SSTs exceeding the percentile threshold (Ciappa, 2022; Xu et al., 2022).
One of the most outstanding consequences is that the Mediterranean Sea seems to evolve from a condition of 1 event/year and affecting a null portion of the sea in the first years, to a frequency four times greater and covering, on a yearly average, almost 100% of the Mediterranean area in the latest years (Figures 3B, C). An analogous conclusion is reported by Amaya et al. (2023) that shows how the oceans will reach a “perpetual heatwave” state over the coming decades if a fixed baseline approach is used. This scenario is overcome when detrending is applied, where no significant trend is found for either the frequency or the spatial coverage. The use of original data underestimates the number of events at the beginning of the period under analysis. Likewise, not detrending the data overestimates the number of events at the end of the period. In practice, detrending the data allows a more uniform redistribution of the MHW percentile threshold (Figure 4).
The detrended procedure, namely, the application of the Hobday method (Hobday et al., 2016) to SST data where the pixel-wise trend has been previously removed, allows separating the effect of a continuous warming from extreme variations. The method of Hobday to detect MHW was developed to homogenize the metrics used by previous ecological studies (see Table 2 of Hobday et al., 2016 and references therein) inspired by the work done by the atmospheric community to define atmospheric heat waves (e.g., Perkins and Alexander, 2013). MHWs arise from a wide spectrum of physical processes and are characterized as being anomalous or extreme events regarding their statistical properties. There are alternative ways to deal with the asymptotic properties of the extreme values (e.g., generalized extreme values distribution, GEV, Wilks, 2011) disregarding the underlying true distribution (e.g., Ban et al., 2020). Such limiting distributions require a sequence of identically distributed independent variables. However, the non-stationarity of the long-term evolution (in our case the SST warming) breaks this hypothesis, invalidating its use. To treat the non-stationarity with such approaches, continuous time evolving baselines have been introduced in quite recent studies in other areas and contexts (Scannell et al., 2016; Sigauke and Bere, 2017; Tebaldi et al., 2021; Kim et al., 2022). The purpose of detrending is thus analogous to the shifting baseline approach (Oliver et al., 2021; Amaya et al., 2023). However, the shifting approach requires ± n years around the year under analysis (e.g., ± 15 years have been used in Oliver et al., 2021), and this is achievable with model data only. When using observation data, the detrending approach could be a more affordable solution, since it does not require having years beyond the year under analysis.
A Mediterranean MHWs catalogue has been compiled based on detrended data (Table 1). The catalogue evidences 20 major events over the period 1982–2022, of which 5 were categorized as extremes (MED-MHW-1989/90, MED-MHW-1993/94, MED-MHW-1999, MED-MHW-2001, and MED-MHW-2007). The seasonal analysis shows that the strongest MHWs detected in the catalogue are those that took place in summer, providing simultaneously larger cumulative intensity, maximum intensity, and mean affected area with respect to winter events. This result is consistent with recent findings attributing this seasonal increase to an intensification of the Mediterranean SST trend during summer (Ciappa, 2022). The most recent and intense MHW event found in the catalogue occurred in 2022, MED-MHW-2022. It started on 11 May 2022, and persisted until December with two short temporal interruptions, and it seems to continue beyond the end of that year (Figure 4). This event is concomitant with a strong and long-lasting atmospheric heat wave that took place in the western Mediterranean in 2022, suggesting the atmospheric configuration as one of the likely drivers (Faranda et al., 2023; Guinaldo et al., 2023). A relevant aspect concerns the impact of detrending in the characteristics of the catalogued events. The comparative analysis with original detection shows that the catalogue does not evidence relevant events before 2001 (see Figure 5). In contrast, a more uniform distribution of these events over the whole period under analysis (1982–2022) is obtained when detrending is applied.
In terms of biological impact, several events from the catalogue are well-known and documented in the literature. It must be underlined that some of the events that occurred before 2001 have been reported in the literature to be associated with severe ecosystem impacts (Bavestrello et al., 1994; Garrabou et al., 2009; Rivetti et al., 2014). Among these, the MED-MHW-1999 catalogued as “extreme” was particularly harmful, affecting approximately 30 benthic species (Cerrano et al., 2000; Perez et al., 2000), and the MED-MHW-2003 catalogued as “severe” presented several biological impacts including mass mortality and massive bloom of mucilage (Olita et al., 2007; Garrabou et al., 2009; Crisci et al., 2011; Kersting et al., 2013). The latest event recorded, the MED-MHW-2022, has produced severe mass mortality in many areas across the western Mediterranean (e.g., Catalan, Provence, and Balearic islands) and to a lesser extent in the Adriatic Sea affecting tens of species from different groups (e.g., gorgonians, sponges, and mollusks). Likewise, a massive flowering of the seagrass Posidonia oceanica has been reported in the same areas. This information was made available by participants in the T-MEDNet network (www.t-mednet.org) as well from marine citizen science portals such as Observadores del Mar (www.observadoresdelmar.es) and different social media sites.
From the point of view of the impact of MHWs on marine ecosystems, the total heat stress and other metrics (see Table 2 in Hobday et al., 2016; Jacox et al., 2020; Li and Donner, 2022; Amaya et al., 2023) are essential to assess their potential severity in ecological terms. Detrending should thus not exclude such analysis mainly for marine organisms and ecosystems impacted by a total temperature change, since the response to a slow variation (changes in mean conditions) or abrupt changes (changes in variance or distribution’s shape) differs (Smale and Wernberg, 2013; Pinsky et al., 2018; Garrabou et al., 2022; Provost and Botsford, 2022; Smith et al., 2023). Thus, once the MHW is detected, it is always possible to recover the total heat increase during an MHW event as follows. Denoting by the detrended intensity (the one obtained from the detrended approach), the original SST time series Xt can be expressed as
where is the corresponding baseline reference in the detrended approach and is the long-term trend (which reads as , with being the annual trend slope). By considering the detrended intensity adjusted with the warming factor , one is able to recover the coupled information encountering the total overall SST departure (warming trend + marine heatwave) from the baseline detrended climatology. It is important to stress that the recovered intensity does differ in many ways from the original MHW intensity since the detections remain based on different baseline references. Therefore, we are able to both keep as separate and eventually recover together the mathematical concept and the biological impact related to MHWs.
The impact of detrending has also been evidenced for shorter temporal time series, by analyzing 13 years of in situ temperature data collected near and below the sea surface (5–40 m). Indeed, the removal of a significant trend from the in situ time series (around 0.1°C/year for each depth level) does not increase the number of events in recent years, consistent with the results obtained by detrending longer time series. However, detrending short temporal series can lead to an abrupt increase in the number of days at the beginning of the time series (2008) with respect to the original data (Figure 6). This behavior is partly expected because of the differences between the climatological 90th percentile of the original and detrended case but likely exacerbated because of the shortness of the temporal period. The trend in the in situ temperatures, computed over 13 years, is indeed considerably greater than the trend estimated over 41 years (0.04°C/year), thus strongly influencing individual years at the beginning or end of the time series.
The similar trend found for the 5- to 40-m depths for in situ measurements entails differences between original and detrended detection at all depths. Focusing on the first half of 2017, when the Columbretes site was affected by three MHWs (Figure 7), the weaker ones detected by the original procedure are almost undetected when detrending is performed. The strongest one, which occurred in June, is detected regardless of the method used.
The results obtained from in situ data are relevant because they reveal the impact of trend removal. The effect of detrending short time series is consistent with what is found for longer ones. MHWs that took place in the first half of the period are better characterized in terms of extreme events while the frequency and intensity of the events are reduced in the second part. It is worth noting that the increment in the number of days having MHW in 2008 and 2011 in the Columbretes Islands (see Figure 3A) seems to be associated with reported necrosis events of the coral Cladocora caespitosa in the 5–30 m depth range in this zone [37]. However, this assumption deserves more in-depth analysis beyond the objective of the present work.
According to the results obtained in this work, the presence of a trend in surface or subsurface seawater temperatures can drive MHW detection toward more intense and frequent MHW events as time goes by. In a warming ocean, such as the Mediterranean Sea, appropriate treatment of the slow-varying temperature change (namely, the trend) becomes essential to better define the reference conditions upon which MHWs are identified. In line with the recent literature (Oliver, 2019; Jacox et al., 2020; Amaya et al., 2023), we retain that baselines matter. In particular, considering the idea that an MHW should be a transient and exceptionally warm event in a given location with respect to the “expected” local conditions, we agree with the proposal by Amaya et al. (2023) to use the term “marine heatwave” when the long-term warming is separated from the total temperature signal, either with a shifting baseline or by detrending. Thus, detrending is conceived and suggested to define more properly a fixed climatology baseline (on which the MHW detection method relies) in an evolving ocean with rising temperatures. Detrending is especially important for detecting extreme events when the cumulative increase in the trend during the period analyzed is comparable to the intensity of these events. However, detrending should not substitute or exclude the analysis based on the total heat stress (a combination of the warming trend and marine heatwave), which is necessary to assess the impacts on marine organisms and ecosystems.
Data availability statement
Publicly available datasets were analyzed in this study. This data can be found here: https://doi.org/10.48670/moi-00172 https://doi.org/10.48670/moi-00173 www.t-mednet.org.
Author contributions
JM and FL conducted the data analysis and created the necessary code. DK supplied the in situ data. JM, FL, EG-L, and AP wrote the manuscript and have substantial contributions to the conception or design of the work, analysis, and interpretation of data. All authors contributed to the article and approved the submitted version.
Funding
This research has been sustained with the support of the CAREHeat (deteCtion and threAts of maRinE Heat waves) project, funded by the European Space Agency (ESA, grant agreement no. 4000137121/21/I-DT). Furthermore, it has received support from the following projects: MEDOSMOSIS, SHAREMED and MPA-Engage funded by the INTERREG-MED program (grant agreements 6119, 6184 and 1MED15_3.2_M2_337 respectively), Futuremares (Climate Change and Future Marine Ecosystem Services and Biodiversity) funded by the EU H2020 program (grant SEP-210597628) and CORFUN ("Assessing the effectiveness of nature-based solutions for maintaining the integrity and functioning of high-diverse Mediterranean coralligenous assemblages in a climate changed world") funded by the Spanish Ministry Science and Innovation (grant TED2021-131622B-I00). Justino Martínez, Emilio García-Ladona and Joaquim Garrabou acknowledge the institutional support of the ‘Severo Ochoa Centre of Excellence’ accreditation (CEX2019-000928-S) and Nathaniel Benssoussan acknowledges the support from the BIOPHYCOAST ("Developing Downstream applications and services on BIO-PHYsical characterization of the seascape for COASTal management”) project funded by EU-Copernicus Framework Partnership Agreement (FPA). Diego Kersting was supported by a Ramon y Cajal postdoctoral grant funded by the Ministry of Science and Innovation (PEICTI 2021- 2023; grant no. RYC2021‐033576‐I).
Acknowledgments
The authors are grateful to the managers and staff of the Columbretes Islands Marine Reserve for research authorizations and support, and would like to thank Jacopo Chiaggiato, Salvatore Marullo, Chunxue Yang, Bruno Buongiorno Nardelli, and Rosalia Santoleri for the fruitful initial discussions to this work. The authors wish to thank the reviewers for their valuable and constructive comments.
Conflict of interest
The authors declare that the research was conducted in the absence of any commercial or financial relationships that could be construed as a potential conflict of interest.
Publisher’s note
All claims expressed in this article are solely those of the authors and do not necessarily represent those of their affiliated organizations, or those of the publisher, the editors and the reviewers. Any product that may be evaluated in this article, or claim that may be made by its manufacturer, is not guaranteed or endorsed by the publisher.
References
Amaya D., Jacox M., Fewings M., Saba V., Malte F., Rykaczewski R., et al. (2023). Marine heatwaves need clear definitions so coastal communities can adapt. Nature 616, 29–32. doi: 10.1038/d41586-023-00924-2
Ban N., Rajczak J., Schmidli J., Schär C. (2020). Analysis of alpine precipitation extremes using generalized extreme value theory in convection-resolving climate simulations. Climate Dynamics 55, 61–75. doi: 10.1007/s00382-018-4339-4
Bavestrello G., Bertone S., Cattaneo-Vietti R., Cerrano C., Gaino E., Zanzi D. (1994). Mass mortality of paramuricea clavata (Anthozoa, cnidaria) on portofino promontory cliffs, ligurian Sea, Mediterranean Sea. Mar. Life 4, 15–19.
Bensoussan N., Chiggiato J., Buongiorno Nardelli B., Pisano A., Garrabou J. (2019). Insights on 2017 marine heat waves in the Mediterranean sea. copernicus marine service ocean state report: issue 3. J. Operational Oceanography 12, 101–108. doi: 10.1080/1755876X.2019.1633075
Beşel C., Tanir Kayikçi E. (2020). Investigation of black sea mean sea level variability by singular spectrum analysis. Int. J. Eng. Geosciences 5, 33–41. doi: 10.26833/ijeg.580510
Biriukova K., Pacheco-Labrador J., Migliavacca M., Mahecha M. D., Gonzalez-Cascon R., Martín M. P., et al. (2021). Performance of singular spectrum analysis in separating seasonal and fast physiological dynamics of solar-induced chlorophyll fluorescence and pri optical signals. J. Geophysical Research: Biogeosciences 126, e2020JG006158. doi: 10.1029/2020JG006158
Buongiorno Nardelli B., Tronconi C., Pisano A., Santoleri R. (2013). High and ultra-high resolution processing of satellite sea surface temperature data over southern european seas in the framework of myocean project. Remote Sens. Environ. 129, 1–16. doi: 10.1016/j.rse.2012.10.012
Cerrano C., Bavestrello G., Bianchi C. N., Cattaneo-Vietti R., Bava S., Morganti C., et al. (2000). A catastrophic mass-mortality episode of gorgonians and other organisms in the ligurian sea (north-western mediterranean), summer 1999. Ecol. Lett. 3, 284–293. doi: 10.1046/j.1461-0248.2000.00152.x
Chiswell S. M. (2022). Global trends in marine heatwaves and cold spells: the impacts of fixed versus changing baselines. J. Geophysical Research: Oceans 127, e2022JC018757. doi: 10.1029/2022JC018757
Ciappa A. C. (2022). Effects of marine heatwaves (mhw) and cold spells (mcs) on the surface warming of the mediterranean sea from 1989 to 2018. Prog. Oceanogr. 205, 102828. doi: 10.1016/j.pocean.2022.102828
Collins M., Sutherland M., Bouwer L., Cheong S.-M., Froölicher T., Jacot Des Combes H., et al. (2019). “Extremes, abrupt changes and managing risk,” in IPCC special report on the ocean and cryosphere in a changing climate. Eds. Poörtner H.-O., Roberts D., Masson-Delmotte V., Zhai P., Tignor M., Poloczanska E., Mintenbeck K., Alegría A., Nicolai M., Okem A., Petzold J., Rama B., Weyer N. (Cambridge, UK and New York, NY, USA: Cambridge University Press), 589–655.
Crisci C., Bensoussan N., Romano J.-C., Garrabou J. (2011). Temperature anomalies and mortality events in marine communities: insights on factors behind differential mortality impacts in the nw mediterranean. PLoS One 6, e23814. doi: 10.1371/journal.pone.0023814
D’Arcy J. (2018) Introducing SSA for time series decomposition. Available at: https://www.kaggle.com/jdarcy/introducing-ssa-for-time-series-decomposition.
Darmaraki S., Somot S., Sevault F., Nabat P. (2019). Past variability of mediterranean sea marine heatwaves. Geophysical Res. Lett. 46, 9813–9823. doi: 10.1029/2019GL082933
Dunn R. J., Morice C. P. (2022). On the effect of reference periods on trends in percentile-based extreme temperature indices. Environ. Res. Lett. 17, 034026. doi: 10.1088/1748-9326/ac52c8
Eakin C. M., Morgan J., Heron S., Smith T., Liu G., Alvarez-Fili L., et al. (2010). Caribbean Corals in crisis: record thermal stress, bleaching, and mortality. PLoS One 5, e13969. doi: 10.1371/journal.pone.0013969
Faranda D., Pascale S., Bulut B. (2023). Persistent anticyclonic conditions and climate change exacerbated the exceptional 2022 european-mediterranean drought. Environ. Res. Lett. 18, 034030. doi: 10.1088/1748-9326/acbc37
Frölicher T. L., Fischer E. M., Gruber N. (2018). Marine heatwaves under global warming. Nature 560, 360–364. doi: 10.1038/s41586-018-0383-9
Frölicher T. L., Laufkötter C. (2018). Emerging risks from marine heat waves. Nat. Commun. 9, 650. doi: 10.1038/s41467-018-03163-6
Galli G., Solidoro C., Lovato T. (2017). Marine heat waves hazard 3d maps and the risk for low motility organisms in a warming mediterranean sea. Front. Mar. Sci. 4, 136. doi: 10.3389/fmars.2017.00136
Garrabou J., Coma R., Bensoussan N., Bally M., Chevaldonné P., Cigliano M., et al. (2009). Mass mortality in northwestern mediterranean rocky benthic communities: effects of the 2003 heat wave. Global Change Biol. 15, 1090–1103. doi: 10.1111/j.1365-2486.2008.01823.x
Garrabou J., Gómez-Gras D., Medrano A., Cerrano C., Ponti M., Schlegel R., et al. (2022). Marine heatwaves drive recurrent mass mortalities in the mediterranean sea. Global Change Biol. 28, 5708–5725. doi: 10.1111/gcb.16301
Garrabou J., Ledoux J.-B., Bensoussan N., Gómez-Gras D., Linares C. (2021). “Sliding toward the collapse of mediterranean coastal marine rocky ecosystems,” in Ecosystem collapse and climate change (Cham, Switzerland: Springer), 291–324.
Ghil M., Vautard R. (1991). Interdecadal oscillations and the warming trend in global temperature time series. Nature 350, 324–327. doi: 10.1038/350324a0
Golyandina N., Nekrutkin V. (2001). Analysis of time series Structure:SSA and related techniques (Andover, England, UK: Taylor & Francis). doi: 10.1201/9780367801687
Golyandina N., Zhigljavsky A. (2013). Singular spectrum analysis for time series (Heilderberg New York Dordrecht London: Springer). doi: 10.1007/978-3-642-34913-3
Guinaldo T., Voldoire A., Waldman R., Saux Picart S., Roquet H. (2023). Response of the sea surface temperature to heatwaves during the france 2022 meteorological summer. Ocean Sci. 19, 629–647. doi: 10.5194/os-19-629-2023
Hassani H. (2007). Singular spectrum analysis: methodology and comparison. J. Data Sci. 5, 239–257. doi: 10.6339/JDS.2007.05(2).396
Hobday A. J., Alexander L. V., Perkins S. E., Smale D. A., Straub S. C., Oliver E. C., et al. (2016). A hierarchical approach to defining marine heatwaves. Prog. Oceanogr. 141, 227–238. doi: 10.1016/j.pocean.2015.12.014
Hobday A. J., Oliver E. C., Gupta A. S., Benthuysen J. A., Burrows M. T., Donat M. G., et al. (2018). Categorizing and naming marine heatwaves. Oceanography 31, 162–173. doi: 10.5670/oceanog.2018.205
Holbrook N. J., Scannell H. A., Sen Gupta A., Benthuysen J. A., Feng M., Oliver E. C., et al. (2019). A global assessment of marine heatwaves and their drivers. Nat. Commun. 10, 2624. doi: 10.1038/s41467-019-10206-z
Houpert L., Testor P., Durrieu De Madron X. (2015). Gridded climatology of the mixed layer (depth and temperature), the bottom of the seasonal thermocline (depth and temperature), and the upper-ocean heat storage rate for the mediterrean sea. SEANOE. doi: 10.17882/46532
Ibrahim O., Mohamed B., Nagy H. (2021). Spatial variability and trends of marine heat waves in the eastern mediterranean sea over 39 years. J. Mar. Sci. Eng. 9, 643. doi: 10.3390/jmse9060643
Jacox M. G. (2019). Marine heatwaves in a changing climate. Nature 571, 485–487. doi: 10.1038/d41586-019-02196-1
Jacox M. G., Alexander M., Bograd S., Scott J. (2020). Thermal displacement by marine heatwaves. Nature 584, 82–86. doi: 10.1038/s41586-020-2534-z
Kersting D. K., Bensoussan N., Linares C. (2013). Long-term responses of the endemic reef-builder cladocora caespitosa to mediterranean warming. PLoS One 8, e70820. doi: 10.1371/journal.pone.0070820
Kew S., Philip S., van Oldenborgh G.-J., Otto F., Vautard R., van der Schrier G. (2019). The exceptional summer heat wave in southern europe 2017. Bull. Am. Meteorological Soc. 100 S49, 49–53. doi: 10.1175/BAMS-D-18-0109.1
Kim H., Kim T., Shin J.-Y., Heo J.-H. (2022). Improvement of extreme value modeling for extreme rainfall using Large-scale climate modes and considering model uncertainty. Water 14, 478–499. doi: 10.3390/w14030478
Le Traon P. Y., Reppucci A., Alvarez Fanjul E., Aouf L., Behrens A., Belmonte M., et al. (2019). From observation to information and users: the copernicus marine service perspective. Front. Mar. Sci. 6. doi: 10.3389/fmars.2019.00234
Li X., Donner S. D. (2022). Lengthening of warm periods increased the intensity of warm-season marine heatwaves over the past 4 decades. Climate Dynamics 59, 2643–2654. doi: 10.1007/s00382-022-06227-y
Macias D., Stips A., Garcia-Gorriz E. (2014). Application of the singular spectrum analysis technique to study the recent hiatus on the global surface temperature record. PLoS One 9, 1–7. doi: 10.1371/journal.pone.0107222
Merchant C. J., Embury O., Bulgin C. E., Block T., Corlett G. K., Fiedler E., et al. (2019). Satellite-based time-series of sea-surface temperature since 1981 for climate applications. Sci. Data 6, 223. doi: 10.1038/s41597-019-0236-x
Olita A., Sorgente R., Natale S., Gaberšek S., Ribotti A., Bonanno A., et al. (2007). Effects of the 2003 european heatwave on the central mediterranean sea: surface fluxes and the dynamical response. Ocean Sci. 3, 273–289. doi: 10.5194/os-3-273-2007
Oliver E. C. (2019). Mean warming not variability drives marine heatwave trends. Climate Dynamics 53, 1653–1659. doi: 10.1007/s00382-019-04707-2
Oliver E. C., Benthuysen J. A., Darmaraki S., Donat M. G., Hobday A. J., Holbrook N. J., et al. (2021). Marine heatwaves. Annu. Rev. Mar. Sci. 13, 313–342. doi: 10.1146/annurev-marine-032720-095144
Oliver E. C., Donat M. G., Burrows M. T., Moore P. J., Smale D. A., Alexander L. V., et al. (2018). Longer and more frequent marine heatwaves over the past century. Nat. Commun. 9, 1–12. doi: 10.1038/s41467-018-03732-9
Otto F., van Oldenborgh G., R. Vautard R., Schwierz C. (2017) Record june temperatures in western europe. world weather attribution. Available at: http://www.worldweatherattribution.org/analyses/european-heat-june-2017/.
Pastor F., Valiente J. A., Khodayar S. (2020). A warming mediterranean: 38 years of increasing sea surface temperature. Remote Sens. 12, 2687. doi: 10.3390/rs12172687
Perez T., Garrabou J., Sartoretto S., Harmelin J.-G., Francour P., Vacelet J. (2000). Mortalité massive d’invertébrés marins: un événement sans précédent en méditerranée nord-occidentale. Comptes Rendus l’Académie Des. Sciences-Series III-Sciences la Vie 323, 853–865. doi: 10.1016/S0764-4469(00)01237-3
Perkins S., Alexander L. (2013). On the measurement of heat waves. J. Climate 26, 4500–4517. doi: 10.1007/s00382-018-4339-4
Pinsky M. L., Reygondeau G., Caddell R., Palacios-Abrantes J., Spijkers J., Cheung W. W. L. (2018). Preparing ocean governance for species on the move. Science 360, 1189–1191. doi: 10.1126/science.aat2360
Pisano A., Marullo S., Artale V., Falcini F., Yang C., Leonelli F. E., et al. (2020). New evidence of mediterranean climate change and variability from sea surface temperature observations. Remote Sens. 12, 132. doi: 10.3390/rs12010132
Provost M. M., Botsford L. W. (2022). How life history determines time scale sensitivity and extinction risk of age-structured populations. Oikos 2022, e08909. doi: 10.1111/oik.08909
Rivetti I., Fraschetti S., Lionello P., Zambianchi E., Boero F. (2014). Global warming and mass mortalities of benthic invertebrates in the mediterranean sea. PLoS One 9, e115655. doi: 10.1371/journal.pone.0115655
Sánchez-Benítez A., García-Herrera R., Barriopedro D., Sousa P. M., Trigo R. M. (2018). June 2017: the earliest European summer mega-heatwave of reanalysis period. Geophysical Res. Lett. 45, 1955–1962. doi: 10.1002/2018GL077253
Scannell H. A., Pershing A. J., Alexander M. A., Thomas A. C., Mills K. E. (2016). Frequency of marine heatwaves in the north atlantic and north pacific since 1950. Geophysical Res. Lett. 43, 2069–2076. doi: 10.1002/2015GL067308
Schlegel R. W., Oliver E. C., Hobday A. J., Smit A. J. (2019). Detecting marine heatwaves with sub-optimal data. Front. Mar. Sci. 6, 737. doi: 10.3389/fmars.2019.00737
Schoellhamer D. H. (2001). Singular spectrum analysis for time series with missing data. Geophysical Res. Lett. 28, 3187–3190. doi: 10.1029/2000GL012698
Sen P. K. (1968). Estimates of the regression coefficient based on kendall’s tau. J. Am. Stat. Assoc. 63, 1379–1389. doi: 10.1080/01621459.1968.10480934
Sigauke C., Bere A. (2017). Modelling non-stationary time series using a peaks over threshold distribution with time varying covariates and threshold. Appl. to peak electricity demand Energy 119, 152–166. doi: 10.1016/j.energy.2016.12
Smale D., Wernberg T. (2013). Extreme climatic event drives range contraction of a habitat-forming species. R. Soc. B: Biol. Sci. 280, 20122829–20122829. doi: 10.1098/rspb.2012.2829
Smith K., Burrows M., Hobday A., King N., Moore P., Gupta A. S., et al. (2023). Biological impacts of marine heatwaves. Annu. Rev. Mar. Sci. 15, 19–45. doi: 10.1146/annurev-marine-032122-121437
Soto-Navarro J., Jordá G., Amores A., Cabos W., Somot S., Sevault F., et al. (2020). Evolution of mediterranean sea water properties under climate change scenarios in the med-cordex ensemble. Climate Dynamics 54, 2135–2165. doi: 10.1007/s00382-019-05105-4
Tebaldi C., Ranasinghe R., Vousdoukas M., Rasmussen D., Vega-Westhoff B., Kirezci E., et al. (2021). Extreme sea levels at different global warming levels. Nat. Climate Change 11, 746–751. doi: 10.1038/s41558-021-01127-1
Xu T., Newman M., Capotondi A., Stevenson S., Di Lorenzo E., Alexander M. A. (2022). An increase in marine heatwaves without significant changes in surface ocean temperature variability. Nat. Commun. 13, 7396. doi: 10.1038/s41467-022-34934-x
Keywords: marine heatwaves, Mediterranean Sea, sea surface temperature, extreme events, climate change, warming seas
Citation: Martínez J, Leonelli FE, García-Ladona E, Garrabou J, Kersting DK, Bensoussan N and Pisano A (2023) Evolution of marine heatwaves in warming seas: the Mediterranean Sea case study. Front. Mar. Sci. 10:1193164. doi: 10.3389/fmars.2023.1193164
Received: 24 March 2023; Accepted: 12 June 2023;
Published: 30 June 2023.
Edited by:
Arthur J. Miller, University of California, San Diego, United StatesReviewed by:
Nathalí Cordero Quirós, University of California, Santa Cruz, United StatesXinru Li, University of British Columbia, Canada
Copyright © 2023 Martínez, Leonelli, García-Ladona, Garrabou, Kersting, Bensoussan and Pisano. This is an open-access article distributed under the terms of the Creative Commons Attribution License (CC BY). The use, distribution or reproduction in other forums is permitted, provided the original author(s) and the copyright owner(s) are credited and that the original publication in this journal is cited, in accordance with accepted academic practice. No use, distribution or reproduction is permitted which does not comply with these terms.
*Correspondence: Justino Martınez, anVzdGlub0BpY20uY3NpYy5lcw==
†These authors have contributed equally to this work and share first authorship