 Bryan D. Watts
 Barton J. Paxton1
- 1Center for Conservation Biology, William & Mary, Williamsburg, VA, United States
- 2North Carolina Wildlife Resources Commission, Raleigh, NC, United States
The south Atlantic coast supports one of the highest assemblages of non-breeding double-crested cormorants (Nannopterum auritum) known and is a convergence area for Atlantic menhaden (Brevoortia tyrannus) during the winter months. We surveyed cormorants along the coast of North Carolina and used a bioenergetics approach to estimate potential menhaden consumption. We estimated cormorant numbers using a network of repeatable aerial transects along the outer coast (366 km) and within sounds (266 km) during fall migration, winter and spring migration (2019-2021). We estimated the number of bird days, metabolic demand and menhaden equivalents of demand. Cormorant numbers peaked around 122,000 to 131,000 during southward migration, reached a low of 30,000 to 39,000 in winter and then increased to 67,000 to 68,000 during northward migration. We did not capture the peak of spring migration during the study period (20 November through 24 March). We estimated the number of cormorant days within the study period to be 8.6 x 10⁶ and 9.2 x 10⁶ for the two field seasons respectively. We estimated that cormorants consumed approximately 5,334 and 5,660 mt of menhaden equivalents within the study area. Estimated consumption peaked between 76 and 81 mt-d during fall passage and reached a low of 19 and 24 mt-d during the winter. Annual menhaden take by humans and predatory fish is around 354,000 mt. Menhaden consumption by cormorants within the study area represents 4% of the commercial and recreational take and 7% of the estimated consumption by predatory fish or 2.5% of the known take.
1 Introduction
Double-crested cormorant (Nannopterum auritum) populations have experienced wide fluctuations over the past two hundred years (Hatch, 1995; Wires et al., 2001; Dorr et al., 2014). Populations declined in the post-World War II era due in part to ongoing control and reproductive suppression (Postupalsky, 1978; Gilbertson et al., 1991) induced by environmental contaminants (Weseloh et al., 1983; Pearce et al., 1989). Many populations reached lows by the late 1960s (Hatch and Weseloh, 1999). The species was added to the Migratory Bird Treaty Act in 1972, was considered a species of concern within several jurisdictions and appeared on the Audubon Society Blue List from 1972 to 1981 (Tate and Tate, 1982). Between 1975 and at least the 1990s many populations exhibited exponential growth (Wires et al., 2001), populations recolonized their historic ranges (Ludwig, 1984; Vermeer and Rankin, 1984; Hatch, 1995) and populations were established within areas believed to be beyond the historic range (e.g., Post and Post, 1988; McConaughy, 1996; Watts and Bradshaw, 1996). For some populations annual growth rates exceeded 20% suggesting rapid immigration (Weseloh and Ewins, 1994; Fowle, 1997).
The recent population recovery of double-crested cormorants has raised concerns about impacts to commercially important fish stocks. Within eastern North America much of the recent concern has focused on northern lakes where breeding cormorants have been suggested to compete with economically important recreational fishing industries (e.g., Ross and Johnson, 1995; Trapp et al., 1999; Fielder, 2008; Meyers et al., 2016) or within Gulf Coast states where wintering cormorants are estimated to cause millions of dollars in damage annually to the catfish aquaculture industry (e.g., Stickey and Andrews, 1989; Dorr et al., 2012; Craig et al., 2016). These concerns ultimately led the United States Fish and Wildlife Service [USFWS] to issue two depredation orders between 1998 and 2003 designed to reduce impacts on aquaculture and minimize risks to wild fish stocks (United States Fish and Wildlife Service [USFWS], 1998; United States Fish and Wildlife Service [USFWS], 2003). Under all USFWS authorities >730,000 cormorants have been killed (2004-2018) and several hundred thousand nests have been destroyed (United States Fish and Wildlife Service [USFWS], 2020).
Establishment of cormorant depredation orders by the USFWS created controversy within the avian conservation community (Wires and Cuthbert, 2006; Reed et al., 2014; Wires, 2015). The community questioned the scientific evidence that links cormorants to the population dynamics of sport fish and the effectiveness of culling as a mitigation strategy to reduce impacts on aquaculture. The community also called for the establishment of a science-based framework for triggering control measures and a monitoring program to evaluate effectiveness. A successful lawsuit halted the issuance of new permits on the grounds that the USFWS did not follow federal policy prior to establishing depredation orders. Following the lawsuit the USFWS issued an environmental impact statement (United States Fish and Wildlife Service [USFWS], 2020) and implemented a new Special Double-crested Cormorant permit (50 CFR §21.48), a more conservative approach to management.
The south Atlantic coast supports one of the largest assemblages of wintering cormorants known (Dorr et al., 2014). Breeding populations east of Lake Huron (accounting for 26% of North American population; Dorr et al., 2014) migrate east of the Appalachians and funnel down the Atlantic Flyway to winter in the Southeast. Many of these birds overwinter within the South Atlantic Bight (SAB; Cape Hatteras, NC south to Cape Canaveral, FL) where commercially important fish stocks also winter (Wenner and Sedberry, 1989). The Atlantic menhaden (Brevoortia tyrannus) is a forage fish found in western Atlantic waters from Nova Scotia to Florida and supports the largest commercial fishery by weight along the east coast of the United States (Ahrenholz, 1991; National Marine Fisheries Service [NMFS], 2019). Atlantic menhaden migrate to the SAB to spend the winter months (Nicholson, 1978, Southeast Data Assessment and Review [SEDAR], 2020). Very little is known about the role that migrating and wintering cormorants play within the SAB ecosystem or the potential impact they may have on menhaden stock.
Coastal North Carolina has been identified as an important fall staging area and winter destination for eastern cormorants (Wires et al., 2001; Dorr et al., 2014). This area is also known to be an important convergence area for Atlantic menhaden during the late fall and an early winter spawning site (Southeast Data Assessment and Review [SEDAR], 2020). We surveyed cormorants during fall migration, winter and spring migration (2019-2021) in order to estimate seasonal and cumulative fish demand. We estimate the number of bird days, metabolic demand and menhaden equivalents of demand along the outer coast and within the four major sounds in North Carolina.
2 Methods
2.1 Study area
The study area included the Atlantic Coast of North Carolina from the North Carolina/Virginia border south to Beaufort Inlet near Morehead City (Figure 1). The area includes 300 km of outer coastal beaches and a 1-km band seaward of the beaches. The area also includes open water behind barrier islands including Currituck (361 km2), Albemarle (854 km2), Pamlico (4103 km2), and Core Sounds (255 km2) to the mouths of their major tributaries.
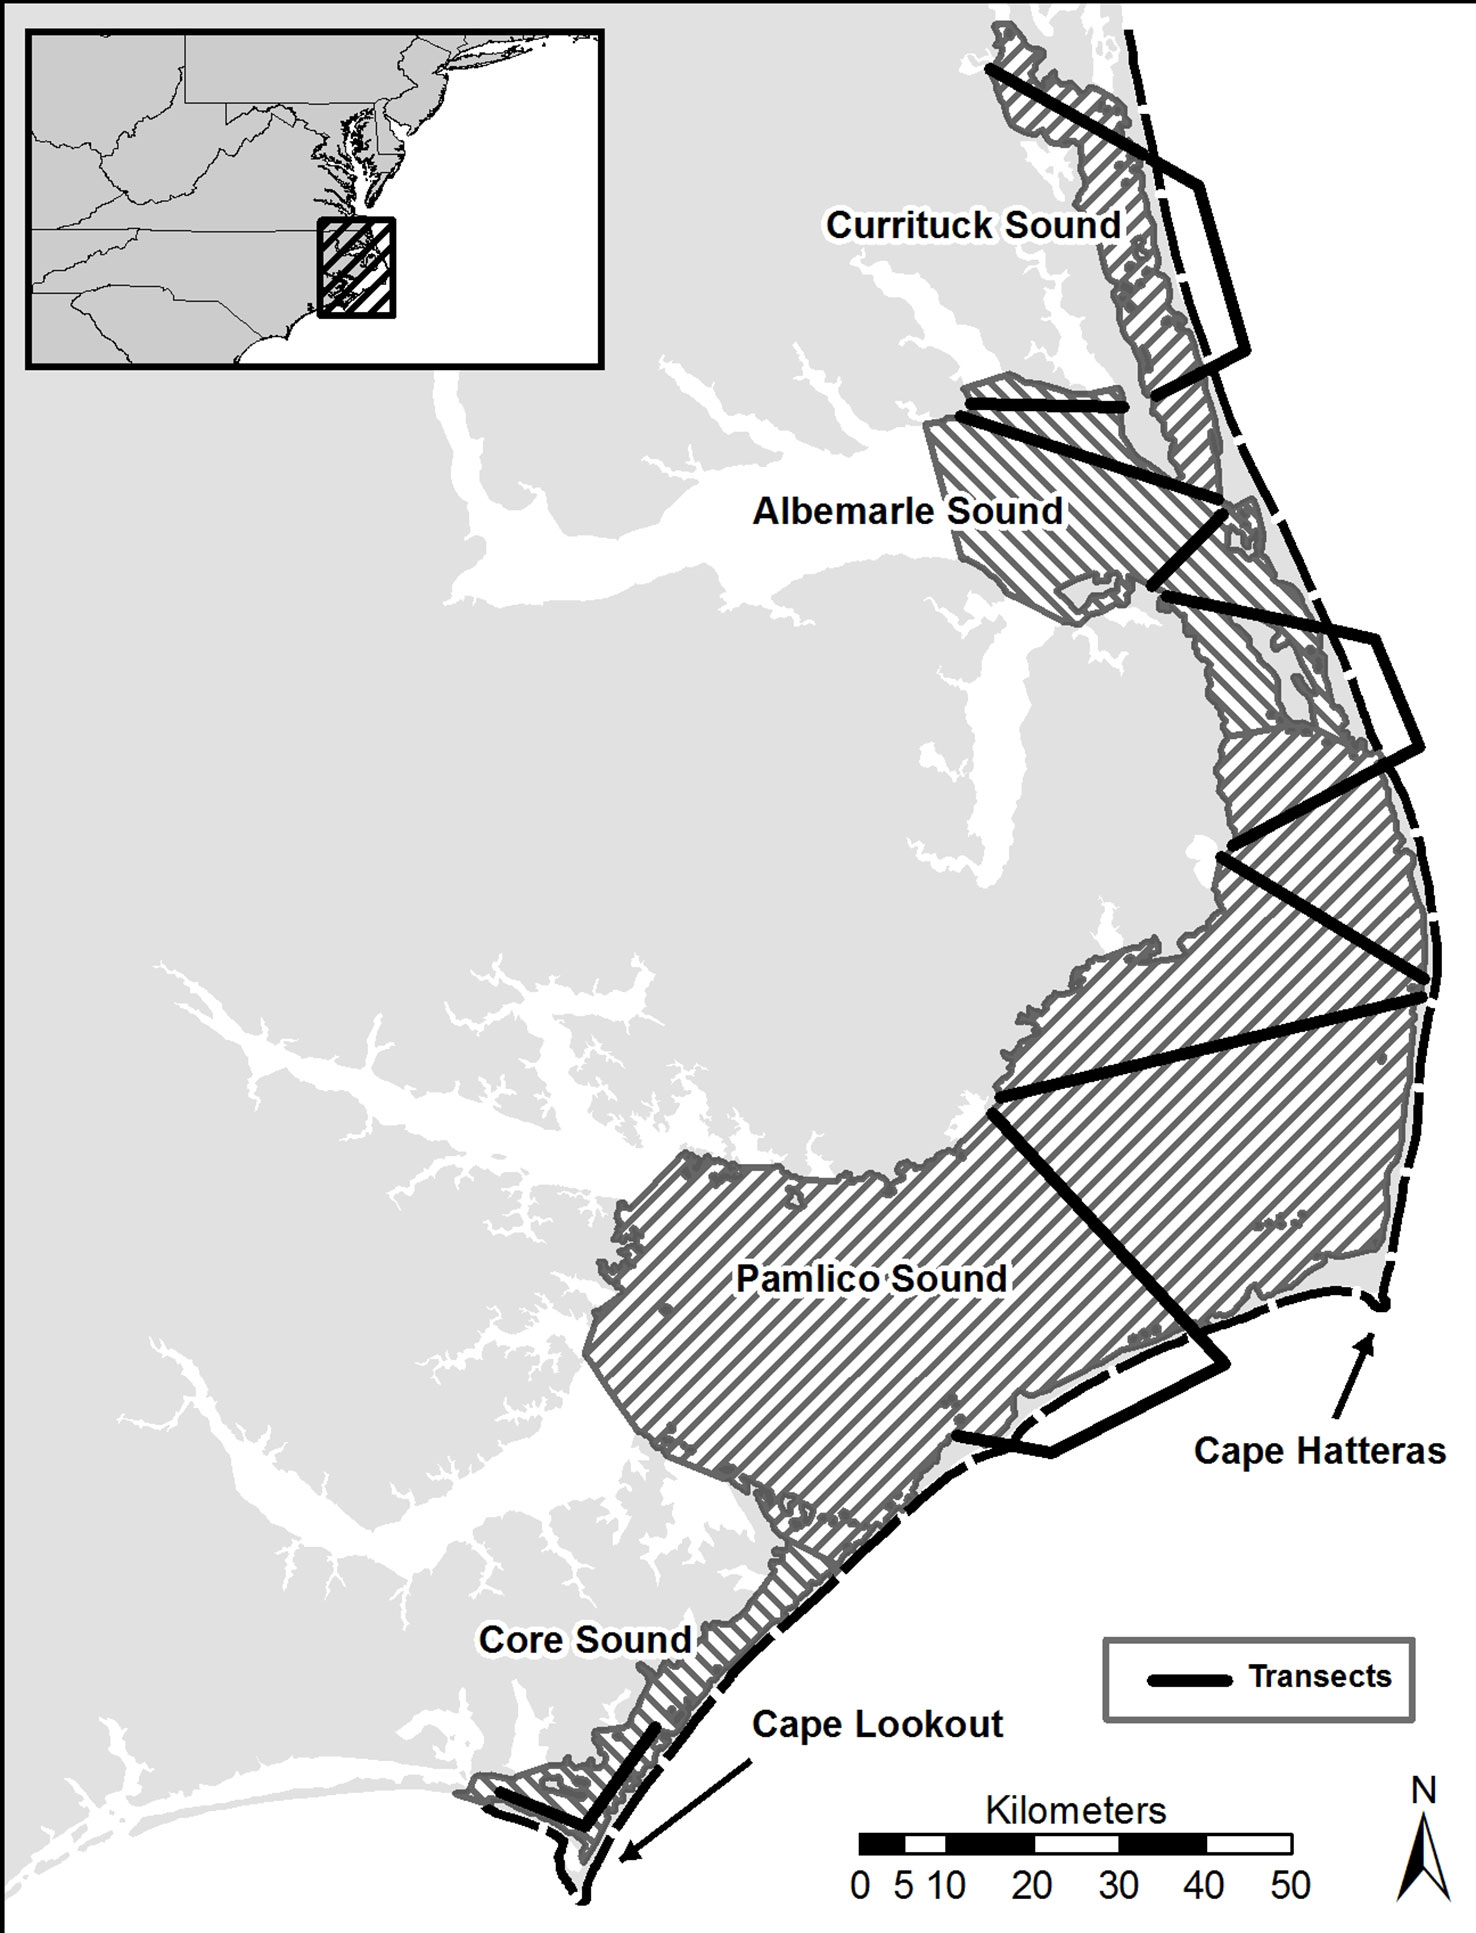
Figure 1 Map of the study area in coastal North Carolina and the network of aerial transects used to estimate numbers of double-crested cormorants during the fall, winter and spring (2019-2020, 2020, 2021).
The Western Atlantic Coast occurs on the “trailing edge” of North America away from the tectonically active plate margin. This configuration often leads to the formation of low and wide Coastal Plains that include lagoons protected by barrier islands (Inman and Nordstrom, 1971). The coast of North Carolina is composed of a network of barrier islands separated from the mainland by marsh or open lagoons. Waters are polyhaline (18-30 ppt) and microtidal (amplitude< 1 m) with two tide cyclesd but tidal fluctuations are often influenced by prevailing winds and moon phase.
2.2 Field methods
We estimated the number of double-crested cormorants using a network of repeatable aerial transects (Figure 1). The network covered the ocean out to the 3-mile (4.8-km) limit of commercial fishing and all four sounds. Ocean transects included all near-shore waters out to 1 km and three offshore transects (totaling 55.9 km) that followed the 3-mile contour. Sound transects included coverage of Currituck (2 transects totaling 26.4 km), Albemarle (4 transects totaling 78.4 km), Pamlico (4 transects totaling 131.7 km), and Core (2 transects totaling 29.9 km) Sounds. We conducted five survey flights during season one (20 November 2019 to 24 March 2020) and six survey flights during field season two (04 November 2020 to 21 April 2021). We expanded the second season from four months to five months in order to capture more of the migratory periods.
We surveyed the transect network using a Cessna 172 flying at an altitude of 61 m (200 ft) and a flight speed of 140 km/hr. We followed the outer beach from the Virginia/North Carolina border south to Beaufort Inlet, stopped for refueling in Beaufort and then flew the sound transects from Core Sound to Currituck Sound. For the purpose of aerial surveys and data analyses, we divided the near-shore ocean transect into 30, 10-km segments (Figure 1). All survey information recorded was associated with its respective segment. Sound transects were not subdivided. Transect flights took an average of 6.75 h to complete.
Transect surveys were a collaborative effort between two observers. The lead observer identified birds, recorded all birds detected, estimated the size of flocks encountered, and photographed a subset of flocks. The second observer used a GPS-enabled tablet computer to guide the plane’s position along transects and inform the lead observer of segment boundaries. Both flocks and individual birds were encountered during all surveys. Flocks were on the water surface, flying and loafing on the beach or sandbars. Flocks that were flying or on the water surface could be detected from multiple kilometers away due to the activity and splashing of birds on the water surface. We made a detour to overfly these flocks and estimate size before returning to the transect line. All flocks loafing on the beach could be readily detected from multiple km away and were estimated from the transect line.
Flocks encountered during transect surveys were estimated by the lead observer. Small flocks (<50) were enumerated entirely. Larger flocks were estimated using numerical scaling. We photographed a subset of flocks and used photographs to quantify estimation bias by comparing visual estimates to the actual number determined from photographs (N = 100). We overlaid a grid on photographs to facilitate enumeration of all birds within flocks <1,000 birds. We overlaid a grid on photographs of larger flocks and subsampled cells from throughout the flock to estimate a mean density and applied this mean to the number of occupied cells in order to estimate flock size. We evaluated the relationship between estimated and actual flock size by fitting a logistic regression (Figure 2). We found a systematic underestimate that increased with actual flock size. We derived an equation for the systematic underestimate (Adjustment = - 0.78 + (0.66*Log10(estimate)) and applied this equation to correct estimates of individuals within flocks.
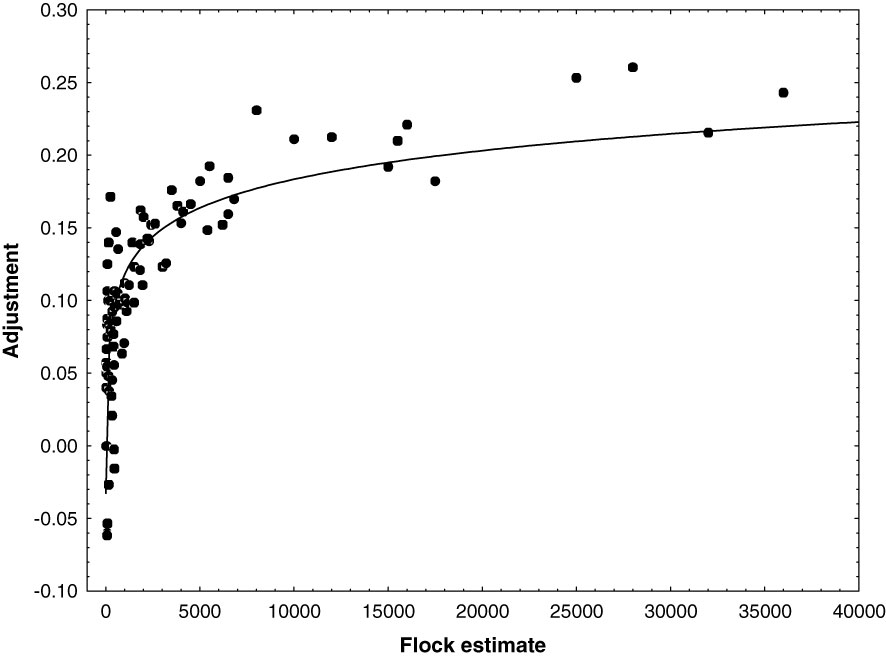
Figure 2 Plot of the percent undercount vs flock size. Percent undercount was the difference between the flock size estimated during aerials transect surveys and the actual size determined from photographs of flocks. The relationship was used to adjust flock estimates.
We assumed a 100% detection probability for roosting and foraging flocks along survey routes. We used double-observer techniques to estimate detection probabilities for birds that were not associated with flocks. We conducted paired independent surveys on the right side of the plane and recorded results for later comparison. Paired surveys were conducted for 20 seconds. We fit a multinomial-Poisson mixture model (Royle, 2004) to the data to estimate the detection probability for the lead observer using the multinomPois function within the ‘unmarked’ package (Fiske and Chandler, 2011) in program R (R Core Team, 2020).
We measured the distance from the transect line to a subsample of individual birds. We recorded altitude from the plane altimeter at the beginning of each transect segment. We used a TruePulse 360R laser rangefinder (Laser Technology) to estimate the declination angle from the plane to an individual bird. Altitude and declination angle were used to triangulate the distance of the bird from the transect line.
2.3 Analytical methods
2.3.1 Transect estimates
We handled flock and individual data separately to estimate bird numbers within each transect unit. Flock sizes were adjusted to account for the systematic undercount (see above). Distance sampling was used to estimate densities of birds detected that were not part of flocks. We first adjusted raw numbers by multiplying the reciprocal of detection bias (derived using double-observer techniques) for the lead observer. We applied the distribution of detection distances to the adjusted numbers. We used 200-m bins. After data adjustments, we fit hierarchical distance sampling models (Royle et al., 2004) using the distsamp function within the ‘unmarked’ package (Fiske and Chandler, 2011) in program R (R Core Team, 2020) for all transect segments and surveys. We examined model fit of hazard-rate, half-normal, exponential, and uniform detection distributions and chose hazard-rate. We included a sound parameter (Currituck, Albemarle, Pamlico, Core) for birds observed on sound transects and a segment parameter for birds observed along the near-shore transect. We then used our model results to generate densities of birds in each sound and near-shore segment. We combined flock and distance sampling datasets to estimate the total number of birds using each sound and near-shore transect segment for each survey period.
2.3.2 Fish demand
We used a bioenergetic approach to estimate daily and survey-wide fish demand by 1) estimating bird days and 2) estimating daily fish demand for an individual cormorant. We used the transect survey results to estimate bird days. We used total estimates from survey dates (N = 5 and 6 for field seasons 1 and 2 respectively) as population benchmarks and interpolated between these dates using a LOESS regression (Cleveland et al., 1992). We used the LOESS curve to estimate birds by day across the study period and summed these to generate total bird days for the time period. We estimated parameters for each field season using the first and last survey dates. In order to allow for comparisons between years (field season two was one month longer than field season one) we truncated the second season according to the duration of the first. We also stratified demand according to the geographic units surveyed.
We estimated the daily energy intake of a single cormorant using the field metabolic rate (FMR = basal metabolic rate + additional costs of living). We used the general seabird FMR regression from Ellis and Gabrielsen (2002) to estimate the daily energy expenditure as follows:
where M is the mass (g) of a cormorant.
We do not have a sample of cormorant masses from the study area. Cormorant mass varies with gender and latitude (Hatch and Weseloh, 1999). We used a sample of masses collected during the winter from Mississippi (Glahn et al., 1995) because these birds are expected to be from breeding areas representing similar latitudes as those within our study area. We used a midpoint of 2,050 g (minimum and maximum values were 1,861 and 2,442 respectively). This value produced a FMR estimate of 2,390 kj per cormorant-d.
We estimated fish demand by weight per cormorant per day by dividing FMR by the energy density (kj/g) of prey (menhaden). Our primary objective is to determine the maximum potential consumption of menhaden by cormorants within the study area or the upper bound of cormorant impact on the menhaden fishery. There have been no cormorant diet studies within the study area. However, timing and distribution of cormorant concentrations relative to known menhaden concentrations along with the fact that we regularly observed foraging flocks over schools of menhaden suggest that menhaden likely account for a significant portion of the fish demand. Foraging flocks regularly exceeded 10,000 individuals and we do not know of other species of schooling fish in the area that could support this activity.
The energy density of menhaden varies with developmental stage, season and latitude (e.g., Rippetoe, 1993; Lamb et al., 2017). Cormorants are gape-limited and although they have been documented to use fish that range from 3 to 40 cm in length, numerous diet studies (e.g., Campo et al., 1993; Glahn et al., 1995; Neuman et al., 1997) suggest that the largest portion of overall prey mass comes from fish around 7 to 15 cm. This size coincides with menhaden that are transitioning from age 0 to age 1 and is consistent with the dominant size class during the late fall to early spring within the SAB (Wenner and Sedberry, 1989). Energy density estimates for age 1 menhaden range from (4,038 to 8,717 j/g (Durbin and Durbin, 1981; Nelson et al., 2006). We used a midpoint between these estimates of 6,378 j/g. We used 0.779 as an estimate of digestive efficiency (Brugger, 1993). These values suggest a consumption rate of 481 g (outer range of values 351.8 - 759.8 g) of menhaden per cormorant-d or approximately 23.5% of body mass.
3 Results
A large number of double-crested cormorants used the study area between 20 November and 24 March during the field seasons of 2019-2020 and 2020-2021 (Figure 3). Seasonal patterns of occurrence were similar between years with the largest number of birds moving through the area from late November through mid-December, moving out and reaching a low from mid-January through mid-February and then moving back through from late-February through March. The spring passage extended beyond the survey window and the increase in birds in April of 2021 was a movement dominated (>80%) by juvenile-plumaged birds. Numbers peaked around 122,000 to 131,000 during southward migration, reached a low of 30,000 to 39,000 in winter and then a peak of 67,000 to 68,000 during northward migration (Figure 3). It appears that the peak in fall usage was missed during the first field season. We did not capture the spring peak within, the survey window. The extended spring survey during the second field season reached a high of 91,000 but it is not clear that this was a peak (Figure 3).
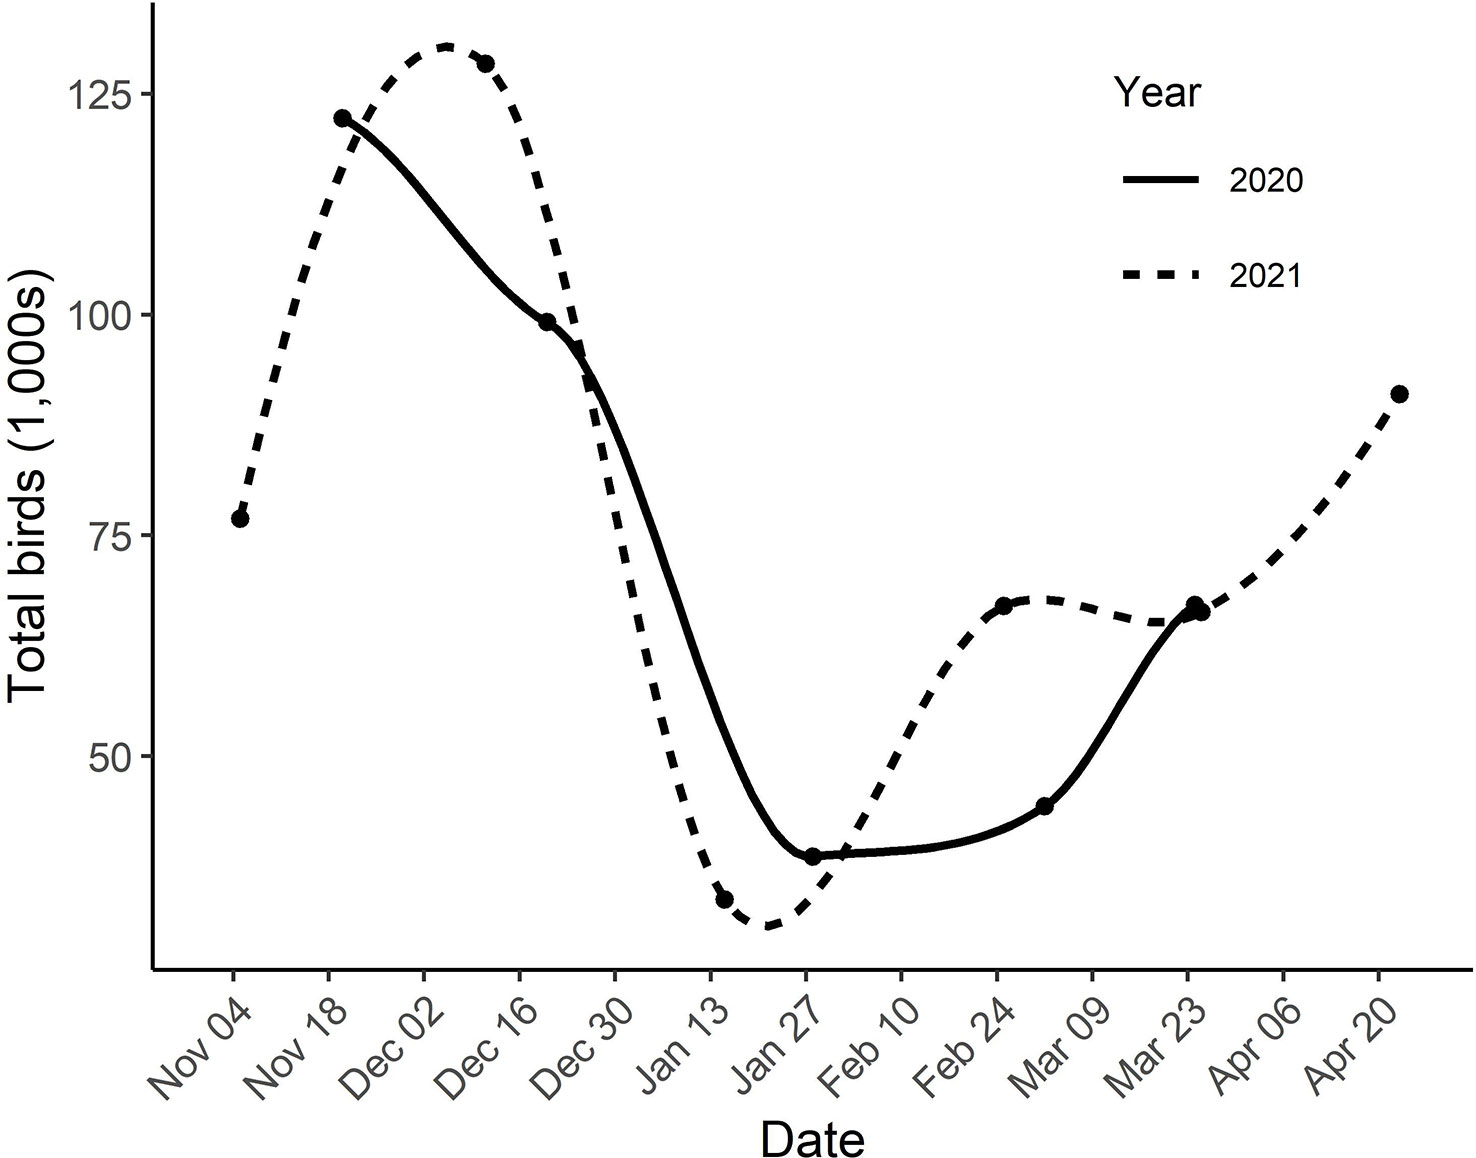
Figure 3 Estimated number of cormorants within the study area from 04 November 2019 to 24 March 2020 and 04 November 2020 to 21 April 2021 as determined by aerial transect surveys. Dots are results of individual surveys. Curves were fit using LOESS regression.
We estimated the number of cormorant days within the study period to be 8.6 x 10⁶ and 9.2 x 10⁶ for the two seasons respectively (Table 1). Extension of the survey window earlier in the fall and later in the spring during the second field season resulted in an increase in cormorant days from 9.2 x 10⁶ to 13.1 x 10⁶ or 42.4%. We estimated that cormorants consumed approximately 5,334 and 5,660 mt of menhaden equivalents within the study area (Table 1). Extension of the survey window during the second field season increase estimated menhaden consumption from 5,660 to 8,060 mt. Estimated consumption peaked between 76 and 81 mt-d during fall passage and reached a low of 19 and 24 mt-d during the winter (Figure 4).
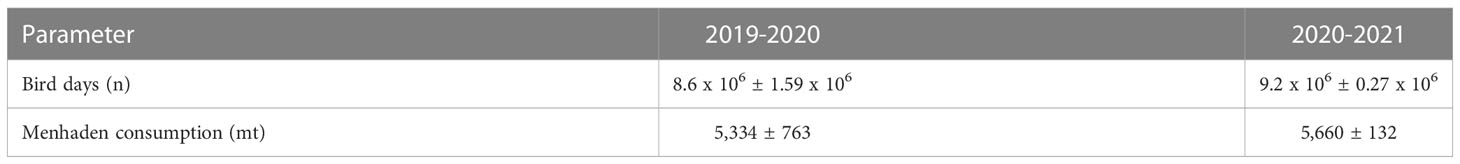
Table 1 Summary statistics for estimated cormorant days and estimated menhaden consumption by weight during the period 20 November to 24 March (2019-2021). Values presented are mean estimates ± S.E.
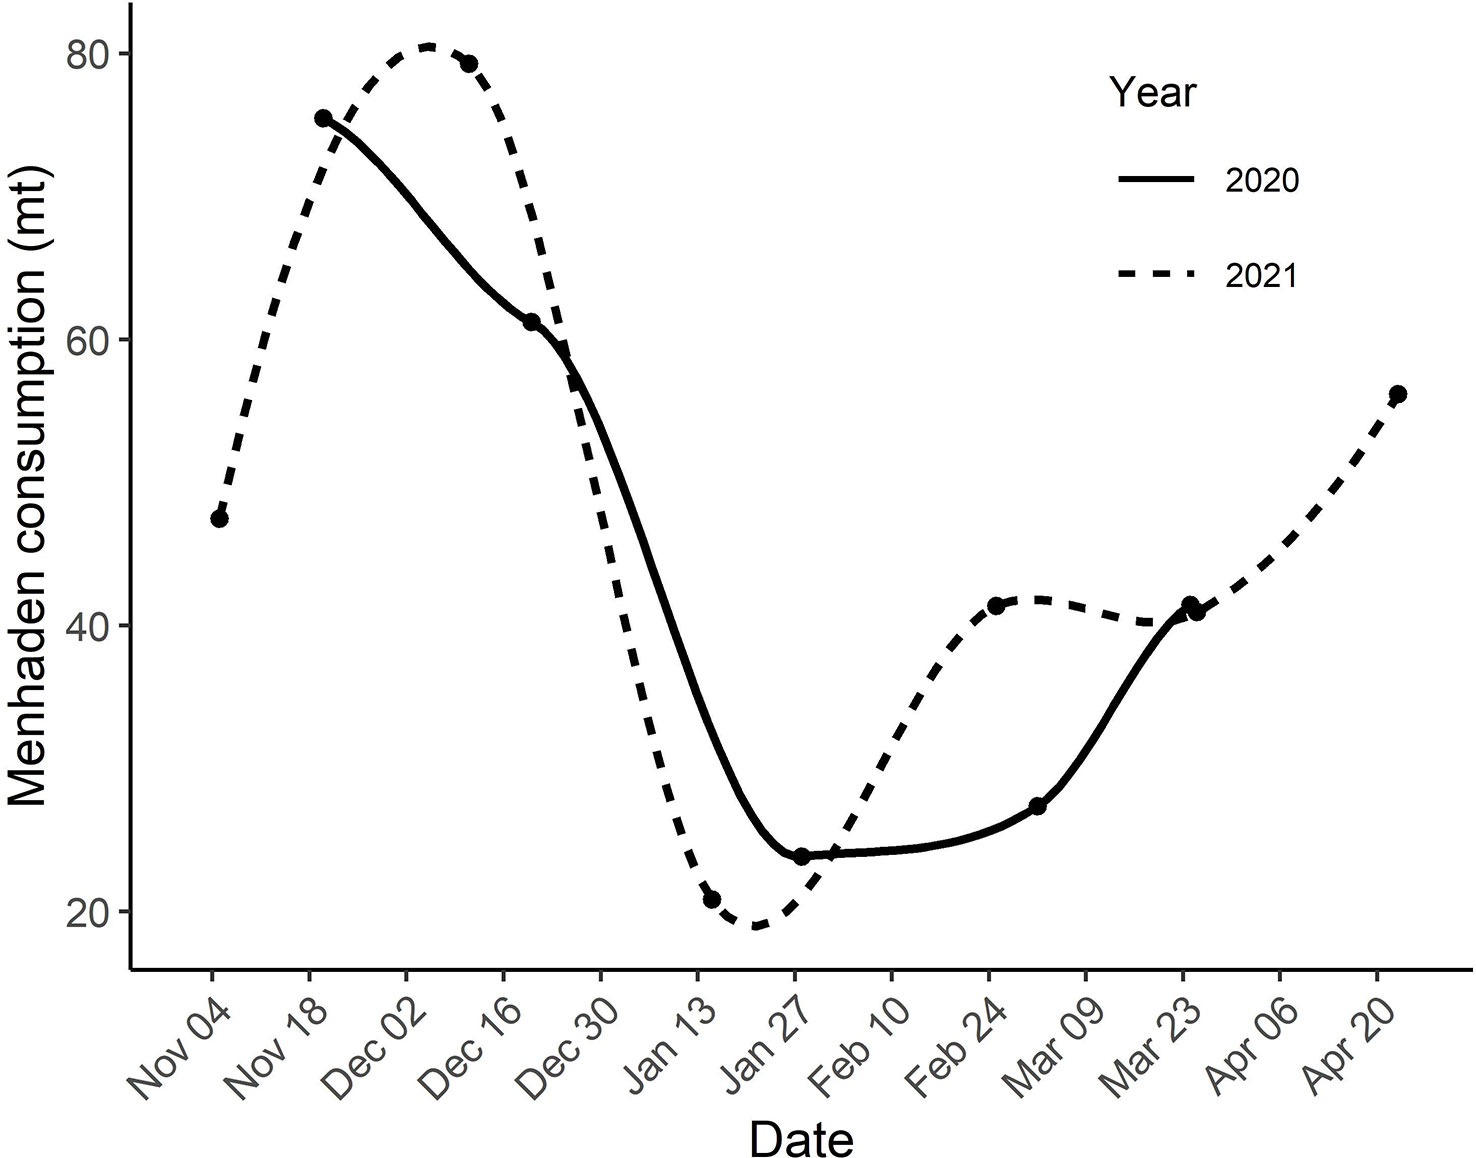
Figure 4 Estimated consumption (mt) of menhaden within the study area from 04 November 2019 to 24 March 2020 and 04 November 2020 to 21 April 2021. Estimates are based on the number of cormorants surveyed along aerial transects and the fish demand per cormorant per day. Dots are estimates based on individual surveys. Curves were fit using LOESS regression.
Cormorants were widespread throughout the study area but were most concentrated within the southern portion. Along the outer coast, cumulative cormorant density (bird days/km) south of Cape Hatteras was 6 to 3-fold higher than density north of Cape Hatteras for the two seasons respectively (Table 2). A similar pattern was documented for the northern (Currituck, Albemarle) and southern sounds (Pamlico, Core). Cumulative density of cormorant days for southern sounds ranged from 241.6 to 881.7 (bird days/km2) compared to 24.8 to 187.9 for northern sounds. Associated menhaden consumption was also concentrated within the southern portion of the study area (Table 2).
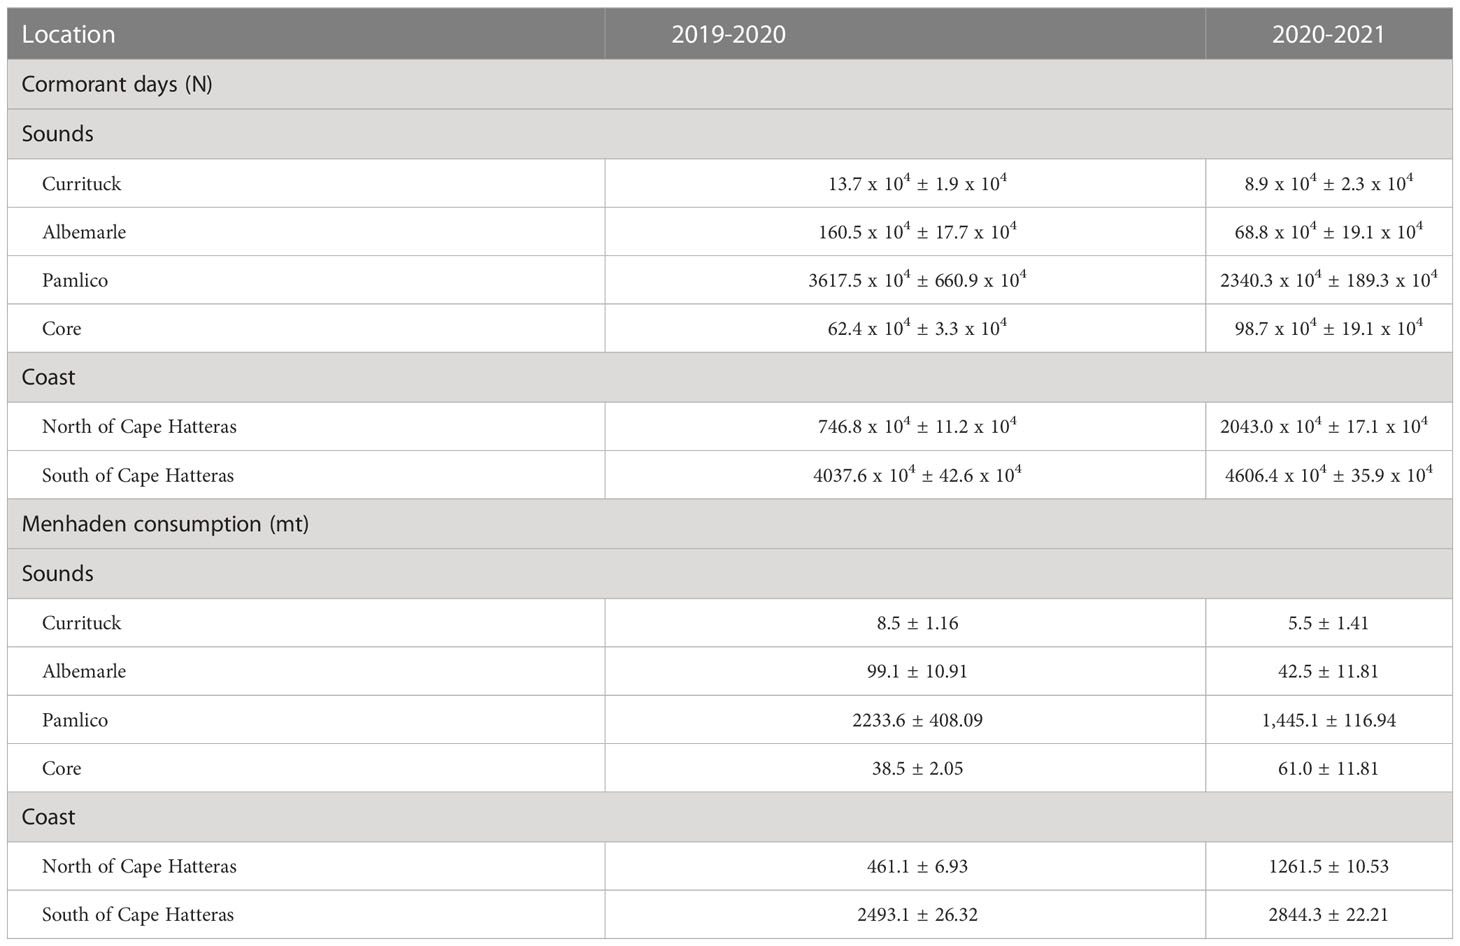
Table 2 Distribution of cormorant days and estimated menhaden consumption during the period 20 November to 24 March (2019-2021). Values presented are means ± S.E.
Although cormorants were observed as scattered individuals the majority (>90%) were associated with foraging flocks. The size of foraging flocks ranged between 5 and 44,000 (median = 160) and was highly skewed to small flocks (Figure 5) with 86% (N = 542) falling below 2,000 individuals, 76% below 500, 43% below 100 and 30% below 50. Despite the fact that most flocks were smaller than 2,000 individuals, flocks above this size accounted for 82% of the individuals suggesting that most cormorants within the study area are concentrated within large flocks. Flocks containing >2,000 individuals were observed during all surveys with the number ranging from 4 to 11 large flocks. Large flocks were scattered within sounds but most were near inlets. Large foraging flocks along the outer coast were confined to the “swell zone” just seaward of the surf (breaking waves). Depending on the wind conditions the swell zone extended from 100 to 300 m offshore. Cormorant flocks were rarely observed beyond 500 m offshore and none were detected along offshore transects. The typical configuration was a large foraging flock within the swell zone and a flock of loafing birds on the adjacent beach with birds moving back and forth between the two areas.
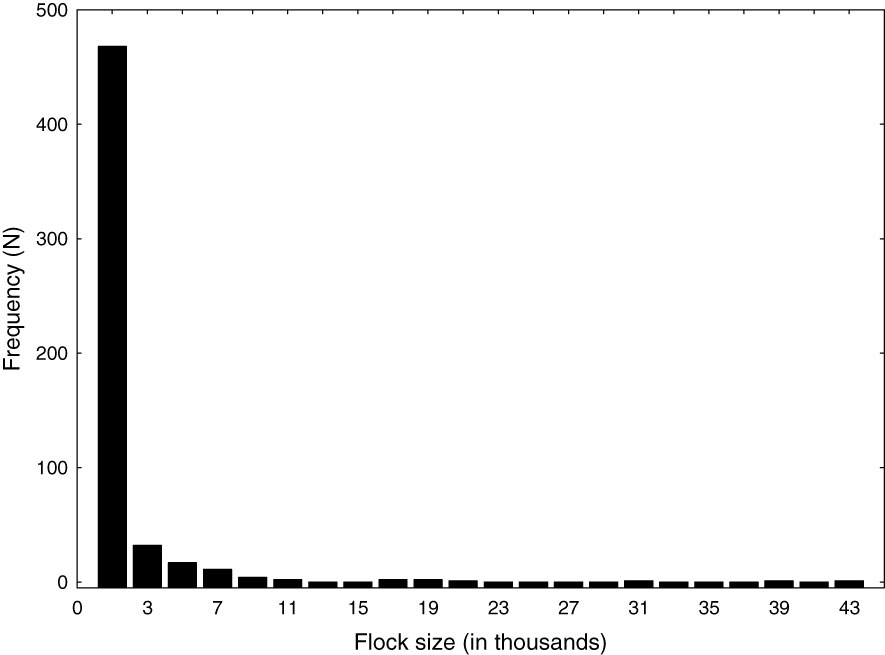
Figure 5 Frequency distribution of the size of foraging cormorant flocks (N = 542) observed within the North Carolina study area from 04 November 2019 to 24 March 2020 and 04 November 2020 to 21 April 2021. Foraging flocks were encountered and estimated during aerial transect surveys.
4 Discussion
Coastal North Carolina represents a relatively large convergence area for eastern double-crested cormorants during the nonbreeding season. The largest use was from mid-November through mid-December when birds use the study area near the end of their post-breeding migration. The majority of these birds continue moving south with a smaller number actually spending the winter. Birds move back through the area in early spring. We do not have estimates of mean stopover duration for either fall or spring so we are unable to estimate the total number of individuals that use the study area. An estimate from the late 1990s of the breeding population east of Lake Huron (believed to use the Atlantic Flyway) is 135,000 pairs (Wires et al., 2001). Given the reproductive rate, age to first reproduction and survival rates, this breeding population would be expected to represent several hundred thousand individuals during the post-breeding period. A more recent estimate of the Atlantic Flyway population is 254,000 to 294,000 individuals (United States Fish and Wildlife Service [USFWS], 2020). This range of values was derived as minimum pre-breeding estimates to be used in potential biological removal modeling. The estimates were derived from 1) using surveys of nesting pairs and a multiplier to account for local nonbreeders and 2) using a projection matrix and solving for the size of different age classes assuming a stable age distribution. Both estimates are pre-breeding minimums (consistent with objective) that do not consider nonbreeding adults, juveniles that do not return to breeding areas or young produced during the breeding season. As with the previous estimate, these estimates likely represent several hundred thousand individuals during the post-breeding period. The estimates derived here suggest that a significant portion of the Atlantic Flyway population uses the study area at least during fall migration.
North Carolina is the gateway to the fisheries of the SAB. Trawl surveys in near-shore waters throughout the region have identified dozens of fish species but three including spot (Leiostomus xanthurus), Atlantic croaker (Micropoponias undulatus) and Atlantic menhaden are dominant in terms of both numbers and biomass (Wenner and Sedberry, 1989). Size distribution for all three of these species within the region is consistent with preferred prey size for cormorants. The species differ in seasonality and center of abundance within the SAB. The importance of spot was highest in the spring and lowest in the fall and the center of abundance during the winter was off the coast of Georgia. The importance of croaker was highest in summer and early fall and lowest during winter and spring with a center of abundance during winter that was south of Savannah, GA. Atlantic menhaden was the dominant fish in trawls during winter with lower numbers in spring and fall and did not rank in the top 25 species during summer.
The seasonality of cormorant movement is consistent with that of Atlantic Menhaden. The majority of menhaden from the Northeast migrate south to the Carolinas arriving in October for spawning from December through February (Roithmayr, 1963, Nicholson, 1978, Southeast Data Assessment and Review [SEDAR], 2020. Similarly, menhaden exit the Chesapeake Bay in October and re-enter in March (Dalyander and Cerco, 2010). The center of abundance for menhaden catches during the fall extends from Cape Hatteras, NC south to Charleston, SC (Wenner and Sedberry, 1989). By January, the center of abundance has moved south with the highest catches from Charleston, SC to southern Georgia with continued high catches just south of Cape Fear. Large catches within the southern areas are dominated by age 0 fish. Most cormorants depart from northern breeding areas by mid-September (Hatch and Weseloh, 1999; Dorr et al., 2012) with peak passage through New England completed by mid-October (Nisbet and Baird, 1959). Cormorant numbers begin to build within the study area in October reaching a peak in late November through early December. Birds appear to stage within the study area with menhaden concentrations during the late fall and then follow these fish south. Compared to the fall peak, 25-30% of cormorants spend the winter months within the study area. Menhaden begin to migrate north in March. Cormorants begin to migrate north during March and arrive on northern breeding grounds by mid-April (Hatch and Weseloh, 1999; Dorr et al., 2012). Spring migration is much more rapid compared to fall such that cormorants may bypass the study area or stopover for shorter periods during the spring. First-year birds migrate and arrive on breeding grounds approximately one month later than adults (Dolbeer, 1991). Surveys of communal roosts within the study area (not presented here) indicate that >80% of birds after March are juveniles.
As configured here overall fish consumption is sensitive to the consumption rate per cormorant and the number of cormorant days. The consumption rate of 481 g-d (based on the energy density of menhaden) or 23.5% of body mass is consistent with other values reported for double-crested cormorants. Glahn and Brugger (1995) estimated that cormorants wintering along the Mississippi Delta consumed 451 to 537 g of catfish/day or 21 to 24% of body mass. Fowle (1997) estimated that cormorants breeding on Lake Champlain consumed 412 to 526 g of fish or 18 to 24% of body mass. Goktepe et al. (2012) using two bioenergetics models estimated that cormorants nesting on Leech Lake in Minnesota consumed 523 to 790 g-d or 26 to 33% of body mass during one year and 358 to 541 g-d or 18 to 22% of body mass during a second year. Hebert and Morrison (2003) estimated that cormorants consumed 320 g-d or 17% of their body mass on Lake Erie.
Our late fall through early spring field seasons did not capture all of the cormorant days within the study area. The initial objective of surveys was to estimate the number of cormorants spending the winter within the study area. Following the first field season it was clear that the larger use and associated fish demand was concentrated within fall and spring migrations. Extension of the seasonal coverage earlier in the fall and later in the spring during the second field season increased estimated bird days by 42% but still did not capture the end of spring movements. Of much greater significance to the fisheries of the SAB and how cormorants fit within this ecosystem is the fish demand of cormorants that continue south from the study area. A minimum estimate of these birds based on the surveys within the study area alone would be 150,000. These birds spend 2.5 months south of the study area equating to 11.3 x 10⁶ bird days or nearly 7,000 mt of menhaden equivalents. It remains unclear what portion of cormorants using the Atlantic Flyway settle in winter areas within inland lakes and rivers or along the coast within the SAB. Further work is needed on both distribution and diet to better understand how cormorants fit within the coastal fisheries of the south Atlantic.
The role of cormorants in the Atlantic menhaden fishery has never been assessed. Atlantic menhaden are regulated by the Atlantic States Marine Fisheries Commission (ASMFC) that monitors major sources of mortality to inform harvest policy (Southeast Data Assessment and Review [SEDAR], 2015). Harvest policy has evolved in recent decades from no management to maximum-sustained-yield to the development of models designed to evaluate the tradeoffs between commercial take and ecosystem services (Anstead et al., 2021). Average annual removal of Atlantic menhaden has been around 350,000 mt in recent years including commercial and recreational take by humans (reduction fishery; 180,000 mt, bait industry; 42,000 and recreational landings; 2,700 mt for 2013-2017) and estimated consumption by predatory fish (130,000 mt for 1998-2012) (Southeast Data Assessment and Review [SEDAR], 2020). We estimate that cormorants within the study area consumed below 9,000 mt (second season extended estimate 8,060 mt) of menhaden equivalents during the late fall through early spring period. This level of consumption represents 4% of the human take, 7% of the consumption by predatory fish or 2.5% of the known take (estimated for the entire Atlantic Coast stock). Even if we assume that pass through cormorants remain within the SAB and focus on menhaden, consumption is unlikely to exceed 20,000 mt-y or<6% of the known take. Double-crested cormorants appear to be a minor consumer within the broader web of consumers (including commercial industry) that depend on menhaden. However, it should be noted that biomass consumed is not always the best indicator of potential impact to fisheries. Cormorants have been shown to focus consumption on specific size/age classes and this biased predation may result in demographic bottlenecks leading to reduced recruitment that may become a limiting factor for some populations (e.g., Burnett et al., 2002; Lantry et al., 2002).
Throughout this treatment we have assumed that most of the fish demand from cormorants within the study area is focused on Atlantic menhaden. However, the evidence for this assumption is circumstantial. Although both cormorants and menhaden converge on the study area in late fall and menhaden are a likely focus of foraging cormorants, a detailed diet study is required to stratify fish demand according to species. A more complete exploration of cormorant-menhaden interactions would require that both population estimates and diet work be expanded to the larger SAB region.
5 Conclusions
Large numbers of double-crested cormorants use coastal North Carolina primarily during fall and spring migrations. The area appears to service a significant portion of the estimated eastern breeding population. Cormorants reached their highest concentrations within Pamlico and Core Sounds and along the outer coast south of Cape Hatteras. The collective annual use of the area is on the order of 9 x 10⁶ cormorant days with an associated metabolic demand of less than 9,000 mt of menhaden equivalents. The pass-through nature of the seasonal pattern suggests that cormorants may come to the area while menhaden are resident and follow them south into the SAB. The level of consumption of menhaden by cormorants within the study area is minor when compared with other sources of known menhaden take along the entire Atlantic Coast. However, this finding does not mean that cormorants are not driving local depletion within some areas. Additional work focused on the SAB during the winter months would provide a more complete assessment of the relationship between cormorant consumption and the menhaden population.
Data availability statement
The raw data supporting the conclusions of this article will be made available by the authors, without undue reservation.
Author contributions
The North Carolina Wildlife Resources Commission assisted with questions to be addressed and some aspects of study design. BW did conceptualization, methodology, data collection, data analysis, writing-original draft, and editing. BP was involved with methodology and data collection. CH did methodology, data collection, data analysis, manuscript reviewing. SA focused on funding acquisition, project administration, and writing-review. All authors contributed to the article and approved the submitted version.
Funding
Funding for this work was provided by the U.S. fish and Wildlife Service, the North Carolina Wildlife Resources Commission, the North Carolina Waterman’s Foundation, and The Center for Conservation Biology.
Acknowledgments
We thank John Carpenter, David Cobb, and the avian committee of the North Carolina Wildlife Resources Commission (NCWRC) for support throughout the project. Laura Duval assisted with initial ground surveys of communal roosts. We thank Captain Fuzzzo Shermer and Matt Crabbe for piloting aerial surveys. Erica Lawler and Marie Pitts provided important administrative support from William & Mary. Kate Pipkin provided administrative support from NCWRC.
Conflict of interest
Authors have had no financial or non-financial relationships with any outside groups related to this topic. Author SA serves on a panel that is reviewing cormorant management strategies.
The remaining authors declare that the research was conducted in the absence of any commercial or financial relationships that could be construed as a potential conflict of interest.
Publisher’s note
All claims expressed in this article are solely those of the authors and do not necessarily represent those of their affiliated organizations, or those of the publisher, the editors and the reviewers. Any product that may be evaluated in this article, or claim that may be made by its manufacturer, is not guaranteed or endorsed by the publisher.
References
Ahrenholz D. W. (1991). Population biology and life history of the north American menhadens. brevoortia spp. Mar. Fish. Rev. 53, 3–19.
Anstead K. A., Drew K., Chagaris D., Cieri M., Schueller A. M., McNamee J. E., et al. (2021). The path to an ecosystem approach for forage fish management: a case study of Atlantic menhaden. Front. Mar. Sci. 8. doi: 10.3389/fmars.2021.607657
Brugger K. E. (1993). Digestibility of three fish species by double-crested cormorants (Phalacrocorax auritus). Condor 95, 25–32. doi: 10.2307/1369383
Burnett J. A. D., Ringler N. H., Lantry B. F., Johnson J. H. (2002). Double-crested cormorant predation on yellow perch in the eastern basin of lake Ontario. J. Great Lakes Res. 28, 202–211. doi: 10.1016/S0380-1330(02)70577-7
Campo J. J., Thompson B. C., Barron J. C., Telfair R. C. II, Durocher P. P., Gutreuter S. J. (1993). Diet of double-crested cormorants wintering in Texas. J. Field Ornithol. 64, 135–144.
Cleveland W. S., Grosse E., Shyu W. M. (1992). “Local regression models. chapter 8,” in Statistical models. Eds. Chambers S.e. J. M., Hastie T. J. (Pacific Grove, CA: Wadsworth & Brooks/Cole).
Craig E. C., King D. T., Sparks J. P., Curtis P. D. (2016). Aquaculture depredation by double-crested cormorants breeding in eastern north America. J. Wildlife Manage. 80, 57–62. doi: 10.1002/jwmg.989
Dalyander R. S., Cerco C. F. (2010). Integration of a fish bioenergetics model into a spatially explicit water quality model: application to menhaden in Chesapeake bay. Ecol. Model. 221, 1922–1933. doi: 10.1016/j.ecolmodel.2010.05.002
Dolbeer R. A. (1991). Migration patterns of double-crested cormorants east of the rocky mountains. J. Field Ornithol. 62, 83–93.
Dorr B. S., Burger L. W., Barras S. C., Godwin C. C. (2012). Economic impact of double-crested cormorant, Phalacrocorax auritus, depredation on channel catfish, Ictalurus punctuates aquaculture in Mississippi, USA. J. World Aquacul. Soc. 43, 502–513. doi: 10.1111/j.1749-7345.2012.00586.x
Dorr B. S., Hatch J. J., Weseloh D. V. (2014). “Double-crested cormorant (Nannopterum auritum), version 1.1,” in Birds of the world (A. f. Poole, editor). Cornell Lab of ornithology (Ithaca, NY, USA: Cornell University). doi: 10.2173/bow.doccor.01.1
Durbin E. G., Durbin A. G. (1981). Assimilation efficiency and nitrogen excretion of a filter-feeding planktivore, the Atlantic menhaden, Brevoortia tyrannus (Pisces: clupeidae). Fish. Bull. 79, 877–886.
Ellis H. I., Gabrielsen G. W. (2002). “Energetics of free-ranging seabirds,” in Biology of marine birds. Eds. Schreiber E. A., Burger. J. (Boca Raton, Florida,USA: CRC press), 359–407.
Fielder D. G. (2008). Examination of factors contributing to the decline of yellow perch population and fishery in Les cheneaux islands, lake Huron, with emphasis on the role of double-crested cormorants. J. Great Lakes Res. 34, 506–523. doi: 10.3394/0380-1330(2008)34[506:EOFCTT]2.0.CO;2
Fiske I., Chandler R. (2011). Unmarked: an r package for fitting hierarchical models of wildlife occurrence and abundance. J. Stat. soft. 43 (10), 1–23. doi: 10.18637/jss.v043.i10
Fowle M. R. (1997). Population dynamics, food habits, and bioenergetics of double-crested cormorants in lake Champlain (University of Vermont, Burlington, VT: Master's Thesis, School of Natural Resources).
Gilbertson M., Kubiak T., Ludwig J., Fox G. (1991). Great lakes embryo mortality, edema and deformities syndrome (GLEMEDS) in colonial fish-eating birds: similarity to chick-edema disease. J. Toxicol. Environ. Health 33, 455–520. doi: 10.1080/15287399109531538
Glahn J. F., Brugger K. E. (1995). The impact of double-crested cormorants on the Mississippi delta catfish industry: a bioenergetics model. Colonial Waterbirds 18, 137–142. doi: 10.2307/1521533
Glahn J. F., Dixon P. J., Littauer G. A., McCoy R. B. (1995). Food habits of double-crested cormorants wintering in the delta region of Mississippi. Colonial Waterbirds 18, 158–167. doi: 10.2307/1521536
Goktepe O., Hundt P., Porter W., Pereira D. (2012). Comparing bioenergetics models of double-crested cormorant (Phalacrocorax auritus) fish consumption. Waterbirds 35, 91–102. doi: 10.1675/063.035.sp110
Hatch J. J. (1995). Changing populations of double-crested cormorants. Waterbirds 18, 8–24. doi: 10.2307/1521520
Hatch J. J., Weseloh D. V. (1999). “Double-crested cormorant (Phalacrocorax auritus),” in The birds of north America. Eds. Poole A., Gill F. (Philadelphia, PA: The Birds of North America, Inc.).
Hebert C. E., Morrison H. A. (2003). Consumption of fish and other prey items by lake Erie waterbirds. J. Great Lakes Res. 29, 213–227. doi: 10.1016/S0380-1330(03)70428-6
Inman D. L., Nordstrom C. E. (1971). On the tectonic and morphological classification of coasts. J. Geology 79, 1–21. doi: 10.1086/627583
Lamb J. S., Satge Y. G., Jodice P. G. R. (2017). Diet composition and provisioning rates of nestlings determine reproductive success in a subtropical seabird. Mar. Ecol. Prog. Ser. 581, 149–164. doi: 10.3354/meps12301
Lantry B. F., Eckert T. H., Schneider C. P., Chrisman J. R. (2002). The relationship between the abundance of smallmouth bass and double-crested cormorants in the eastern basin of lake Ontario. J. Great Lakes Res. 28, 193–201. doi: 10.1016/S0380-1330(02)70576-5
Ludwig J. P. (1984). Decline, resurgence and population dynamics of Michigan and great lakes double-crested cormorants. Jack-Pine Warbler 62, 91–102.
McConaughy M. (1996). First double-crested cormorant nesting in Pennsylvania, Pennsylvania birds. J. Pennsylvania Soc. Ornithol. 10, 151.
Meyers K. A., Sullivan C. L., Kennedy P., Schill D. I. J., Teuscher D. M., Brimmer A. F., et al. (2016). Predation by American white pelicans and double-crested cormorants on catchable-sized hatchery rainbow trout in select Idaho lentic waters. North Am. J. Fish. Manage. 36, 294–308. doi: 10.1080/02755947.2015.1120835
National Marine Fisheries Service [NMFS] (2019). Forecast for the 2019 gulf and Atlantic menhaden purse-seine fisheries and review of the 2018 fishing season (NC, U.S.A: Beaufort).
Nelson G. A., Chase B. C., Stockwell J. D. (2006). Population consumption of fish and invertebrate prey by striped bass (Morone saxatilis) from coastal waters of northern Massachusetts, USA. Northwest Atlantic Fish. 36, 111–126. doi: 10.2960/J.v36.m576
Neuman J., Pearl D. L., Black R., Ewins P. J., Weseloh D. V., Pike M., et al. (1997). Spatial and temporal variation in the diet of the double-crested cormorant (Phalacrocorax auritus) breeding in the lower great lakes in the early 1990s. Can. J. Fish Aquat. Sci. 54, 1569–1584. doi: 10.1139/f97-064
Nicholson W. R. (1978). Movements and population structure of Atlantic menhaden indicated by tag returns. Estuaries 1, 141–150. doi: 10.2307/1351455
Nisbet I. C. T., Baird J. (1959). The autumn migration of the double-crested cormorant through eastern new England. Massachusetts Audubon 43, 224–227.
Pearce P. A., Elliott J. E., Peakall D. B., Norstrom R. J. (1989). Organochlorine contaminants in eggs of seabirds in the northwest Atlantic. Environ. pollut. 56, 217–235. doi: 10.1016/0269-7491(89)90039-0
Postupalsky S. (1978). Toxic chemicals and cormorant population in the great lakes (Ottawa, CA: Canadian Wildlife Service Report No. 40).
R Core Team (2020). R: a language and environment for statistical computing (Vienna, Austria: R Foundation for Statistical Computing). Available at: https://www.R-project.org/.
Reed J. M., Causey D., Hatch J. J., Cooke F., Crowder L. (2014). Review of the double-crested cormorant management plan 2003: final report of the AOU conservation committee’s panel (Chicago, IL: American Ornithologist’ Union).
Rippetoe T. H. (1993). Production and energetics of Atlantic menhaden in Chesapeake bay (College Park, MD, USA: M. S. Thesis. University of Maryland).
Roithmayr C. M. (1963). Distribution of fishing by purse seine vessels for Atlantic menhaden 1955-1959 (Washington DC: U.S. Fish and Wildlife Service).
Ross R. M., Johnson J. H. (1995). Seasonal and annual changes in the diet of double-crested cormorants: implications for lake ontario's fishery. Great Lakes Res. Review. 2, 1–9.
Royle J. A. (2004). Generalized estimators of avian abundance from count survey data. Anim. Biodiversity Conserv. 27 (1), 375–386.
Royle J. A., Dawson D. K., Bates S. (2004). Modeling abundance effects in distance sampling. Ecology 85, 1591–1597. doi: 10.1890/03-3127
Southeast Data Assessment and Review [SEDAR] (2015). SEDAR. 2015. SEDAR 40 – Atlantic Menhaden Stock Assessment Report. North Charleston SC: SEDAR. 643Available at: http://www.sefsc.noaa.gov/sedar/Sedar_Workshops.jsp?WorkshopNum=40.
Southeast Data Assessment and Review [SEDAR] (2020). SEDAR 69 – Atlantic menhaden benchmark stock assessment report (Charleston, SC: North Charleston, SC: SEDAR).
Stickey A. R., Andrews J. J. (1989). Survey of Mississippi catfish farmers on means, effort, and costs to repel fish-eating birds form ponds. Fourth Eastern Wildlife Damage Control Conf. 4, 105–108.
Tate J., Tate D. J. (1982). The blue list and the list of species with special concerns. Am. Birds 36, 129–134.
Trapp J. L., Lewis S. J., Pence D. M. (1999). “Double-crested cormorant impacts on sport fish: literature review, agency survey, and strategies,” in Symposium on double-crested cormorants: population status and management issues in the Midwest. Ed. Tobin M. E. (Berkley, CA: USDA/APHIS Technical Bulletin No. 1879), 87–96.
United States Fish and Wildlife Service [USFWS] (1998). Migratory bird permits; establishment of a depredation order for double-crested cormorant (Final rule) (Washington DC: USDI/Fish and Wildlife Service), 1018–AE11.
United States Fish and Wildlife Service [USFWS] (2003). Migratory bird permits; regulations for double-crested cormorant management (Final rule). Federal Register 68 (195), 58022–58037.
United States Fish and Wildlife Service [USFWS] (2020). Final environmental impact statement: management of conflicts associated with double-crested cormorants (Falls Church, VA, USA: U.S. Department of Interior, Fish and Wildlife Service).
Vermeer K., Rankin L. (1984). Population trends in nesting double-crested and pelagic cormorants in Canada. Murrelet 65, 1–9. doi: 10.2307/3534203
Watts B. D., Bradshaw D. S. (1996). Population expansion by double-crested cormorants in Virginia. Raven 67, 75–78.
Wenner C. A., Sedberry G. R. (1989). Species composition, distribution, and relative abundance of fishes in the coastal habitat off the southeastern united states (United States: NOAA Technical Report).
Weseloh D. V., Ewins P. J. (1994). Characteristics of a rapidly increasing colony of double-crested cormorants (Phalacrocorax auritus) in lake Ontario: population size, reproductive parameter and band recoveries. J. Great Lakes Res. 10, 443–456. doi: 10.1016/S0380-1330(94)71161-8
Weseloh D. V., Teeple S. M., Gilbertson M. (1983). Double-crested cormorants of the great lakes: egg-laying parameters, reproductive failure and contaminant residues in eggs. Can. J. Zool. 61, 427–436. doi: 10.1139/z83-057
Wires L. R. (2015). Migratory bird population, a crack in the armor: the case of the double-crested cormorant. Avian Conserv. Ecol. 10, 8. doi: 10.5751/ACE-00761-100108
Wires L. R., Cuthbert F. J. (2006). Historic populations of the double-crested cormorant (Phalacrocorax auritus): implications for conservation and management in the 21st century. Waterbirds 29, 9–37. doi: 10.1675/1524-4695(2006)29[9:HPOTDC]2.0.CO;2
Keywords: double-crested cormorant, menhaden, North Carolina, bioenergetics, non-breeding, ecosystem
Citation: Watts BD, Paxton BJ, Hines C and Anderson SK (2023) Estimating potential menhaden consumption by double-crested cormorants along the coast of North Carolina. Front. Mar. Sci. 10:1193429. doi: 10.3389/fmars.2023.1193429
Received: 24 March 2023; Accepted: 16 May 2023;
Published: 14 June 2023.
Edited by:
Bernardo Antonio Perez Da Gama, Fluminense Federal University, BrazilReviewed by:
Niels Jepsen, Technical University of Denmark, DenmarkSalvatore Siciliano, Fundação Oswaldo Cruz (Fiocruz), Brazil
Copyright © 2023 Watts, Paxton, Hines and Anderson. This is an open-access article distributed under the terms of the Creative Commons Attribution License (CC BY). The use, distribution or reproduction in other forums is permitted, provided the original author(s) and the copyright owner(s) are credited and that the original publication in this journal is cited, in accordance with accepted academic practice. No use, distribution or reproduction is permitted which does not comply with these terms.
*Correspondence: Bryan D. Watts, YmR3YXR0QHdtLmVkdQ==