 Cheng-long Li
 Yingxu Wu
 Kui Chen2
 Liqi Chen
 Di Qi
Di Qi- 1Polar and Marine Research Institute, Jimei University, Xiamen, China
- 2Key Laboratory of Global Change and Marine-Atmospheric Chemistry of Ministry of Natural Resources (MNR), Third Institute of Oceanography, MNR, Xiamen, China
Oceanic uptake of anthropogenic CO2 causes a decrease in seawater pH and aragonite saturation state (Ωarag), a process known as ocean acidification (OA). The western North Pacific is a hotspot for anthropogenic CO2 sinks; however, the spatiotemporal variability of pH and Ωarag and their controlling mechanisms remain unexplored. In this study, we provide high-frequency and high-precision underway measurements of sea surface pCO2 and pH to investigate the distribution and drivers of OA metrics across different hydrochemical gradients in the western North Pacific in late spring 2018, a season with the highest primary production in the year. Our results show that the surface pH reached near air-sea equilibrium in the subtropical zone but gradually increased northward across the Kuroshio Recirculation (KR) zone and peaked in the Kuroshio Extension (KE) zone. We found that sea surface temperature played the most prominent role in regulating pH, which was also counteracted by the effects of air–sea gas exchange and vertical mixing. In contrast, the distribution of Ωarag largely mirrored the pH and was governed by air–sea gas exchange and vertical mixing, the effects of which on Ωarag were enhanced by temperature. Biological activity thrived in the KE zone to increase both pH and Ωarag, which further reinforced the latitudinal pattern of pH, but weakened that of Ωarag. These findings are based on direct in situ measurements of pH and improve our understanding of the spatiotemporal variability of OA metrics in the western North Pacific region.
1 Introduction
The ocean absorbs approximately a quarter of the anthropogenic CO2 emissions annually, effectively alleviating global climate change (Gruber et al., 2019; Friedlingstein et al., 2022). However, absorbed anthropogenic CO2 causes a decrease in seawater pH and aragonite saturation state (Ωarag), a process commonly known as ocean acidification (OA) (Doney et al., 2009; Feely et al., 2009), which endangers marine organisms and ecosystems (Orr et al., 2005; Waldbusser et al., 2015; Doney et al., 2020). In general, the decline rates of global open ocean surface OA metrics (e.g., pH and Ωarag) have followed an increase in atmospheric CO2 over the past few decades (Bates et al., 2014; Takahashi et al., 2014; Jiang et al., 2023). Efforts have been made to investigate the global or hemispheric-scale distributions of OA metrics and their controlling processes (e.g., Takahashi et al., 2014; Jiang et al., 2015; Fassbender et al., 2017; Lauvset et al., 2020; Wu et al., 2021; Xue et al., 2021). These studies have suggested that the spatiotemporal variabilities and drivers of OA metrics are geographically diverse due to regional differences in physical and biogeochemical processes, primarily related to the combined effects of temperature, air–sea gas exchange, water mixing, biological activity, and sea ice melt.
The western North Pacific, a highly dynamic region that includes the Kuroshio Extension (KE), Kuroshio Recirculation (KR), and southern subtropical regions (Figure 1A), is the largest annual net CO2 sink in the Pacific Ocean (Takahashi et al., 2009). Seasonally, the KE and KR waters are CO2 sinks in winter–spring and weak sources in summer–autumn, mainly driven by seasonal temperature variations (Takahashi et al., 2002). Consequently, the surface OA metrics in the KE and KR waters also showed significant seasonal variations, mainly controlled by temperature and its induced air–sea gas exchange (Ishii et al., 2011; Kim et al., 2015). In general, the OA metrics in the southern subtropical region are annually in equilibrium with atmospheric CO2 (Ono et al., 2019), whereas the spatial variability and drivers of OA metrics across the KE, KR, and southern subtropical regions remain poorly constrained.
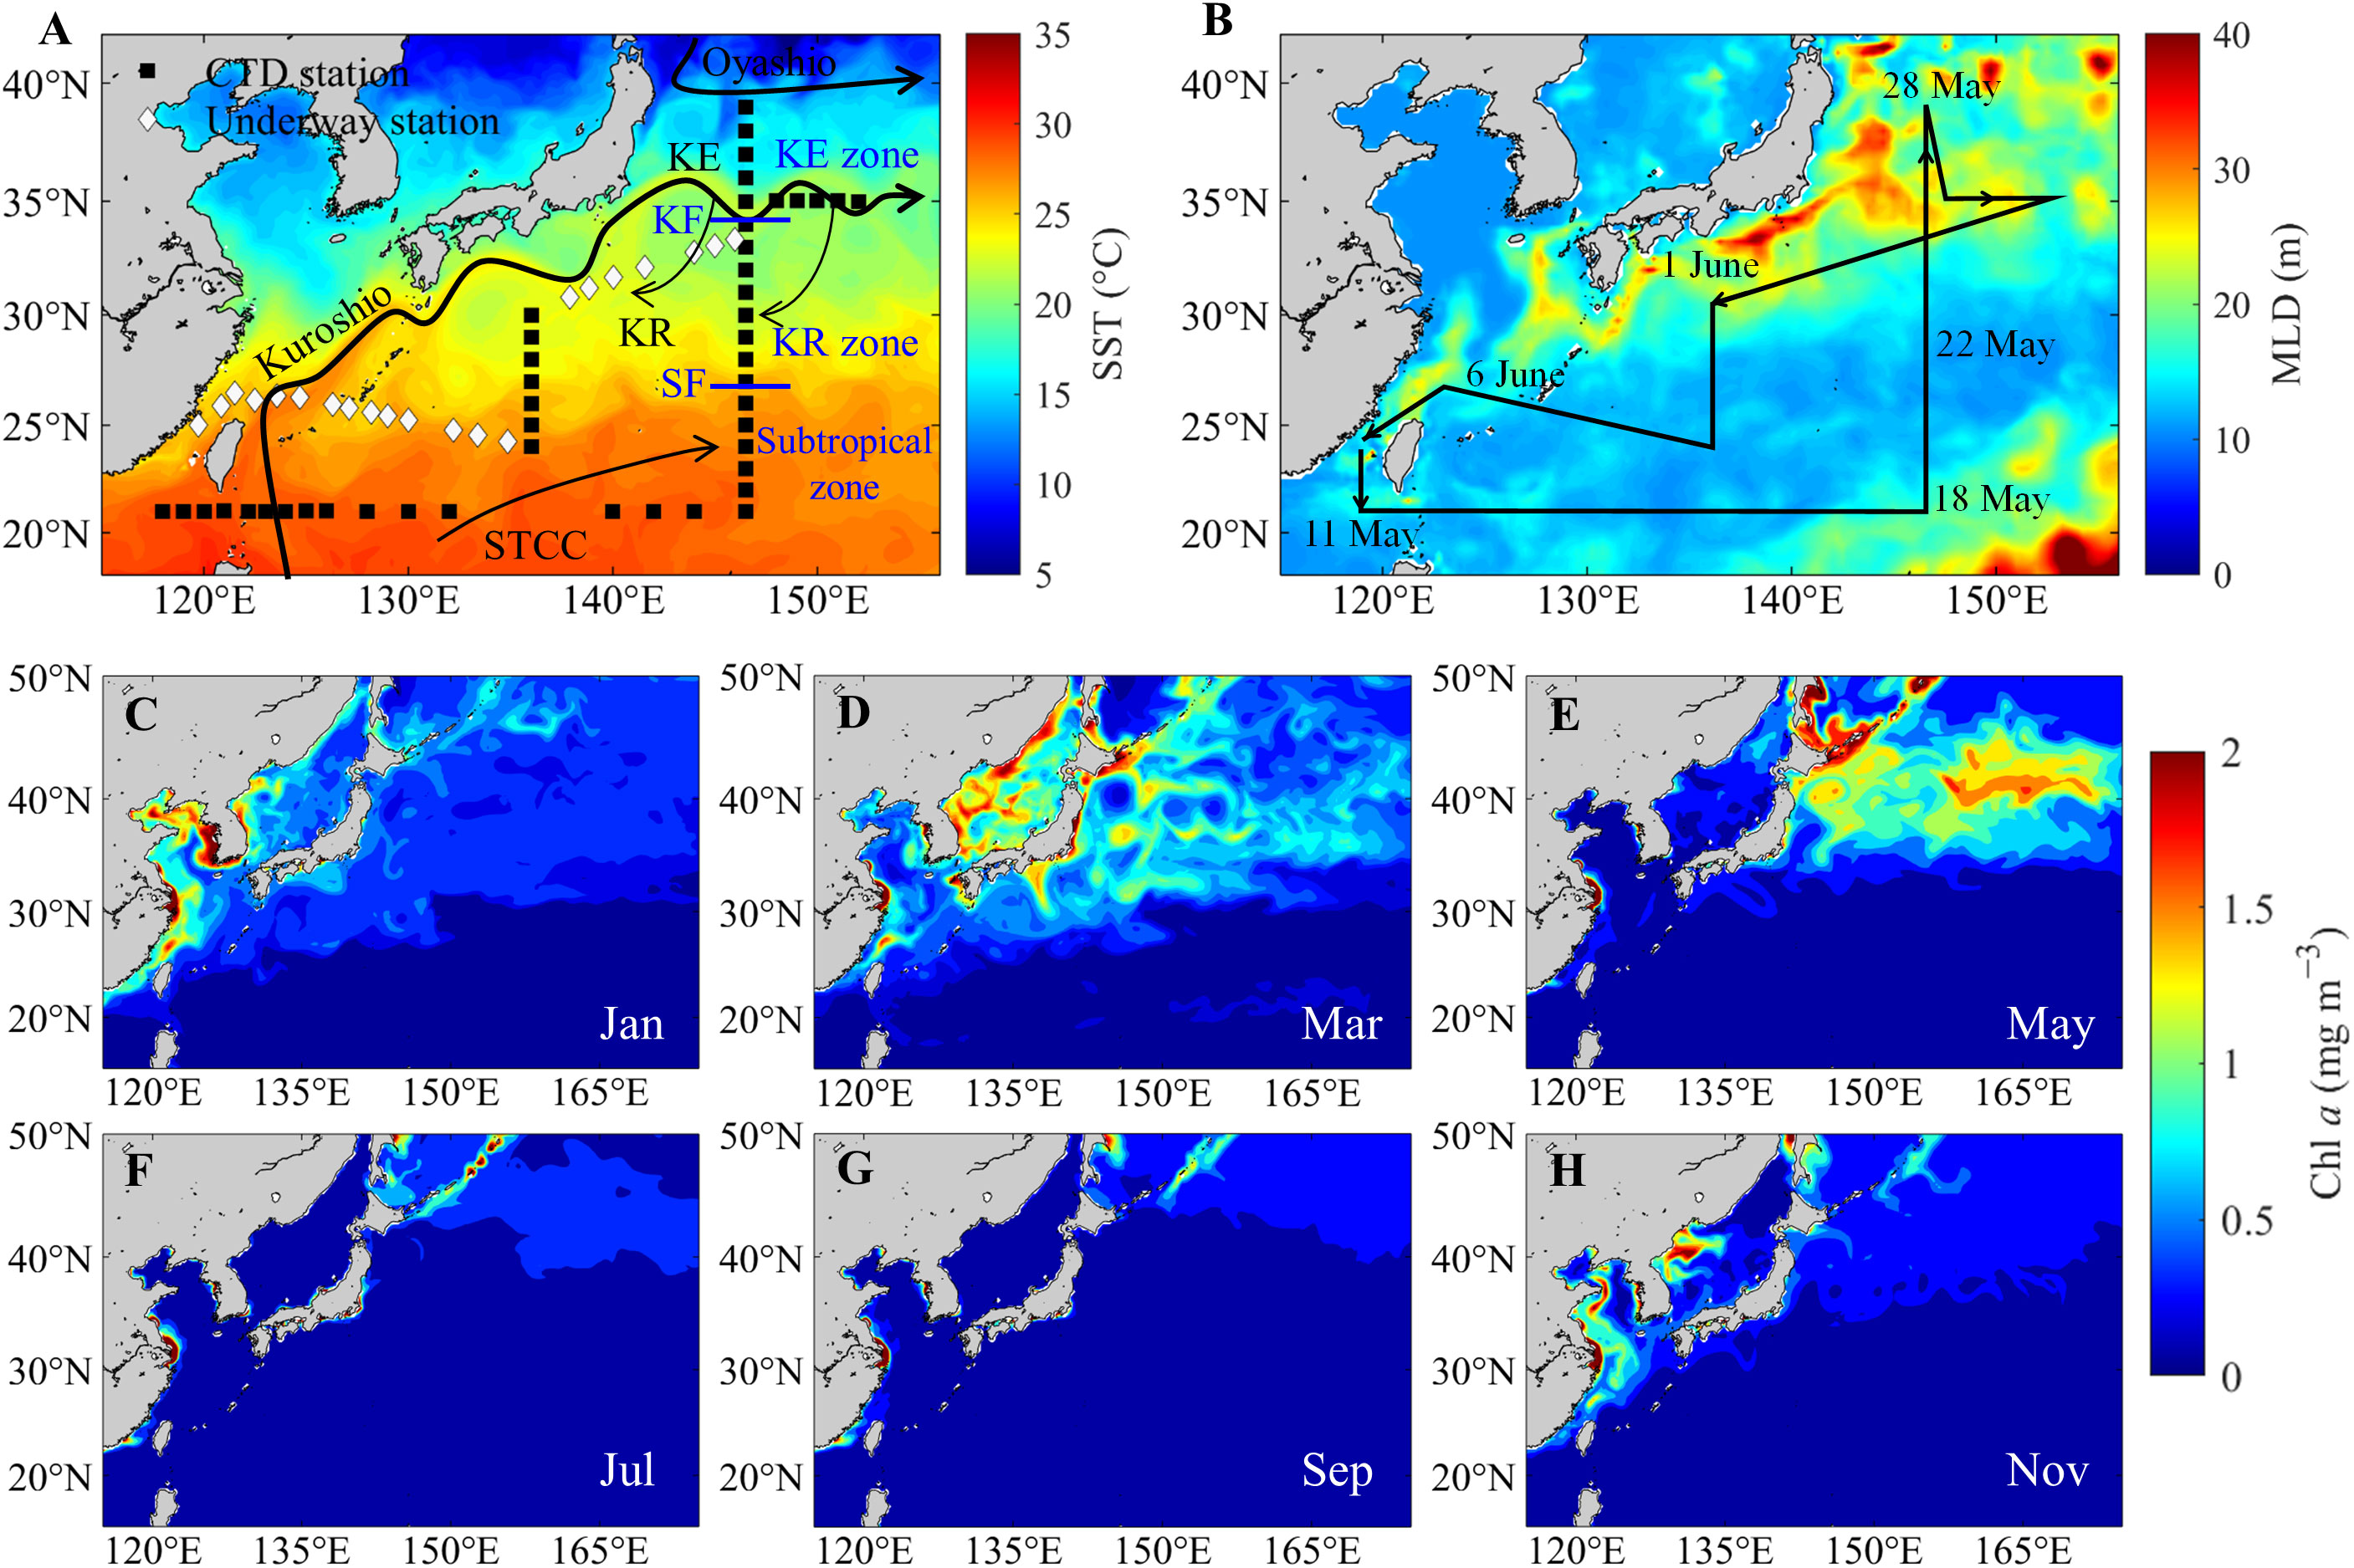
Figure 1 (A) Sampling sites in the western North Pacific during May–June 2018. Squares and diamonds represent CTD and underway sampling stations, respectively. The color indicates the monthly mean sea surface temperature (SST) in May 2018. The approximate locations of the Oyashio, Kuroshio, Kuroshio Extension (KE), Kuroshio Recirculation (KR), Subtropical Countercurrent (STCC), Kuroshio front (KF) and subtropical front (SF) were also sketched (Kobashi et al., 2006). (B) Monthly mean mixed layer depth (MLD) in May 2018 and cruise tracks (black lines). (C−H) Monthly mean chlorophyll a (Chl a) concentrations from January to November 2018. SST, MLD, and Chl a were obtained from the website (https://marine.copernicus.eu).
To investigate the spatial distributions and their controls on the OA metrics across the large temperature and physical and biological gradients in the western North Pacific (Figure 1), we simultaneously measured the underway sea surface pH and partial pressure of CO2 (pCO2), with other auxiliary parameters in late spring 2018 (Figures 1A, B). During the cruise, we also investigated discrete carbonate parameters in surface waters for data comparison and validation (Figure 1). In addition, chlorophyll a (Chl a) data from satellites in 2018 were used to validate the underway Chl a and indicate seasonal variations in primary production (Figures 1C–H). The objectives of this study were to (1) provide high-frequency-precision distributions of pH and Ωarag, (2) elucidate the spatial variations of pH and Ωarag and their controlling factors (e.g., temperature effect, air–sea exchange, biological activities, and water mixing), and (3) quantify the contribution of these factors to the spatial variations of pH and Ωarag.
2 Materials and methods
2.1 Study area
The surveying area was divided into three zones from north to south by the Kuroshio front (~35°N) and the subtropical front (~27°N), such as the KE (35°−39°N), KR (27°−35°N) and subtropical (21°−27°N) zones (Kobashi et al., 2006; Oka et al., 2018; Figure 1A). The western North Pacific is stired by two strong Pacific western boundary currents: the Kuroshio and Oyashio. The southward-flowing Oyashio Current carries the low-salinity/cold subarctic water and meets the high-salinity/warm Kuroshio water (Yasuda et al., 1996) to form the interfrontal zone with a relatively high Chl a concentration in spring (Figures 1C-H). The northeastward-flowing Kuroshio Current separates from the coast of Japan at approximately 35°N, 140°E and turns eastward (Qiu and Chen, 2011), forming the KE (Figure 1A). South of the KE, the KR has a deepened mixed layer in winter owing to oceanic heat loss to the atmosphere (Kitamura et al., 2016). Even in late spring, the mixed layer depth (MLD) in the KR and KE zones was deeper than that in the subtropical zone (Figure 1B). In winter and spring, sea surface heat loss causes surface pCO2 to be significantly lower than the air-equilibrated value in the KE and KR zones; thus, the region is a strong net annual CO2 sink (Takahashi et al., 2009; Li et al., 2022a). Further south of the KR, an eastward-flowing Subtropical Countercurrent (STCC) occupies the area (Yoshida and Kidokoro, 1967).
2.2 Underway observations
The survey was conducted in the western North Pacific onboard R/V Xiangyanghong 3 from 10 May to 7 June 2018 (Figures 1A, B). We conducted pumping analyses of sea surface temperature (SST), salinity, fluorescence, pH and pCO2. The seawater sample was pumped approximately ~5 m below the sea surface. The underway SST was recorded every 5 s along the cruise path using an onboard SeaBird flow-through thermosalinograph (SBE 38, Sea-Bird Scientific, USA). An automated flow measuring system (AS-P2, Apollo SciTech, Inc., USA) was used for sea surface salinity (SSS), fluorescence, pH, and pCO2 analyses, which were recorded continuously every 29 s along the cruise track.
A Honeywell Durafet® pH sensor was used to measure the pH of the flowing water. The Durafet pH electrode features an integral automatic temperature compensator in a one-piece construction and is suitable for varying pH and temperature ranges. The Durafet pH electrode was calibrated using three standard buffers (pHNBS = 4.01, 7.00 and 10.01 at 25.0°C, Thermo Fisher Scientific Inc., USA). NBS stands for the National Bureau of Standards, which is now the National Institute of Standards and Technology of the U.S. Department of Commerce. The Durafet pH sensor operates with a short-term precision of ±0.0005 pH over periods of several hours and exhibits stability better than 0.005 pH over periods of weeks to months (Martz et al., 2010). Considering that the Durafet-electrode temperature was slightly different from the SST due to the effects of water pumping and room temperature, a temperature-dependent coefficient of 0.0128 pH °C−1 was derived from the surface waters in the cruise by varying the temperature from 15.0 to 30.0°C at a salinity of 34.6, TA of 2,268 μmol kg−1, and DIC of 1,966 μmol kg−1. Thus, the coefficient was used to calculate the sea surface pH (pH in_situ) as,
where pHDurafet and TDurafet are Durafet pH and temperature in the system, respectively.
Chl a was translated from underway water fluorescence and validated against field-measured Chl a (Li et al., 2022a). The underway pCO2 measurement and calibration were described in detail by Li et al. (2022a), and the overall uncertainty of pCO2 was less than 1%.
2.3 Discrete sampling and analyses
Discrete water samples for dissolved oxygen (DO), dissolved inorganic carbon (DIC), and total alkalinity (TA) were collected using 10-L Niskin bottles at a surface layer of ~2 m. Depth profiles of temperature and salinity (Practical Salinity Scale of 1978) were obtained using calibrated conductivity-temperature-depth/pressure (CTD) probes (SBE911 plus, Sea-Bird Scientific, USA).
Water samples for DO analyses were collected, fixed, and titrated onboard the vessel following the classic Winkler procedure (Knap et al., 1996). Any potential nitrite interference in DO titration was removed by adding 0.01% NaN3 during subsample fixation (Wong, 2012). To quantify the effects of net community metabolism, the apparent oxygen utilization (AOU) was calculated by subtracting the field-measured DO concentration from the air-equilibrated DO concentration. Assuming that DO was initially in equilibrium with the atmosphere, an AOU >0 implies net community respiration, whereas an AOU<0 implies net community production.
Following the procedure recommended by Dickson et al. (2007), water samples for DIC and TA analyses were collected and stored in 250 mL borosilicate glass bottles. Prior to sealing with greased (Apiezon-L) ground-glass stoppers, 1 mL of seawater was removed from each sample bottle to allow for thermal expansion and 100 µL of saturated HgCl2 was added to the water samples to halt biological activity. The samples were then stored at room temperature until further analysis. DIC was measured using an infrared CO2 detector-based DIC analyzer (AS-C3, Apollo SciTech Inc., USA), and TA was determined at 25.0 °C by Gran’s acidimetric titration using a semi-automated titrator (AS-ALK2, Apollo SciTech Inc., USA). The reproducibility of the DIC and TA measurements was within 0.1% (Cai et al., 2004). DIC and TA measurements were referenced to certified reference materials from the laboratory of Andrew G. Dickson (Scripps Institute of Oceanography, USA), with a precision of ±2 µmol kg−1.
2.4 Calculation of carbonate parameters
For discrete samples, pCO2, Ωarag, and NBS scale pH (pHNBS; for simplicity, ‘pH’ in the following text refers to the NBS scale) were calculated from DIC, TA, seawater temperature, salinity, and pressure values using CO2SYS.xls (version 24) (Pelletier et al., 2015), an updated version of the original CO2SYS.EXE (Lewis and Wallace, 1998). Here, Ωarag is defined as the product of calcium (Ca2+) and carbonate (CO32−) ion concentrations divided by the apparent solubility product for aragonite (Ksp*arag), i.e., Ωarag = [Ca2+] × [CO32−]/Ksp*arag. The DIC and Ωarag values were calculated using the program from the underway pCO2, salinity-based TA (Figure 2A), and other auxiliary parameters. The carbonic acid dissociation constants from Millero et al. (2006), total boron/salinity (BT/S) from Uppström (1974), and dissociation constant of HSO4− from Dickson (1990) were used to calculate the carbonate system parameters. Although the carbonic acid dissociation constants of Luecker et al. (2000) and the BT/S of Lee et al. (2010) are recommended (Woosley, 2021; Jiang et al., 2022), Li et al. (2022a) found that the measured pCO2 in the western North Pacific agreed with the values calculated from the combination of Millero et al. (2006) and Uppström (1974). The measured pCO2 was approximately 8 μatm lower than the calculated values when using the combination of Lueker et al. (2000) and Lee et al. (2010). During the calculation, the surface phosphate and silicate concentrations required by the program were replaced with zero. Given that surface phosphate and silicate concentrations in the surveying area are typically very low (<0.1 μmol kg−1 and<1 μmol kg−1, respectively) (Li et al., 2022b), ignoring these nutrients results in minor errors in pCO2 (0.2 μatm), pH (0.0002), and Ωarag (0.0005) values.
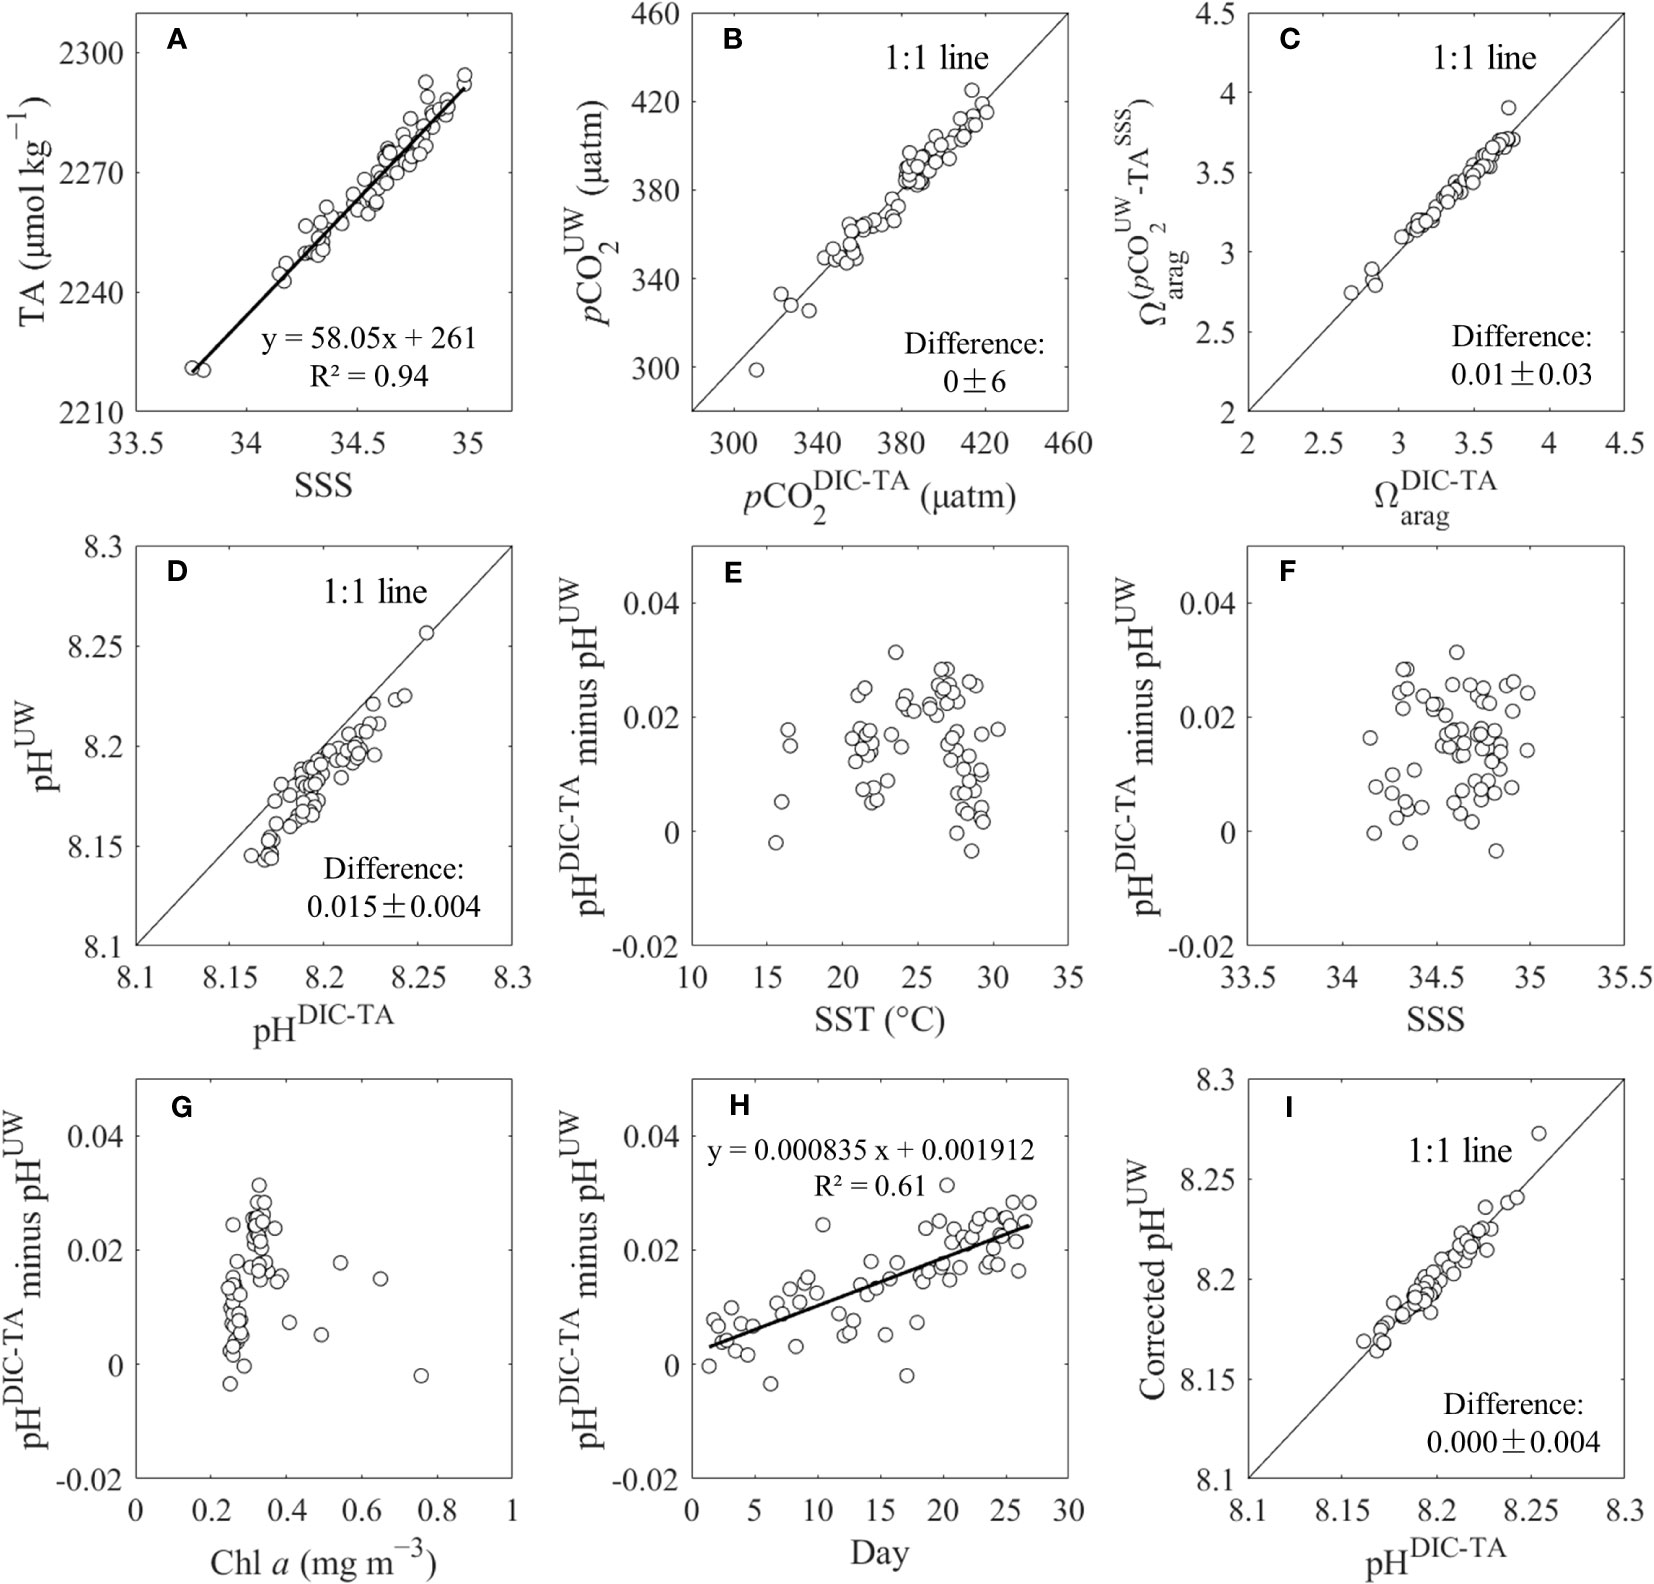
Figure 2 (A) Sea surface salinity (SSS) versus TA, (B) underway pCO2 (pCO2UW) versus calculated pCO2 from DIC and TA (pCO2DIC-TA), (C) calculated Ωarag from DIC and TA (Ωarag DIC-TA) versus calculated Ωarag from pCO2UW and SSS-based TA (TASSS), (D) underway pH (pHUW) versus calculated pH from DIC and TA (pHDIC-TA), (E−H) differnce between pHDIC-TA and pHUW versus temperature, salinity, chlorophyll a (Chl a), and cruise time (day), respectively, (I) corrected pHUW versus pHDIC-TA at stations.
To eliminate the dilution and concentration effects of precipitation and evaporation on the seawater carbonate system, we normalized the water TA (NTA) and DIC (NDIC) to a uniform salinity of 35. Salinity-normalized parameters were calculated as NTA = TA × 35/salinity and NDIC = DIC × 35/salinity. The temperature normalized pCO2 at 28.0°C was calculated by pCO228.0°C (μatm) = pCO2 × e[0.0423 × (28.0−SST)] (Takahashi et al., 2002).
2.5 Quality-control of carbonate parameters
Durafet pH has a constrained uncertainty of 0.005 (Martz et al., 2010) and is therefore used as a reference to assess the quality of the underway and calculate the pH data. To further assess the quality of the underway pH/pCO2 and discrete DIC/TA datasets, the underway pH/pCO2 (pHUW/pCO2UW) data collected at the stations were compared to the calculated pH/pCO2 from the measured DIC and TA (pHDIC-TA/pCO2DIC-TA). The Ωarag values calculated from DIC and TA (ΩaragDIC-TA) were compared with those calculated from pCO2UW and salinity-based TA (ΩaragpCO2UW-TAsss). The results showed that pCO2UW versus pCO2DIC-TA and ΩaragDIC-TA versus ΩaragpCO2UW-TAsss agreed with each other, following a 1:1 line within ±6 μatm for pCO2 and ±0.03 for Ωarag (n = 66), respectively (Figures 2B, C). These comparisons indicate that the measured and calculated pCO2, DIC, TA and Ωarag results were reliable.
However, the pHUW value was lower than that of pHDIC-TA by 0.015 ± 0.004 (n = 66) (Figure 2D), which was higher than the uncertainty of Durafet pH. We found that the differences between pHDIC-TA and pHUW were discrete relative to SST, SSS, and Chl a (Figures 2E–G), but were significantly related to cruise time (day) (Figure 2H), indicating that the Durafet pH electrode had a time-dependent baseline drift. Therefore, we corrected pHUW according to the linear relationship between the differences and cruise time. The results showed that the corrected pHUW and pHDIC-TA were consistent with each other, following a 1:1 line within ±0.004 (n = 66) (Figure 2I). Note that ‘pH’ in the following text refers to corrected pH.
2.6 Decomposition of pH and Ωarag changes
In this study, we aimed to quantify the contribution of the controlling factors to ΔpH and ΔΩarag in the western North Pacific. We used a systematic approach based on first-order Taylor series deconvolution (Murata and Shu, 2012; Hagens and Middelburg, 2016) to decompose the ΔpH and ΔΩarag into the contributions of individual water chemistry parameter changes in temperature (ΔT), salinity (ΔS), NDIC (ΔNDIC), NTA (ΔNTA), and residual (Res). The residual term represents contributions from other acid–base systems, although these may be negligible. Therefore, we used this method to decompose ΔpH and ΔΩarag as follows,
where V indicates the pH and Ωarag. ΔV was calculated from the real-time value relative to the mean value in the subtropical zone (temperature = 28.0°C, salinity = 34.4, TA = 2,260 μmol kg−1 and DIC = 1,945 μmol kg−1), where sea surface pH and Ωarag were close to the air equilibrium. ΔT, ΔS, ΔNDIC, and ΔNTA were calculated based on the differences in water chemistry parameters between the real-time and mean values in the subtropical zone. On the right-hand side of equation (2), four partial derivative terms were calculated based on the observed data, assuming a 1‰ change in the relative parameters, while the other three parameters were held constant.
3 Results
3.1 Environmental settings
The spatial distributions of SST and Chl a are shown in Figures 3A, B, and the variations in SST, SSS, Chl a, and AOU are shown in Figures 4A, B. Overall, SST, Chl a, and AOU showed strong spatial variations from the subtropical zone, through the KR zone, to the KE zone (Figures 3A, B, 4A, B). Briefly, SST decreased from 27.93°C ± 0.99°C in the subtropical zone to 22.65°C ± 1.45°C in the KR zone and to 18.27°C ± 2.37°C in the KE zone. This strong gradient may be related to oceanic heat loss due to the northeastward flow of the Kuroshio Current (Qiu and Chen, 2011; Kitamura et al., 2016). However, SSS varied within a limited range of 34−35 in the open ocean of the surveyed area (Figure 4A). In the KE zone, the SSS was only slightly lower than that in the subtropical and KR zones, suggesting a limited influence of the low-salinity Oyashio current on the hydrological characteristics of the KE surface waters during the surveying cruise.
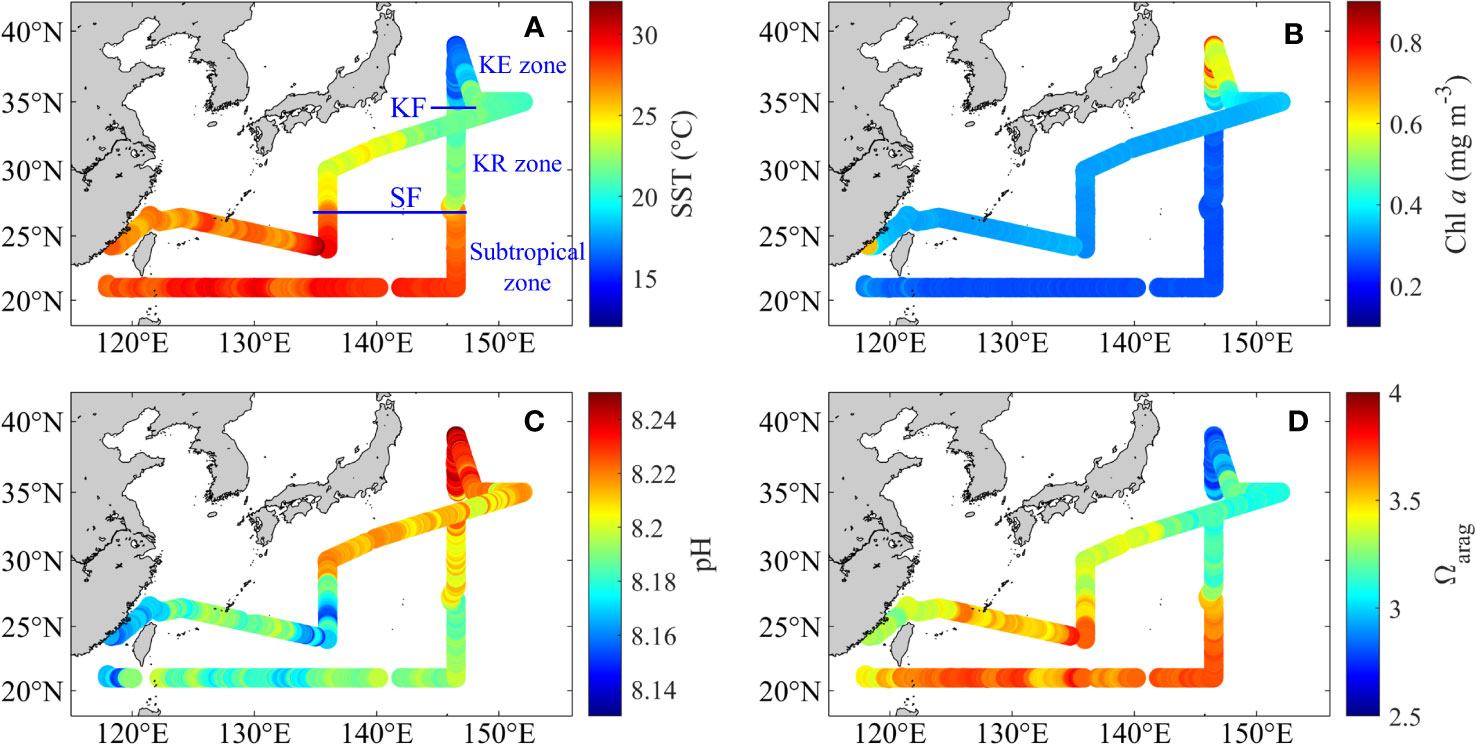
Figure 3 Distributions of (A) underway sea surface temperature (SST, °C), (B) chlorophyll a (Chl a, mg m−3), (C) pH and (D) Ωarag during May–June 2018. (A, B) were obtained from Li et al. (2022a). Subtropical front, SF; Kuroshio front, KF.
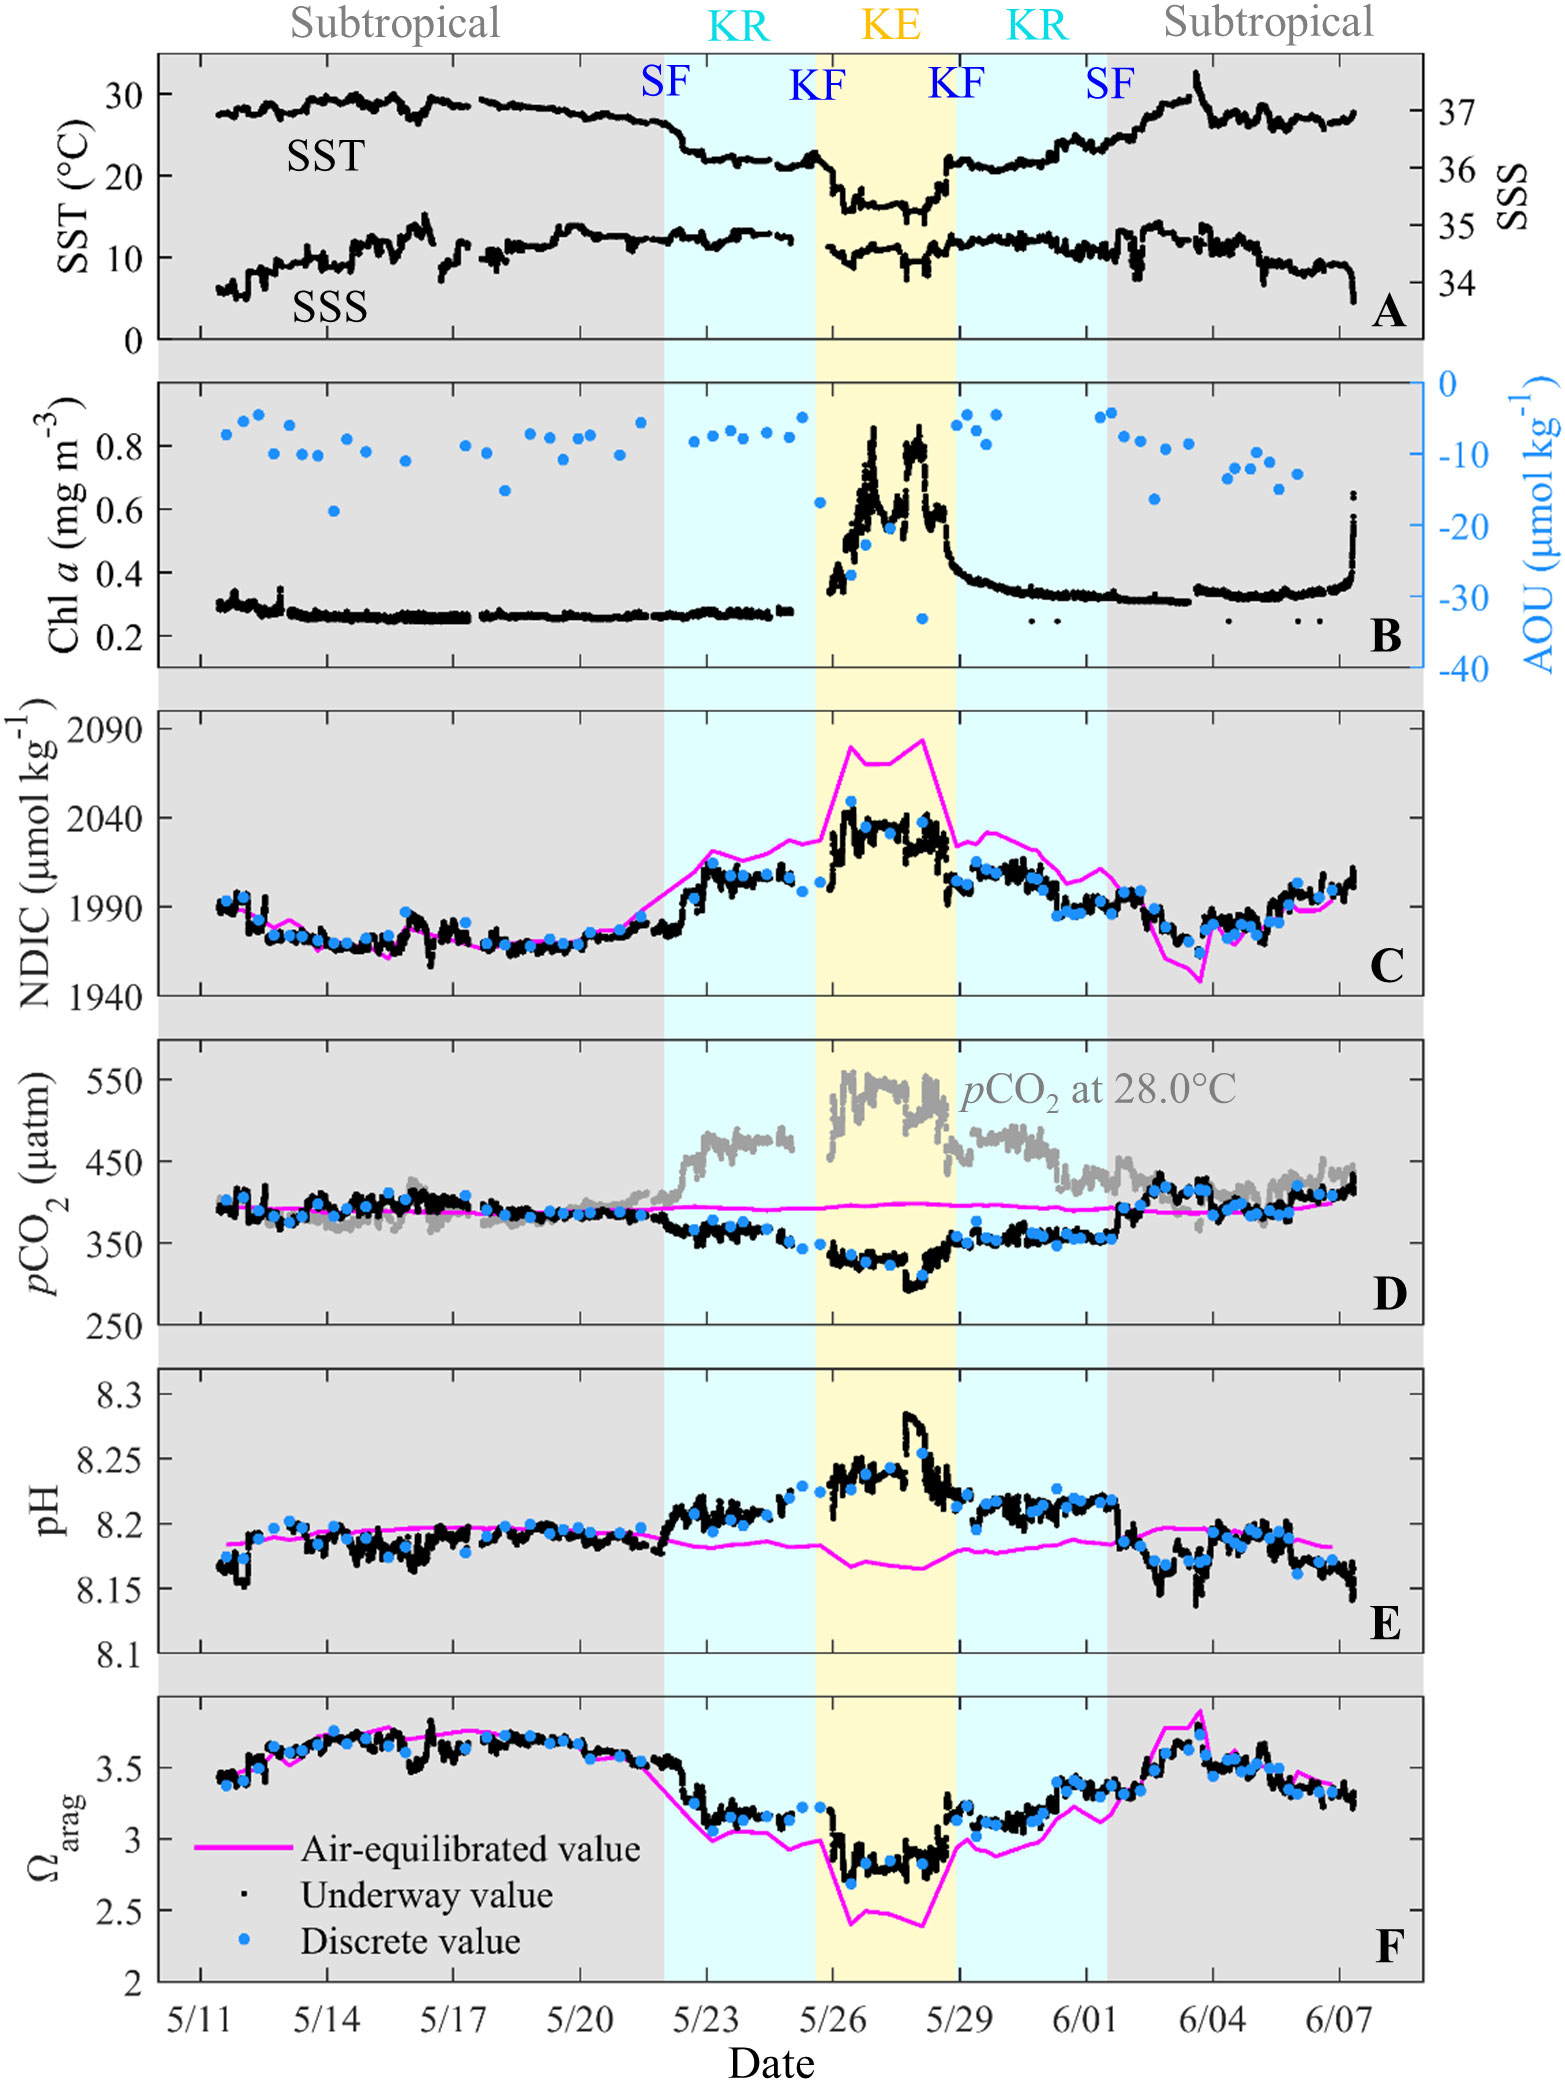
Figure 4 Underway and discrete sea surface (A) temperature (SST, °C) and salinity (SSS), (B) chlorophyll a (Chl a, mg m−3) and AOU (μmol kg−1), (C) NDIC (μmol kg−1), (D) in situ pCO2 (μatm) and temperature normalized pCO2 at 28.0 °C (μatm), (E) pH and (F) Ωarag during May–June 2018. Discrete parameters (blue dots) are collected from the stations. In (C−F), the red lines indicate the air-equilibrated values. Color shading indicates the subtropical, Kuroshio Recirculation (KR) and Kuroshio Extension (KE) zones, respectively. Subtropical front, SF; Kuroshio front, KF.
The Chl a concentration is relatively low at 0.2−0.4 mg m−3 in the subtropical and KR zones (Figures 3B, 4B) due to the limited nutrient availability that restricted phytoplankton growth (Wong et al., 2002; Yasunaka et al., 2014). However, the KE zone has a high Chl a concentration of 0.4−0.9 mg m−3, suggesting that biological activity may influence OA metrics in this region. Correspondingly, the AOU value of −9 ± 3 μmol kg−1 in the subtropical and KR zones was slightly lower than the air–sea equilibrated value (0 μmol kg−1), probably related to the low primary production. However, the KE zone had a relatively low AOU value of −26 ± 6 μmol kg−1 (Figure 4B), indicating the effect of relatively intense biological oxygen production in the KE surface waters.
3.2 Spatial variability of carbonate system parameters
The variations in the surface NDIC and pCO2 are shown in Figures 4C, D. The variations of surface NDIC were generally mirrored the SST (Figure 4C), and the NDIC value increased from 1975 ± 11 μmol kg−1 in the subtropical zone, to 2,017 ± 10 μmol kg−1 in the KR zone, and to 2,076 ± 7 μmol kg−1 in the KE zone. The surface NDIC was close to the air equilibrium in the subtropical zone and lower than the air-equilibrated NDIC by 17 ± 7 μmol kg−1 in the KR zone and 38 ± 7 μmol kg−1 in the KE zone (Figure 4C). In contrast to the distinct variation in surface NDIC, surface TA and SSS generally followed a linear relationship (Figure 2A), and surface NTA showed a uniform value of 2,295 ± 4 μmol kg−1 in the study area, which is consistent with the previously reported mean NTA value of 2,297 ± 5 μmol kg−1 in the western North Pacific (Ono et al., 2019). This uniformity of NTA further supports the limited influence of the Oyashio current on the KE surface waters during the survey cruise, as the Oyashio water has a relatively high NTA of ~2,400 μmol kg−1 (Ishii et al., 2014; Takahashi et al., 2014). Figure 4D shows that the distribution of sea surface pCO2 in late spring is similar to that of SST, as previously described in detail by Li et al. (2022a). In addition, the temperature normalized pCO2 at 28.0°C mirrored in situ pCO2 but was similar to that of Chl a (Figures 4B, D), suggesting a relatively weak effect of biological CO2 drawdown.
The variations in surface pH and Ωarag are shown in Figures 3C, D, 4E, F, and they also show large environmental gradients. Surface pH variations were similar to those of NDIC but mirrored Ωarag, SST and pCO2. The pH (Ωarag) increased (decreased) from 8.18 ± 0.01 (3.57 ± 0.12) in the subtropical zone to 8.21 ± 0.01 (3.25 ± 0.12) in the KR zone and to 8.24 ± 0.02 (2.95 ± 0.16) in the KE zone. Similar to NDIC and pCO2, the surface pH and Ωarag were close to the air equilibrium in the subtropical zone, which is consistent with the results of Ono et al. (2019). They found that the surface pH and Ωarag in the area have been in air equilibrium annually over the past three decades. In contrast, the surface pH and Ωarag were higher than the air-equilibrated values in the KR and KE zones (Figures 4E, F). Especially in the KE zone, the low surface pCO2 and high pH corresponded to the relatively high Chl a content and negative AOU, indicating the effects of photosynthesis-induced oxygen addition, pCO2 decrease, and pH increase. However, the surface Ωarag is the lowest in the KE zone, which is contradictory to the photosynthesis-induced Ωarag increase. These results indicate that photosynthesis was not the only factor controlling surface pH and Ωarag distributions.
4 Discussion
4.1 Controls of surface pH and Ωarag variations
To reveal the mechanisms governing the distributions of sea surface pH and Ωarag in late spring, we investigated the relationship between surface pH, Ωarag, and SST (Figures 5A, B). There are significant correlations between surface pH, Ωarag, and SST with correlation coefficients (r) of 0.84 (p<0.001) and 0.93 (p<0.001), respectively. We further divided the effect of temperature on pH and Ωarag into internal and external effects, both of which coexist in the contemporary ocean (Jiang et al., 2019; Cai et al., 2020; Wu et al., 2021; Xue et al., 2021). The internal temperature effect is computed based on the assumption that temperature is the only variable, because it is linked to shifts in the species in the CO2 system as the temperature varies. The external temperature effect was calculated by varying the temperature and assuming a consistent air-sea equilibrium (Cai et al., 2020). Note that, for the internal temperature effect, the magnitude of the pH is initially much larger than that of Ωarag (Jiang et al., 2019).
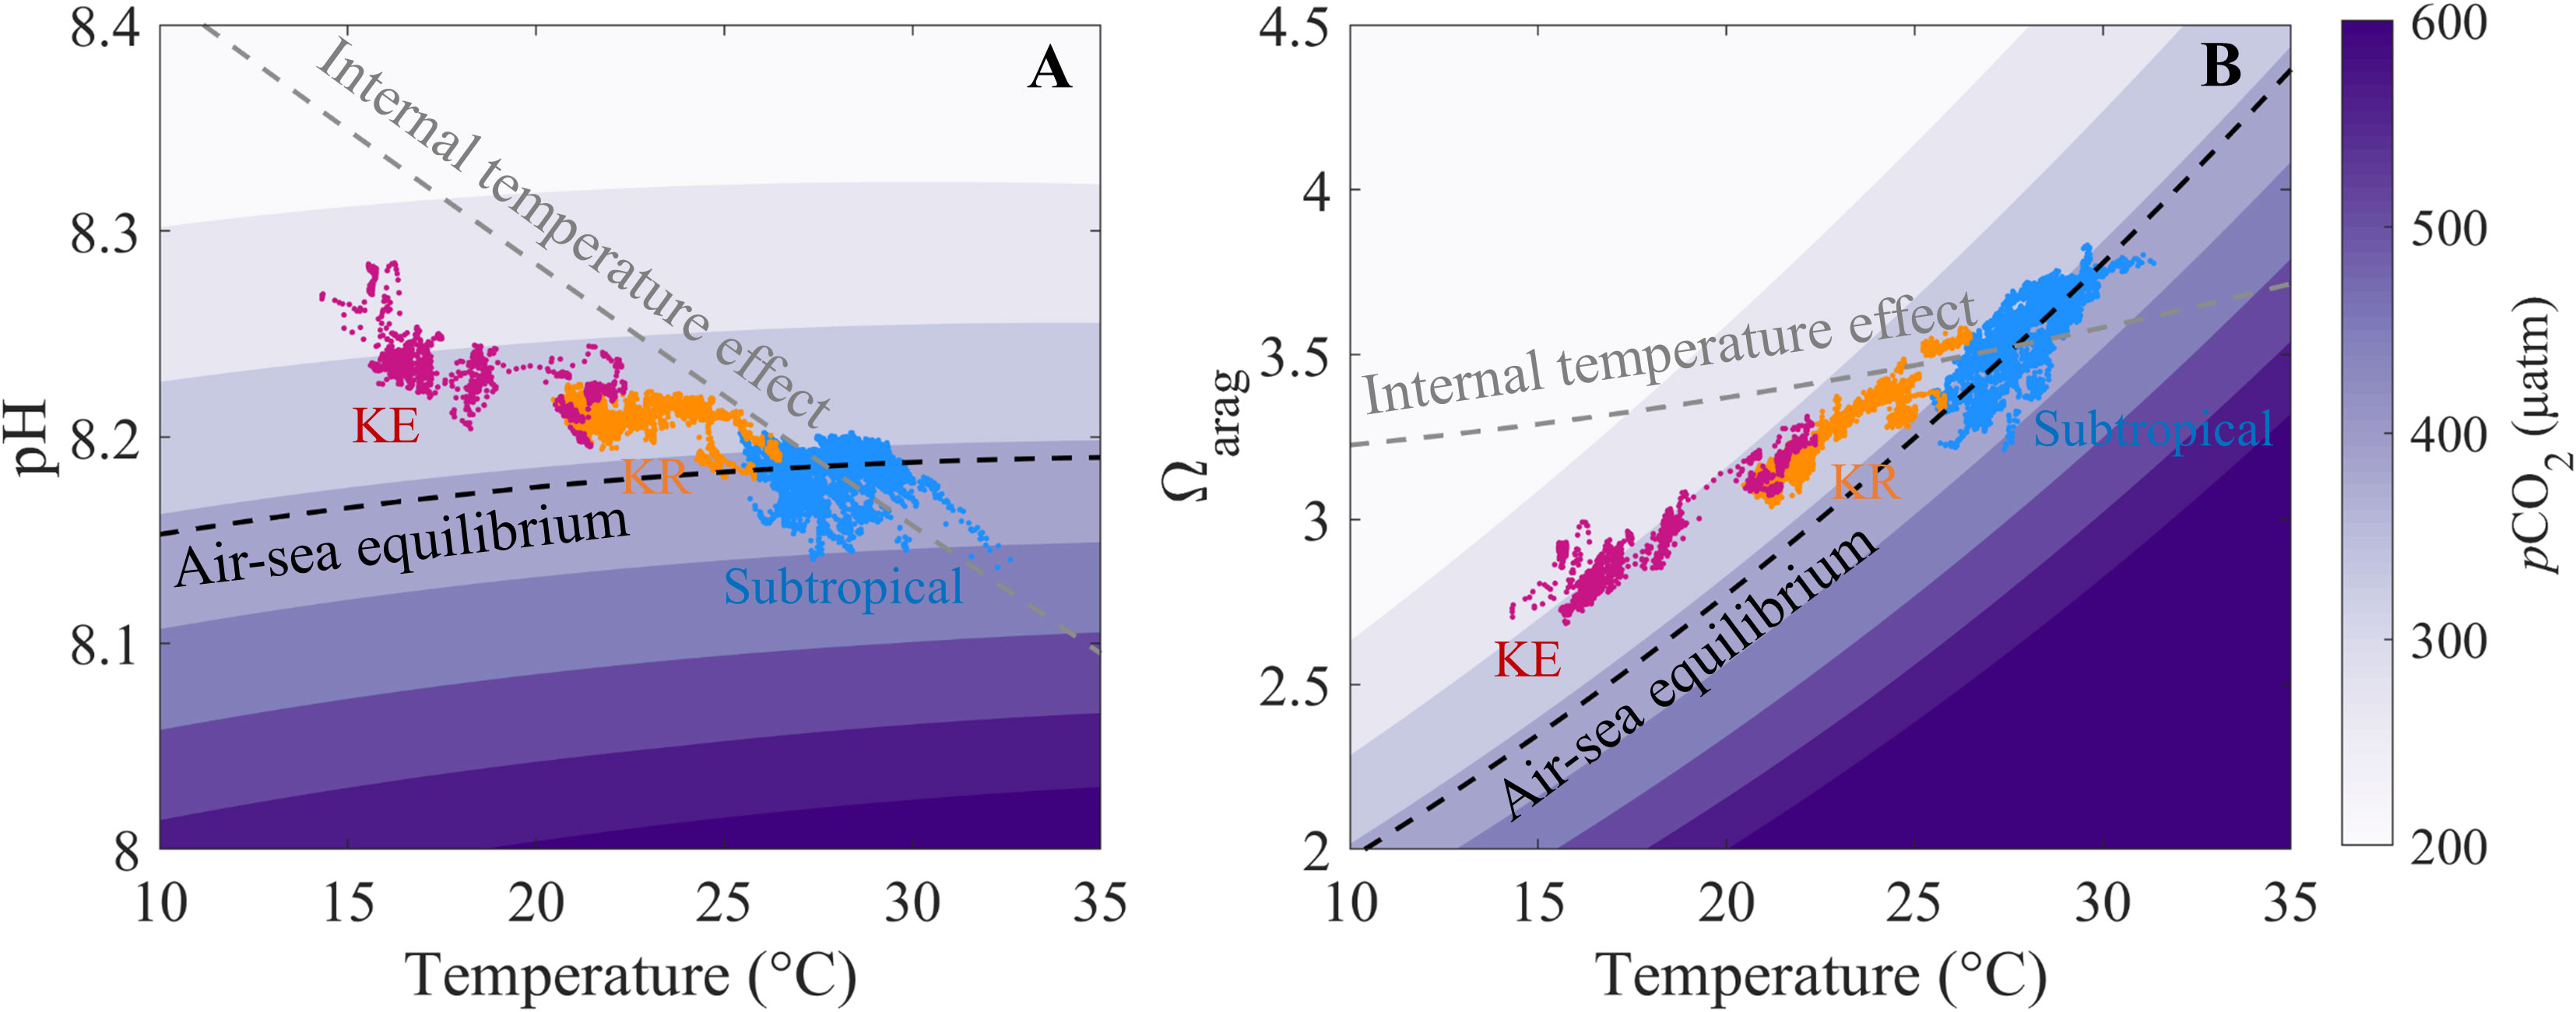
Figure 5 Schematic of the relationships between sea surface temperature and (A) pH and (B) Ωarag. The initial condition is set up with subtropical salinity = 34.4 and TA = 2,260 μmol kg−1 to generate the pCO2 contours, with the dashed black line representing the air-sea equilibrium at pCO2 = 390 μatm. The dashed gray line represents the internal temperature effect calculated from salinity = 34.4, TA = 2,260 μmol kg−1, and DIC = 1,945 μmol kg−1 in the subtropical zone. Blue, yellow, and red dots indicate data obtained in the subtropical, Kuroshio Recirculation (KR) and Kuroshio Extension (KE) zone, respectively.
The results showed that surface pH generally followed the internal temperature effect but was lower than that predicted by the internal temperature effect and higher than the air–sea equilibrated values in the KR and KE zones. This result indicates that the internal temperature dominated the latitudinal gradient in surface pH, although the air-sea gas exchange induced by temperature partially offsets the internal temperature-driven pH pattern. In contrast, the surface Ωarag generally followed the external temperature effect (air–sea gas exchange induced by temperature) but was lower than that predicted by the internal temperature effect and higher than the air–sea equilibrated values in the KR and KE zones. This result indicates that the surface Ωarag is mainly controlled by the external temperature effect, although the internal temperature effect enhances the external temperature-driven Ωarag gradient.
In addition to the effect of temperature on the surface pH and Ωarag, biological activities tend to increase the sea surface pH and Ωarag in the KE zone (Section 3.2), probably enhancing the surface pH gradient but counteracting the surface Ωarag gradient. In addition, entrainment of subsurface low-pH and Ωarag water decreases the surface pH and Ωarag in winter and spring (Ishii et al., 2001; Takahashi et al., 2002; Kim et al., 2015).
4.2 Contribution of controlling factors on pH and Ωarag variations
As mentioned above, the changes in surface pH (ΔpH) and Ωarag (ΔΩarag) were affected by internal temperature, external temperature (air–sea gas exchange induced by temperature), biological activities, and vertical mixing. The effects of these processes on the spatial and temporal variations in pH and Ωarag have also been previously reported by some studies (e.g., Ishii et al., 2011; Takahashi et al., 2014; Jiang et al., 2015; Wu et al., 2021; Xue et al., 2021). Here, we first decomposed ΔpH and ΔΩarag into the contributions of changes in individual parameters.
Decomposition provides quantitative constraints on how the various drivers of pH and Ωarag change spatially (Figures 6A, B). Generally, among the different drivers, the ΔpH values were mainly attributed to ΔT, whereas the contribution of ΔNDIC to ΔpH offset approximately 61% ± 16% and 63% ± 8% of the ΔpH caused by ΔT in the KR and KE zones, respectively. With respect to ΔΩarag, the values were primarily controlled by the ΔNDIC, whose contributions accounted for 69% ± 9% and 73% ± 3% of ΔΩarag in the KR and KE zones, respectively. In addition, the contributions of ΔNDIC to ΔΩarag were enhanced by ΔT, with contributions to ΔΩarag of 34% ± 9% and 30% ± 3% in the KR and KE zones, respectively. Furthermore, the direct contributions of ΔS to ΔpH and ΔΩarag were negligible, while the indirect contributions of ΔS via the variation of TA can also contribute to ΔpH and ΔΩarag (Kuchinke et al., 2014; Kwiatkowski and Orr, 2018; Li and Zhai, 2019). However, the contributions of ΔS-induced TA changes to ΔΩarag were offset by ΔS-induced DIC changes because the sensitivities of pH and Ωarag to DIC and TA are approximately equal and opposite, respectively (Cao et al., 2007; Cai et al., 2020; Xue and Cai, 2020).
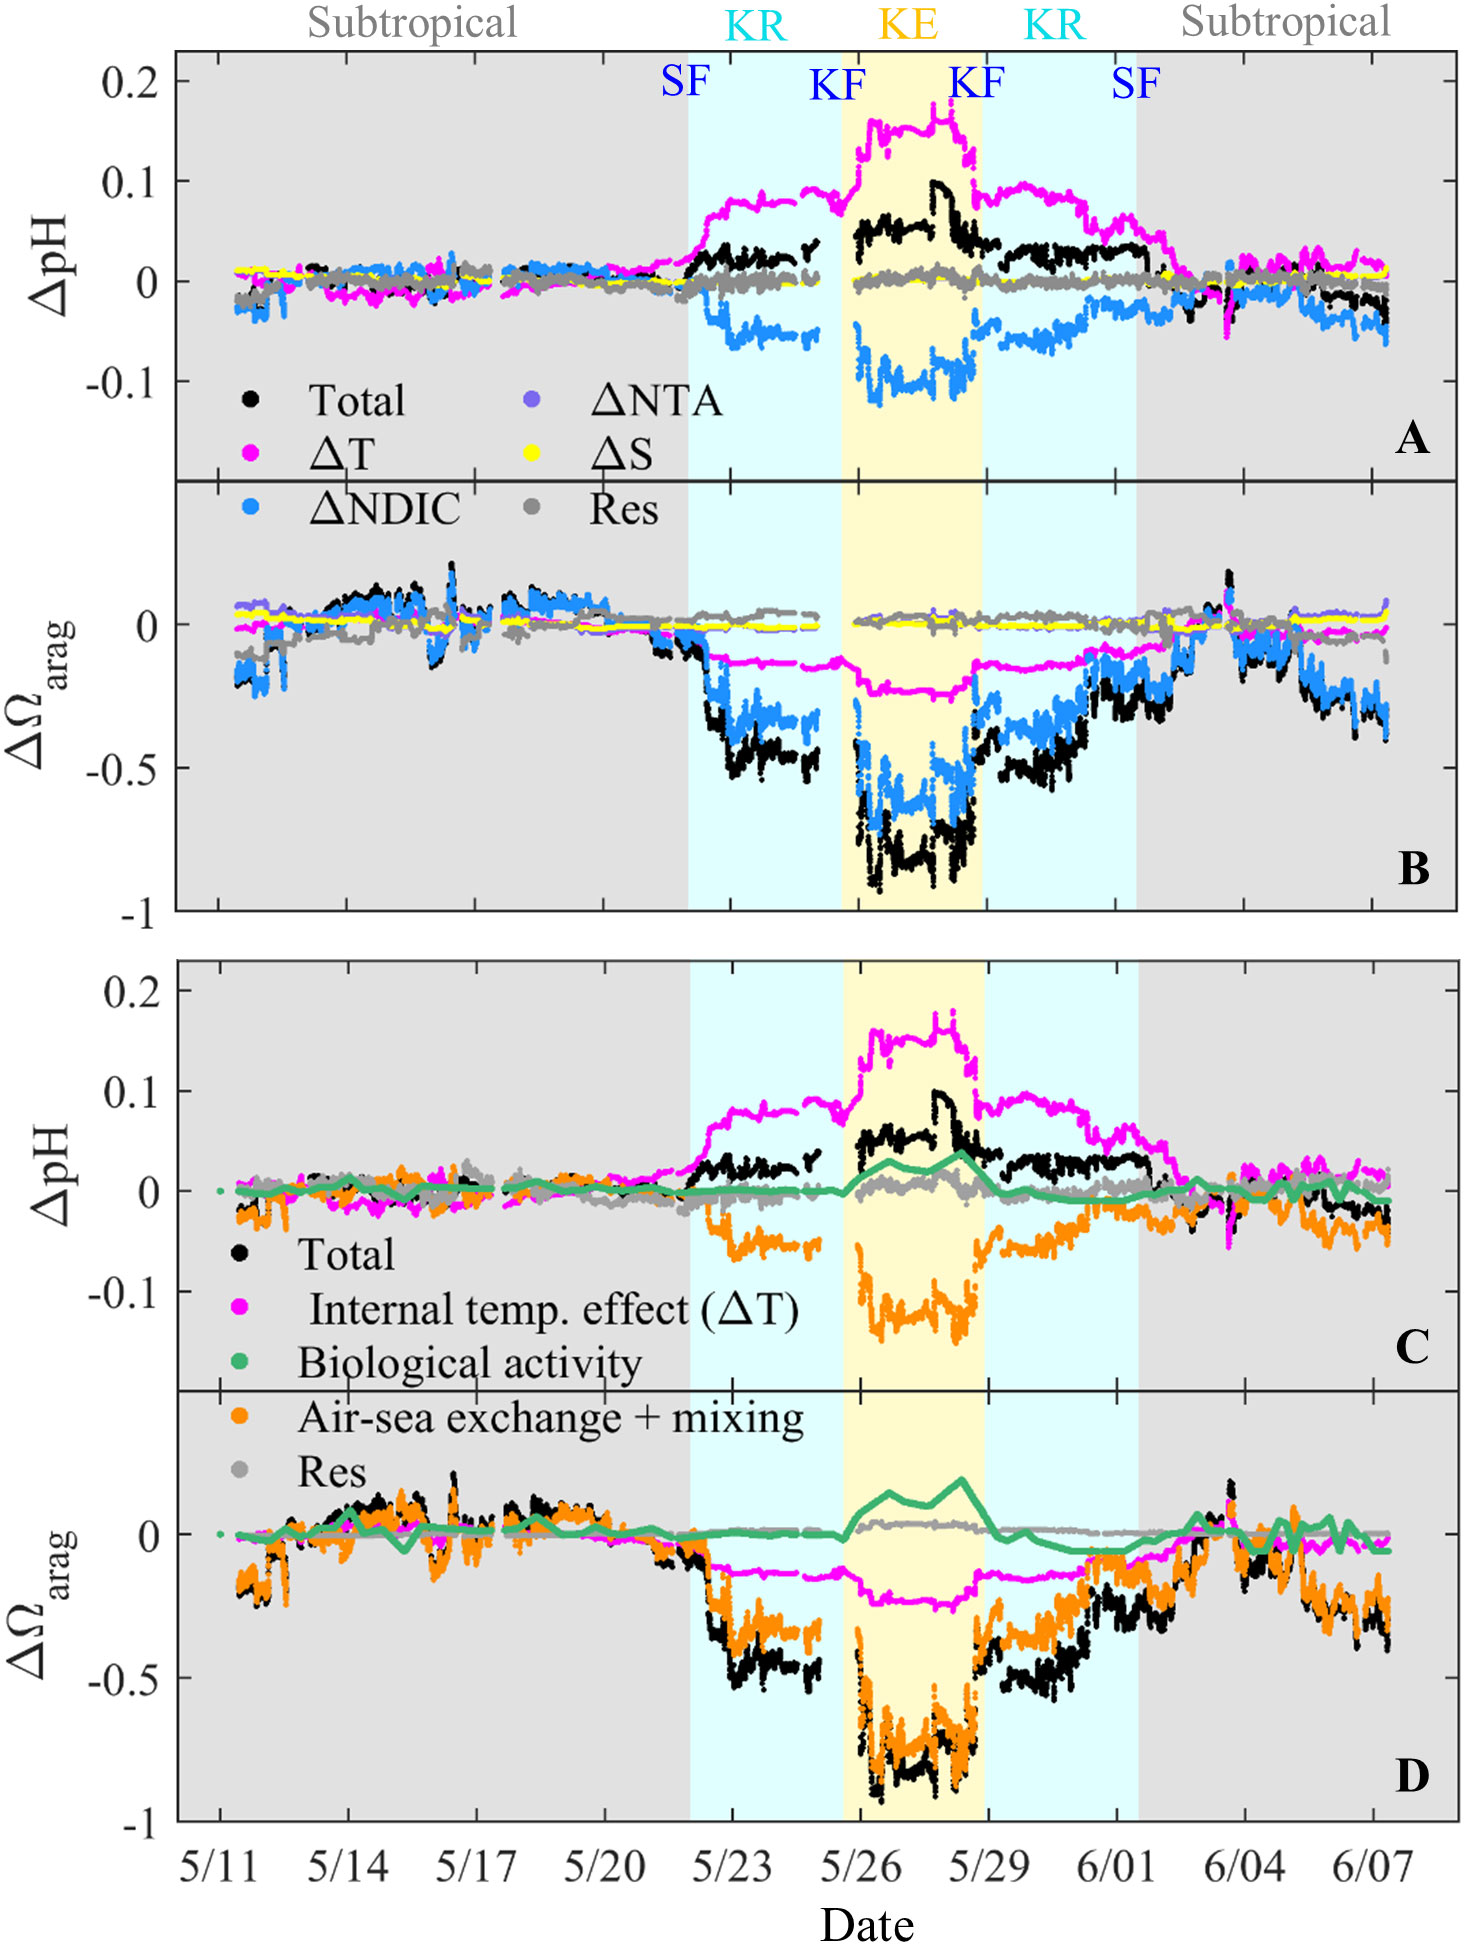
Figure 6 Spatiotemporal changes in pH (ΔpH) and Ωarag (ΔΩarag) (A, B) due to individual parameter changes in NDIC (ΔNDIC), NTA (ΔNTA), and temperature (ΔT), salinity (ΔS), and residual (Res), and (C, D) due to individual processes of internal temperature effect, biological activity, air–sea gas exchange and vertical mixing, and residual. These changes were calculated from the real-time values relative to the mean value in the subtropical zone (temperature = 28.0 °C, salinity = 34.4, TA = 2,260 μmol kg−1, and DIC = 1,945 μmol kg−1). Color shading indicates the subtropical, Kuroshio Recirculation (KR) and Kuroshio Extension (KE) zones. Subtropical front, SF, Kuroshio front, KF.
We further decomposed ΔNDIC into the contributions of fundamental biogeochemical processes to ΔpH and ΔΩarag, e.g., the changes in biological activities (ΔNDICBio) and other ΔNDIC, which were mainly associated with air–sea gas exchange and vertical mixing (ΔNDICASM). Therefore, we represent the contributions using the terms: ΔVT = (əV/əT)ΔT, ΔVΔNDIC = (əV/əNDIC)ΔNDIC, ΔVBio = (ΔNDICBio/ΔNDIC)ΔVΔNDIC, and ΔVASM = ΔVΔNDIC − ΔVBio. Therefore, we decompose ΔV as follows,
where ΔVBio indicates the effect of biological activities. ΔNDICBio was calculated as ΔNDICBio = ΔAOU × 117/170, where ΔAOU was calculated from the real-time value relative to the mean value in the subtropical zone (−9 μmol kg−1) and 117/170 is the C/O ratio (Anderson and Sarmiento, 1994). The discrete AOU values (Figure 4B) were linearly interpolated between the two stations and then adjusted to the underway time. ΔVASM was calculated from the difference between ΔVΔNDIC and ΔVBio, indicating the effects of temperature-induced air–sea gas exchange and vertical mixing, both of which tend to decrease the surface pH and Ωarag in the KR and KE zones. We have included the minor contributions of ΔS and ΔNTA in the residual component in Figures 6A, B.
The contributions of the fundamental biogeochemical processes to ΔpH and ΔΩarag are shown in Figures 6C, D. The contribution of ΔNDICASM to ΔpH offsets approximately 55% ± 20% and 77% ± 12% of ΔpH caused by ΔT in the KR and KE zones, respectively. In contrast, the contribution of ΔNDICASM accounts for 62% ± 15% and 87% ± 9% of ΔΩarag in the KR and KE zones, respectively. This result indicates that the effect of air–sea gas exchange and vertical mixing increased from the KR zone to the KE zone, probably related to the lower temperature-induced air–sea gas exchange (Figure 1A) and deeper mixed layer depth (Figure 1B). The effect of biological activities was mainly constrained in the KE zone (Figures 6C, D), where waters with low AOU and high Chl a levels were located (Figure 4B). The contribution of biological activities accounted for 36% ± 26% of the ΔpHarag and offsets approximately 14% ± 9% of the ΔΩ in the KE zone. However, the contribution of biological activities offsets only about 17% ± 11% of the ΔNDICASM-induced ΔpHarag and 15% ± 9% of the ΔNDICASM-induced ΔΩ in the KE zone, respectively. Therefore, biological activities enhanced the temperature-driven pattern in pH but counteracted that in Ωarag. Moreover, the Chl a concentrations were highest in the late spring of the year (Figures 1C–H), indicating that the influence of biological activity on the distribution of pH and Ωarag in late spring was the most notable and representative in the year. However, compared to the effect of temperature or air–sea gas exchange on surface pH and Ωarag patterns, the degree of biological influence was relatively small, although primary production was highest in late spring (Figure 1E). This result was further supported by the results of Li et al. (2022a), who found that the biological influence on the distribution pattern of surface pCO2 was relatively minor.
In summary, these quantified results are consistent with the qualitative results, e.g., SST variations dominated the ΔpH, although air–sea gas exchange and vertical mixing counteracted the temperature-driven pH pattern to a comparable extent. In contrast, ΔΩarag was mainly controlled by air–sea gas exchange and vertical mixing, the effects of which on the Ωarag pattern were enhanced by temperature. However, biological activities have a limited influence on the ΔpH and ΔΩarag values.
4.3 Comparison with results from other studies
We showed that the surface pH and Ωarag were out of phase in late spring in the western North Pacific, e.g., the pH (Ωarag) was gradually decreased (increased) southward across the KE, KR, and subtropical zones. This latitudinal distribution pattern of surface pH and Ωarag is consistent with the climatological distribution of surface pH and Ωarag from low to mid-latitudes but is contrary to the distribution pattern from mid to high latitudes, where pH and Ωarag are generally in phase (Jiang et al., 2015; Jiang et al., 2019; Xue et al., 2021). In addition, we have presented the combined effects of temperature, air–sea gas exchange, biological activities, and mixing on springtime pH and Ωarag distributions in the western North Pacific. Similarly combined effects have also been shown from East Asia to the Arctic Ocean, where Wu et al. (2021) found that biological activity counteracts the temperature-driven pattern in pH but reinforces that in Ωarag in the Bering and Chukchi Shelf, where the region has higher temperature and higher primary production relative to the Arctic Basin. This result contradicts with our result in the KE zone, where the region has a lower temperature and higher primary production than the subtropical zone (Figures 6C, D). In general, both spatial and seasonal variations in pH and Ωarag are larger in coastal oceans than in open oceans (Feely et al., 2008; Borges and Gypens, 2010; Feely et al., 2010; Gruber et al., 2012; Xu et al., 2020).
We found that temperature and its induced air–sea gas exchange fundamentally controlled pH and Ωarag distributions from the subtropical zone to the KE zone. This is further supported by the results of Xue et al. (2021), who found that when pH is mainly controlled by the internal temperature effect (thermal), surface pH and Ωarag tend to be out of phase because the effects of thermal and non-thermal (e.g., air–sea gas exchange, biological activities, and mixing) on pH are out of phase; however, when pH is mainly controlled by non-thermal effects, surface pH and Ωarag will be in phase because their non-thermal effects are intrinsically in phase. Similarly, the variations in surface pH and Ωarag and their controls from low- to mid-latitudes agree with the seasonal variations in pH and Ωarag at mid-latitudes, which are also primarily driven by temperature and its induced air–sea gas exchange (Ishii et al., 2011; Kim et al., 2015; Fassbender et al., 2018; Kwiatkowski and Orr, 2018). Taken together, these studies suggest that the spatiotemporal changes and drivers of the pH and Ωarag depend on the particular ocean environment.
5 Summary
Based on the high-frequency-precision measurement of underway pH and pCO2, we demonstrated the distributions of surface pH and Ωarag and their controls across different hydrochemical gradients in the western North Pacific in late spring. The surface pH (Ωarag) was the highest (lowest) in the Kuroshio Extension zone, gradually decreased (increased) southward across the Kuroshio Recirculation zone and was close to the air–sea equilibrium in the subtropical zone. Sea surface temperature dominated the pH distribution, although air–sea gas exchange and vertical mixing counteracted the temperature-driven pH pattern to a comparable magnitude. The distribution of Ωarag was controlled by air–sea gas exchange and vertical mixing and was enhanced by temperature. Biological activities enhanced the temperature-driven pattern of pH and counteracted that of Ωarag. However, compared to the effect of temperature or air-sea gas exchange, the degree of biological influence on surface pH and Ωarag patterns was relatively small in late spring, even though primary production was highest during the year. Overall, this work improves our understanding of the spatiotemporal variations in ocean acidification metrics in the western North Pacific, although more analyses from different seasons are still necessary to further explore the mechanisms controlling ocean acidification metrics.
Data availability statement
The datasets presented in this study can be found in online repositories. The names of the repository/repositories and accession number(s) can be found below: https://figshare.com/articles/dataset/Underway-pumping_pCO2_and_auxiliary_data_along_the_cruise_track_over_the_Kuroshio_Extension_and_its_recirculation_regions_northwestern_North_Pacific_in_late_spring_2018/19807807?file=42541858.
Author contributions
DQ designed the study. C-LL performed the investigation, with assistance from KC and HL. C-LL performed experiments, analyzed the data, and wrote the original manuscript. DQ, YW, and LC provided comments on data analysis and revised the manuscript. All authors contributed to the article and approved the submitted version.
Funding
This research was financially supported by the National Key Research and Development Program of China (2019YFE0114800), the National Natural Science Foundation of China (91858210), and the Natural Science Foundation of Fujian Province, China (2019Jo5148).
Acknowledgments
We thank the crews of R/V Xiangyanghong 3 for their assistance and cooperation during the investigation. The sampling survey was supported by the Laboratory of Marine Isotopic Technology and Environmental Risk Assessment, Third Institute of Oceanography, Ministry of Natural Resources, via a survey of environmental radioactivity detection projects in the western Pacific.
Conflict of interest
The authors declare that the research was conducted in the absence of any commercial or financial relationships that could be construed as a potential conflict of interest.
Publisher’s note
All claims expressed in this article are solely those of the authors and do not necessarily represent those of their affiliated organizations, or those of the publisher, the editors and the reviewers. Any product that may be evaluated in this article, or claim that may be made by its manufacturer, is not guaranteed or endorsed by the publisher.
Glossary
References
Anderson L. A., Sarmiento J. L. (1994). Redfield ratios of remineralization determined by nutrient data analysis. Global Biogeochem. Cycles 8, 65–80. doi: 10.1029/93GB03318
Bates N. R., Astor Y. M., Church M. J., Currie K., Dore J. E., González-Dávila, et al. (2014). A time-series view of changing ocean chemistry due to ocean uptake of anthropogenic CO2 and ocean acidifcation. Oceanography 27, 126–141. doi: 10.5670/oceanog.2014.16
Borges A. V., Gypens N. (2010). Carbonate chemistry in the coastal zone responds more strongly to eutrophication than ocean acidification. Limnol. Oceanogr. 55 (1), 346–353. doi: 10.4319/lo.2010.55.1.0346
Cai W.-J., Dai M.-H., Wang Y.-C., Zhai W.-D., Huang T., Chen S.-T., et al. (2004). The biogeochemistry of inorganic carbon and nutrients in the Pearl River estuary and the adjacent northern South China Sea. Continental Shelf Res. 24, 1301–1319. doi: 10.1016/j.csr.2004.04.005
Cai W.-J., Xu Y.-Y., Feely R. A., Wanninkhof R., Jönsson B., Alin S. R., et al. (2020). Controls on surface water carbonate chemistry along North American ocean margins. Nat. Commun. 11, 2691. doi: 10.1038/s41467-020-16530-z
Cao L., Caldeira K., Jain A. K. (2007). Effects of carbon dioxide and climate change on ocean acidification and carbonate mineral saturation. Geophys. Res. Lett. 34, 89–103. doi: 10.1029/2006GL028605
Dickson A. G. (1990). Standard potential of the reaction: AgCl(s)+1/2H2(g)=Ag(s)+HCl(aq), and the standard acidity constant of the ion HSO4– in synthetic sea water from 273.15 to 318.15 K. J. Chem. Thermodyn. 22, 113–127. doi: 10.1016/0021-9614(90)90074-Z
Dickson A. G., Sabine C. L., Christian J. R. (2007). Guide to best practices for ocean CO2 measurements, PICES Special Publication Vol. Vol. 3 (Sidney, British Columbia, Canada: North Pacific Marine Science Organization), 191.
Doney S. C., Busch D. S., Cooley S. R., Kroeker K. J. (2020). The impacts of ocean acidification on marine ecosystems and reliant human communities. Annu. Rev. Environ. Resour. 45, 83–112. doi: 10.1146/annurev-environ-012320-083019
Doney S. C., Fabry V. J., Feely R. A., Kleypas J. A. (2009). Ocean Acidification: The other CO2 problem. Annu. Rev. Mar. Sci. 1, 169–192. doi: 10.1146/annurev.marine.010908.163834
Fassbender A. J., Rodgers K. B., Palevsky H. I., Sabine C. L. (2018). Seasonal asymmetry in the evolution of surface ocean pCO2 and pH thermodynamic drivers and the influence on sea-air CO2 flux. Global Biogeochem. Cycles 32, 1476–1497. doi: 10.1029/2017GB005855
Fassbender A. J., Sabine C. L., Palevsky H. I. (2017). Nonuniform ocean acidification and attenuation of the ocean carbon sink. Geophys. Res. Lett. 44, 8404–8413. doi: 10.1002/2017GL074389
Feely R. A., Alin S. R., Newton J., Sabine C. L., Warner M., Devol A., et al. (2010). The combined effects of ocean acidification, mixing, and respiration on pH and carbonate saturation in an urbanized estuary. Estuarine Coast. Shelf Sci. 88, 442–449. doi: 10.1016/j.ecss.2010.05.004
Feely R. A., Doney S. C., Cooley S. R. (2009). Ocean acidification: Present conditions and future changes in a high-CO2 world. Oceanography 22 (4), 36–47. doi: 10.5670/oceanog.2009.95
Feely R. A., Sabine C. L., Hernandez-Ayon M., Ianson D., Hales B. (2008). Evidence for upwelling of corrosive “acidified” water onto the continental shelf. Science 320, 1490–1492. doi: 10.1126/science.1155676
Friedlingstein P., Jones M. W., O’Sullivan M., Andrew R. M., Bakker D. C. E., Hauck J., et al. (2022). Global carbon budget 2021. Earth System Sci. Data 14, 1917–2005. doi: 10.5194/essd-14-1917-2022
Gruber N., Clement D., Carter B. R., Feely R. A., van Heuven S., Hoppema M., et al. (2019). The oceanic sink for anthropogenic CO2 from 1994 to 2007. Science 363 (6432), 1193–1199. doi: 10.1126/science.aau5153
Gruber N., Hauri C., Lachkar Z., Loher D., Frölicher T. L., Plattner G.-K. (2012). Rapid progression of ocean acidification in the California current system. Science 337, 220–223. doi: 10.1126/science.1216773
Hagens M., Middelburg J. J. (2016). Generalised expressions for the response of pH to changes in ocean chemistry. Geochim. Cosmochim. Acta 187, 334–349. doi: 10.1016/j.gca.2016.04.012
Ishii M., Feely R. A., Rodgers K. B., Park G. H., Wanninkhof R., Sasano D., et al. (2014). Air-sea CO2 flux in the Pacific Ocean for the period 1990-2009. Biogeosciences 10 (7), 12155–12216. doi: 10.5194/bg-11-709-2014
Ishii M., Inoue H. Y., Matsueda H., Saito S., Fushimi K., Nemoto K., et al. (2001). Seasonal variation in total inorganic carbon and its controlling processes in surface waters of the western North Pacific subtropical gyre. Mar. Chem. 75, 17–32. doi: 10.1016/S0304-4203(01)00023-8
Ishii M., Kosugi N., Sasano D., Saito S., Midorikawa T., Inoue H. Y. (2011). Ocean acidification off the south coast of Japan: A result from time series observations of CO2 parameters from 1994 to 2008. J. Geophys. Res. 116, C06022. doi: 10.1029/2010JC006831
Jiang L.-Q., Carter B. R., Feely R. A., Lauvset S. K., Olsen A. (2019). Surface ocean pH and buffer capacity: Past, present and future. Sci. Rep. 9, 18624. doi: 10.1038/s41598-019-55039-4
Jiang L.-Q., Dunne J., Carter B. R., Tjiputra J. F., Terhaar J., Sharp J. D., et al. (2023). Global surface ocean acidification indicators from 1750 to 2100. J. Adv. Model. Earth Syst. 15, e2022MS003563. doi: 10.1029/2022MS003563
Jiang L.-Q., Feely R. A., Carter B. R., Greeley D. J., Gledhill D. K., Arzayus K. M. (2015). Climatological distribution of aragonite saturation state in the global oceans. Global Biogeochem. Cycles 29, 1656–1673. doi: 10.1002/2015GB005198
Jiang L.-Q., Pierrot D., Wanninkhof R., Feely R. A., Tilbrook B., Alin S., et al. (2022). Best practice data standards for discrete chemical oceanographic observations. Front. Mar. Sci. 8, 705638. doi: 10.3389/fmars.2021.705638
Kim T.-W., Park G.-H., Kim D., Lee K., Feely R. A., Millero F. J. (2015). Seasonal variations in the aragonite saturation state in the upper open-ocean waters of the North Pacific Ocean. Geophys. Res. Lett. 42, 4498–4506. doi: 10.1002/2015GL063602
Kitamura T., Nakano T., Sugimoto S. (2016). Decadal variations in mixed layer salinity in the Kuroshio Extension recirculation gyre region: Influence of precipitation during the warm season. J. Oceanogr. 72, 167–175. doi: 10.1007/s10872-015-0317-1
Knap A., Michaels A., Close A., Ducklow H., Dickson A. (1996). “Protocols for the Joint Global Ocean Flux Study (JGOFS) core measurements. JGOFS Report Nr. 19, vi+170 pp,” in Reprint of the IOC Manuals and Guides No. 29 (Paris, France: UNESCO 1994).
Kobashi F., Mitsudera H., Xie S. P. (2006). Three subtropical fronts in the North Pacific: Observational evidence for mode water-induced subsurface frontogenesis. J. Geophys. Res. 111, C09033. doi: 10.1029/2006JC003479
Kuchinke M., Tilbrook B., Lenton A. (2014). Seasonal variability of aragonite saturation state in the Western Pacific. Mar. Chem. 161, 1–13. doi: 10.1016/j.marchem.2014.01.001
Kwiatkowski L., Orr J. C. (2018). Diverging seasonal extremes for ocean acidification during the twenty-first century. Nat. Climate Change 8, 141–145. doi: 10.1038/s41558-017-0054-0
Lauvset S. K., Carter B. R., Perez F. F., Jiang L.-Q., Feely R. A., Velo A., et al. (2020). Processes driving global interior ocean pH distribution. Global Biogeochem. Cycles 34, e2019GB006229. doi: 10.1029/2019GB006229
Lee K., Kim T.-W., Byrne R. H., Millero F. J., Feely R. A., Liu Y.-M. (2010). The universal ratio of Boron to chlorinity for the North Pacifc and North Atlantic oceans. Geochim. Cosmochim. Acta 74, 1801–1811. doi: 10.1016/j.gca.2009.12.027
Lewis E., Wallace D. W. R. (1998). Program Developed for CO2 System Calculations (Oak Ridge, Tennessee: ORNL/CDIAC-105, Carbon Dioxide Information Analysis Center, Oak Ridge National Laboratory, US Department of Energy).
Li C.-L., Han L., Zhai W.-D., Qi D., Wang X.-C., Lin H.-M., et al. (2022b). Storage and redistribution of anthropogenic CO2 in the western North Pacific: The role of subtropical mode water transportation. Fundam. Res. doi: 10.1016/j.fmre.2022.05.001. [Epub ahead of print].
Li C.-L., Zhai W.-D. (2019). Decomposing monthly declines in subsurface-water pH and aragonite saturation state from spring to autumn in the North Yellow Sea. Continental Shelf Res. 185, 37–50. doi: 10.1016/j.csr.2018.11.003
Li C.-L., Zhai W.-D., Qi D. (2022a). Unveiling controls of the latitudinal gradient of surface pCO2 in the Kuroshio Extension and its recirculation regions (northwestern North Pacific) in late spring. Acta Oceanol. Sin. 41 (5), 110–123. doi: 10.1007/s13131-021-1949-1
Lueker T. J., Dickson A. G., Keeling C. D. (2000). Ocean pCO2 calculated from dissolved inorganic carbon, alkalinity, and equations for K1 and K2: validation based on laboratory measurements of CO2 in gas and seawater at equilibrium. Mar. Chem. 70, 105–119. doi: 10.1016/S0304-4203(00)00022-0
Martz T. R., Connery J. G., Johnson K. S. (2010). Testing the honeywell durafet for seawater pH applications. Limnol. Oceanogr.: Methods 8, 172–184. doi: 10.4319/lom.2010.8.172
Millero F. J., Graham T. B., Huang F., Bustos-Serrano H., Pierrot D. (2006). Dissociation constants of carbonic acid in seawater as a function of salinity and temperature. Mar. Chem. 100, 80–94. doi: 10.1016/j.marchem.2005.12.001
Murata A., Shu S. (2012). Decadal changes in the CaCO3 saturation state along 179°E in the Pacific Ocean. Geophys. Res. Lett. 39, 4537–4541. doi: 10.1029/2012GL052297
Oka E., Ishii M., Nakano T., Suga T., Takatani Y. (2018). Fifty years of the 137°E repeat hydrographic section in the western North Pacific Ocean. J. Oceanogr. 74, 115–145. doi: 10.1007/s10872-017-0461-x
Ono H., Kosugi N., Toyama K., Tsujino H., Kojima A., Enyo K., et al. (2019). Acceleration of ocean acidification in the western North Pacific. Geophys. Res. Lett. 46, 13161–13169. doi: 10.1029/2019GL085121
Orr J. C., Fabry V. J., Aumont O., Bopp L., Doney S. C., Feely R. A., et al. (2005). Anthropogenic ocean acidification over the twenty-first century and its impact on calcifying organisms. Nature 437, 681–686. doi: 10.1038/nature04095
Pelletier G. J., Lewis E., Wallace D. W. R. (2015). CO2SYS.XLS: A calculator for the CO2 system in seawater for Microsoft Excel/VBA, Version 24 (Olympia, Washington: Washington State Department of Ecology).
Qiu B., Chen S. (2011). Effect of decadal Kuroshio Extension jet and eddy variability on the modification of North Pacific intermediate water. J. Phys. Oceanogr. 41, 503–515. doi: 10.1175/2010JPO4575.1
Takahashi T., Sutherland S. C., Chipman D. W., Goddard J. G., Ho C., Newberger T., et al. (2014). Climatological distributions of pH, pCO2, total CO2, alkalinity, and CaCO3 saturation in the global surface ocean, and temporal changes at selected locations. Mar. Chem. 164, 95–125. doi: 10.1016/j.marchem.2014.06.004
Takahashi T., Sutherland S. C., Sweeney C., Poisson A., Metzl N., Tillbrook B., et al. (2002). Global sea–air CO2 flux based on climatological surface ocean pCO2, and seasonal biological and temperature effects. Deep Sea Res. II 49, 1601–1622. doi: 10.1016/S0967-0645(02)00003-6
Takahashi T., Sutherland S. C., Wanninkhof R., Sweeney C., Feely R. A., Chipman D. W., et al. (2009). Climatological mean and decadal changes in surface ocean pCO2, and net sea-air CO2 flux over the global oceans. Deep Sea Res. II 56, 554–577. doi: 10.1016/j.dsr2.2008.12.009
Uppström L. R. (1974). The boron/chlorinity ratio of deep-sea water from the Pacific Ocean. Deep Sea Res. Oceanogr. Abstracts 21, 161–162. doi: 10.1016/0011-7471(74)90074-6
Waldbusser G. G., Hales B., Langdon C. J., Haley B. A., Schrader P., Brunner E. L., et al. (2015). Saturation-state sensitivity of marine bivalve larvae to ocean acidification. Nat. Climate Change 5, 273–280. doi: 10.1038/NCLIMATE2479
Wong G. T. F. (2012). Removal of nitrite interference in the Winkler determination of dissolved oxygen in seawater. Mar. Chem. 130/131, 28–32. doi: 10.1016/j.marchem.2011.11.003
Wong C. S., Waser N. A. D., Nojiri Y., Whitney F. A., Page J. S., Zeng J. (2002). Seasonal cycles of nutrients and dissolved inorganic carbon at high latitudes in the North Pacific Ocean during the Skaugran cruises: Determination of new production and nutrient uptake ratios. Deep Sea Res. Part II: Topical Stud. Oceanogr. 49 (2425), 5317–5338. doi: 10.1016/S0967-0645(02)00193-5
Woosley R. J. (2021). Evaluation of the temperature dependence of dissociation constants for the marine carbon system using pH and certifed reference materials. Mar. Chem. 229, 103914. doi: 10.1016/j.marchem.2020.103914
Wu Y., Qi D., Ouyang Z., Cao L., Feely R. A., Lin H., et al. (2021). Contrasting controls of acidification metrics across environmental gradients in the North Pacific and the adjunct Arctic Ocean: Insight from a transregional study. Geophys. Res. Lett. 48, e2021GL094473. doi: 10.1029/2021GL094473
Xu Y.-Y., Cai W.-J., Wanninkhof R., Salisbury J., Reimer J., Chen B. (2020). Long-term changes of carbonate chemistry variables along the North American East Coast. J. Geophys. Res.: Oceans 125, e2019JC015982. doi: 10.1029/2019JC015982
Xue L., Cai W.-J. (2020). Total alkalinity minus dissolved inorganic carbon as a proxy for deciphering ocean acidification mechanisms. Mar. Chem. 222, 103791. doi: 10.1016/j.marchem.2020.103791
Xue L., Cai W.-J., Jiang L.-Q., Wei Q. (2021). Why are surface ocean pH and CaCO3 saturation state often out of phase in spatial patterns and seasonal cycles? Global Biogeochem. Cycles 35, e2021GB006949. doi: 10.1029/2021GB006949
Yasuda I., Okuda K., Shimizu Y. (1996). Distribution and modification of North Pacific intermediate water in the Kuroshio-Oyashio interfrontal zone. J. Phys. Oceanogr. 26, 448–465. doi: 10.1175/1520-0485(1996)026<0448:DAMONP>2.0.CO;2
Yasunaka S., Nojiri Y., Nakaoka S., Ono T., Whitney F. A., Telszewski M. (2014). Mapping of sea surface nutrients in the North Pacific: Basin-wide distribution and seasonal to interannual variability. J. Geophys. Res.: Oceans 119, 7756–7771. doi: 10.1002/2014JC010318
Keywords: ocean acidification, underway pH, aragonite saturation state, temperature effect, western North Pacific
Citation: Li C-l, Wu Y, Chen K, Lin H, Chen L and Qi D (2023) Spatial symmetry and contrasting controls of surface pH and aragonite saturation state in the western North Pacific. Front. Mar. Sci. 10:1197977. doi: 10.3389/fmars.2023.1197977
Received: 31 March 2023; Accepted: 15 November 2023;
Published: 01 December 2023.
Edited by:
Khan M. G. Mostofa, Tianjin University, ChinaReviewed by:
Li-Qing Jiang, University of Maryland, College Park, United StatesRuifeng Zhang, Shanghai Jiao Tong University, China
Copyright © 2023 Li, Wu, Chen, Lin, Chen and Qi. This is an open-access article distributed under the terms of the Creative Commons Attribution License (CC BY). The use, distribution or reproduction in other forums is permitted, provided the original author(s) and the copyright owner(s) are credited and that the original publication in this journal is cited, in accordance with accepted academic practice. No use, distribution or reproduction is permitted which does not comply with these terms.
*Correspondence: Di Qi, cWlkaUBqbXUuZWR1LmNu