 William I. Atlas1*†
 Sami Ma2†
 Yi Ching Chou2Katrina Connors3Daniel Scurfield4Brandon Nam4Xiaoqiang Ma5Mark Cleveland6Janvier Doire7
 Jonathan W. Moore4Ryan Shea2
 Jiangchuan Liu2
- 1Wild Salmon Center, Portland, OR, United States
- 2School of Computing Science, Simon Fraser University, Burnaby, BC, Canada
- 3Pacific Salmon Foundation, Salmon Watersheds Program, Vancouver, BC, Canada
- 4Salmon Watersheds Lab, Simon Fraser University, Biological Sciences, Burnaby, BC, Canada
- 5Computing Science Department, Douglas College, New Westminster, BC, Canada
- 6Gitanyow Fisheries Authority, Gitanyow, BC, Canada
- 7Skeena Fisheries Commission, Kispiox, BC, Canada
Pacific salmon have experienced declining abundance and unpredictable returns, yet remain vital to livelihoods, food security, and cultures of coastal communities around the Pacific Rim, creating a need for reliable and timely monitoring to inform sustainable fishery management. Currently, spawning salmon abundance is often monitored with in-river video or sonar cameras. However, reviewing video for estimates of salmon abundance from these programs requires thousands of hours of staff time, and data are typically not available until after the fishing season is completed. Computer vision deep learning can enable rapid and reliable processing of data, with potentially transformative applications in salmon population assessment and fishery management. Working with two First Nations fishery programs in British Columbia, Canada, we developed, trained, and tested deep learning models to perform object detection and multi-object tracking for automated video enumeration of salmon passing two First Nation-run weirs. We gathered and annotated more than 500,000 frames of video data encompassing 12 species, including seven species of anadromous salmonids, and trained models for multi-object tracking and species detection. Our top performing model achieved a mean average precision (mAP) of 67.6%, and species-specific mAP scores > 90% for coho and > 80% for sockeye salmon when trained with a combined dataset of Kitwanga and Bear Rivers’ salmon annotations. We also tested and deployed a prototype for a real-time monitoring system that can perform computer vision deep learning analyses on site. Computer vision models and off-grid monitoring systems show promise for automated counting and species identification. A key future priority will be working with stewardship practitioners and fishery managers to apply salmon computer vision, testing and applying edge-capable computing solutions for in-situ analysis at remote sites, and developing tools for independent user-led computer vision analysis by non-computer scientists. These efforts can advance in-season monitoring and decision making to support adaptive management of sustainable wild salmon fisheries.
1 Introduction
Wild salmon are foundational for social-ecological systems around the Northeastern Pacific Rim (Yoshiyama, 1999; Atlas et al., 2021a; Carothers et al., 2021), and in an era of accelerating climate change, salmon ecosystems are experiencing unprecedented challenges (Kogan and Guo, 2015; Di Lorenzo and Mantua, 2016; Frölicher and Laufk¨otter, 2018). Salmon have experienced widespread declines in abundance and productivity, and returns have become increasingly unpredictable (Kilduff et al., 2015; Satterthwaite and Carlson, 2015; Dorner et al., 2018). Yet wild Pacific salmon have persisted through multiple periods of glaciation, are biologically equipped for rapid evolution and recolonization, and remain capable and essential for supporting livelihoods and food security in many places (Waples et al., 2008; Schuster et al., 2011; Knapp et al., 2013).
The challenge of maintaining opportunities for salmon fishing has been compounded by the predominance of mixed-stock fisheries that harvest indiscriminately from numerous co-migrating populations, creating substantial and often unquantified risks to the protection and recovery of salmon-centered social-ecological systems (Connors et al., 2019; Moore et al., 2021). This challenge is heightened by major data gaps in monitoring of fishery harvests and spawner abundance, and the traditionally high costs of producing in-season information to support management, posing significant risks to the biodiversity of wild salmon that underpin their resilience (Price et al., 2017; Atlas et al., 2021b; [PSC CTC] Pacific Salmon Commission Chinook Technical Committee, 2021). This knowledge contributes to a growing recognition that terminal and selective fisheries - those targeting individual species or populations as they enter their river of origin - can reduce conservation risks while providing sustainable harvest opportunities (Freshwater et al., 2020; Tuohy et al., 2020; Moore et al., 2021). These circumstances have therefore created a need for monitoring, assessment, and harvest tools that support real-time data integration for adaptive in-season management, efforts which can bolster fishery and ecosystem resilience to boom and bust cycles in salmon production (Schindler and Hilborn, 2015).
Computer vision, deep learning, and other artificial intelligence (AI) programs are revolutionizing human society, enabling rapid processing and analysis of large quantities of data, allowing data to inform decision making in a huge variety of applications (Stone et al., 2016). These tools, which have been pioneered over the last 60-years (and the past decade, in particular) by computer scientists and the technology industry, now touch almost every part of our everyday lives from ordering a taxi to restocking grocery store shelves. Computer programs with the capacity to learn and adapt their performance to a specific task are at the center of this real-time data processing. In recent years, artificial intelligence has been applied in a large and growing number of animal ecology and conservation contexts (Weinstein, 2018). Increasingly, computer vision deep learning is being applied in marine conservation and fishery monitoring contexts (Salman et al., 2020; Khokher et al., 2022). Yet far too often the application of these cutting-edge computing tools have not been scoped and co-developed with rural, remote, or historically-marginalized communities, limiting their benefits outside of traditional economic and political centers of power (Scheuerman et al., 2021).
Indigenous Peoples around the Pacific Rim fished for salmon for at least 10,000 years prior to the arrival of European colonists and developed harvest, management, and stewardship systems that promoted widespread stability of salmon populations for millennia (Swezey and Heizer, 1977; Campbell and Butler, 2010; Atlas et al., 2021a). Wild salmon remain fundamental to the identity, food security, and livelihood opportunities available to Indigenous Peoples and other coastal people around the Pacific Rim (Nakhshina, 2012; Earth Economics, 2021; Carothers et al., 2021). In recent decades Indigenous People in the United States and Canada have fought and won numerous legal and political battles to counteract the dispossession of governance authority over their traditional territories (e.g. US v. Oregon 1969; US v. Washington 1975; R v. Sparrow 1 S.C.R. [1075] 1990), and now play a leading role in the monitoring and management of many natural resources including salmon. However, given the large number of salmon streams in many Indigenous territories, and the significant staffing and financial demands that salmon population monitoring activities place on small, rural Indigenous communities, there is a need for tools and programs to support the re-emergence of Indigenous-led monitoring and assessment programs grounded in long-standing systems of stewardship, and a transition toward sustainable in-season management of fishery opportunities (Gottesfeld et al., 2009; Atlas et al., 2017; Atlas et al., 2021b).
In response to this need, we formed an interdisciplinary collaborative team to co-develop and apply a computer vision model for automated identification and counting of salmon from video generated at salmon counting weirs; river spanning fences used to count or harvest migrating salmon. This effort brought together computer science researchers, fishery and conservation scientists, and Indigenous and non-Indigenous conservation practitioners from around British Columbia with the shared goal of automating counting and identification of salmon, trout, and other freshwater fish from underwater videos. Here we develop and test two computer-vision models for automated video counting of migrating salmon: a multi object tracker (MOT) and a species detection model, which are run in parallel to count and identify individual salmon passing through weirs. Computer science tools for salmon monitoring and conservation can deliver accurate and expedited in-season processing of salmon counting videos, a task which traditionally has required hundreds to thousands of staff hours to complete.
2 Materials and methods
2.1 Salmon counting computer vision model
Detecting objects in an image or video frame has traditionally relied upon mathematical properties to detect edges and connected objects, however these approaches did not perform well with complex objects. With the rise of modern machine learning, models can be created and supplied with many image samples of the desired objects to detect, essentially training the model to detect the same objects in new images. Deep learning is an extension of a specific machine learning approach, whereby model architectures are more complex with many layers, potentially requiring large datasets of up to millions of samples and multiple days to weeks of training to perform reliably.
In order to count migrating salmon in a video, two tasks must be performed: species recognition and multi-object tracking. Species recognition refers to recognizing the species of a target fish, for example whether it is a coho (Oncorhynchus kisutch) or a sockeye (O. nerka), and tracking refers to following individual fish between multiple video frames to avoid over and under counting. We used two different deep learning models to for these two tasks, namely a species detector and a multi-object tracker (MOT) model, which were trained on a large dataset of annotated salmon videos from two ongoing monitoring projects in the Skeena River watershed (Figure 1).
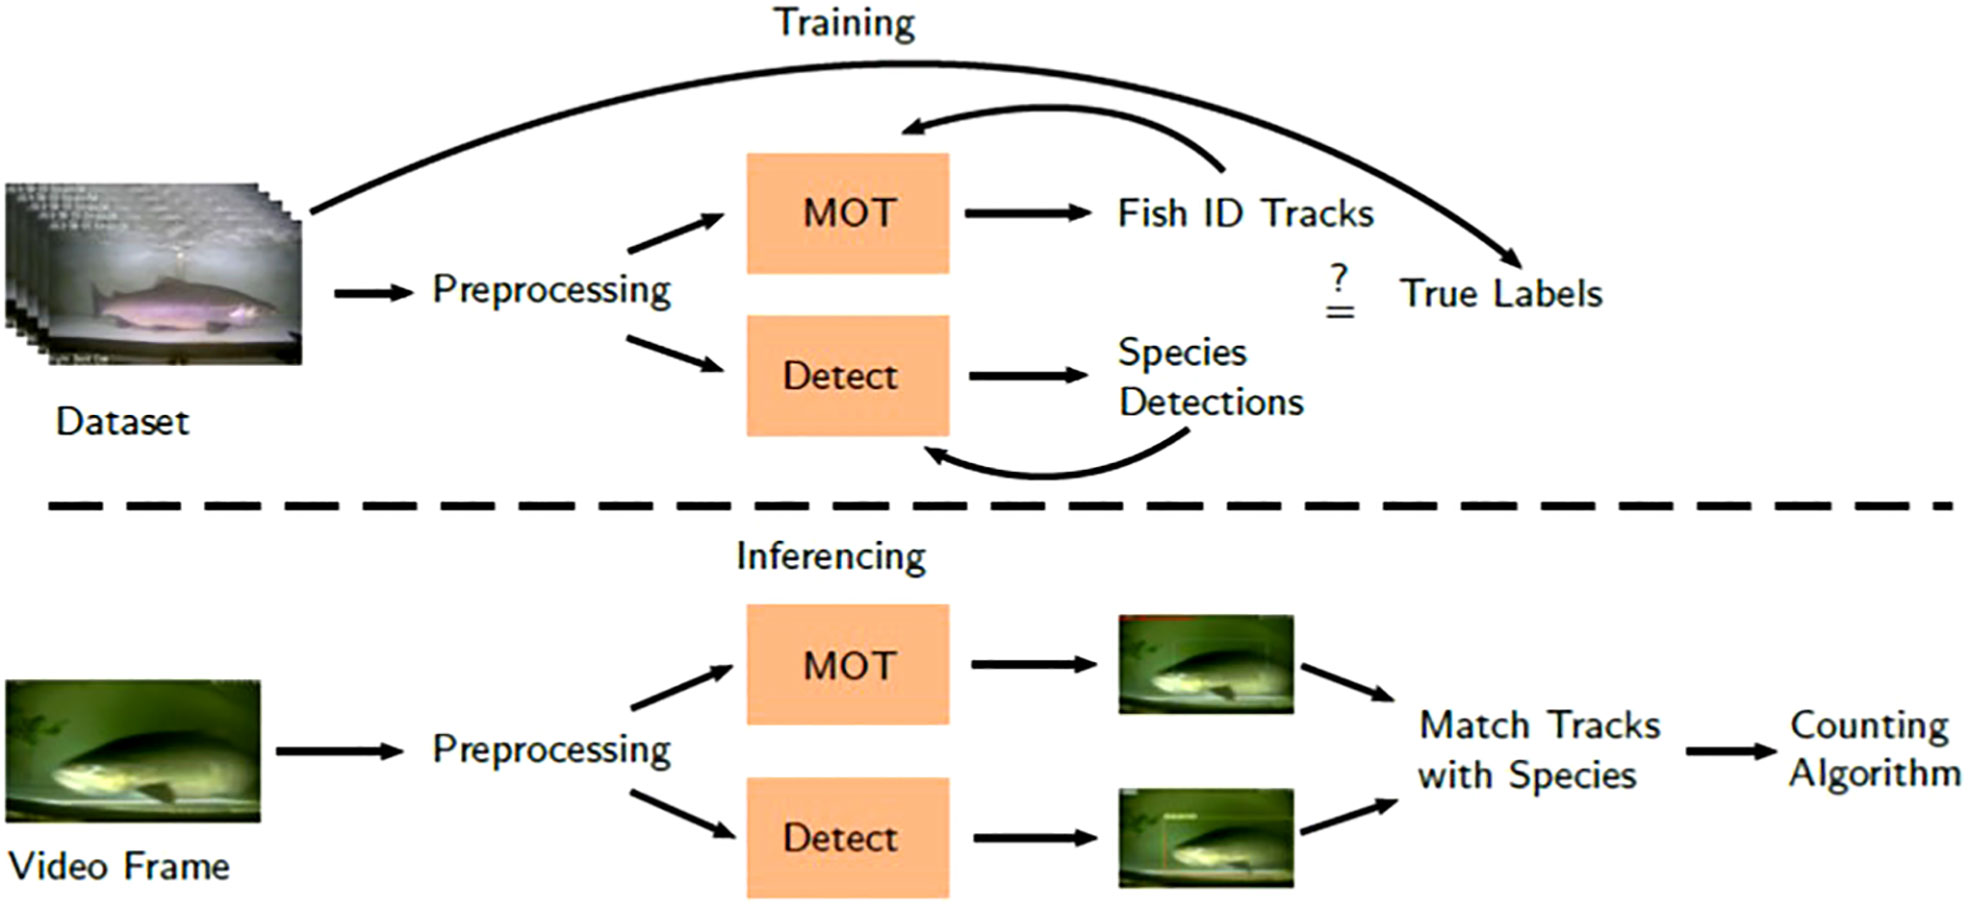
Figure 1 Salmon counting and identification pipeline. Inferencing is the application of the model to unseen data to evaluate performance.
2.2 Dataset
The dataset we used to train our models consisted of 1,567 salmon videos ranging from several minutes to an hour long with 532,000 labeled frames and 15 unique species-class labels. The initial videos were provided from an Indigenous-led weir project on the Kitwanga River, where the Gitanyow Fisheries Authority gathered continuous salmon video data from August to October 2019. The Kitwanga River is a tributary of the middle Skeena River, and supports populations of sockeye, coho, pink (O. gorbuscha), chum (O. keta), and Chinook salmon (O. tshawytscha), as well as steelhead (O. mykiss), bull trout (Salvelinus confluentus), mountain whitefish (Prosopium williamsoni), northern pikeminnow (Ptychocheilus oregonensis), Pacific lamprey (Entosphenus tridentatus), and resident rainbow trout (O. mykiss resident life history). In addition, we differentiated jacks, males which return after only one summer at sea, from adult coho and Chinook since these smaller individuals have distinct size and morphological characteristics. Videos were uploaded to a Google Drive, where technicians worked on drawing bounding boxes around each fish and annotating the file with their relevant information (e.g. species, sex, absence of adipose fin indicating hatchery origin) with a tool called the Computer Vision Annotation Tool (CVAT) (Sekachev et al., 2020) from the OpenVINO™ Toolkit. For every annotated video, each frame is labelled using a simple automatic interpolation algorithm between the first and last annotated frame to reduce manual annotation labor. This process of video annotation is time consuming but essential for developing sufficient training data libraries.
To increase the diversity of our training dataset, and to evaluate the performance of the computer-vision model in a new location, we annotated additional video data from the Bear River weir, operated on a tributary of the Sustut River in the Upper Skeena watershed by the Skeena Fishery Commission, in collaboration with the Gitksan Watershed Authorities and the Takla Nation. So far, the annotated Bear River dataset consists of 123 videos (∼32,000 annotated frames), which were used for model testing and validation. Efforts are ongoing to increase the size and diversity of the datasets used to train the model with more annotations from both locations, as well as other locations around the North and Central Coast of British Columbia.
Due to the imbalance in the representation of different species in our datasets, we opted to perform training, validation, and testing using a stratified splitting method (Gill et al., 2004; May et al., 2010) in a 70:15:15 ratio on the Bear Creek and Kitwanga dataset separately, before creating a combined dataset with subsets from both Bear and Kitwanga hereafter referred to as the Kit-Bear dataset. Stratified splitting methods aim to distribute the dataset with the same class proportion across all of the different subsets (Farias et al., 2020). This method helps address imbalances in the subsets by allowing more access to rarer object classes when random sampling. While the dataset is separated into sequences of video frames for each video, we opted to keep each entire sequence within a single subset instead of allowing the video frames to split between multiple subsets. One sequence will often show a single fish sample with multiple frames, so splitting the frames into the validation or test set would not be reflective of the real-world application of the model. Splitting by sequences is also more consistent with MOT training, as this model requires consideration of previous frames to track individual objects across the field of view and produce a reliable count.
We filtered the initial datasets by removing erroneous bounding boxes and non-wide boxes that contained limited information and could negatively affect the training to produce a dataset described in Table 1. For example, some annotations with tracking bounding boxes are vertically thin denoting salmon that had already moved through the field of view and do not provide any information with which to determine the species. This method also removed annotations fitted around the head or tail while the salmon is entering or leaving the field of view. Frames including only the head or tail may provide useful information, however, further research would be required to determine the distribution of the dataset. These boxes were removed using OpenVINO™ Toolkit’s Dataset Management Framework by filtering annotations where the width is greater than the height of the bounding box.
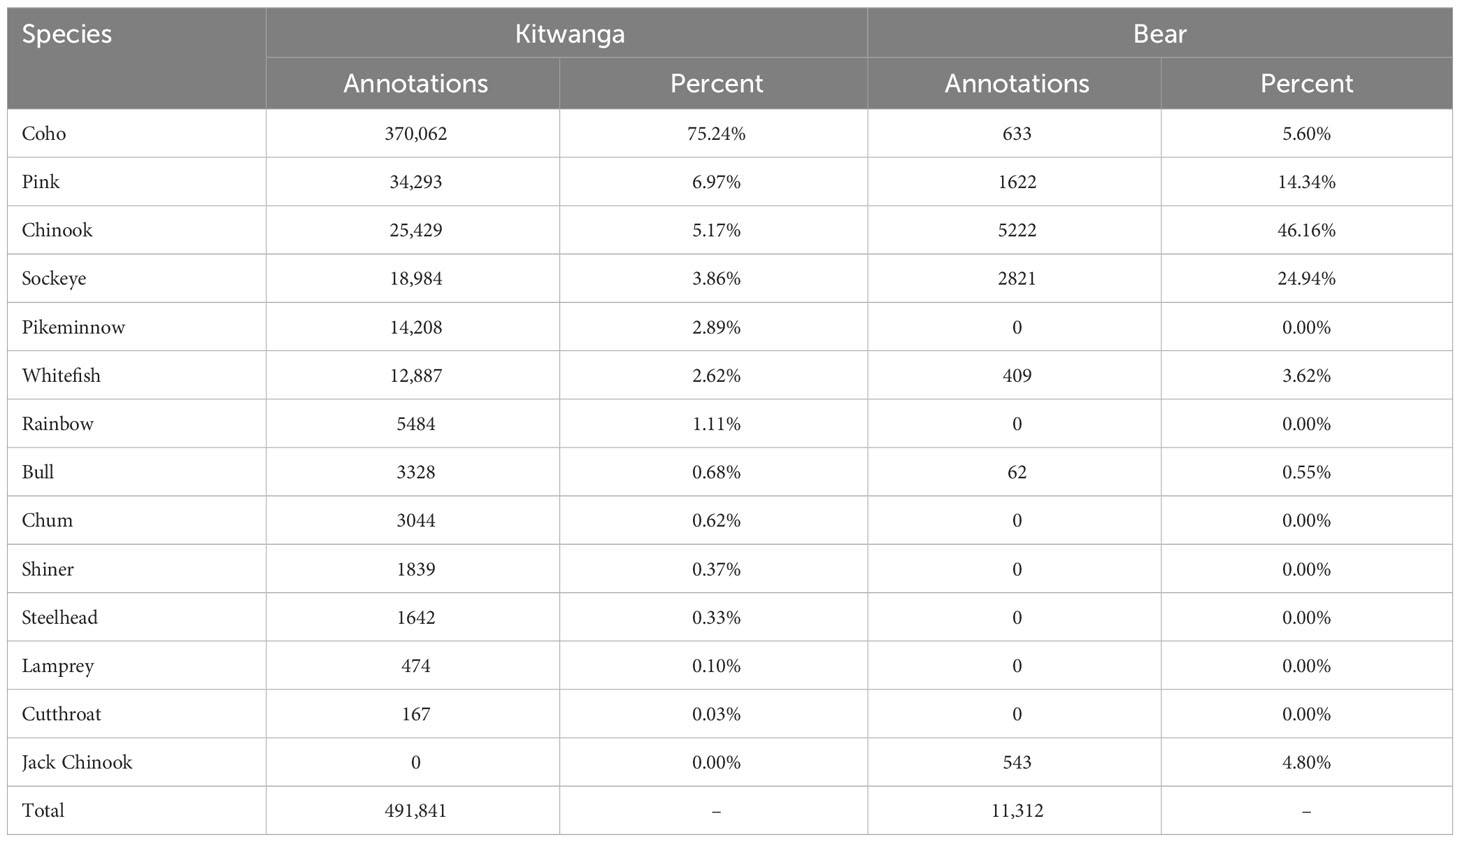
Table 1 The filtered dataset distribution with erroneous bounding boxes removed.
We employed a splitting solution to perform stratified splitting to keep the video frames of each sequence within the same subset. To achieve this, we use random sampling with an algorithm to add sequences until each category is full for each subset. We use the distribution of the filtered dataset in Table 1 to calculate the split ratio capacities. For small datasets, we placed one sequence of each category into every subset before running the algorithm. This prevents any one subset from dominating any uncommon categories. The algorithm iteratively adds a random sampled sequence to a subset and sums up all of the category counts until all of the counts are full according to the distribution percentage. For the Bear River dataset, unfortunately, only one sequence had bull trout which was placed in the test set, so the model could not be trained to recognize bull trout using data only from the Bear River.
Initially, video frames with no fish present negative samples were not added to the dataset, however, during model testing we found that having negative samples can improve the robustness of the models. We therefore used these empty frames to provide training data on negative samples (no fish present) which totaled approximately 1 million frames. Bochkovskiy et al. (2020) and Sung and Poggio (1998) also describe better performance when using negative samples in model training. If negative samples are not added, the models will sometimes conclude that empty frames include fish, highlighting the need to include true zero detection files in the training data.
2.3 Models
To achieve automated counting and species identification, we created two models that serve complimentary purposes: a species detection model and a multi-object tracker (MOT). The pipeline shown in Figure 1 describes the simplified steps required to count salmon from video frames. These tracking and species recognition models leverage computer deep learning to achieve automation in salmon counting and classification. The salmon species detection process was evaluated on a family of You Look Only Once (YOLO) models, namely, YOLOv4 (Bochkovskiy et al., 2020), YOLOv5 (Jocher et al., 2022), YOLOv6 (Li et al., 2022), and YOLOv7 (Wang et al., 2022a). These are a class of models that perform object detection by locating desired objects in an image, identifying and drawing a bounding box around them. YOLO especially aims to provide real-time performance of more than 30-60 frames per second (FPS) for lower powered machines. The MOT uses the Joint Detection and Embedding (JDE) model (Wang et al., 2020) which performs detection and tracking in a single-shot with YOLOv3 as the backbone. Like the species detection model, JDE draws bounding boxes around each detected object, however, instead of identifying the species, it assigns an identifier (ID) to each object and match the boxes to each other in each frame to track individual objects throughout the video. Using Datumaro and Python scripts, we extracted the video frames and combined them with the annotations we created using CVAT and then converted them to the necessary formats for training on these two models. The JDE model requires an edited MOT sequences format whereas the YOLO models require their own YOLO format.
To evaluate model performance, we used mean average precision (mAP) scores as a metric to quantify the ability of our models to reliably detect and identify salmon species. mAP scores can range from 0.0-1.0 with 1.0 meaning that the model perfectly detects all desired objects with no mislabels. mAP itself is an average of various performance metrics that describe the accuracy of the model against a validation or test dataset that has been withheld from model training. For example, one of the metrics is precision which is estimated across all detections the model has made, and how many of them are correctly labeled. For our research team, achieving a mAP score greater than 90% is considered the performance threshold for implementing automated counting and identification in a fishery management context.
We made use of each model architecture’s main code base on GitHub and followed instructions for training custom object detectors. We set batch size (512) and image resolution (640x640) to be the same across all models to limit discrepancies in the training data. We selected the model with the least complexity for each version as this provides more viable performance for running the model onsite with less powerful computing hardware.
We trained models on our Lambda Scalar server with four A5000 graphics cards one at a time for each dataset for a maximum of 8 hours or until the validation score stagnates or worsens. These are the specific models and code base to perform the species detection task: YOLOv4-tiny, YOLOv5n, YOLOv6n, and YOLOv7n. YOLOv7 required lowering the momentum parameter to prevent the loss from becoming NaN, terminating the training run. After stopping the training, the best validation mAP score checkpoints are used for the final mAP evaluation tested on the respective test sets. Often, models on the Bear River dataset were trained for 100-400 epochs, and the Kitwanga and Kit-Bear datasets were trained for 20-30 epochs. An epoch denotes one full pass through of the entire training dataset, for example, 20 epochs would mean the model looked through or trained on the entire training subset 20 times. These differences in training iterations are largely due to differences in the size of each dataset.
We trained the JDE model for MOT with the same method as the species detectors. Using the YOLOv3-tiny model as the backend, we re-created the configuration file from the YOLOv4 repository to conform with the JDE algorithm. Batch size was set to 256 and resolution is 640x640. Like the species detector, MOT models are trained until validation mAP scores reaches an asymptote. These final mAP scores evaluated on the test set are then used as a performance metric for the JDE model. The demo Python script provided in the JDE repository can be adapted to perform a primitive counting algorithm by checking if the tracking bounding box left or right edge passes a certain threshold across the field of view to determine whether that fish should be counted. We found a value of 20-30% of the field of view to be a good threshold considering how the bounding boxes are large due to the closeness of the salmon to the camera. To increase robustness, the counting algorithm records the history of tracking frames, requiring a certain number of frames before being counted. Lowering this number can cause incorrect detections in the background. However, increasing this detection threshold may cause the model to miss fish that swim through the trap rapidly. We set this number to ceil (FPS/8) or one eighth of a second as this number of history frames captures the most fish as they moved through the video box. For example, in a 25 FPS video, the algorithm matches 4 frames in the history to see whether this fish ID has been tracked before and if so, that fish ID is added to the count. The direction of movement also matters for fish counting, and we recorded only fish swimming upstream as a positive count. Fish moving downstream were recorded as a negative count, with the upstream direction set to the right or the left in the camera’s field-of-view depending on the direction of the flow.
2.4 Salmon monitoring prototype
During the summer of 2021, we built, deployed, and tested a system for remote salmon monitoring with Fisheries and Oceans Canada (DFO) and BC Hydro. The Coquitlam River was selected as the site for this test given its proximity to the university campus and the need for automated detection and notifications when salmon entered the Coquitlam Dam trap. Sockeye salmon are trapped and trucked around the dam to restore their population. Previously, BC Hydro and DFO staff periodically checked the trap to measure, record, and transport salmon. Thus, deploying a system for automated alerts provided an opportunity to reduce staff time required for visiting the trap, allowing staff to visit during times when they are certain that salmon are present.
The remote video monitoring system, shown in Figure 2 in the most up to date configuration, initially consisted of only two microprocessors (a Raspberry Pi 4B and a Jetson Nano), two underwater cameras, a network switch, and a router. A Raspberry Pi is a tiny low powered computer running a Linux-based operating system. A Jetson Nano is Nvidia’s version of a tiny computer, and is equipped with graphics processing capabilities, allowing the Jetson Nano to run complex deep learning models. For underwater cameras, we used a BARLUS 316L 2MP 1080p camera (B316L) with a 140° 2.8mm lens and a BARLUS 304 1440P 4MP camera (B304) with a 80° 3.6mm lens. The two cameras were mounted at different locations giving both a side-view (B316L) and an overhead view (B304) of salmon entering the trap. Both cameras performed similarly, however, B304 has a narrower viewing angle and different aspect ratio (4:3 instead of 16:9). Lacking easily mountable spots for the side-view, DFO fashioned a mounting enclosure attached to the gate for the side-view camera.
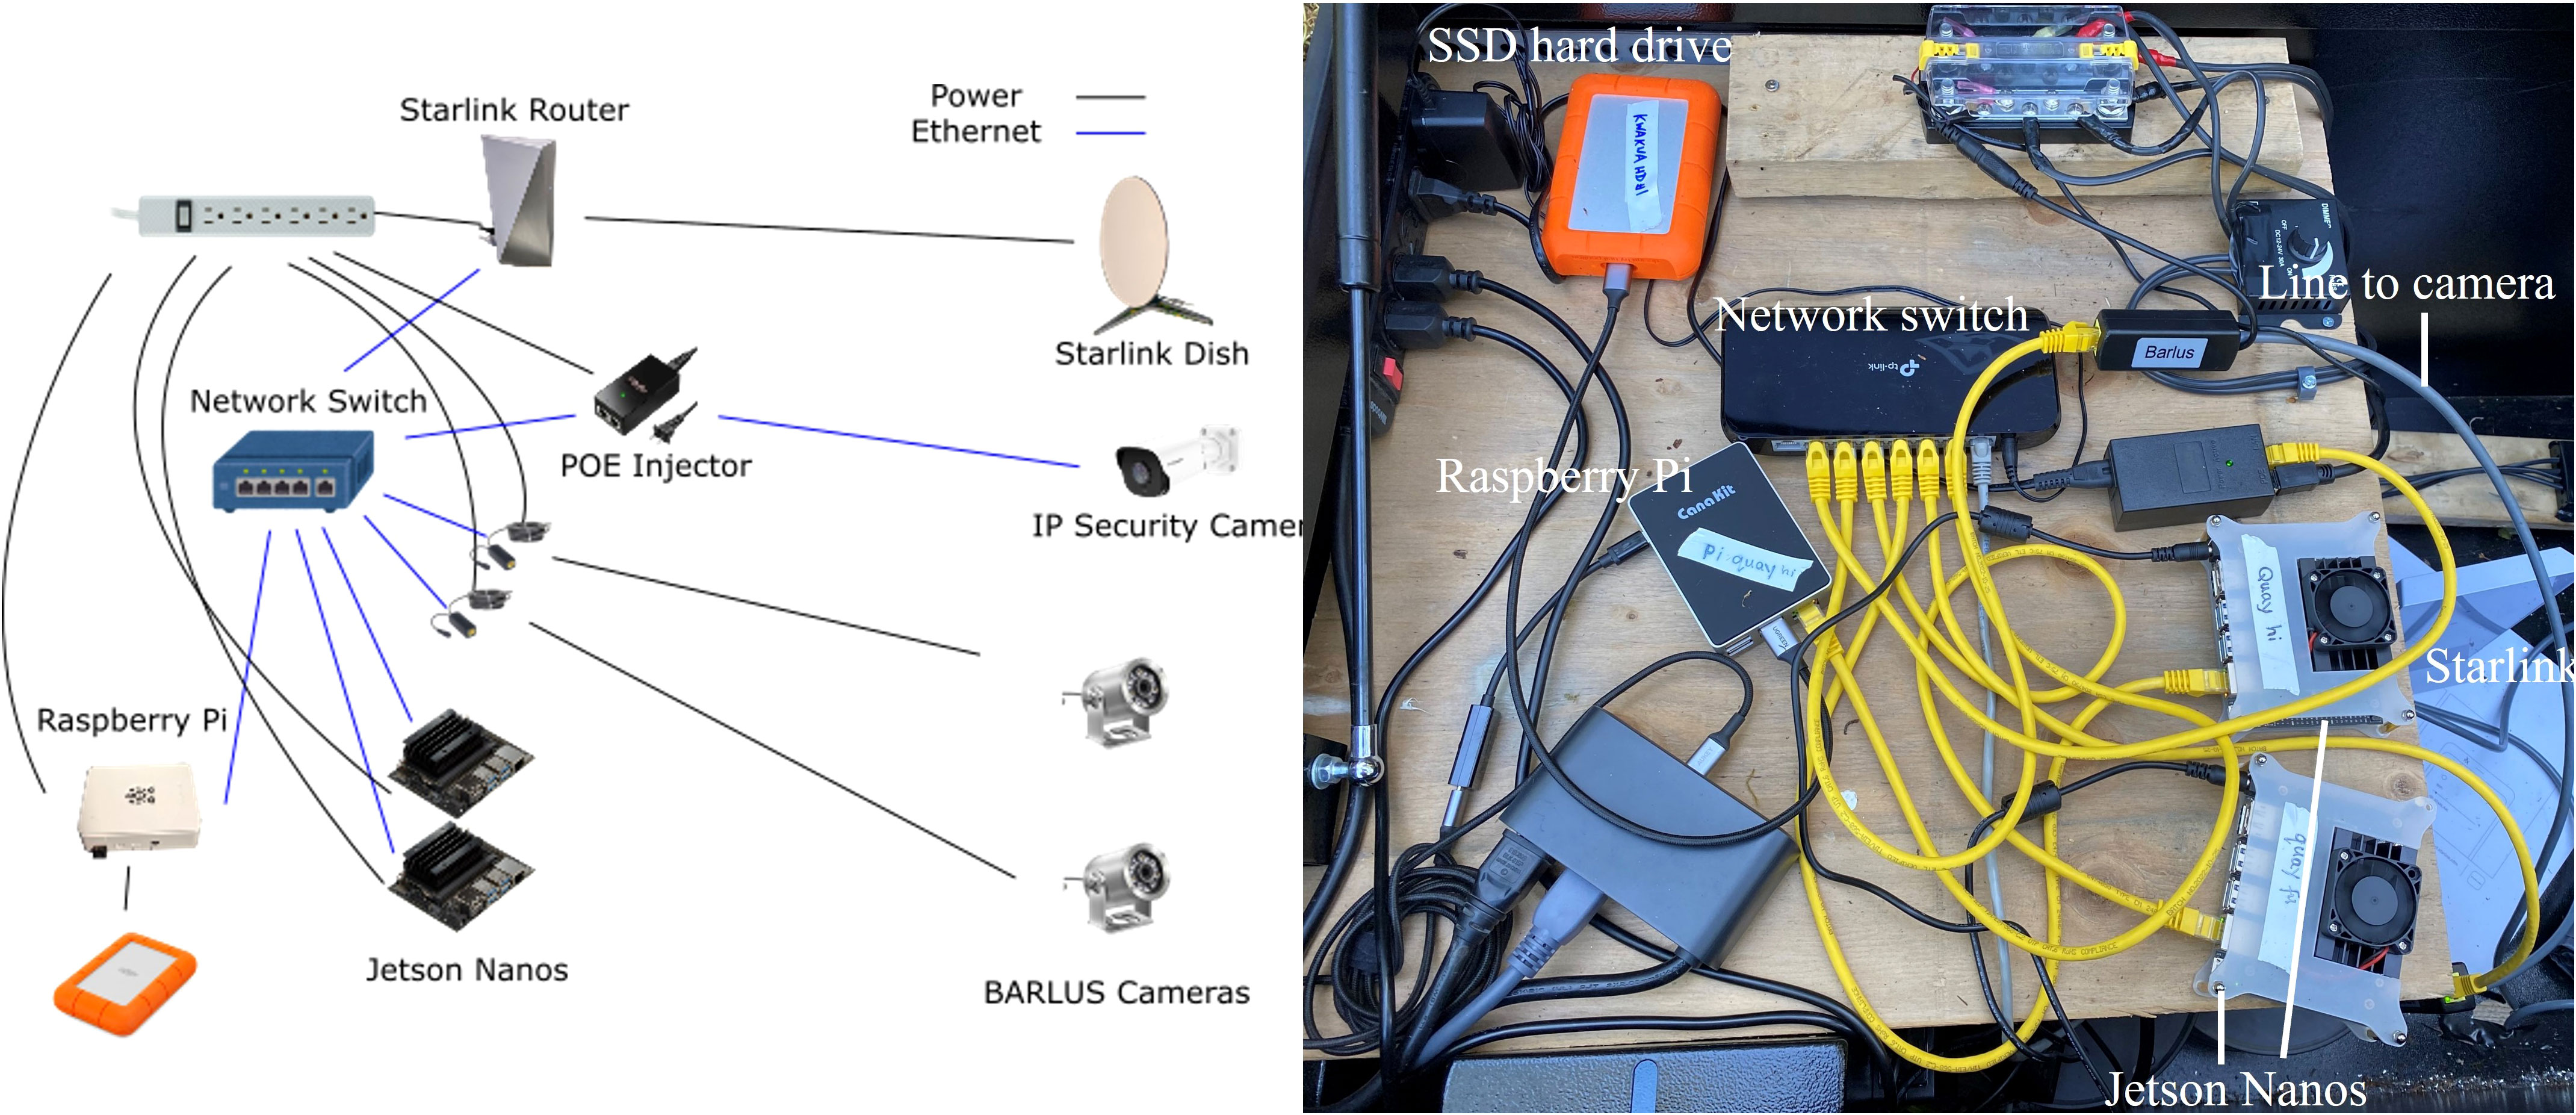
Figure 2 A diagram of the setup of the Salmon Monitoring Prototype (left panel), which was adapted for application in the Kwakwa Lakes watershed in partnership with the Kitasoo Xai’xais Stewardship Authority (right panel).
These IP cameras were connected to a local network using a network switch and router for our devices to access the cameras. The Raspberry Pi can also be configured to provide an IP address management (or DHCP) server, so a router may not be necessary in future implementations. We added an SSD hard drive to the system to gather data from the site, weekly. Duplicates of all hardware components were purchased, allowing our team to debug software issues in the lab and swap reconfigured microprocessors in the field. All components were stored inside a large, well-ventilated job box to protect it from wildlife and the elements, and to allow heat to escape.
3 Results
Across the range of computer vision models and combinations of training data we evaluated, model-wide metrics of performance (mAP score) were consistently higher when models were trained on video data from the watershed where they were being applied (Table 2). The 50 subscript denotes that the Intersection Over Union (IOU) is 0.50. IOU is a threshold ranging 0.0-1.0 that describes how much should the predicted bounding box intersect the true annotated bounding box before being labeled as a correct prediction. A model built using YOLOv6n and trained with Kitwanga data achieved a model-wide mAP score of 69.4% when tested on a subset of annotated Kitwanga River data that was withheld from model training (test set), and training the same model with the Kit-Bear dataset produced our highest detection performance (70.2%) for the Kitwanga test set. By comparison, the same model achieved a mAP score of only 3.3% when trained using Bear River data and tested on the Kitwanga. YOLOv6n also produced highest score result within the Bear River and Kit-Bear test sets, achieving 60.3% and 67.6% respectively when trained with the hybrid Kit-Bear training set. YOLOv7-tiny should provide similar performance to YOLOv6n with greater speed (Wang et al., 2022a), however, YOLOv7-tiny achieved a lower mAP score. This may be due to the required momentum parameter tweak to prevent the training from failing. Longer model training regimes might allow YOLOv7-tiny to reach similar or better performance to YOLOv6n, since lowering the momentum parameter inadvertently slows changes in the model for each iteration.
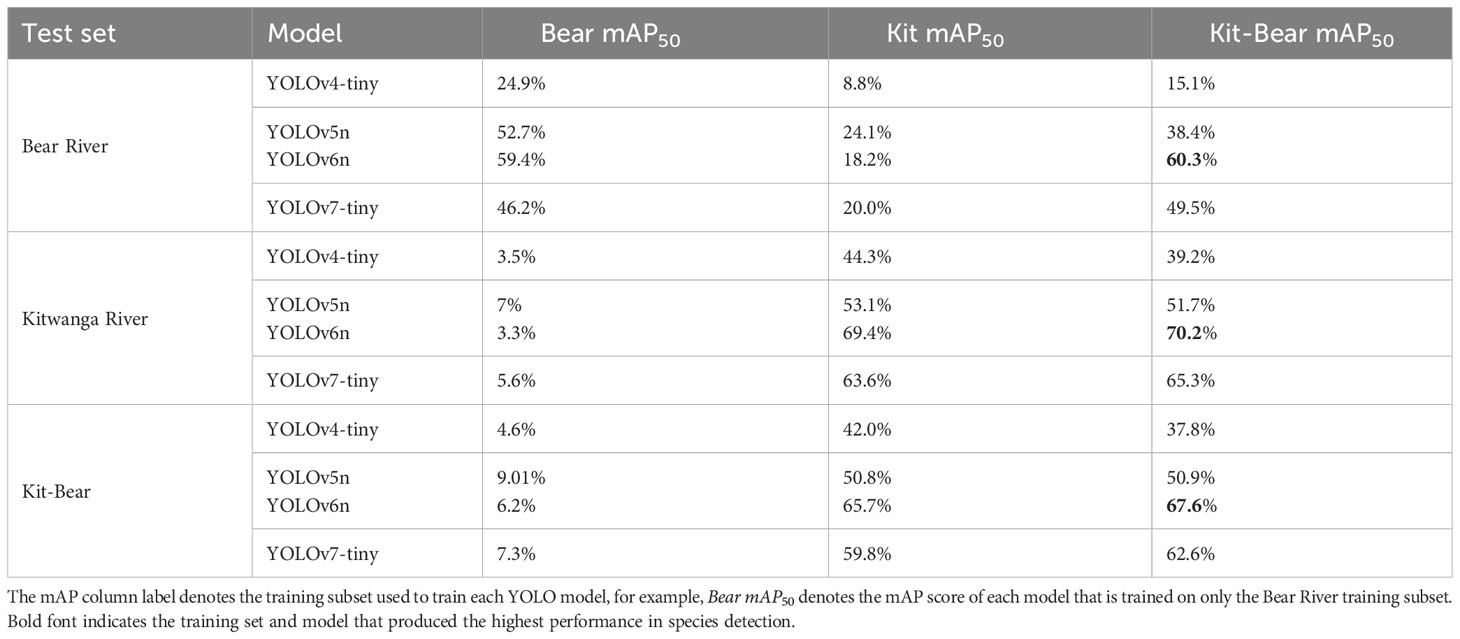
Table 2 Salmon species detection performance for models trained on the Bear mAP50, Kitwanga mAP50, and combined Kit-Bear mAP50 datasets, and tested on data withheld from each training set.
Across species, model predictive accuracy – measured by the mAP50 score – achieved for individual species varied considerably (Table 3), providing key insights into the potential challenges and opportunities to automated computer vision salmon counting. The model attained high mAP scores for the coho, sockeye, and pikeminnow ranging from 0.8-0.9 mAP at 0.50 IOU in almost all the models we evaluated. However, the model achieved a mAP score of only 0.25 for pink salmon despite their relatively high prevalence in the training dataset.
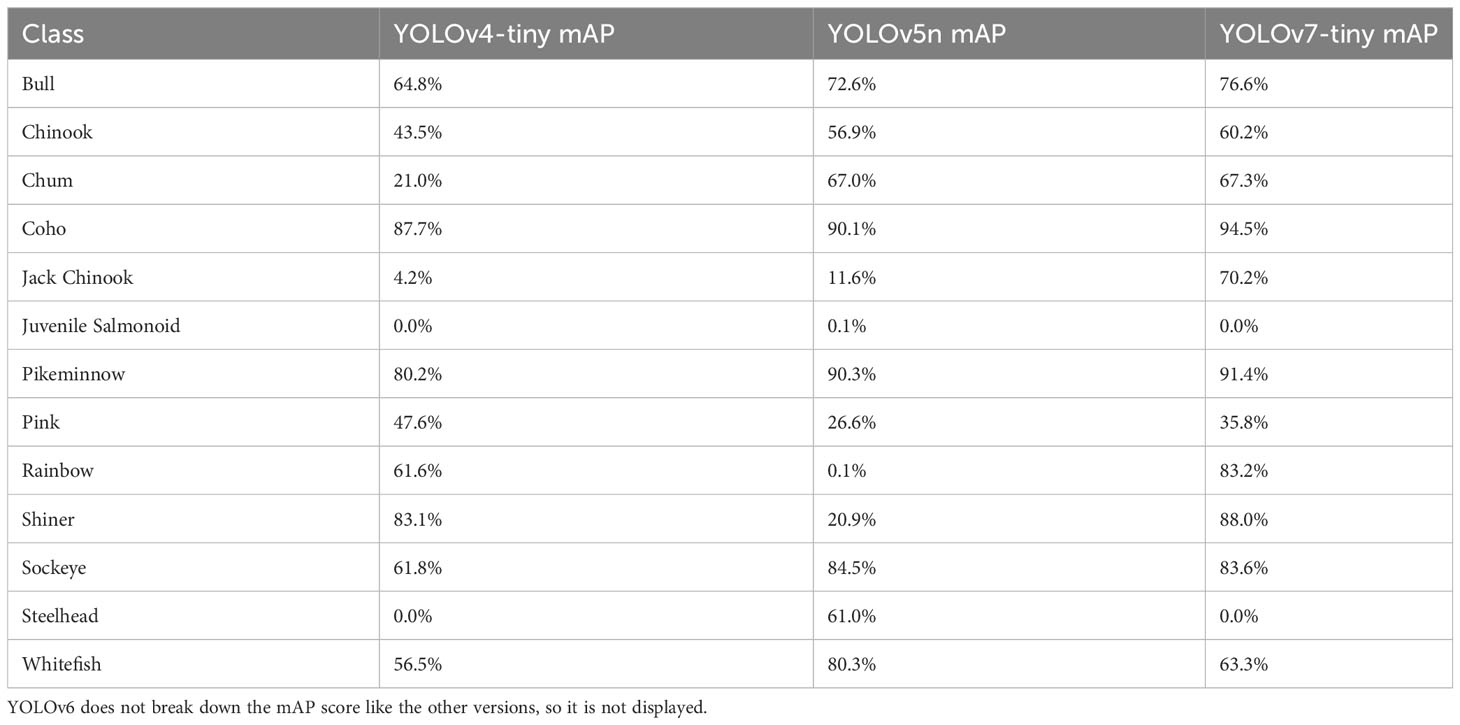
Table 3 The class distribution mAP on the Kit-Bear dataset.
Among the four models we evaluated, the accuracy of species detections varied, with some models achieving higher performance in detecting anadromous salmon species that are the focus of most video monitoring projects. YOLOv5n achieved the highest rate of correct detections for Shiner (92%) but performed relatively poorly among all other salmonid species, including an 84% false classification rate for pink salmon (Figure 3A). YOLOv6n more successfully detected coho (87%), sockeye (74%), pink (40%) and bull trout (77%) than YOLOv5n (Figure 3B). YOLOv7n achieved the highest performance among models for detection of coho (90%) and Chinook (69%), and performed relatively well for sockeye (81%), bull trout (73%) and pink salmon (40%) (Figure 3C). Pink salmon posed particular challenges for automated detection, the two top models assigned them correctly in only 40% of cases, and pinks were frequently confused for sockeye, coho and rainbow trout. Steelhead and jack Chinook were both uncommon in our training dataset and were only present in one of the two river-specific training datasets (Table 1), likely contributing to poor model performance in detecting them. Another challenge for automated counting stems from salmon overlapping in the video box, potentially obscuring some individuals from detection (Figure 4). Overlapping salmon are detected by the model except when they fully eclipse one another. In these instances, two overlapping fish may be detected as one, and when they separate, tracking IDs between the two can be mixed up, assigning the fish the wrong ID. These issues can affect species counts by either under counting or incorrectly counting a fish that turns back downstream through the trap.
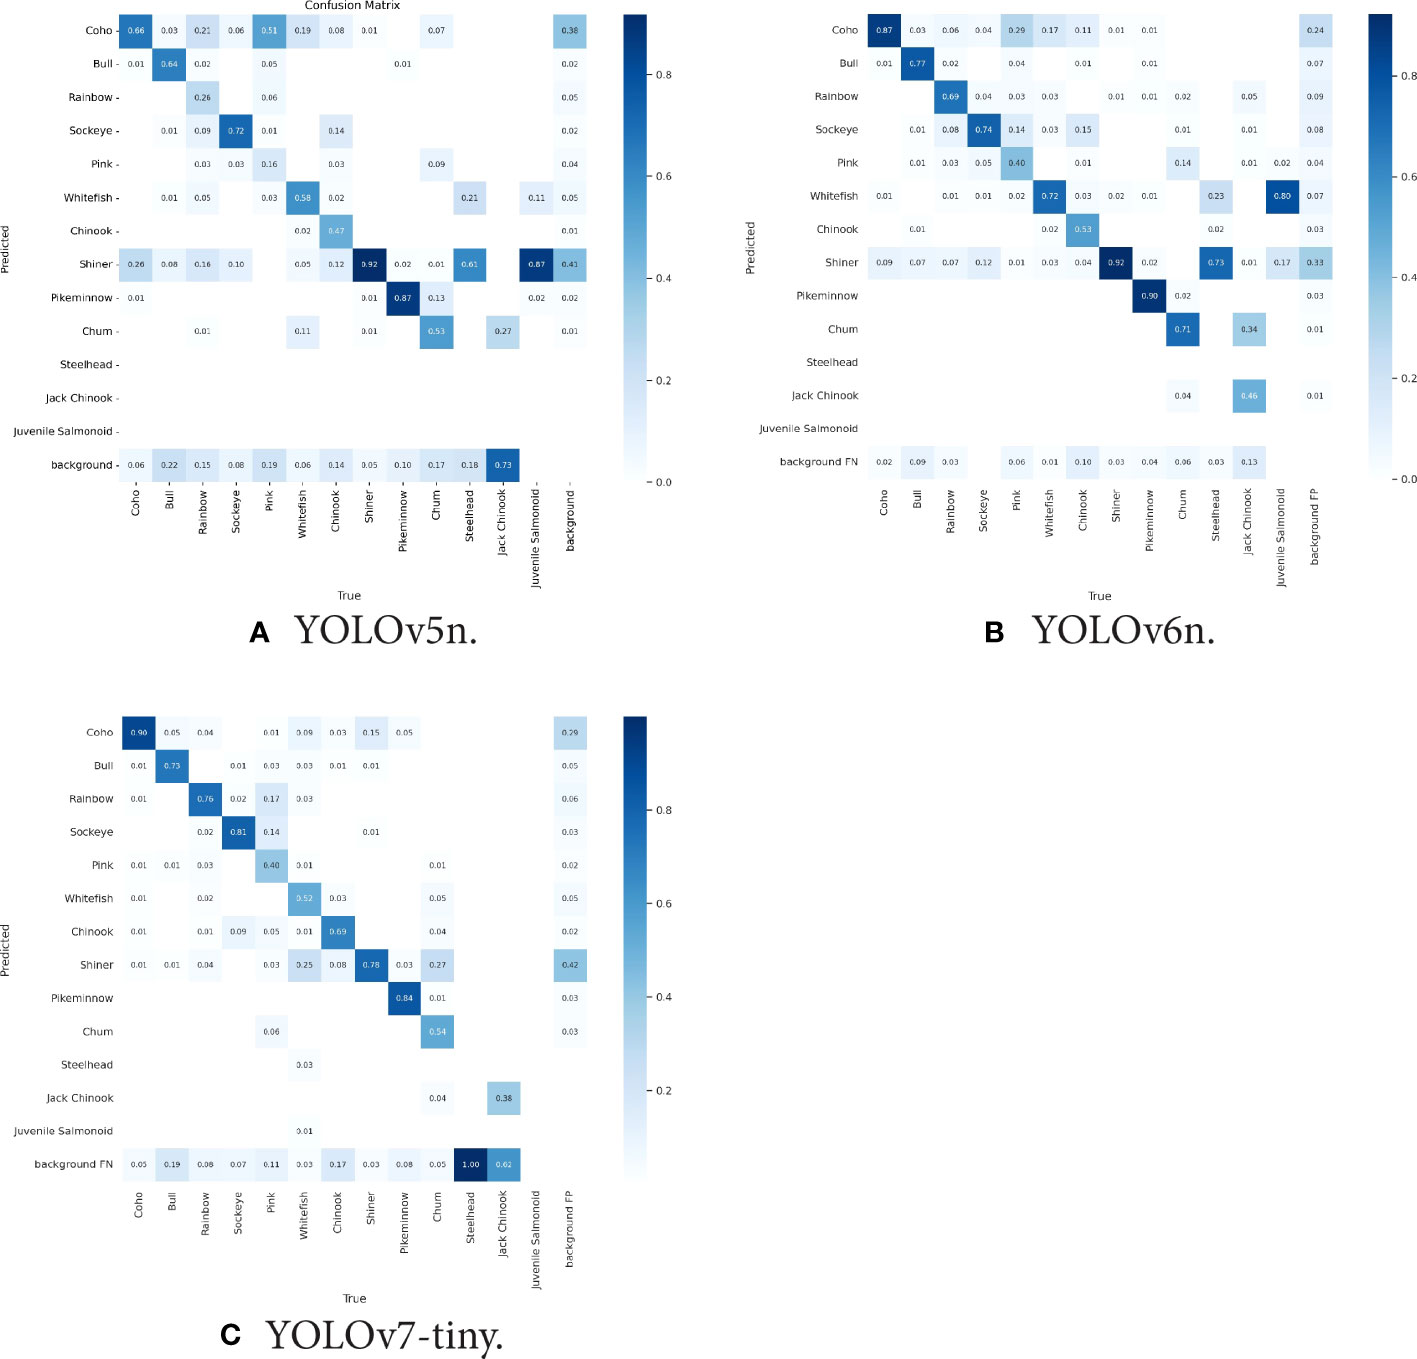
Figure 3 Confusion matrices for their respective models trained and tested on the Kit-Bear dataset, comparing the predicted species to what is the true annotated species. The values in the left to right diagonal of the matrix represent the species-specific performance of the model, with the y-axis denoting the class that the model predicted and the x-axis denoting the true species class in the annotated dataset. The background label on the y-axis refers to False Negative (FN) predictions which are all the classes the model missed detecting. The background label on the x-axis refers to background False Positive (FP) predictions which are all the classes that the model predicted to be a fish but is actually something else (The background in this case).
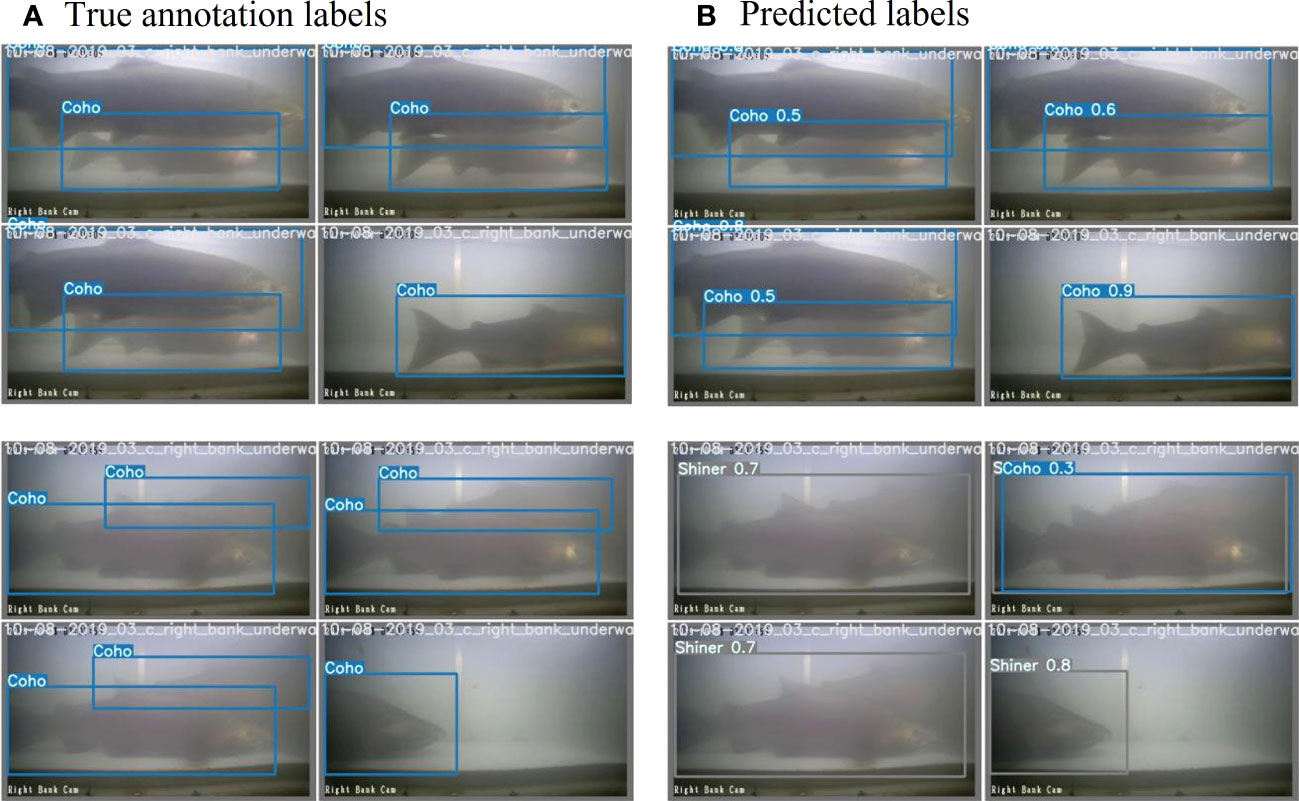
Figure 4 Overlapping Coho salmon moving through the Kitwanga River video box with true annotations in the left panels and species detection results generated as the fish pass through the field of view in the right panels. Image batches are from the Kit-Bear dataset tested with YOLOv7-tiny. The number next to the species label in the predicted labels is the confidence percentage.
As an early test, we ran the MOT model to count salmon on a season’s worth of data in 2022 for the Bear River. Currently, Bear River data are analyzed by first using the motion sensing software SecuritySpy by Benson Software to extract video clips where the software detects movement. These clips are then reviewed by technicians to produce species counts. This count produced a total run size estimate that was 91% of the estimate produced by Skeena Fisheries Commission technical staff. Sockeye salmon in the Bear River videos swim very quickly through the video trap, causing the motion tracker to miss these quick movements, so we were tasked to test the model on the continuous data to see if fast fish can be detected. A sample is shown in Figure 5. We processed the data on our Lambda server which took around 2-3 days for 30 days of data. We were able to run 4 instances that on average processed at speeds of around 140 FPS which is a total of 560 FPS. Since the videos were recorded at 10 FPS, each hour of continuous video can be processed in approximately 64 seconds. Initial testing showed that for the data collected between Aug. 15th to Sept 7th, the model counted 60% of the total expected counts, with an MOT count of 4,949 fish as opposed to the human counts of 8,239. To address the risk of non-detections for fish passing through the box in fewer than four frames we decreased the history threshold of the counting algorithm to one frame and counted 7,487 fish, much closer to the expected count.
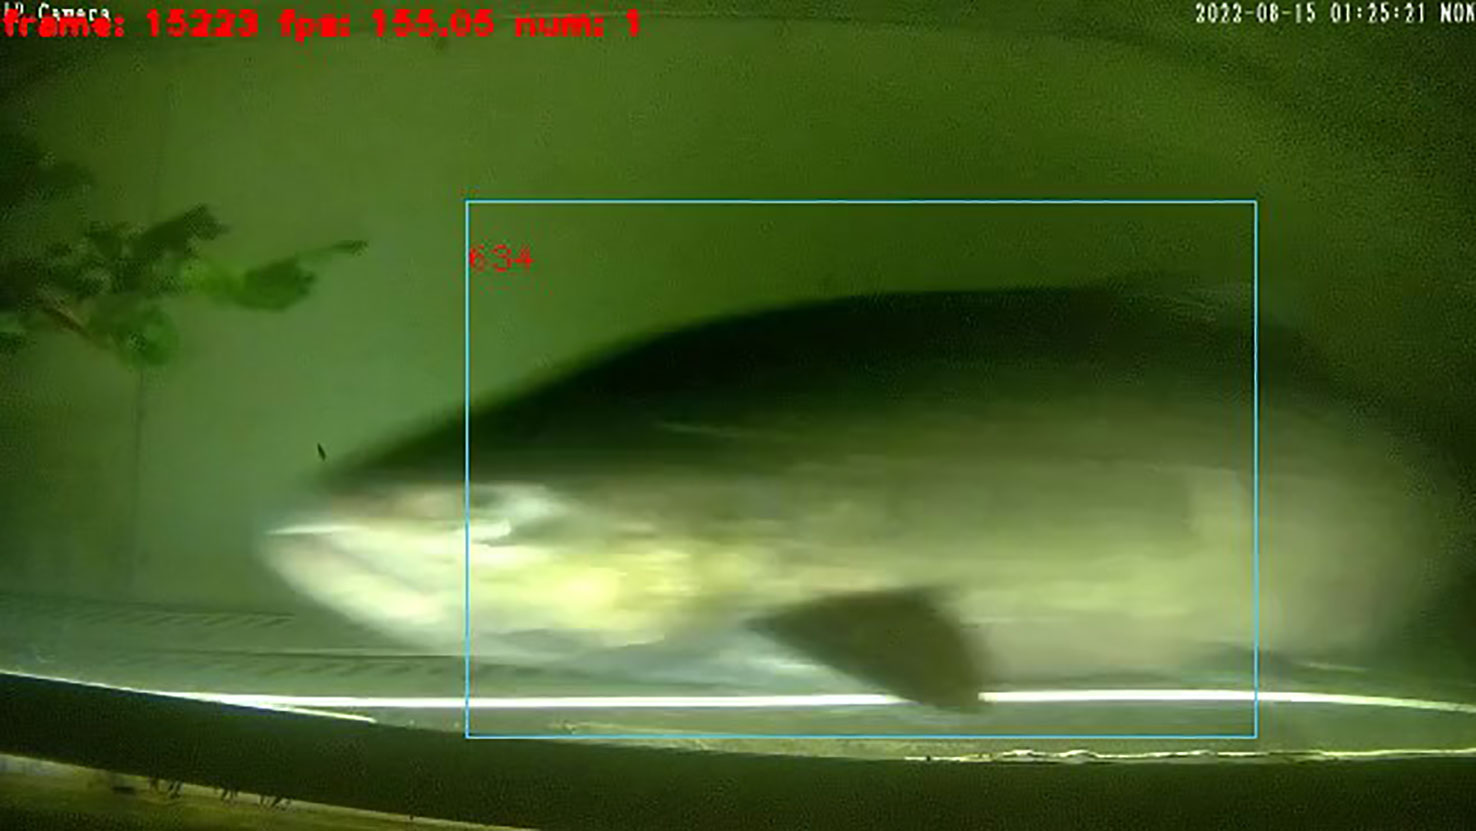
Figure 5 A screenshot of the MOT model being applied to a fast-swimming Chinook salmon in the Bear River during the 2022 season.
Data from the Coquitlam River was gathered using our Salmon Monitoring Prototype from May to October 2021, when the trap was shut down after the salmon migration season. A total of 6,000 and 16,000 motion detected side-view and overhead clips were gathered, respectively. The salmon species detector performed relatively poorly due to the new environment and setup of the Coquitlam Dam system. Cameras were mounted right next to the trap gate, meaning that fish passed very close to the camera when entering the trap. Accordingly, the entire length of the fish was never visible in any single frame. Many fish also came toward the camera, presenting a visual perspective that is extremely different than the annotated training data from the Kitwanga River. Regardless of the long-term utility of video monitoring at the Coquitlam dam, this simple and relatively cost-effective monitoring system can be built for less than $3,500 USD and has already been replicated for remote video monitoring applications in several locations in British Columbia (Figure 2).
4 Discussion
Computer-vision models hold promise for expedited delivery of video count data by automating enumeration and species identification. Preliminary training data annotation and model development have demonstrated the feasibility, challenges, and potential for automated counting in wild salmon monitoring. Computer-vision models trained on Kitwanga and Bear River data had a higher degree of success identifying and counting coho and sockeye salmon, likely due to their prevalence in the training data from both watersheds. The highest performing models consistently detected sockeye and coho salmon, two priority species for monitoring, in >90% of tests. By contrast pink and Chinook salmon were particularly challenging for the species detection models we evaluated, despite being common in both rivers’ datasets. Pink salmon exhibit extreme sexual dimorphism, with males developing large humps and hooked jaws during spawning season. These differences between male and female morphology likely pose unique challenges for automated detection unless accounted for in future training procedures and analysis. Chinook salmon have a higher degree of variability in their coloration, age, size, and secondary sexual characteristics and likely require larger quantities of training data to reach thresholds for reliable application in salmon population monitoring (>95%).
Results from early research and testing of computer-vision applied to video counting at salmon population monitoring weirs shows high potential for further development and application toward in-season monitoring. Model performance for counting and classification for two priority species (>90%) met or exceeded the performance of early-stage models developed by researchers working in both salmon-specific and other marine conservation contexts. Xu and Matzner (2018) gathered a dataset of salmon in various dams and trained a YOLOv3 model achieving a mAP score of 53.92%, though, salmon passed further from the camera in many instances, posing challenges for automated identification. Kay et al. (2022) achieved accuracy on par with human experts identifying and counting salmon from sonar videos, but model accuracy was challenged when applied in new environments with less available training data. Researchers working in benthic marine ecosystems used YOLOv2 to detect scallops using an Underwater Autonomous Vehicle (UAV) achieving an 85% mAP score (Rasmussen et al., 2017) with only a single target object (scallops) spread across a flat plane. Similarly, Tan et al. (2018) estimated lobster abundance by identifying their burrows, achieving 83% precision employing a similar multi-stage pipeline of object detection and tracking, however the task was made simpler by the mostly static backgrounds and only two detection targets (burrows and lobsters). These results and many other ongoing research and applied science initiatives continue to advance the field of computer-vision, building tools that can rapidly deliver high accuracy count data to inform conservation and management.
Ongoing challenges related to overlapping fish and rapid passage through the video box will require fine tuning the model parameters but in the near-term these issues can be readily overcome with manual checking and a larger training dataset. One potential solution to this issue is to lower the IOU threshold on an algorithm called non-max suppression (NMS) that is run after detection to remove closely overlapping bounding boxes. Lowering the threshold would allow for more overlapping boxes if they were detected, allowing the model to count overlapping fish more accurately. Naturally, as the model is trained longer and with more data with instances of overlapping fish, it will become better at detecting and counting these partially obstructed fish. However, new experiments are underway by our research team to evaluate the potential for an overhead camera to complement side view salmon imaging videos, and models leveraging both camera angles could be co-trained to produce accurate model results (Li et al., 2021).
Applying computer-vision counting models in novel environments without site-specific training data is a challenge and in the short-term will likely demand initial investments in training data annotation for new monitoring locations. Video trap and data recording equipment at the Bear River and Kitwanga were built using identical specifications and components, but differences in water clarity, fish coloration, morphology, and size distributions likely created subtle differences between the data being generated at the two sites. Models trained on Kitwanga data and tested on the Bear River test set had consistently poor performance but combining Kitwanga training data with Bear River data improved mAP scores. The amount of training data required for reliable species detection at a given location is likely influenced strongly by the number of species present and the degree of variability in the background environment, lighting, or water conditions. Data augmentation, which is standard in most models including YOLO, can help address some of these sources of variability, but having training data encompassing the full degree of conditions encountered in the field is better (Shorten and Khoshgoftaar, 2019). Other researchers have tested computer-vision models and found that models can correctly classify and count a single species of interest with only 6,080 annotated frames (Ditria et al., 2020), however more complex or diverse applications like salmon counting in the Kitwanga and Bear Rivers may require training data sets in excess of 500,000 for optimal performance. Ultimately, achieving mAP scores exceeding 0.90 for focal species will be required for widespread operational application of automated counting, a high but achievable bar for model performance.
Insights from other large-scale computer-vision deep learning projects can be used as benchmarks for datasets required to support object detection and MOT. COCO (Lin et al., 2015) and MOT16 (Milan et al., 2016) are two well-known benchmark datasets. COCO is a dataset of 91 classes with 2.5 million labels in over 328k images whereas MOT16 contains pedestrians throughout 10k frames with 250k labels overall. Research using these publicly available datasets shows with a lower number and complexity of target classes, less training data may be needed to achieve the desired level of performance. Improved model performance may also be achieved by tweaking hyperparameters (Wang et al., 2022a) such as learning rate, momentum, and epochs. Additional adjustments to data augmentation configurations and adding more training data, especially of under-represented classes, can improve deep learning models (Halevy et al., 2009; Sun et al., 2017) given the model is sufficiently complex (Nakkiran et al., 2021). Other techniques to tackle the imbalanced dataset include skipping frames to prevent overfitting (Du et al., 2021), oversampling under-represented species (Johnson and Khoshgoftaar, 2019), or weighing training loss toward lower number classes (Alaba et al., 2022a). Oversampling will randomly duplicate samples from under-represented species which could in turn introduce overfitting but increases the representation of rare species classes.
Tuning model parameters, training protocols and data libraries will require trial and error. Thus, future efforts to advance automated video counting for salmon escapement monitoring will require more training data and experimentation with model tuning. Improvements to our counting algorithm may also include application of line-of-interest based counting (Kocamaz et al., 2016; Kay et al., 2022; Zhao et al., 2016; Ma and Chan, 2013) which has previously been used in manual sonar fish counting (Key et al., 2016), as well as testing newer MOT models (Aharon et al., 2022; Wang et al., 2022b; Zhang et al., 2022) while simultaneously increasing the Bear River annotation dataset and adding data from new rivers to improve accuracy and generality.
Achieving our goal of conducting real-time automated analysis in remote riverine environments will pose new and important challenges. The Salmon Monitoring Prototype that was built and operated at Coquitlam dam is now being applied by Indigenous partners at several remote video monitoring locations, providing a template for practitioners looking to build and adapt computer-vision salmon monitoring systems of their own. To deal with data transfer and remote site monitoring issues we added an additional security camera and high-speed satellite internet from Starlink to access a data livestream of these sites in real-time (Ma et al., 2022). However, Starlink upload speeds continue to limit the rate of data delivery, creating a need for edge-computing compatible models and computer hardware capable of running these models in the field. Future research will evaluate edge-capable models that combine both species recognition and MOT, called multi-class multi-object trackers (MCMOT) (Lee et al., 2016; Du et al., 2021). These models have recently been developed and tested in some applications, but there is limited published research and code to inform their application. However, a series of code bases have implemented MCMOT which can inform future efforts to package these models for edge computing (Even, 2023).
Computer vision holds immense promise for more rapid and reliable data analysis in aquatic and terrestrial conservation applications (Weinstein, 2018). Recent advances in deep learning, motion tracking, and convolutional neural networks can serve as building blocks for these tools (Salman et al., 2020; Ditria et al., 2020; Kay et al., 2022). Automation can expedite analysis of video collected from monitoring efforts or fishing vessels and reduce the analytical burden on technicians to provide more rapid insights into fish abundance and species composition (Khokher et al., 2022; Ditria et al., 2020; Siddiqui et al., 2018), supporting improved conservation and fishery management outcomes (Schindler and Hilborn, 2015). Interdisciplinary research partnerships are essential for catalyzing development and deployment of technology in meeting global sustainability challenges (Allan et al., 2018).
Our interdisciplinary team, comprised of university-based computer science researchers, First Nations’ salmon stewardship practitioners, and conservation scientists, is uniquely positioned to bring computer vision tools to real-world applications in salmon conservation and management. While numerous researchers have documented the potential for automation to transform aquatic ecosystem and fishery monitoring, delivering these tools to practitioners will require a commitment to co-development and testing in real-world applications. Closing the loop between research, product testing, and real-world outcomes has never been more urgent, both for meeting the challenges posed by global environmental change, and for maintaining social license – support from society at large – for research and technology development. In a world where ecological dynamics are increasingly defined by uncertainty and change, delivering accurate real-time salmon count data can catalyze transformation toward more adaptive decision making that bolsters the resilience of salmon populations, ecosystems, and fisheries. Our findings highlight the potential for computer vision to advance greater sustainability in salmon fisheries, however further work will be needed to put these tools in the hands of conservation practitioners and fishery managers.
Data availability statement
The datasets used for this study can be found and accessed on the project GitHub page (https://github.com/Salmon-Computer-Vision/salmon-computer-vision).
Author contributions
WA led the project from conception, grant writing, to implementation and writing of the manuscript. SM led computer vision modeling, data training, model testing and writing of methods and results. YC worked on computer vision modeling. KC contributed to project conception, fundraising, and writing. DS and BN coordinated data annotation, developed data annotation protocols, trained other technicians in the task of annotating data, and contributed to manuscript writing. XM contributed to computer vision modeling and manuscript writing. MC and JD contributed data from the Kitwanga and Bear River weirs respectively and assisted with writing of the manuscript. JM contributed to the project concept and to manuscript writing. RS was an originally collaborator in fundraising and project concept development, he passed away before the project was completed. JL supervised graduate students who led computer vision modeling, contributed to the development and implementation of the project concept, and supported manuscript writing. All authors contributed to the article and approved the submitted version.
Funding
This project was supported in part by a Canada NSERC Discovery Grant (RGPIN-2019-04040) with primary funding from the British Columbia Salmon Restoration and Innovation Fund (No. 2019-045).
Acknowledgments
This project was supported in part by a Canada NSERC Discovery Grant (RGPIN-2019-04040) with primary funding from the British Columbia Salmon Restoration and Innovation Fund (No. 2019-045). Data was provided by the Gitanyow Fishery Authority, Skeena Fishery Commission and Fisheries and Oceans Canada. Additional thanks are due to Dean Miller who created the original designs for video and camera systems, Charmaine Carr-Harris and Aaron Foos from Fisheries and Oceans Canada (DFO) Stock Assessment Division, Scott Ducharme the DFO Community Salmon Advisor for the Lower Fraser River, and to the numerous lab technicians who worked on computer vision annotations for this project including Jake Giguere, and Jenna Travers. We would like to thank PSF staff who helped administer and coordinate this project, namely Kathleen Belton, Eileen Jones, and Tim Sucic. Finally, we would like to acknowledge the passing of our friend and collaborator Ryan Shea. Ryan was instrumental in developing the project concept and proposal for this work, and we hope to honour his memory by continuing to carry this work forward.
Conflict of interest
The authors declare that the research was conducted in the absence of any commercial or financial relationships that could be construed as a potential conflict of interest.
Publisher’s note
All claims expressed in this article are solely those of the authors and do not necessarily represent those of their affiliated organizations, or those of the publisher, the editors and the reviewers. Any product that may be evaluated in this article, or claim that may be made by its manufacturer, is not guaranteed or endorsed by the publisher.
References
Aharon N., Orfaig R., Bobrovsky B.-Z. (2022). BoT-SORT: robust associations multi-pedestrian tracking. arXiv 2206, 14651. doi: 10.48550/arXiv.2206.14651
Alaba S. Y., Nabi M. M., Shah C., Prior J., Campbell M. D., Wallace F., et al. (2022a). Class-aware fish species recognition using deep learning for an imbalanced dataset. Sensors 22 (21), 8268. doi: 10.3390/s22218268
Allan B. M., Nimmo D. G., Ierodiaconou D., VanDerWal J., Koh L. P., Ritchie E. G. (2018). Futurecasting ecological research: the rise of technoecology. Ecosphere 9 (5), e02163. doi: 10.1002/ecs2.2163
Atlas W. I., Ban N. C., Moore J. W., Tuohy A. M., Greening S., Reid A. J., et al. (2021a). Indigenous systems of management for culturally and ecologically resilient pacific salmon (Oncorhynchus spp.) fisheries. BioScience 71 (2), 186–204. doi: 10.1093/biosci/biaa144
Atlas W. I., Connors K., Honka L., Brown V., Greba L., Service C., et al. (2021b). A salmon monitoring & stewardship framework for British Columbia’s Central Coast. Vancouver, BC, Canada: Pacific Salmon Foundation.
Atlas W. I., Housty W. G., B´eliveau A., DeRoy B., Callegari G., Reid M., et al. (2017). Ancient fish weir technology for modern stewardship: lessons from community-based salmon monitoring. Ecosyst. Health Sustain. 3 (6), 1341284. doi: 10.1080/20964129.2017.1341284
Bochkovskiy A., Wang C.-Y., Liao H.-Y. M. (2020). YOLOv4: optimal speed and accuracy of object detection. arXiv 10934. doi: 10.48550/arXiv.2004.10934
Campbell S. K., Butler V. L. (2010). Archaeological evidence for resilience of pacific northwest salmon populations and the socioecological system over the last˜ 7,500 years. Ecol. Soc. 15 (1), 17. doi: 10.5751/es-03151-150117
Carothers C., Black J., Langdon S. J., Donkersloot R., Ringer D., Coleman J., et al. (2021). Indigenous peoples and salmon stewardship: a critical relationship. Ecol. Soc. 26 (1), 16. doi: 10.5751/ES-11972-260116
Connors B., Atlas W., Melymick C., Moody M., Moody J., Frid A. (2019). Conservation risk and uncertainty in recovery prospects for a collapsed and culturally important salmon population in a mixed-stock fishery. Mar. Coast. Fish. 11 (6), 423–436. doi: 10.1002/mcf2.10092
Di Lorenzo E., Mantua N. (2016). Multi-year persistence of the 2014/15 North Pacific marine heatwave. Nat. Climate Change 6 (11), 1042–1047. doi: 10.1038/nclimate3082
Ditria E. M., Lopez-Marcano S., Sievers M., Jinks E. L., Brown C. J., Connolly R. M. (2020). Automating the analysis of fish abundance using object detection: optimizing animal ecology with deep learning. Front. Mar. Sci. 7. doi: 10.3389/fmars.2020.00429
Dorner B., Catalano M. J., Peterman R. M. (2018). Spatial and temporal patterns of covariation in productivity of chinook salmon populations of the northeastern Pacific Ocean. Can. J. Fish. Aquat. Sci. 75 (7), 1082–1095. doi: 10.1139/cjfas-2017-0197
Du Y., Wan J., Zhao Y., Zhang B., Tong Z., Dong J. (2021). “GIAOTracker: A comprehensive framework for MCMOT with global information and optimizing strategies in VisDrone 2021,” in 2021 IEEE/CVF International Conference on Computer Vision Workshops (ICCVW), Montreal, BC. 2809–2819 (Canada Publisher: IEEE)ISBN: 9781665401913.
Earth Economics (2021). The sociocultural significance of pacific salmon to tribes and first nations (Vancouver, BC, Canada: Earth Economics Report to the Pacific Salmon Commission).
Even C. (2023) MCMOT: One-shot multi-class multi-object tracking [Python]. Available at: https://github.com/CaptainEven/MCMOT.
Farias F., Ludermir T., Bastos-Filho C. (2020). Similarity Based Stratified Splitting: an approach to train better classifiers. arXiv. doi: 10.48550/arXiv.2010.06099
Freshwater C., Holt K. R., Huang A.-M., Holt C. A. (2020). Benefits and limitations of increasing the stock-selectivity of pacific salmon fisheries. Fish. Res. 226, 105509. doi: 10.1016/j.fishres.2020.105509
Frölicher T. L., Laufkötter C. (2018). Emerging risks from marine heat waves. Nat. Commun. 9 (2018), 650. doi: 10.1038/s41467-018-03163-6
Gill A. A., Smith G. D., Bagnall A. J. (2004). “Improving Decision Tree Performance Through Induction- and Cluster-Based Stratified Sampling,” in Intelligent Data Engineering and Automated Learning – IDEAL 2004, Lecture Notes in Computer Science. Eds. Yang Z. R., Yin H., Everson R. M. (Berlin, Heidelberg: Springer), 339–344.
Gottesfeld A. S., Barnes C., Soto C., Barnes C., Soto C. (2009). Case history of the Skeena fisheries Commission: developing aboriginal fishery management capacity in northern British Columbia. Am. Fish. Soc. Symp. 70, 921–939.
Halevy A., Norvig P., Pereira F. (2009). The unreasonable effectiveness of data. IEEE Intell. Syst. 24 (2), 8–12. doi: 10.1109/MIS.2009.36
Jocher G., Chaurasia A., Stoken A., Borovec J., Kwon Y., Michael K., et al. (2022). ultralytics/yolov5: v7.0 - YOLOv5 SOTA Realtime Instance Segmentation. Available at: https://zenodo.org/record/7347926.
Johnson J. M., Khoshgoftaar T. M. (2019). Survey on deep learning with class imbalance. J. Big Data 6 (1), 27. doi: 10.1186/s40537-019-0192-5
Kay J., Kulits P., Stathatos S., Deng S., Young E., Beery S., et al. (2022). The Caltech fish counting dataset: A benchmark for multiple-object tracking and counting. arXiv preprint 2207, 09295. doi: 10.1007/978-3-031-20074-8_17
Key B., Miller J., Fleischman S. (2016). Operational Plan: Kenai River Chinook salmon sonar assessment at river mile 13.7, 2015. Alaska Department of Fish and Game, Regional Operational Plan ROP.SF.2A.2015.18, Anchorage.
Khokher M. R., Little L. R., Tuck G. N., Smith D. V., Qiao M., Devine C., et al. (2022). Early lessons in deploying cameras and artificial intelligence technology for fisheries catch monitoring: where machine learning meets commercial fishing. 266(July 2021), 257–266. doi: 10.1139/cjfas-2020-0446
Kilduff D. P., Di Lorenzo E., Botsford L. W., Teo S. L. (2015). Changing central pacific El nin˜os reduce stability of North American salmon survival rates. Proc. Natl. Acad. Sci. 112 (35), 10962–10966. doi: 10.1073/pnas.1503190112
Knapp G., Guettabi M., Goldsmith O. S. (2013). The Economic Importance of the Bristol Bay Salmon Industry (Anchorage, AK, USA: Institute of social and Economic Research, University of Alaska Anchorage).
Kocamaz M. K., Gong J., Pires B. R. (2016). “Vision-based counting of pedestrians and cyclists,” in 2016 Institute of Electrical and Electronics Engineers (IEEE) Winter Conference on Applications of Computer Vision (WACV), 1–8.
Kogan F., Guo W. (2015). 2006–2015 mega-drought in the western USA and its monitoring from space data. Geomatics Natural Hazards Risk 6 (8), 651–668. doi: 10.1080/19475705.2015.1079265
Lee B., Erdenee E., Jin S., Nam M. Y., Jung Y. G., Rhee P. K. (2016). “Multi-class Multi-object Tracking Using Changing Point Detection,” in Computer Vision – ECCV 2016 Workshops, Lecture Notes in Computer Scienc. Eds. Hua G., J´egou H. (Cham: Springer International Publishing), 68–83.
Li D., Jiang T., Jiang M. (2021). Unified quality assessment of in-the-wild videos with mixed datasets training. Int. J. Comput. Sci. 129, 1238–1257. doi: 10.1007/s11263-020-01408-w
Li C., Li L., Jiang H., Weng K., Geng Y., Li L., et al. (2022). YOLOv6: A single-stage object detection framework for industrial applications. arXiv 2209, 02976. doi:?10.48550/arXiv.2209.02976
Lin T.-Y., Maire M., Belongie S., Bourdev L., Girshick R., Hays J., et al. (2015). Microsoft COCO: common objects in context. arXiv 1405, 0312. doi: 10.48550/arXiv.1405.0312
Ma Z., Chan A. B. (2013) in 2013 IEEE Conference on Computer Vision and Pattern Recognition. 2539–2546 (Portland, OR, USA: IEEE).
Ma S., Chou Y. C., Zhao H., Chen L., Ma X., Liu J. (2022). Network characteristics of LEO satellite constellations: A starlink-based measurement from end users. arXiv 2212, 13697. doi: 10.48550/arXiv.2212.13697
May R. J., Maier H. R., Dandy G. C. (2010). Data splitting for artificial neural networks using SOM-based stratified sampling. Neural Networks 23 (2), 283–294. doi: 10.1016/j.neunet.2009.11.009
Milan A., Leal-Taixe L., Reid I., Roth S., Schindler K. (2016). MOT16: A?Benchmark for multi-object tracking. arXiv 1603, 00831. doi: 10.48550/arXiv.1603.00831
Moore J. W., Connors B. M., Hodgson E. E. (2021). Conservation risks and portfolio effects in mixed-stock fisheries. Fish Fisheries 22 (5), 1024–1040. doi: 10.1111/faf.12567
Nakhshina M. (2012). Without fish, there would be nothing here’: attitudes to salmon and identification with place in a Russian coastal village. J. Rural Stud. 28 (2), 130–138. doi: 10.1016/j.jrurstud.2012.01.014
NakkIran P., Kaplun G., Bansal Y., Yang T., Barak B., Sutskever I. (2021). Deep double descent: where bigger models and more data hurt*. J. Stat. Mechanics: Theory Experiment 2021 (12), 124003. doi: 10.1088/1742-5468/ac3a74
Price M. H., English K. K., Rosenberger A. G., Macduffee M., Reynolds J. D. (2017). Canada’s wild salmon policy: An assessment of conservation progress in British Columbia. Can. J. Fish. Aquat. Sci. 74 (10), 1507–1518. doi: 10.1139/cjfas-2017-0127
PSC CTC Pacific Salmon Commission Chinook Technical Committee (2021). 2019?Exploitation rate analysis and model calibration (Vancouver, BC, Canada: Technical report).
Rasmussen C., Zhao J., Ferraro D., Trembanis A. (2017) in 2017 IEEE International Conference on Computer Vision Workshops (ICCVW). 2865–2873 (Venice, Italy: IEEE).
Salman A., Siddiqui S. A., Shafait F., Mian A., Shortis M. R., Khurshid K., et al. (2020). Automatic fish detection in underwater videos by a deep neural network-based hybrid motion learning system. ICES J. Mar. Sci. 77 (4), 1295–1307. doi: 10.1093/icesjms/fsz025
Satterthwaite W. H., Carlson S. M. (2015). Weakening portfolio effect strength in a hatchery-supplemented chinook salmon population complex. Can. J. Fish. Aquat. Sci. 72 (12), 1860–1875. doi: 10.1139/cjfas-2015-0169
Scheuerman M. K., Hanna A., Denton E. (2021). Do datasets have politics? Disciplinary values in computer vision dataset development. Proc. ACM Human-Computer Interaction 5 (CSCW2), 1–37. doi: 10.1145/3476058
Schindler D. E., Hilborn R. (2015). Prediction, precaution, and policy under global change. Science 347 (6225), 953–954. doi: 10.1126/science.1261824
Schuster R. C., Wein E. E., Dickson C., Chan H. M. (2011). Importance of traditional foods for the food security of two first nations communities in the yukon, Canada. Int. J. circumpolar Health 70 (3), 286–300. doi: 10.3402/ijch.v70i3.17833
Sekachev B., Manovich N., Zhiltsov M., Zhavoronkov A., Kalinin D., Hoff B., et al. (2020). opencv/cvat: v1.1.0. Available at: https://zenodo.org/record/4009388.
Shorten C., Khoshgoftaar T. M. (2019). A survey on image data augmentation for deep learning. J. Big Data 6 (1), 60. doi: 10.1186/s40537-019-0197-0
Siddiqui S. A., Salman A., Malik M. I., Shafait F., Mian A., Shortis M. R., et al. (2018). Automatic fish species classification in underwater videos: Exploiting pre-trained deep neural network models to compensate for limited labelled data. ICES J. Mar. Sci. 75 (1), 374–389. doi: 10.1093/icesjms/fsx109
Stone P., Brooks R., Brynjolfsson E., Calo R., Etzioni O., Hager G., et al. (2016). Artificial intelligence and life in 2030. In One hundred year study on artificial intelligence: Report of the 2015-2016 study panel. Stanford University, Stanford, CA, September 2016. Available at: http://ai100.stanford.edu/2016-report. (Accessed February 6, 2023).
Sun C., Shrivastava A., Singh S., Gupta A. (2017). Revisiting unreasonable effectiveness of data in deep learning era. IEEE International Conference on Computer Vision (ICCV), Venice, Italy, pp. 843–852. doi: 10.1109/ICCV.2017.97
Sung K.-K., Poggio T. (1998). Example-based learning for view-based human face detection. IEEE Trans. Pattern Anal. Mach. Intell. 20 (1), 39–51. doi: 10.1109/34.655648
Swezey S., Heizer R. (1977). Ritual management of salmonid fish resources in California. J. California Anthropol. 4 (1), 6–29.
Tan C. S., Lau P. Y., Correia P. L., Campos A. (2018). Automatic analysis of deep-water remotely operated vehicle footage for estimation of Norway lobster abundance. Front. Inf. Technol. Electronic Eng. 19 (8), 1042–1055. doi: 10.1631/FITEE.1700720
Tuohy A. M., Skalski J. R., Jorgenson A. T. (2020). Modified commercial fish trap to help eliminate salmonid bycatch mortality. North Am. J. Fish. Manage. 40 (5), 1239–1251. doi: 10.1002/nafm.10496
Wang C.-Y., Bochkovskiy A., Liao H.-Y. M. (2022a). YOLOv7: Trainable bag-of-freebies sets new state-of-the-art for real-time object detectors. arXiv 2207, 02696. doi: 10.48550/arXiv.2207.02696
Wang Y.-H., Hsieh J.-W., Chen P.-Y., Chang M.-C. (2022b). SMILEtrack: siMIlarity LEarning for multiple object tracking. arXiv 2211, 08824. doi: 10.48550/arXiv.2211.08824
Wang Z., Zheng L., Liu Y., Li Y., Wang S. (2020). Towards real-time multi-object tracking. arXiv 1909, 12605. doi: 10.1007/978-3-030-58621-8_7
Waples R. S., Pess G. R., Beechie T. (2008). Evolution history of Pacific salmon in dynamic environments. Evol. Appl. 1, 189–206. doi: 10.1111/j.1752-4571.2008.00023.x
Weinstein B. G. (2018). A computer vision for animal ecology. J. Anim. Ecol. 87 (3), 533–545. doi: 10.1111/1365-2656.12780
Xu W., Matzner S. (2018). “Underwater fish detection using deep learning for water power applications,” in International Conference on Computational Science and Computational Intelligence (CSCI), Las Vegas, NV, USA. 313–318. doi: 10.1109/CSCI46756.2018.00067
Yoshiyama R. M. (1999). A history of salmon and people in the Central Valley region of California. Rev. Fish. Sci. 7 (3&4), 197–239. doi: 10.1080/10641269908951361
Zhang Y., Sun P., Jiang Y., Yu D., Weng F., Yuan Z., et al. (2022). ByteTrack: multi-object tracking by associating every detection box. arXiv. doi: 10.1007/978-3-031-20047-2_1
Keywords: computer vision, deep learning, fisheries management, in-season fishery management, indigenous science, wild salmon
Citation: Atlas WI, Ma S, Chou YC, Connors K, Scurfield D, Nam B, Ma X, Cleveland M, Doire J, Moore JW, Shea R and Liu J (2023) Wild salmon enumeration and monitoring using deep learning empowered detection and tracking. Front. Mar. Sci. 10:1200408. doi: 10.3389/fmars.2023.1200408
Received: 04 April 2023; Accepted: 14 August 2023;
Published: 20 September 2023.
Edited by:
Emma Cotter, Pacific Northwest National Laboratory (DOE), United StatesReviewed by:
Matteo Zucchetta, Consiglio Nazionale delle Ricerche (CNR), ItalyDuane Edgington, Monterey Bay Aquarium Research Institute (MBARI), United States
Copyright © 2023 Atlas, Ma, Chou, Connors, Scurfield, Nam, Ma, Cleveland, Doire, Moore, Shea and Liu. This is an open-access article distributed under the terms of the Creative Commons Attribution License (CC BY). The use, distribution or reproduction in other forums is permitted, provided the original author(s) and the copyright owner(s) are credited and that the original publication in this journal is cited, in accordance with accepted academic practice. No use, distribution or reproduction is permitted which does not comply with these terms.
*Correspondence: William I. Atlas, d2F0bGFzQHdpbGRzYWxtb25jZW50ZXIub3Jn
†These authors share first authorship