 Xiuyi Zhao1†
 Rongxiang Tian
 Wuhu Feng
- 1School of Earth Sciences, Zhejiang University, Hangzhou, China
- 2National Centre for Atmospheric Science, School of Earth and Environment, University of Leeds, Leeds, United Kingdom
Phosphorus is an important nutrient for the growth of marine organisms. External inputs of phosphorus can lead to changes in the primary productivity and may trigger harmful algal blooms. However, few studies have focused on the atmospheric transport of phosphorus to the ocean. We measured the oxygen isotopes in phosphate (δ18Op) and quantitatively determined the contribution of phosphate from atmosphere sources using seawater samples from the East China Sea, a two-component mixing model and a Bayesian isotope mixing model. Our results showed that the δ18Op value retains the signal of the original source and can be used to trace the source of phosphate. The main sources of phosphate in the northeastern East China Sea were from atmospheric inputs, with the contribution of terrigenous phosphate accounting for 56 – 78% of the total. Our findings highlight the importance of the atmospheric transport of phosphate to the ocean, which is important for exploring the mechanisms of harmful algal blooms and in disaster prevention and mitigation.
1 Introduction
The East China Sea (ECS), an area rich in marine resources, is the main fishing ground of China. However, this region is affected by the frequent occurrence of harmful algal blooms, which not only pose a huge threat to marine organisms, especially those living in coastal aquaculture areas, but also cause huge economic losses and even endanger human health. Phosphorus both affects the primary productivity and participates in biochemical processes. The ECS is a phosphorus-restricted area (Liu et al., 2003; Huang et al., 2019) and the input of phosphorus into the ocean in this region will intensify eutrophication, leading to harmful algal blooms. Previous research on phosphorus has focused on its effects on phytoplankton growth (Li et al., 2007; Zhou et al., 2022) and there have been few analyses of the different sources of phosphorus in the ECS, although these are important in exploring the mechanism of harmful algal blooms. Research on the source of the phosphorus in the ESC have mainly focused on rivers (Wang et al., 2017), sea–sediment exchange and adjacent sea areas (Chen and Wang, 1999; Wang et al., 2018), with few studies of the atmospheric inputs.
The input of phosphate from the atmosphere accounts for a significant part of primary production during spring and summer (Markaki et al., 2003; Izquierdo et al., 2012) and has an important impact on the growth and composition of phytoplankton in coastal waters (Ridame and Guieu, 2002; Tian et al., 2018). Phosphate reacts with acidic gases during transport in the atmosphere, which increases the rate at which it is converted into soluble forms that can be absorbed by marine organisms. This increases the rate of transport of bioavailable phosphorus (phosphate) to the ocean, where it increases the primary productivity (Tipping et al., 2014; Myriokefalitakis et al., 2016). Studies on the atmospheric sources of phosphorus have mainly focused solely on the atmosphere (Zhang et al., 2007; Chen and Chen, 2008) and few reports have considered the amount of atmospheric phosphorus in seawater in the ECS.
The source of phosphorus in water and its biogeochemical cycle have been studied using stable isotopes. Phosphorus has only one stable isotope (31P), which is difficult to work with, but each phosphorus atom in the phosphate group is closely bound to four oxygen atoms (Elsbury et al., 2009; Young et al., 2009). The exchange of oxygen isotopes between phosphate and water in ecosystems can be ignored without biological mediation (Lecuyer et al., 1996; Blake et al., 1997; Paytan and McLaughlin, 2011) and the oxygen isotope of phosphate (δ18Op) can used to reflect the isotopic composition of the phosphate source and to trace the source of phosphate in water samples (McLaughlin et al., 2004). δ18Op is a relatively stable and reliable tool, but there have been few systematic studies of δ18Op in the waters of ECS, and δ18Op has seldom been used to systematically analyze the source of phosphate in the ECS.
We used δ18Op to analyze the potential sources of phosphate in the ESC and quantified the contribution of different sources to this phosphate via modeling. These results will assist in understanding the mechanism of harmful algal blooms in the phosphorus-restricted ECS and may be helpful in the control of harmful algal blooms.
2 Materials and methods
2.1 Sample collection and analysis
The National Natural Science Foundation of China carried out a scientific investigation as part of the shared spring voyage of the research ship Xiangyanghong 18 in the ECS in May 2020 (Figure 1). The main sources of phosphate were determined in the area (120.93–125.9°C E, 26.08–32.35°C N). Salinity and temperature were recorded using a Sea-Bird Scientific 911 CTD (conductivity–temperature–depth) and surface seawater samples were collected at 49 stations.
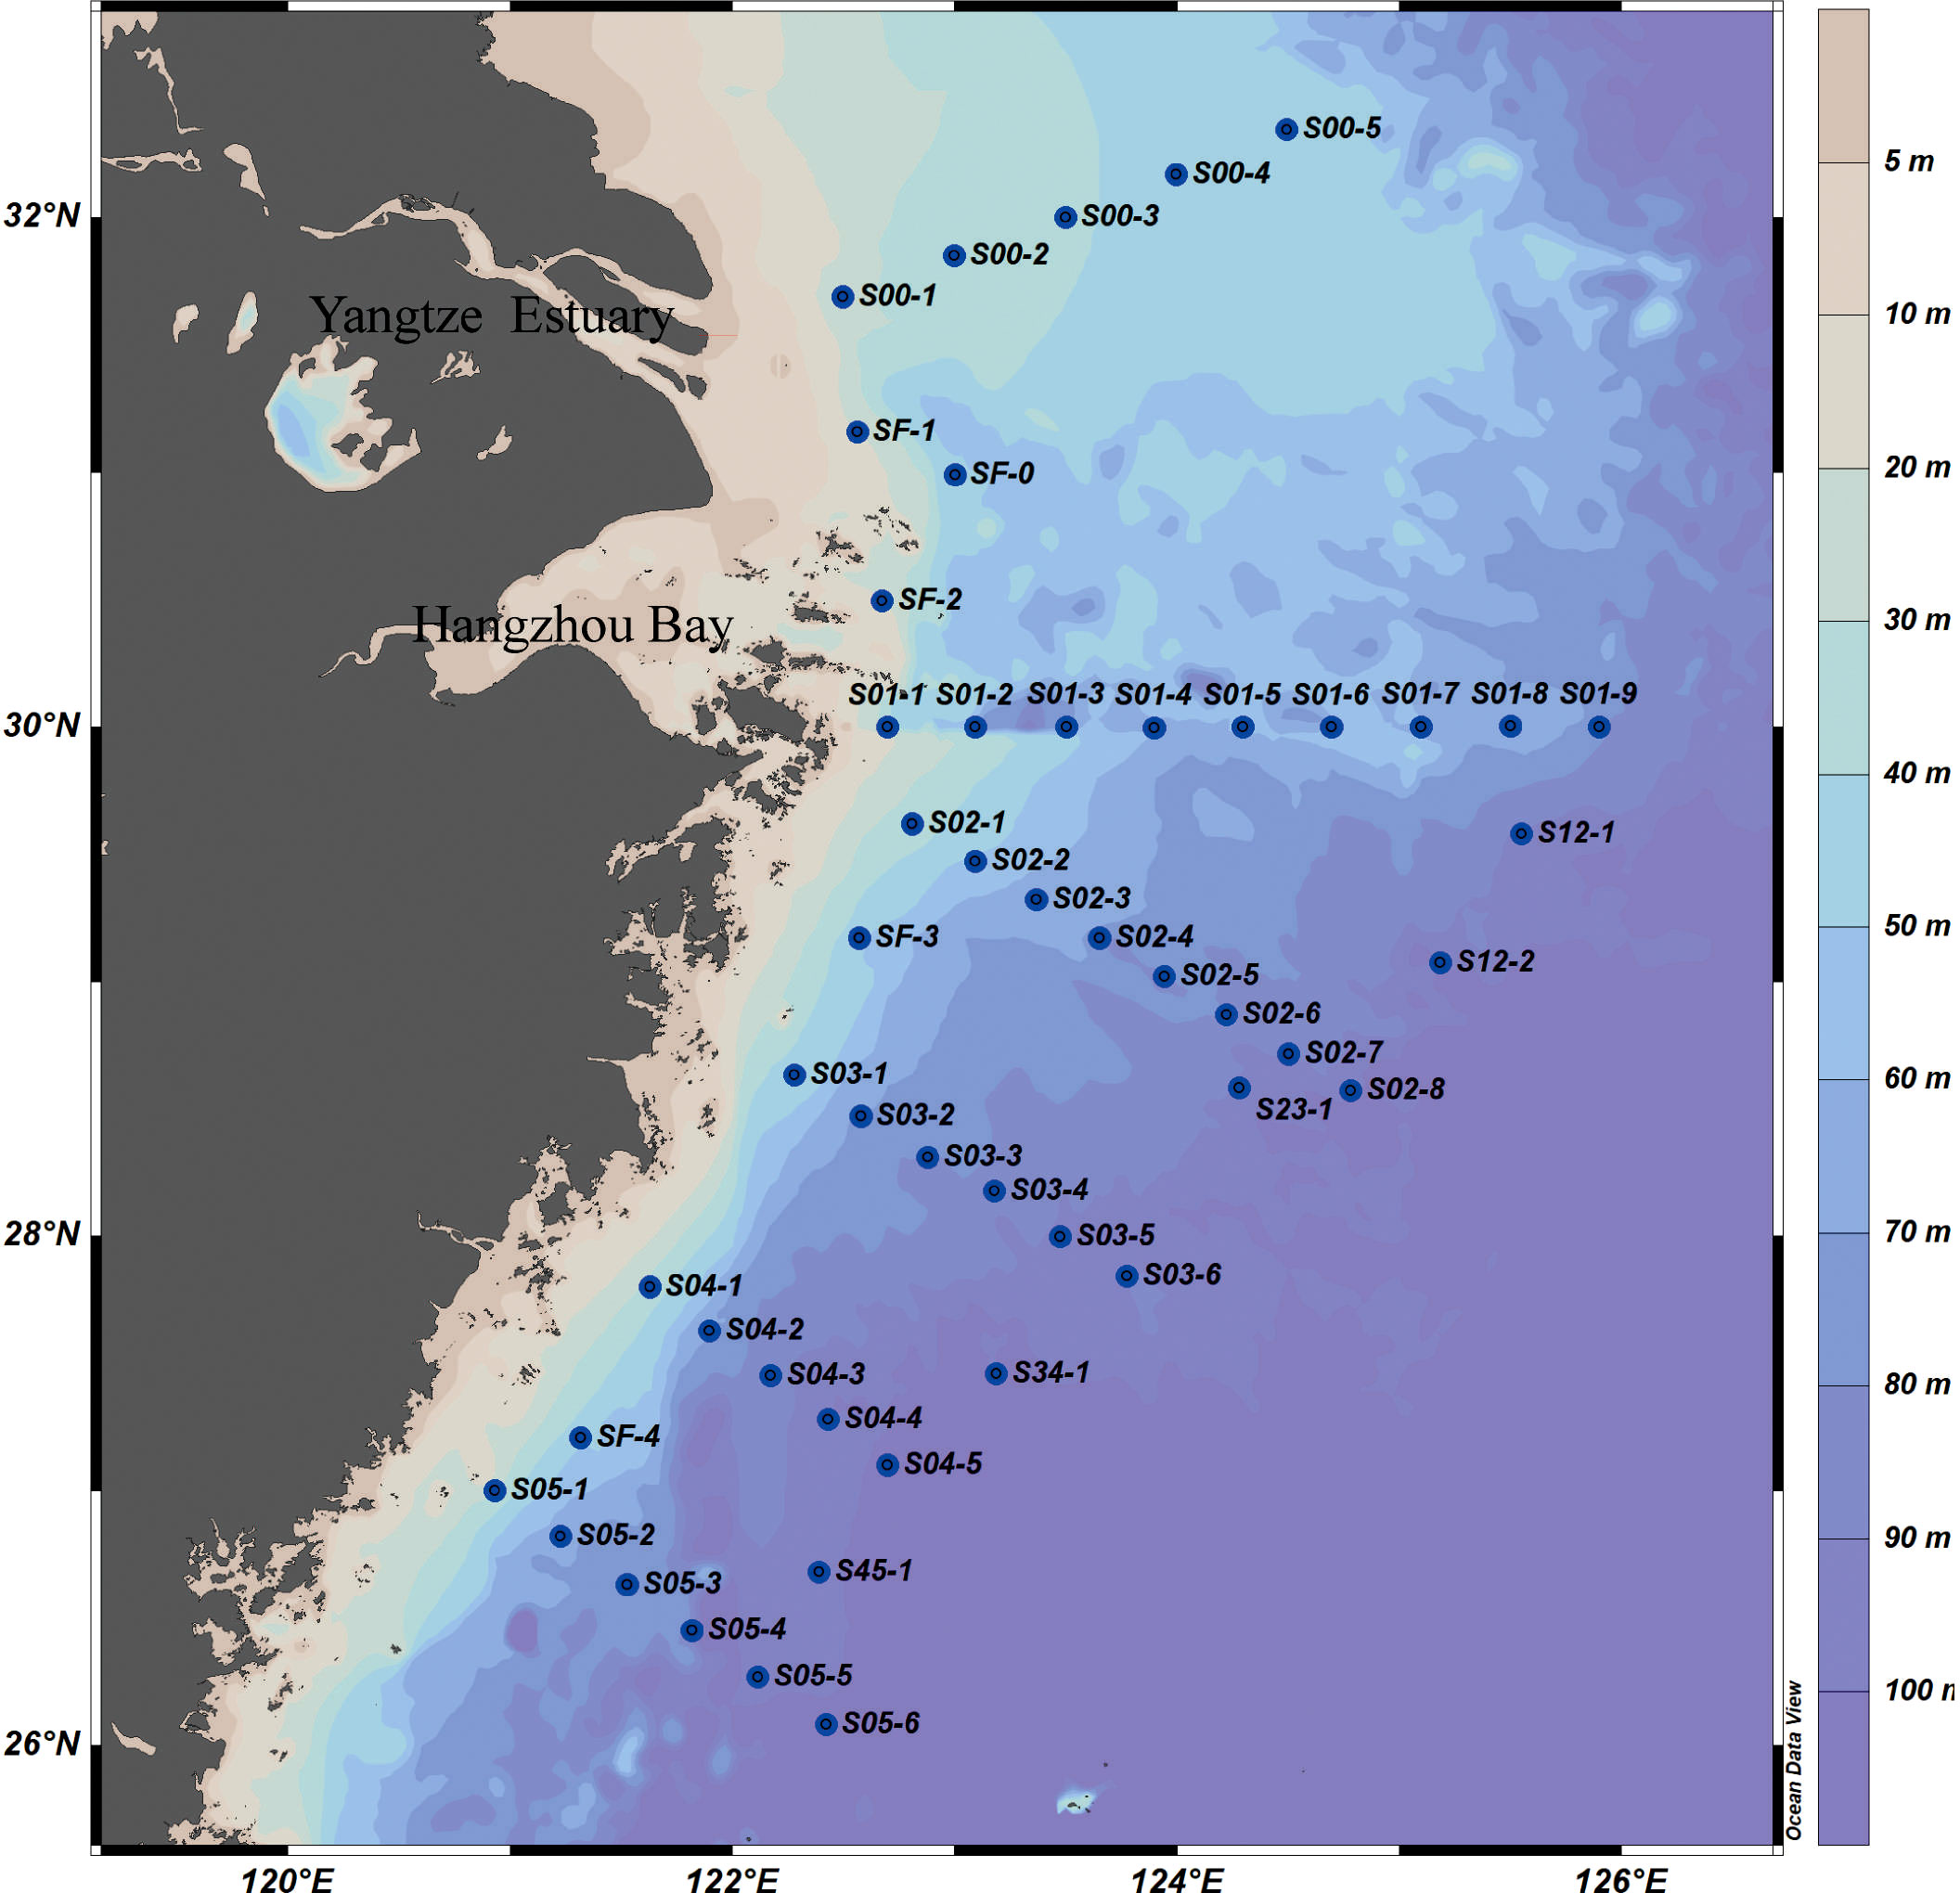
Figure 1 Sampling roadmap for the East China Sea, May 18–28, 2020. The dots are sampling sites, the numbers are their serial numbers.
Magnesium-induced coprecipitation (Karl and Tien, 1992; Thomson-Bulldis and Karl, 1998) was used to enrich the dissolved inorganic phosphorus in the seawater samples before extraction using the method of Tcaci et al. (2019). About 0.5 mg of the resultant Ag3PO4 was weighed, packed into a silver cup, compressed to remove any gases and then placed in an autosampler. The δ18Op of the sample was determined using a Thermo Scientific FlashEA 1112 HT Elemental Analyzer combined with a Thermo Scientific MAT 253 isotope ratio mass spectrometer (with a precision of ± 0.2%) and repeated at 10-sample intervals. A standard silver phosphate sample was analyzed for calibration after every ten samples to ensure the accuracy and stability of the measurement results. The original phosphate oxygen isotope values were calculated using Isodat software and corrected with standard silver phosphate (Figure 2). We drew a map of the surface water currents in the ECS during the survey from May 12 to 31, 2020 using data from https://search.earthdata.nasa.gov.
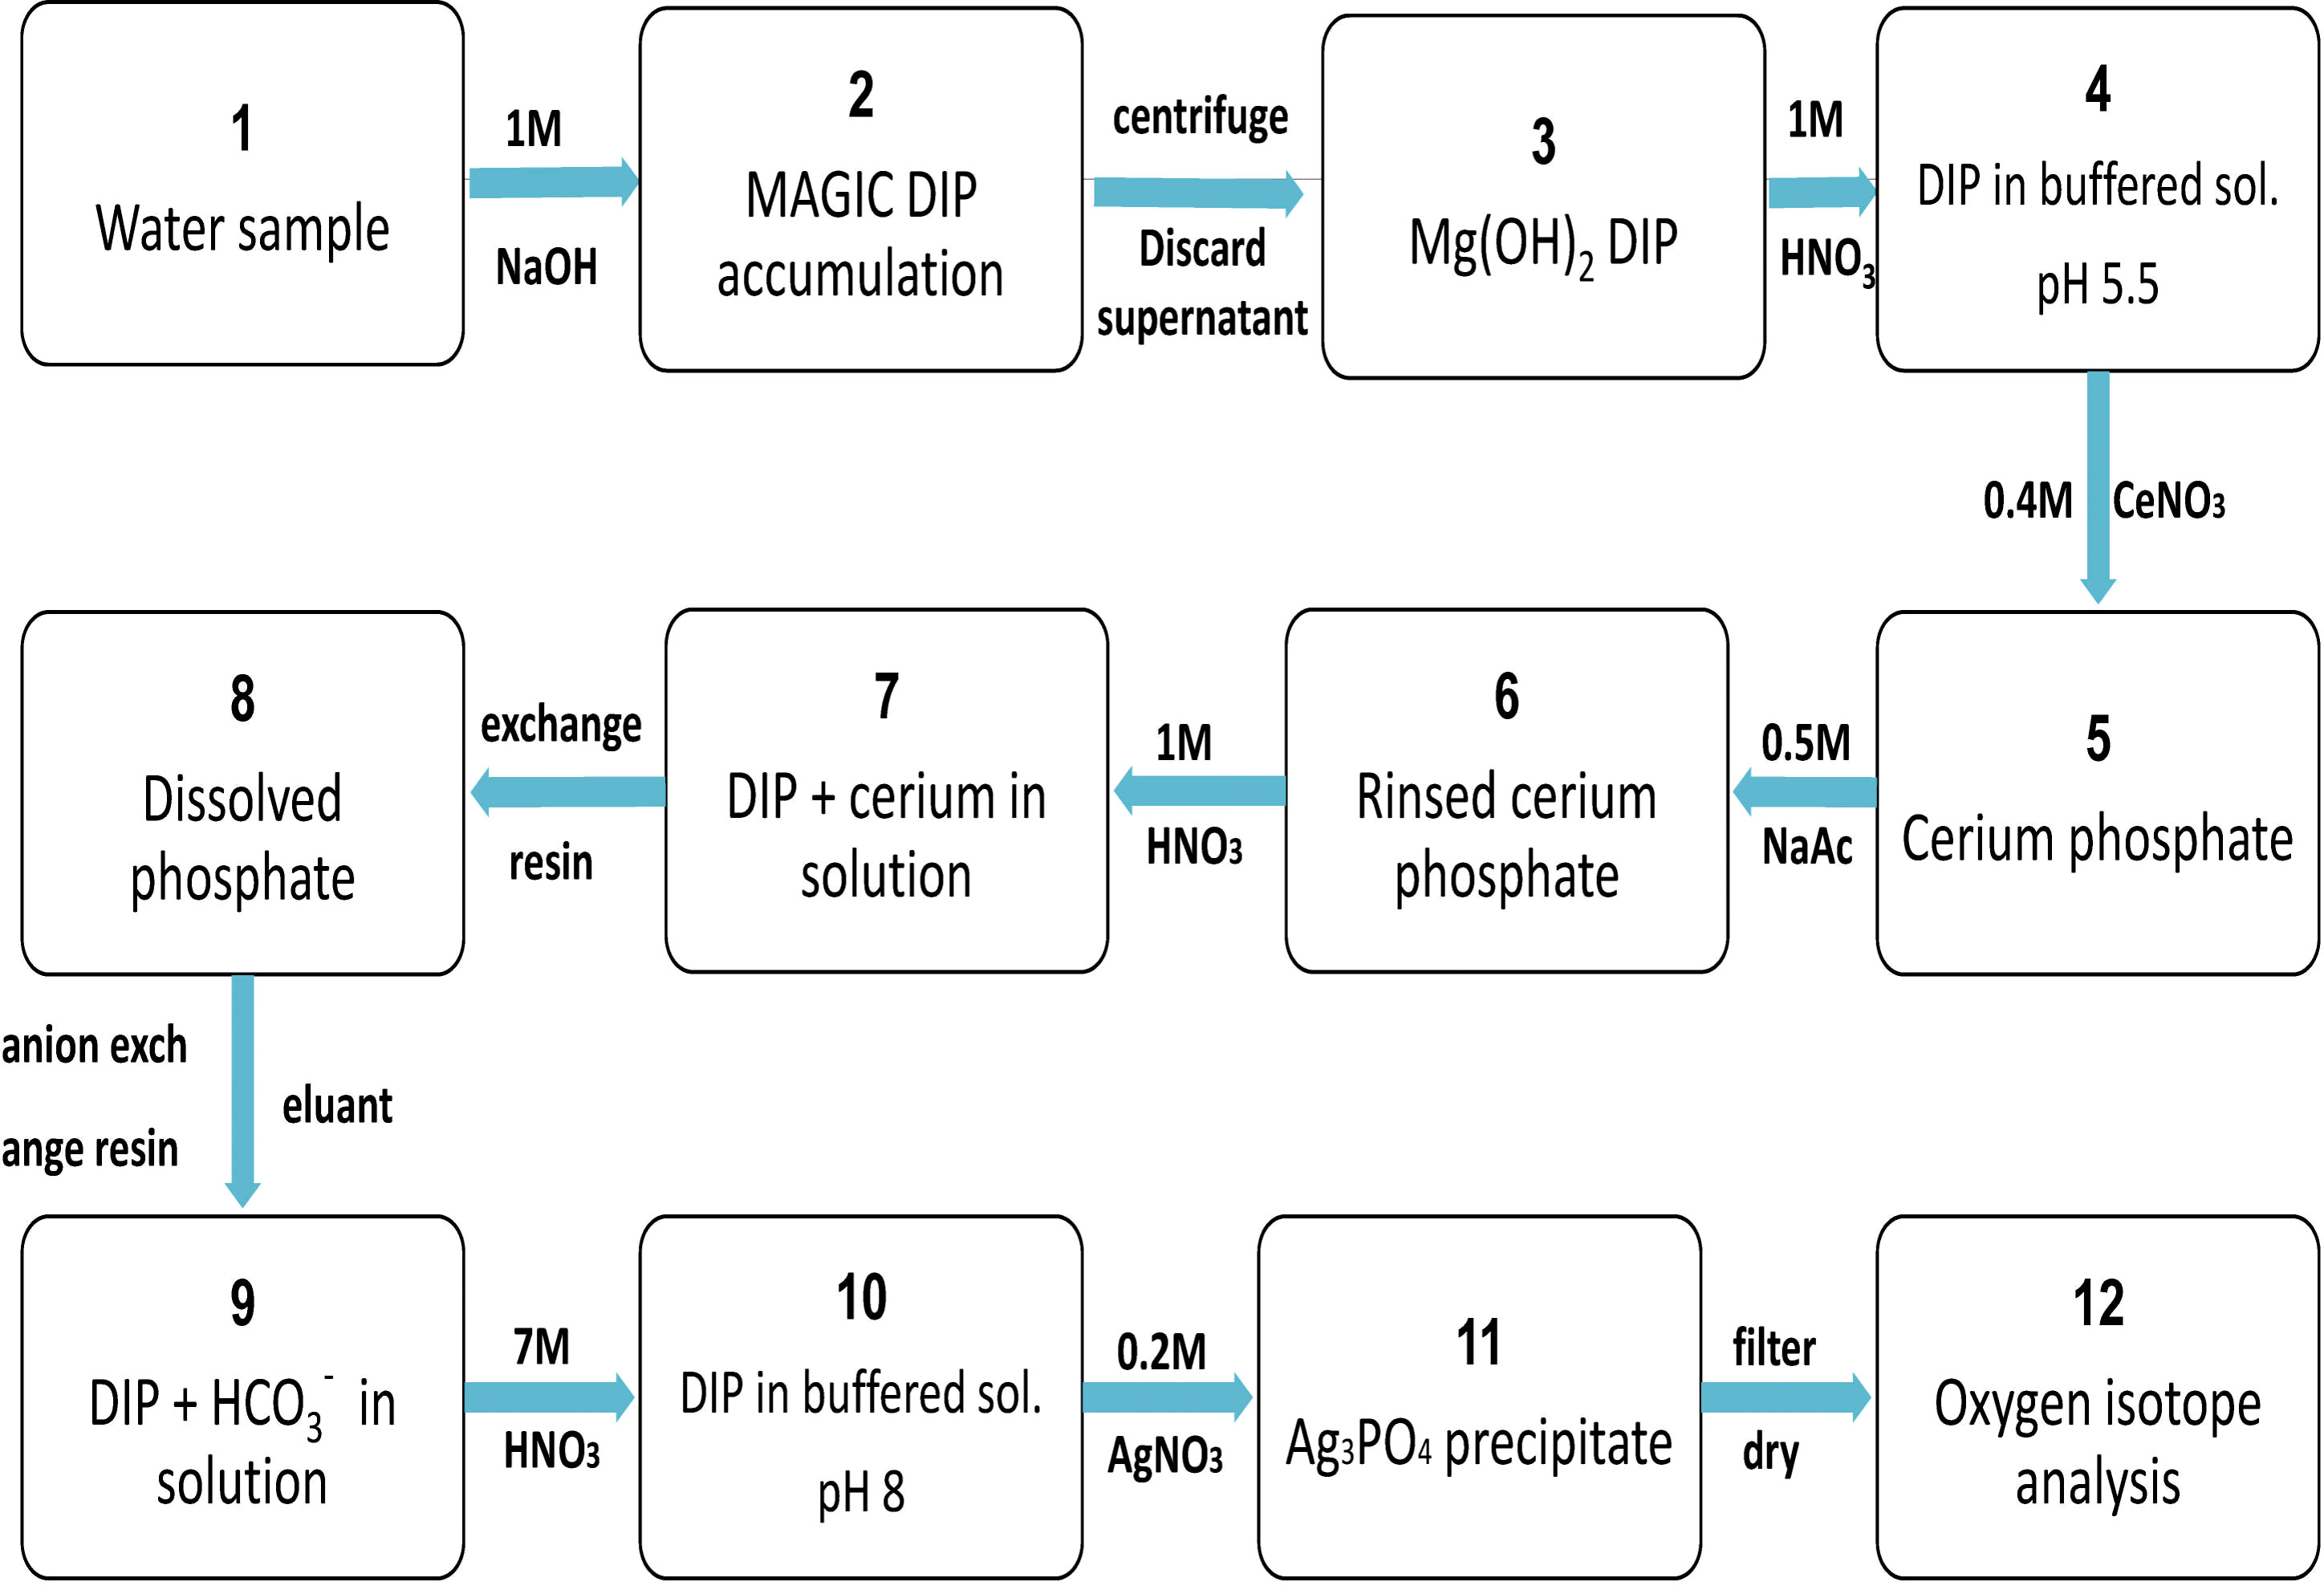
Figure 2 Flow chart for enrichment and extraction of dissolved inorganic phosphorus in seawater. DIP, dissolved inorganic phosphate; MAGIC, Magnesium-induced coprecipitation.
2.2 Data analysis
2.2.1 Two-component mixing model
The δ18Op values in seawater are affected by the mixing of water masses with different phosphate concentrations. McLaughlin et al. (2006) introduced a two-component mixing model for the analysis of water masses that control phosphate concentrations to calculate the δ18Op mixing value:
where and are the proportions of freshwater and seawater, respectively; and are the salinity of these two sources; is the salinity of the research station; and are the phosphate concentrations of the two sources; and are their δ18Op values; and is the calculated δ18Op value of the mixed sample.
If the phosphate is fully utilized by living organisms, then δ18Op reaches the theoretical equilibrium value, which can be calculated as (McLaughlin et al., 2006):
where δ18Ope is the theoretical equilibrium value, S is the salinity of the research station and T is the temperature of the research station.
Assuming that the phosphate in the research area is controlled only by water mixing from the selected two sources, then the measured δ18Op value should be distributed along the end-member mixing line. If the biological cycle of phosphate is completely involved, then δ18Op value should be distributed near the theoretical equilibrium line. The input of other potential phosphate sources can cause significant deviations from the mixing and equilibrium lines (Ayliffe et al., 1992; Young et al., 2009). Values below the mixing and equilibrium line indicate the presence of a phosphate source with a lower δ18Op value, whereas values above the mixing and equilibrium line indicate the presence of a phosphate source with a higher δ18Op value, and values are between the two lines indicate the existence of inadequate phosphate cycling. The deviation of the δ18Op value from the theoretical equilibrium line is used to determine the bioutilization of phosphate. If phosphate is not fully utilized by organisms, then the δ18Op value will deviate from the theoretical equilibrium line and the δ18Op value will reflect the characteristics of the source region. By contrast, if the δ18Op is close to the theoretical equilibrium line, then this indicates that phosphate has been fully utilized by marine organisms.
2.2.2 Bayesian isotope mixing model
We selected a Bayesian isotope mixing model run in the R software package (Stable Isotope Analysis in R, SIAR) to quantify the source of phosphate in the sea (Parnell et al., 2010; Parnell et al., 2013). We assumed that there were two sources of phosphate: terrestrial (atmospheric input and diluted water from the Yangtze River) and seawater. We selected three stations that were terrestrial sources with a low salinity (S00-1, S00-2 and SF-1) (Figure 3), through which diluted water from the Yangtze River flowed, then we calculated their mean and standard deviation of δ18Op values. For the seawater source, three stations (S04-4, S05-4 and S05-6) with high salinity in the path of the Taiwan warm current were selected to represent seawater sources of phosphate. The SIAR model was expressed as follows (Parnell et al., 2010):
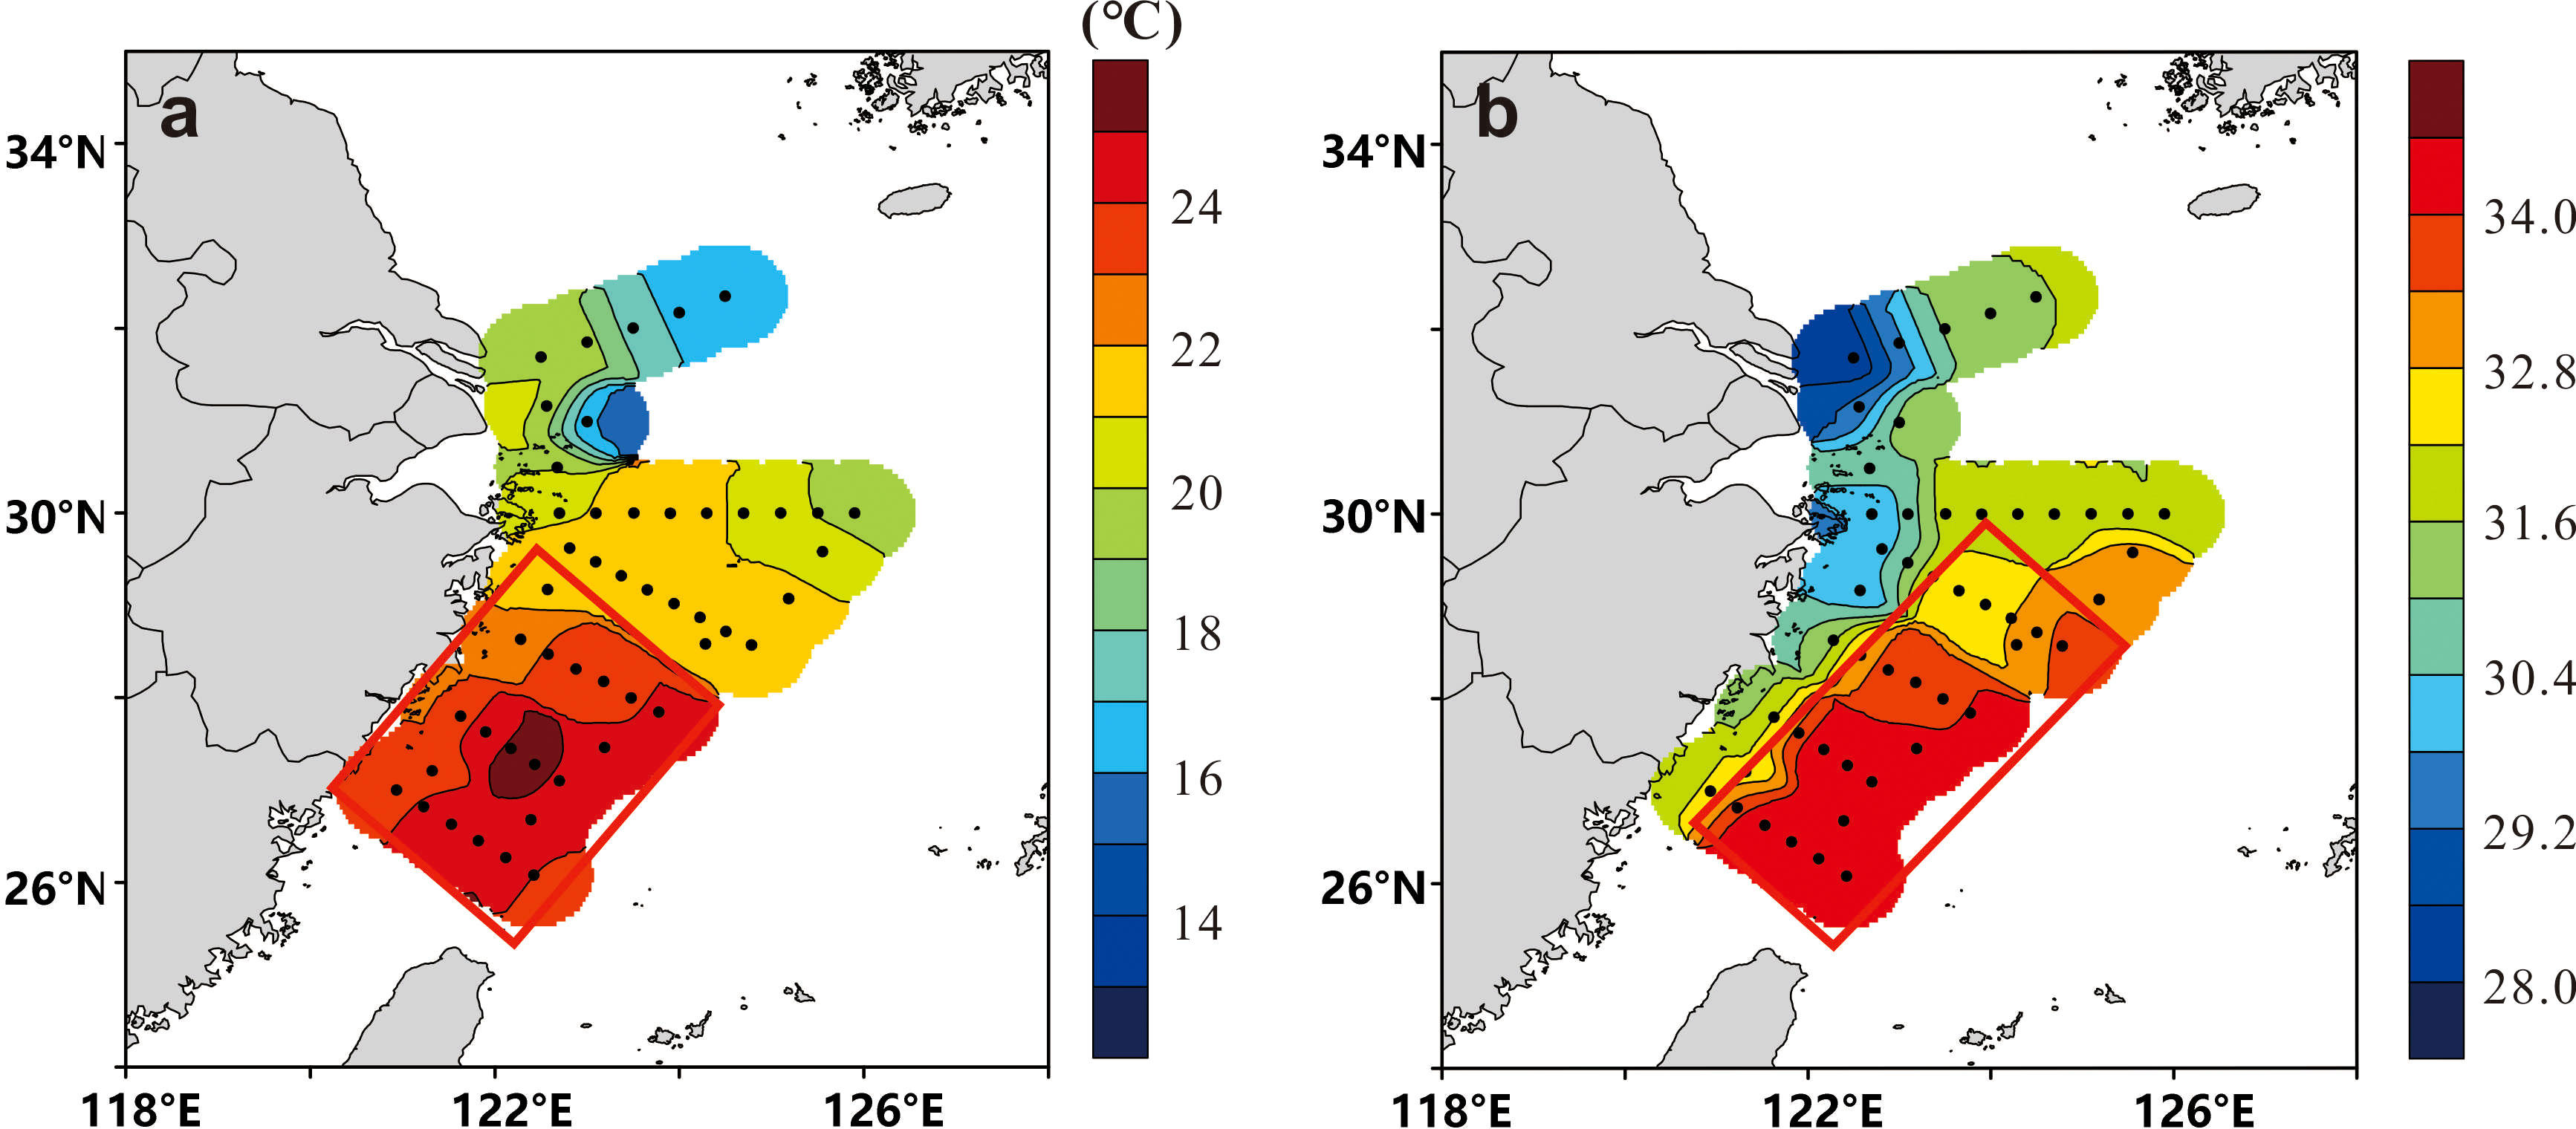
Figure 3 Horizontal distribution of (A) surface temperature and (B) salinity in the East China Sea in May 2020. The red rectangles represent areas of high sea surface temperature and salinity.
where : phosphate oxygen isotope value j in seawater i; : emission source k on phosphate oxygen isotope j; normally distributed with mean and variance ; : enrichment factors for phosphate oxygen isotope j on source k; normally distributed with mean and variance ; : contribution proportion of emission source k, estimated by the model; : concentration of phosphate oxygen isotope j in emission source k; : residual error, describing additional inter-observation variance not described by the model, estimated by the model.
3 Results
3.1 Temperature and salinity of surface seawater
We studied the salinity and temperature of the water masses in the ECS. The surface temperature of the ECS is high in the south and low in the north (Figure 3A). The sea surface temperature in south of the outer Yangtze River estuary was >21°C due to the influence of the northward-spreading Taiwan warm current and the central salinity was<28 due to dilution by low-salinity water from the Yangtze River (Figure 3B). The salinity was higher (>33) in the southeastern ECS (Figure 3B) where the main water masses were the Taiwan warm current and surface water from Kuroshio. The salinity of the sampling stations ranged from 28.13 to 34.46, showing the characteristics of mixing seawater and freshwater. Nutrients from terrigenous sources (atmospheric deposition and river transportation) were therefore also taken into consideration.
3.2 Two-component mixing model
Input from rivers or atmospheric deposition and adjacent sea transportation were used as terrestrial and seawater end-members, respectively, to construct the δ18Op end-member mixing model. Site S00-1 with the lowest salinity (28.13) was selected as the terrestrial end-member and site S04-4 with the highest salinity (34.46) was selected as the seawater end-member.
The δ18Op value deviated from the equilibrium value (Figure 4), indicating that the phosphate present was not being fully utilized by organisms and retained the source signal, which could therefore be used to trace the source of phosphate. Some of the δ18Op values deviated from both the equilibrium value and the two end-member mixing values, falling between these two lines. This suggests that the phosphate in the study area was a mix of terrestrial waters and seawater and was partially, utilized by organisms. The δ18Op value reflects the characteristics of the source region. A small number of the δ18Op values fell on the two end-member mixing line, indicating that some of the phosphate in the study area was a mix of the two end-member sources and had not been biologically modified. Some of the δ18Op values fell below the mixing line, indicating an input with a lower δ18Op value—that is, a terrigenous source. This source was most likely from the atmosphere because these sites were far from any fluvial input.
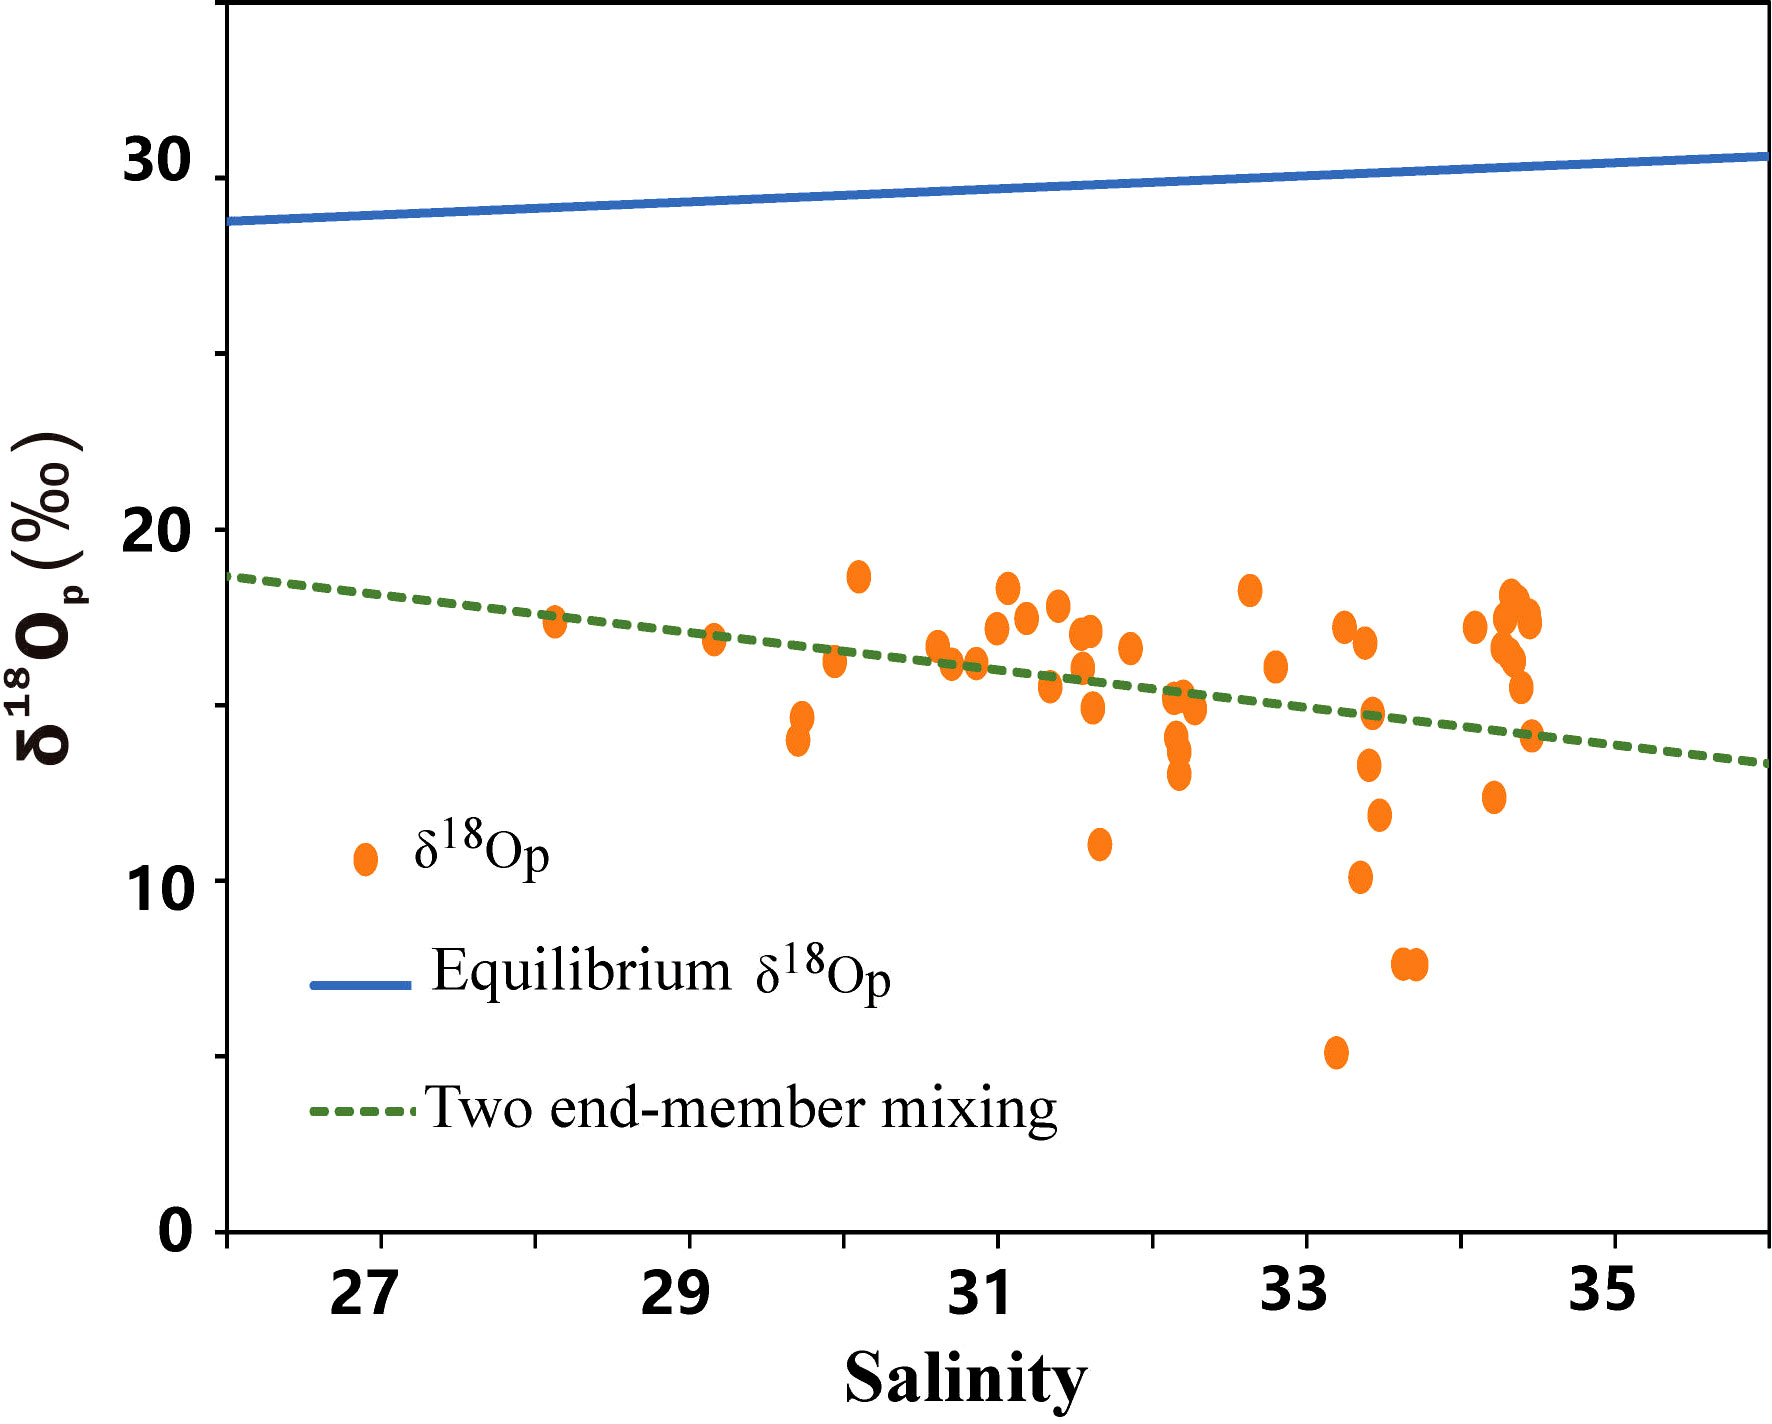
Figure 4 The derived δ18Op end-member mixed model of surface water in the East China Sea from May 19 to 28, 2020. The dotted line denotes the end-member value of δ18Op, the solid line denotes the theoretical equilibrium line of δ18Op and the dots denote the δ18Op of each sampling site.
3.3 Source analysis of the phosphate in surface waters of the ECS
Figure 5 shows that the δ18Op values ranged from 5.1 to 18.7‰, with the minimum value at site S02-4 (Figure 5, red star) and the maximum at site SF-3 (Figure 5, black star). The change in δ18Op was small in the S00 section (Figure 1), with a low value (14.0‰) at site S00-2, suggesting that the source of phosphate at this site might be different from other sites in this section. However, in section S01, the δ18Op value decreased gradually with the distance offshore and was much smaller than in section S00. In general, the river water had low δ18Op values and seawater had high δ18Op values (Davies et al., 2014), suggesting a non-marine source of water (lower δ18Op) in the offshore area of section S01. The main source of phosphate could be atmospheric transportation if we exclude the diluted water from the river and adjacent waters. The δ18Op values were lower in section in S02, with minimum values of 5.1‰ and 7.6‰ at sites S02-4 and S02-8, respectively. The δ18Op values in section S03 decreased with distance from the shore, with a value of 7.6 ‰ at site S03-3. These lower δ18Op values were detected in the area where the Taiwan warm current flowed through and no high δ18Op value seawater was present, indicating that the source of δ18Op in this area was non-marine waters with lower δ18Op values. Marine phosphates typically have δ18Op values between 19 and 26‰ as a result of biological processing (Shemesh et al., 1983; Colman et al., 2005). Atmospheric transport is not restricted by hydrodynamics and therefore may be the main source of low δ18Op values in this section.
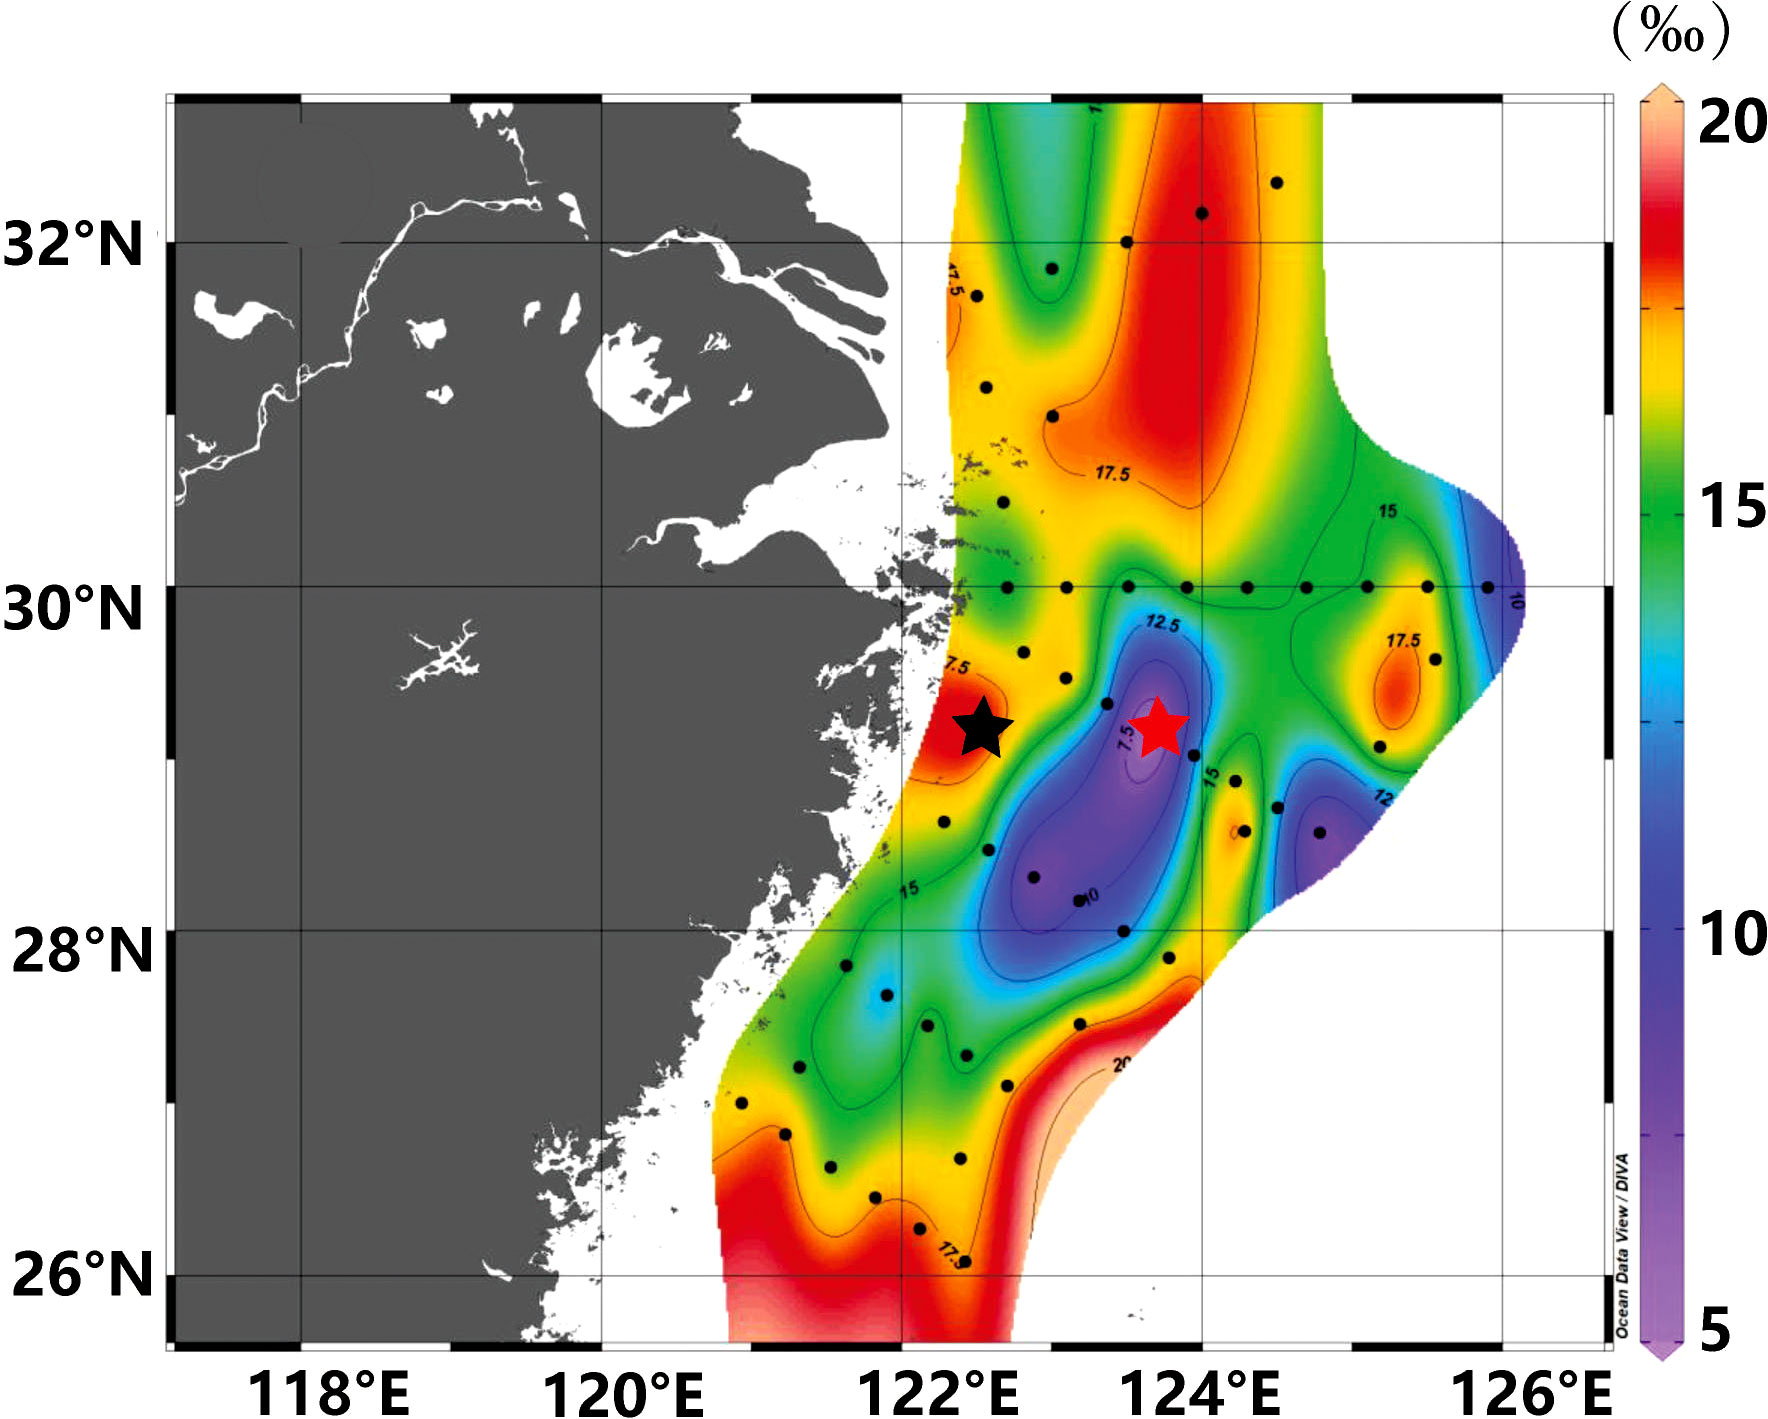
Figure 5 Horizontal distribution of δ18Op in the surface waters of the East China Sea from May 19 to 28, 2020. The red star indicates the site with the minimum δ18Op value and the black star indicates the site with the maximum δ18Op value.
The δ18Op values in sections S04 and S05 were the opposite of those in section S01. The δ18Op values of section S05 were higher than those of section S04 on moving further offshore. The main source of phosphate in these two sections was the branch of the Taiwan warm current and the Kuroshio current. Combined with the analysis of the horizontal distribution of salinity and temperature (Figure 3), these results suggest that the main source of phosphate in section S00 could be diluted water from the Yangtze River, whereas the main source of phosphate in sections S04 and S05 was the Taiwan warm current. This is consistent with the division of the water masses based on temperature and salinity. However, abnormally low values of δ18Op were measured in sections S01, S02 and S03 and there was a large difference between the different water masses. We suggest that these sections were influenced by inputs from the atmosphere. The main sources of phosphate in the survey area were therefore inputs from the atmosphere and transport from adjacent sea areas. A few stations were affected by diluted water from the Yangtze River.
4 Discussion
4.1 Contributions of potential sources to phosphate
We constructed a mixed model of two end-member based on the measured values of δ18Op. From previous models, we established that there were contributions of phosphate to the study area from both the atmosphere and adjacent sea areas. We discuss here the contribution of phosphate from the Yangtze River diluted water and the upward transport of phosphate from seafloor sediments in the ECS.
4.1.1 Diluted water from the Yangtze River
Diluted water from the Yangtze River flowed into the northeastern ECS from May 12 to 21, 2020 ((top panel in Figure 6). After expanding northeast to the ECS, it then passed through the waters around Jeju Island, South Korea. From May 22 to 31, 2020, diluted water from the Yangtze River was transported northeast to the southwestern South Yellow Sea, consistent with Chang and Isobe (2003). Diluted water from the Yangtze River mainly flowed through section S00 and part of section S01 in the survey area from May 17 to 21, 2020. There were low values of δ18Op in the area from the Yangtze river estuary to Jeju Island. These values were in the range of the characteristic values of rivers and groundwater (9.2–16.4‰) (Young et al., 2009), indicating that these stations were affected by diluted water from the Yangtze River. The isotopic values of a few sites in section S00 were higher than the characteristic values of rivers, indicating the presence of phosphate from seawater. This area was affected by the South Yellow Sea current during the sampling period (May 18–19, 2020) (Figure 6). We therefore suggest that diluted water from the Yangtze River was the major contributor of phosphate in this sea area, with individual sites affected by waters from the South Yellow Sea.
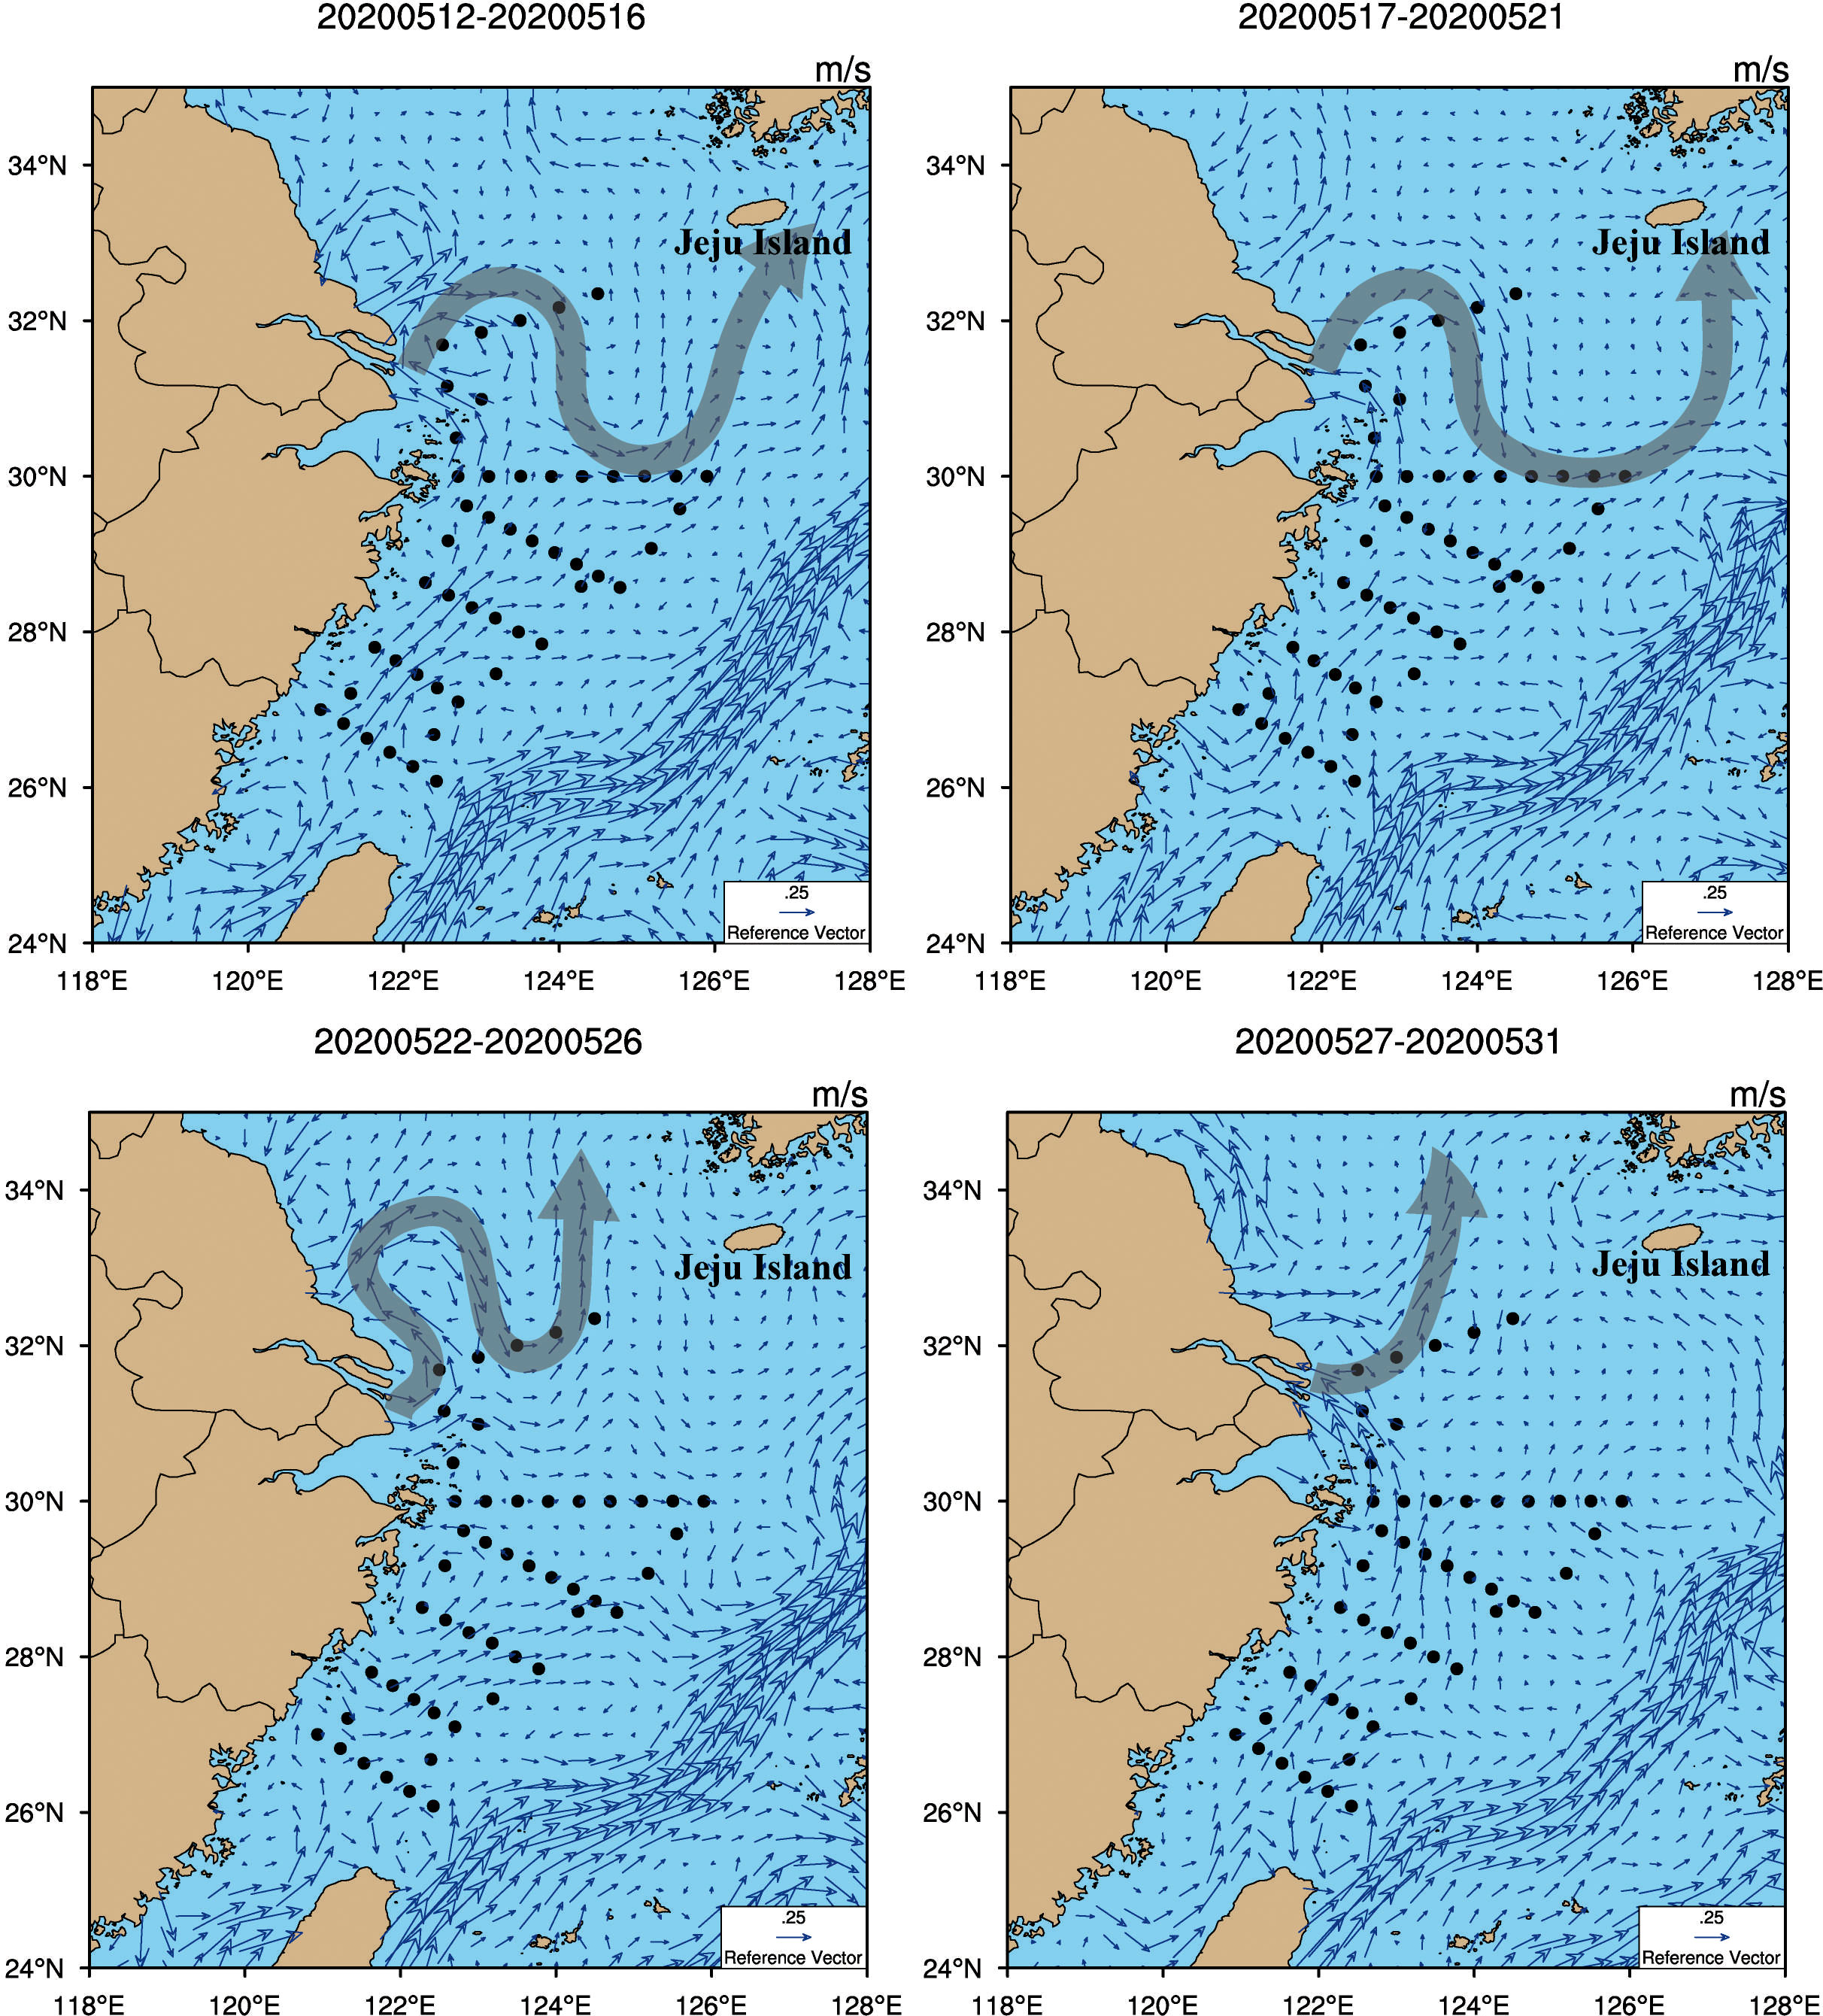
Figure 6 Surface water currents in the East Chiba Sea during the sea survey from May 12 to 31, 2020. The gray arrows indicate the main direction of the ocean currents off the Yangtze river estuary. The black dots are the survey sites.
4.1.2 Upward transport from seafloor sediments
Sites S02-3, S02-4 and S02-5 had relatively low δ18Op values, with the lowest value of 5.1‰ at site S02-4. These low δ18Op values were not due to transport from the adjacent seas. These low δ18Op values at sites were also not due to inputs from seafloor sediments because the δ18Op value of the deep ocean (>200 m depth) is 17.4–25.4‰ (McLaughlin et al., 2004; Colman et al., 2005; McLaughlin et al., 2013). The change in temperature with depth at each station showed vertical stratification in the ECS (Figure 7)—that is, the upper layer of seawater had a high temperature and a low density, whereas the lower layer of seawater had a low temperature and a high density. This resulted in low rates of convection and blocked the upward transport of nutrients from the ocean floor. This conclusion is consistent with the work of Shi et al. (2004).
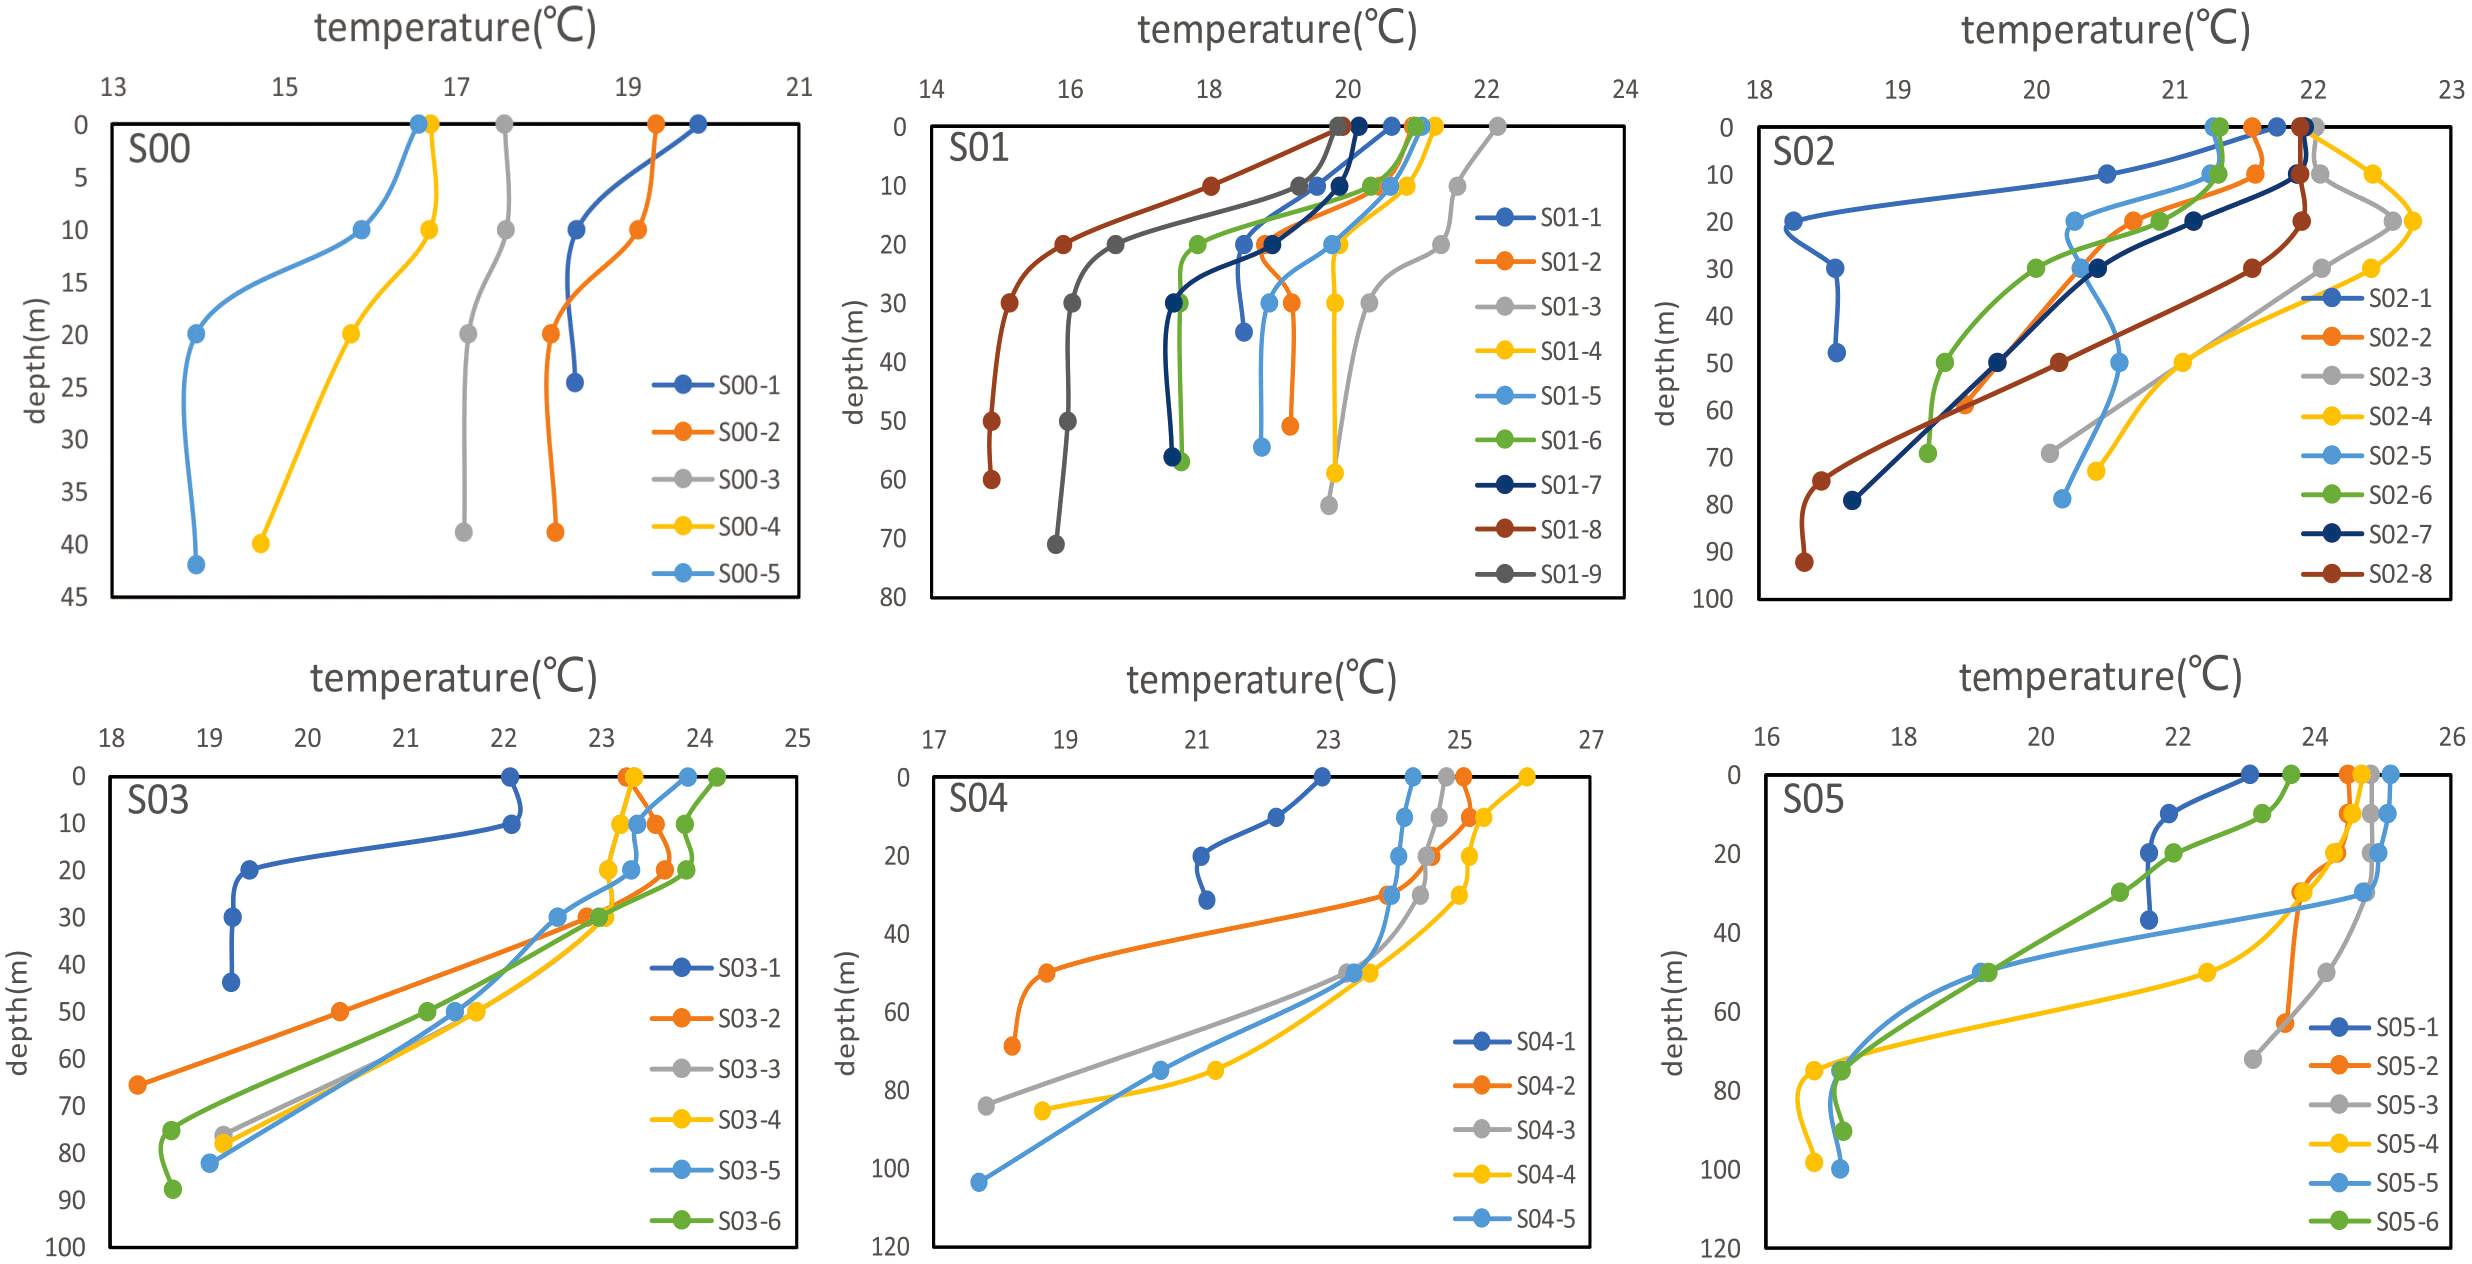
Figure 7 Variation of temperature with depth in each survey section. The sampling sites for each section locations are shown in Figure 1.
4.2 Contribution of different sources of phosphate to the ECS
There were two main sources of phosphate in the study area: (1) a terrestrial source (atmospheric deposition and dilute water from the Yangtze River); and (2) a seawater source (seawater from adjacent areas and seafloor sediments). We used the SIAR model (Parnell et al., 2010; Parnell et al., 2013) to analyze the contribution of these two sources to the phosphate measured in each section during the survey (Figure 8). The terrestrial source was the main contributor to phosphate in section S00, where it was responsible for 72% of the measured phosphate. Diluted water from the Yangtze River is the dominant process for section S00. The δ18Op values were lower in section S01, which was further offshore. The terrestrial source accounted for about 72% of the phosphate in section S01 based on the SIAR model (Figure 8), suggesting that atmospheric inputs were the main source of phosphate here. Both the terrestrial source and seawater were important influencing factors in sections S02 and S03. The terrestrial source made a higher contribution (56%) in section S02. We suggest that the phosphate in section S02 was mainly from atmosphere deposition. Seawater made a larger contribution to the phosphate in section S03, which was affected by the flow of the Taiwan warm current. The contribution of marine water to phosphate was greater in sections S04 and S05, which were both influenced by the Taiwan warm current. The SF sites were located in waters that were diluted by freshwater from both the Yangtze River and coastal currents, and it accounted for 78% of contribution from terrestrial sources to phosphate except for station SF-4 (affected by the Taiwan warm current). Sites S12, S23, S34 and S45 were far from the shoreline and the phosphate at these sites was mainly sourced from the Taiwan warm current. Table 1 lists the contribution rates of the different sources of phosphate in each section.
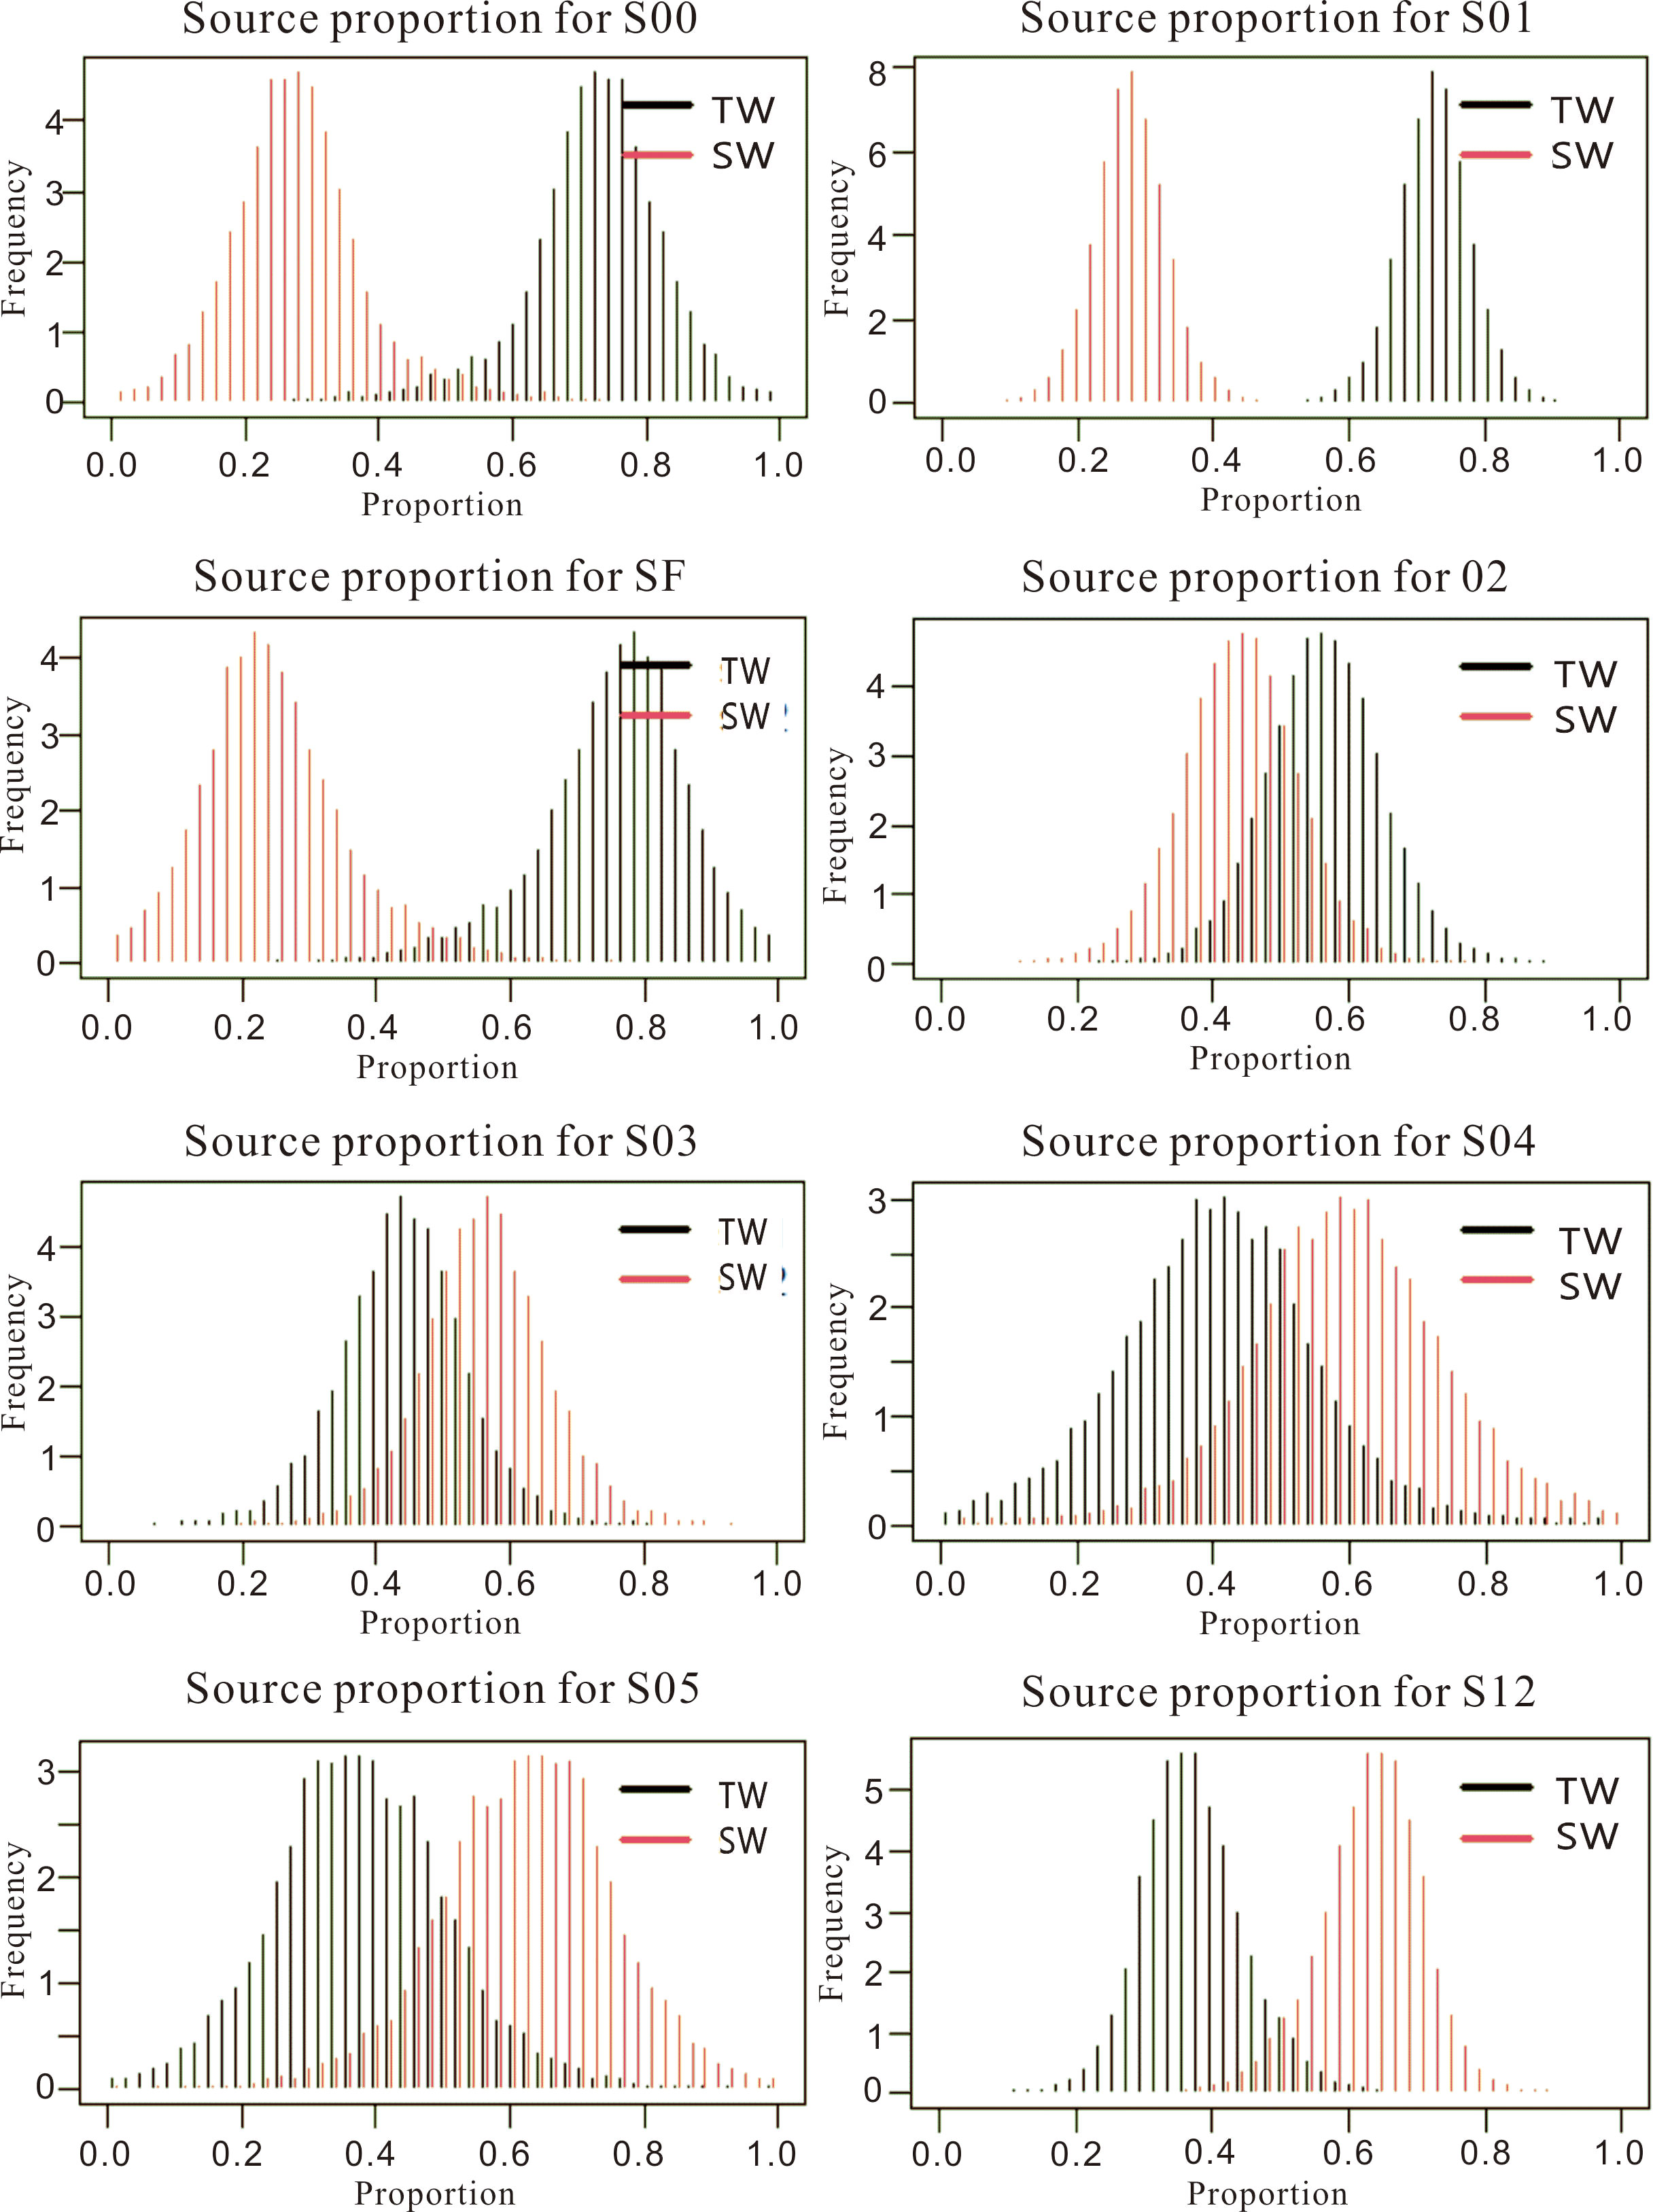
Figure 8 Contribution of terrestrial and seawater sources to different sections in the East China Sea. TW, terrestrial source; SW, seawater source.

Table 1 Main sources of phosphate in different sections in the East China Sea, May 2020.
5 Conclusions
We used characteristic values of δ18Op to analyze the sources of phosphate in the East China Sea. The experimental results and SIAR model emphasized the importance of inputs of phosphate from the atmosphere in some surface waters of the ECS. Our main conclusions are as follows.
(1) The δ18Op in the ECS retained the signal of its origin and could be used to trace the source of phosphate. The main source of phosphate in the northeastern ECS was the atmosphere, whereas the primary source of phosphate in the southwestern ECS was the Taiwan warm current. A few stations were affected by diluted water from the Yangtze River.
(2) Diluted water from the Yangtze River flowed to the northeastern ECS, affecting a few stations in this region during the ship survey. The stratification of water in spring blocked the upward transport of nutrients from the seafloor.
(3) Terrigenous phosphate contributed 56–78% of the overall input of phosphate in the northern waters of the ECS. Marine phosphate accounted for 56–63% of the total input of phosphate in the southern waters of the ECS.
Note that atmospheric transport had an important influence on phosphate in the ECS. However, the phosphate collected daily from aerosol samples by the medium flow particulate sampler was below the detection limit of the instrument and the analysis of δ18Op in the aerosol samples could not be completed. The concentration of chlorophyll a was<7.610 mg/m3 at all stations except S01-1—that is, no large-scale harmful algal bloom was detected during the ship survey and the analysis of δ18Op in algal samples could not be completed. This deficiency will be improved in future research. Our findings will help to improve future exploration techniques targeting the important influence of atmospheric sources on harmful algal blooms in the ECS and provide ideas for research into harmful algal blooms in phosphorus-restricted waters worldwide.
Data availability statement
The datasets presented in this study can be found in online repositories. The names of the repository/repositories and accession number(s) can be found below: https://doi.org/10.5281/zenodo.6568800.
Author contributions
XZ and RT conceived the idea and wrote the paper; WF revised the paper; ZJ participated in the research process and gave some advice. All authors reviewed the paper. All authors contributed to the article and approved the submitted version.
Funding
This research was funded by the National Natural Science Foundation of China (Grant No. 41775142), the National Natural Science Foundation of China Open Research Cruise (Cruise No. NORC2020-02) and the Second Tibetan Plateau Scientific Expedition and Research Program (STEP) (Grant No. 2019QZKK0103).
Conflict of interest
The authors declare that the research was conducted in the absence of any commercial or financial relationships that could be construed as a potential conflict of interest.
The reviewer KW declared a shared affiliation with the authors XZ, RT, ZJ to the handling editor at the time of review.
Publisher’s note
All claims expressed in this article are solely those of the authors and do not necessarily represent those of their affiliated organizations, or those of the publisher, the editors and the reviewers. Any product that may be evaluated in this article, or claim that may be made by its manufacturer, is not guaranteed or endorsed by the publisher.
References
Ayliffe L. K., Veeh H. H., Chivas A. R. (1992). Oxygen isotopes of phosphate and the origin of island apatite deposits. Earth Planet. Sci. Lett. 108 (1-3), 119–129. doi: 10.1016/0012-821x(92)90064-3
Blake R. E., O’Neil J. R., Garcia G. A. (1997). Oxygen isotope systematics of biologically mediated reactions of phosphate: i. microbial degradation of organophosphorus compounds. Geochim. Cosmochim. Acta. 61, 4411–4422. doi: 10.1016/S0016-7037(97)00272-X
Chang P., Isobe A. (2003). A numerical study on the changjiang diluted water in the yellow and ECSs. J. Geophys. Res. - Oceans 108 (C9), 15–3–15–17. doi: 10.1029/2002JC001749
Chen H. Y., Chen L. D. (2008). Importance of anthropogenic inputs and continental-derived dust for the distribution and flux of water-soluble nitrogen and phosphorus species in aerosol within the atmosphere over the East China Sea. J. Geophys. Res. - Atmos. 113 (D11), 1–17. doi: 10.1029/2007JD009491
Chen C. T. A., Wang S. L. (1999). Carbon, alkalinity and nutrient budgets on the East China Sea continental shelf. J. Geophys. Res. - Oceans 104 (C9), 20675–20686. doi: 10.1029/1999JC900055
Colman A. S., Blake R. E., Karl D. M., Fogel M. L., Turekian K. K. (2005). Marine phosphate oxygen isotopes and organic matter remineralization in the oceans. Proc. Natl. Acad. Sci. USA. 102, 13023–13028. doi: 10.1073/pnas.0506455102
Davies C. L., Surridge B. W. J., Gooddy D. C. (2014). Phosphate oxygen isotopes within aquatic ecosystems: global data synthesis and future research priorities. Sci. Total Environ. 496, 563–575. doi: 10.1016/j.scitotenv.2014.07.057
Elsbury K. E., Paytan A., Ostrom N. E., Kendall C., Young M. B., McLaughlin K., et al. (2009). Using oxygen isotopes of phosphate to trace phosphorus sources and cycling in lake Erie. Environ. Sci. Technol. 43 (9), 3108–3114. doi: 10.1021/es8034126
Huang T. H., Chen C. T. A., Lee J., Wu C. R., Wang Y. L., Bai Y., et al. (2019). East China Sea Increasingly gains limiting nutrient p from south China Sea. Sci. Rep. 9, 5648. doi: 10.1038/s41598-019-42020-4
Izquierdo R., Bentíez-Nelson C. R., Masqué P., Castillo S., Alastuey A., Àvilaa A. (2012). Atmospheric phosphorus deposition in a near-coastal rural site in the NE Iberian peninsula and its role in marine productivity. Atmos. Environt. 49, 361–370. doi: 10.1016/j.atmosenv.2011.11.007
Karl D. M., Tien G. (1992). MAGIC: a sensitive and precise method for measuring dissolved phosphorus in aquatic environments. Limnol. Oceanogr. 37 (1), 105–116. doi: 10.4319/lo.1992.37.1.0105
Lecuyer C., Grandjean P., Emig C. C. (1996). Determination of oxygen isotope fractionation between water and phosphate from living lingulids: potential application to palaeoenvironmental studies. Paleogeogr. Paleoclim. Paleoecol. 126, 101–108. doi: 10.1016/S0031-0182(96)00073-9
Li M., Xu K., Watanabe M., Chen Z. (2007). Long-term variations in dissolved silicate, nitrogen, and phosphorus flux from the Yangtze river into the East China Sea and impacts on estuarine ecosystem. Estuar. Coast. Shelf. Sci. 71, 3–12. doi: 10.1016/j.ecss.2006.08.013
Liu S. M., Zhang J., Chen H., Wu Y., Xiong H., Zhang Z. F. (2003). Nutrients in the changjiang and its tributaries. Biogeochemistry 62, 1–18. doi: 10.1023/A:1021162214304
Markaki Z., Oikonomou K., Kocak M., Kouvarakis G., Chaniotaki A., Kubilay N., et al. (2003). Atmospheric deposition of inorganic phosphorus in the levantine basin, Eastern Mediterranean: spatial and temporal variability and its role in seawater productivity. Limnol. Oceanogr. 48 (4), 1557–1568. doi: 10.4319/lo.2003.48.4.1557
McLaughlin K., Kendall C., Silva S. R., Young M., Paytan A. (2006). Phosphate oxygen isotope ratios as a tracer for sources and cycling of phosphate in north San Francisco bay, California. J. Geophys. Res. – Biogeo. 111 (G3), 1–12. doi: 10.1029/2005JG000079
McLaughlin K., Silva S., Kendall C., Stuart-Williams H., Paytan A. (2004). A precise method for the analysis of δ18O of dissolved inorganicphosphate in seawater. Limnol. Oceanogr.: Methods 2, 202–212. doi: 10.4319/lom.2004.2.202
McLaughlin K., Sohm J. A., Cutter G. A., Lomas M. W., Paytan A. (2013). Phosphorus cycling in the Sargasso Sea: investigation using the oxygen isotopic composition of phosphate, enzyme-labelled fluoresence, and turnover times. Global Biogeochem. Cy. 27, 375. doi: 10.1002/gbc.20037
Myriokefalitakis S., Nenes A., Baker A. R., Mihalopoulos N., Kanakidou M. (2016). Bioavailable atmospheric phosphorous supply to the global ocean: a 3-d global modeling study. Biogeosciences 13 (24), 6519–6543. doi: 10.5194/bg-13-6519-2016
Parnell A. C., Lnger R., Bearhop S., Jackson A. (2010). Source partitioning using stable isotopes: coping with too much variation. PloS One 5 (3), e9672. doi: 10.1371/journal.pone.0009672
Parnell A. C., Phillips D. L., Bearhop S., Semmens B. X., Ward E. J., Moore J., et al. (2013). Bayesian Stable isotope mixing models. Environmetrics 24, 387–399. doi: 10.1002/env.2221
Paytan A., McLaughlin K. (2011). “Tracing the sources and biogeochemical cycling of phosphorus in aquatic systems using isotopes of oxygen in phosphate,” in Handbook of environmental isotope geochemistry, advances in isotope geochemistry. Ed. Baskaran M. (Berlin Heidelberg: Springer), 419–436.
Ridame C., Guieu C. (2002). Saharan Input of phosphate to the oligotrophic water of the open western Mediterranean Sea. Limnol. Oceanogr. 47 (3), 856–869. doi: 10.4319/lo.2002.47.3.0856
Shemesh A., Kolodny Y., Luz B. (1983). Oxygen isotope variations in phosphate of biogenic apatites. II. phosphorite rocks. Earth Planet. Sci. Lett. 64, 405–416. doi: 10.1016/0012-821X(83)90101-2
Shi F., Wang X. L., Shi X. Y., Zhang C. S., Jiang F. H., Zhu C. J., et al. (2004). Benthic flux of dissolved nutrients at the sediment-water interface in the East China Sea. Mar. Environ. Sci. 01, 5–8. doi: CNKI: SUN: HYHJ.0.2004-01-002
Tcaci M., Barbecot F., Helie J. F., Surridge B., Gooddy D. C. (2019). A new technique to determine the phosphate oxygen isotope composition of freshwater samples at low ambient phosphate concentration. Environ. Sci. Technol. 53 (17), 10288–10294. doi: 10.1021/acs.est.9b00631
Thomson-Bulldis A., Karl D. (1998). Application of a novel method for phosphorus determinations in the oligotrophic north pacific ocean. Limnol. Oceanogr. 43 (7), 1565–1577. doi: 10.4319/lo.1998.43.7.1565
Tian R. X., Chen J. F., Sun X. W., Li D. W., Liu C. X., Weng H. X. (2018). Algae explosive growth mechanism enabling weather-like forecast of harmful algal blooms. Sci. Rep. 8 (1), 9923–9930. doi: 10.1038/s41598-018-28104-7
Tipping E., Benham S., Boyle J. F., Crow P., Davies J., Fischer U., et al. (2014). Atmospheric deposition of phosphorus to land and freshwater. Environ. Science: Processes Impacts 16 (7), 1608–1617. doi: 10.1039/c3em00641g
Wang K., Chen J., Ni X., Zeng D. Y., Li D. W., Jin H. Y., et al. (2017). Real-time monitoring of nutrients in the changjiang e stuary reveals short-term nutrient-algal bloom dynamics. J. Geophys. Res. - Oceans 122 (7), 5390–5403. doi: 10.1002/2016JC012450
Wang W. T., Yu Z. M., Song X. X., Yuan Y. Q., Wu Z. X., Zhou P., et al. (2018). Intrusion pattern of the offshore kuroshio branch current and its effects on nutrient contributions in the East China Sea. J. Geophys. Res. - Oceans 123 (3), 2116–2128. doi: 10.1002/2017JC013538
Young M. B., McLaughlin K., Kendall C., Stringfellow W., Rollog M., Elsbury K., et al. (2009). Characterizing the oxygen isotopic composition of phosphate sources to aquatic ecosystems. Environ. Sci. Technol. 43 (14), 559–568. doi: 10.1021/es900337q
Zhang G., Zhang J., Liu S. (2007). Characterization of nutrients in the atmospheric wet and dry deposition observed at the two monitoring sites over yellow Sea and East China Sea. J. Atmos. Chem. 57 (1), 41–57. doi: 10.1007/s10874-007-9060-3
Keywords: phosphate source, oxygen isotopes of phosphate, atmospheric transport, East China Sea, Bayesian isotope mixing model, two-component mixing model
Citation: Zhao X, Tian R, Feng W and Jin Z (2023) Assessing the contribution of atmospheric transport to phosphorus in the East China Sea using the oxygen isotope in phosphate. Front. Mar. Sci. 10:1202077. doi: 10.3389/fmars.2023.1202077
Received: 07 April 2023; Accepted: 22 June 2023;
Published: 12 July 2023.
Edited by:
Xiangbin Ran, Ministry of Natural Resources, ChinaReviewed by:
Kui Wang, Zhejiang University, ChinaGuosen Zhang, East China Normal University, China
Bin Yang, Jiangsu Ocean University, China
Copyright © 2023 Zhao, Tian, Feng and Jin. This is an open-access article distributed under the terms of the Creative Commons Attribution License (CC BY). The use, distribution or reproduction in other forums is permitted, provided the original author(s) and the copyright owner(s) are credited and that the original publication in this journal is cited, in accordance with accepted academic practice. No use, distribution or reproduction is permitted which does not comply with these terms.
*Correspondence: Rongxiang Tian, dHJ4QHpqdS5lZHUuY24=
†These authors have contributed equally to this work and share first authorship