 Dengyue Yuan†
 Xiaoqin Liu†
 Siya Wang†
 Haoyu Wang
 Junting Li
 Zhe Zhao
 Lan Wei
 Linfeng Cheng
 Ran Teng
 Zhijian Wang*
- Department of Aquaculture, Integrative Science Center of Germplasm Creation in Western China (CHONGQING) Science City & Southwest University, Chongqing, China
Intorduction: Coloration is a prominent trait in fish that is closely linked to their market value. Fish exhibit a diverse range of body colors, making them an excellent model for studying molecular mechanisms underlying pigmentation. Although regulatory pathways involved in pigmentation have been extensively studied in model fish such as zebrafish and medaka, the presence of varying chromatophore types across different fish species suggests that fish pigmentation mechanisms are not fixed. Therefore, more studies should be conducted on non-model fish. Sinibrama taeniatus is an endemic fish in the upper Yangtze River that is highly valued for its ornamental and edible properties.
Methods: In this study, we identified three chromatophore types in S. taeniatus and investigated changes in body color, chromatophores, and pigments at different developmental stages. Subsequently, RNA-seq analysis revealed that retinol metabolism, thyroid hormone synthesis, purine metabolism, and pyrimidine metabolism pathway are closely associated with pigmentation.
Results: Weighted gene co-expression network analysis (WGCNA) identified several hub genes, including mitf, wnt 9a, wnt10b, wnt11, adcy5, edn1, adcy8, and rdh8, that may play an important role in pigmentation.
Discussion: Overall, our findings provide valuable insights into the role of genes and pathways in fish pigmentation and offer useful information for body color-based molecular breeding programs in aquaculture.
1 Introduction
Coloration is a crucial characteristic of animals that serves various purposes, such as social communication, mate selection, thermoregulation, camouflage, and photoprotection (Wittkopp and Beldade, 2009; Cuthill et al., 2017; Patterson and Parichy, 2019). The combination and distribution of pigment-bearing cells, called chromatophores, are responsible for animal coloration (Olsson et al., 2013). While mammals have only one type of chromatophore, melanocytes, which produce eumelanin and pheomelanin, fish exhibit a greater diversity of body color patterns due to multifarious types of chromatophores (Schartl et al., 2016). Up till now, six distinct types of chromatophores including melanophore, xanthophore, iridophore, leucophore, erythrophore, and cyanophore were identified in fish (Salis et al., 2019). All types of chromatophores develop from neural crest–derived progenitors (Lapedriza et al., 2014). Fish melanophores produce melanin, while xanthophores and erythrophores contain pteridines and carotenoids (Cal et al., 2017). Iridophores and leucophores contain purine platelets and uric acids, respectively, which are responsible for light reflection and light scattering (Sköld et al., 2016). Cyanophores, which contain unknown chemical composition, give rise to the blue color found in only a few fish species (Goda et al., 2013; Sköld et al., 2016). The types of chromatophores differ among fish species, indicating that pigmentation mechanisms are not fixed but vary. For example, zebrafish (Danio rerio) has melanophore, xanthophore, and iridophore, while medaka (Oryzias latipes) also have leucophore in addition to the three types mentioned above (Quigley and Parichy, 2002; Lynn Lamoreux et al., 2005)
Color patterns of animals are controlled by specific genes known as pigmentation genes (Sturm et al., 2001), which consist of various pigmentation pathways that impact the formation and differentiation of chromatophores and the production of pigments (Hubbard et al., 2010; Irion and Nüsslein-Volhard, 2019). In fish, several pigmentation genes have been identified in color pattern mutants of model organisms like zebrafish and medaka (Kelsh et al., 2004; Patterson and Parichy, 2019). These genes can be broadly categorized into two groups based on pigmentation types: melanin-associated pigmentation and non-melanin-associated pigmentation (Luo et al., 2021). The genes involved in melanogenesis are extensively studied because almost all vertebrates have melanophores. Microphthalmia-associated transcription factor (Mitf) is a key regulator in melanogenesis, regulating several genes critical for melanophores development and proliferation, and melanin synthesis, such as tyrosinase (tyr) (Yasumoto et al., 1994), bcl2 (McGill et al., 2002), and cyclin-dependent kinase 2 (cdk2) (Du et al., 2004). Interestingly, Mitf activity is regulated by other transcription factors, including Sox10, Lef1, Creb, andTfap2, which facilitate Mitfin regulating pigmentation gene expression (Liu and Fisher, 2010; Kenny et al., 2022). The melanocortin system, consisting of melanocortin receptors, melanocyte-stimulating hormone (Msh), melanocortin peptides, and agouti signaling proteins, plays a crucial role in melanogenesis (Cal et al., 2017). Specifically, α-MSH induces melanin synthesis by binding toMc1r, which increases cAMP levels and activates the rate-limiting enzyme, Tyr (Leclercq et al., 2010; Dijkstra et al., 2017; Wang L. M. et al., 2022). Thus, melanogenesis is a complex process regulated by multiple genes and pathways. Genes associated with non-melanin pigmentation have been studied less extensively. Pteridines are a primary source of yellow xanthophore pigmentation. GTP cyclohydrolase 2 (Gch2) is a critical enzyme in the pteridines biosynthesis pathway, and mutation of gch2 results in defective yellow pigmentation (Lister, 2019). Similarly, xanthine oxidase (Xod), xanthine dehydrogenase (Xdh), and MYC binding protein 2 (Mycbp2) also play an important role in xanthophore pigmentation through regulating pteridines synthesis (Ziegler, 2003; Le Guyader et al., 2005). Additionally, genes involved in xanthophore differentiation are responsible for yellow pigmentation. Loss of paired box gene 7a (pax7a), a transcriptional factor for xanthophore development, reduced the yellow pigment in zebrafish (Minchin and Hughes, 2008; Nord et al., 2016). Iridophores do not produce pigment but can generate iridescent colors through purine platelets reflecting lights, and genes involved in guanine synthesis are crucial for iridophores pigmentation. Mutants of zebrafish and medaka loss genes related to purine synthesis, such as mitochondrial inner membrane protein (mpv17) and purine nucleoside phosphorylase 4a (pnp4a), exhibit pigmentation defects in iridophores (D’Agati et al., 2017; Kimura et al., 2017). While numerous pigmentation genes have been identified in model fish, their counterparts in non-model fish are still largely unknown. However, the vast array of color patterns found in wild fish presents a valuable resource for identifying pigmentation genes. Skin color is a crucial economic trait that impacts both ornamental and food fish, and the use of genome editing techniques to enhance skin color is an important aspect of selective breeding programs (Luo et al., 2021; Lu et al., 2022). Therefore, further exploration of pigmentation genes and their functions in non-model fish is warranted.
The study of color formation is crucial in understanding the genes and pathways involved in pigmentation. However, studying color formation in animals is hindered by long developmental times, increasing body size, and limited imaging possibilities (Singh and Nüsslein-Volhard, 2015). To overcome these challenges, it is necessary to focus on organisms that can be easily observed in the periods when coloration occurs (Irion et al., 2016). Sinibrama taeniatus is an endemic Cyprinidae fish found in the upper reaches of the Yangtze River (Wang et al., 2020). It exhibits excellent reproductive performance, has a short breeding cycle (two weeks), and reaches sexual maturity within 4-5 months post-fertilization under artificial breeding conditions. In preparatory work, we found that S. taeniatus takes a long time to form the completed color pattern, which is different from most fish species. For example, Nile tilapia formed the adult body color phenotype around 3 mpf (Wang et al., 2021). The adult color pattern of zebrafish was established during the first month of life (Rawls et al., 2001). In addition, the body color of S. taeniatus exhibits obvious differences at different developmental stages. Our previous study showed that the juvenile of S. taeniatus (90 days post-fertilization, dpf) is not heavily pigmented, which still exhibits a translucent phenotype (Wang et al., 2020). In S. taeniatus, the unpigmented regions of the body still exist until 12 mpf. Therefore, we think S. taeniatus is a suitable model for studying the color formation in fish. In this study, we characterized the types of chromatophores in S. taeniatus and investigated the dynamic changes in body color, chromatophores, and pigments at differential development stages. We identified key regulatory pathways and genes in the dynamic progression of pigmentation using RNA-seq analyses. Our results provide a foundation for studying the molecular mechanisms underlying fish pigmentation and support color-based molecular breeding programs in aquaculture.
2 Materials and methods
2.1 Experimental fish and sampling
Fish were caught from the Minjiang River using brails and transferred to the indoor tanks (50 × 40 × 30 cm) with a water-circulating system at 26°C under a 13L:10D lighting cycle. The healthy individuals were selected as the brood stock, and their progenies were obtained through artificial fertilization. The larva was fed with artemia three times a day, while fry and adult fish were fed twice daily with commercial feed. Seven developmental stages were identified based on skin color changes during development: 3 dpf, 15 dpf, 1 month post fertilization (mpf), 3 mpf, 6 mpf, 9 mpf, and 12 mpf. At 3 dpf and 15 dpf, the body size of the larvae is too small to directly obtain the skin tissue. Therefore, larvae which are removed with heads, viscera and yolk sacs were sampled and denoted as ST-3d and ST-15d, respectively. Similarly, dorsal skins were sampled at 1mpf, 3 mpf, 6 mpf, 9 mpf, and 12 mpf, and denoted as ST-1m, ST-3m, ST-6m, ST-9m, and ST-12m, respectively. Fish were anesthetized with MS-222 (Sigma-Aldrich, USA) before tissue sampling. All experimental protocols were approved by Southwest University and conducted under the Institutional Animal Care and Use Committee’s protocols.
2.2 Chromatophores types and quantitative analysis
The skin, scale, dorsal fin, pectoral fin, ventral fin, and anal fin of adult fish (n=3) were immersed in 0.65% normal saline and were observed under a stereomicroscope (Nikon SMZ25, Japan) to identify types of chromatophore. To investigate the dynamic density changes of melanophores and iridophores, the dorsal skin and head skin (n=9) were observed and imaged under the Nikon SMZ25 stereomicroscope at different developmental stages, viz., ST-1m, ST-3m, ST-6m, ST-9m, and ST-12m. Then, the number of melanophores per unit area of the dorsal skin and the ratio of the iridophores area to the total head area were calculated using ImageJ, respectively. Because iridophores are not obvious at 1mpf, iridophores are calculated only at 3 mpf, 6 mpf, 9 mpf, and 12 mpf. Statistical analysis of the data was performed using SPSS 26.
2.3 Pigments quantitative analysis
The pigment contents of dorsal skins at ST-1m, ST-3m, ST-6m, ST-9m, and ST-12m stages were analyzed. For melanin detection, dorsal skin samples (n=3; weigh=0.1 g/sample) were placed in a tube, then added 0.9 mL of phosphate buffer (0.1mol/L; pH=7.0). This mixture was homogenized in an ice-water bath for 10 min. 50 μL of the supernatant was detected using a fish melanin ELISA kit (Ruixin, China). The absorbance (OD) value was measured at a wavelength of 450 nm using a microplate reader (Rayto RT-6100, USA) to calculate the melanin concentration.
The contents of pteridine, β-carotene, and guanine were detected using a high-performance liquid chromatography (HPLC) system (Agilent 1200, USA). For pteridine detection, dorsal skin samples (n=3; weigh=0.3 g/sample) were ground into a powder and transferred 0.1 g of powder to a brown tube, then added 0.5% potassium hydroxide solution (5mL). This mixture was homogenized at 4°C for 5 min and oscillated for 2 min. The pH value was adjusted to 7.5 with 0.1% phosphoric acid water, followed by sonication at 4°C for 30 min and the addition of distilled water to 8mL. After oscillating mixing, 1 mL of supernatant was filtered with a 0.45 μm filter membrane, and then 20 μL of supernatant was detected at a wavelength of 360 nm using the HPLC system.
To detect β-carotene, dorsal skin samples (n=3; weigh=0.3 g/sample) were ground into a powder and placed 0.1 g of powder in a brown tube. A 0.1% butylated hydroxytoluene (BHT) -ethanol solution (5mL) was added to the tube, and the mixture oscillated at 25°C for 4h in a dark place. The resulting supernatant was transferred to a fresh brown tube, and the process was repeated once. The supernatant was collected and combined with the previously obtained supernatant. The final supernatant was mixed with 0.1% BHT-ethanol to a total volume of 10 mL. After oscillating mixing, 0.2 mL of the supernatant was filtered through a 0.22 μm filter membrane and detected at a wavelength of 445 nm using an HPLC system.
To detect guanine, dorsal skin samples (n=3; weigh=0.3 g/sample) were ground into a powder and placed 0.1 g of powder in a brown tube. Trifluoroacetic acid (5 mL) and formic acid (5 mL) were sequentially added to the tube, and the mixture oscillated at 90°C for 12min. The cooled supernatant was transferred to a fresh tube, dried under nitrogen, and reconstituted in 1mL of mobile phase consisting of 0.01 mol/L phosphate buffered salt solution (pH = 6.2) and methanol. The resulting solution was filtered through a 0.22 μm filter membrane and detected at a wavelength of 210 nm using an HPLC system.
2.4 RNA sequencing analysis
Total RNA was extracted from larvae (n=3) at two developmental stages (ST-3d and ST-15d) and dorsal skins (n=3) at five developmental stages (ST-1m, ST-3m, ST-6m, ST-9m, and ST-12m) using Trizol reagent (Takara Bio, Japan). RNA quality and quantity were assessed using a Nanodrop ND-1000 spectrophotometer (LabTech, USA) and 2100 Bioanalyzer (Agilent Technologies, USA) as described in a previous study (Yuan et al., 2020). Samples that met the criteria (total RNA concentration ≥100 ng/μL; RIN ≥ 8) were used for sequencing library construction using a paired-end sample preparation kit (Illumina Inc., USA), and the library was sequenced on an Illumina HiSeq 2000 sequencer.
Prior to bioinformatics analysis, the raw sequencing reads underwent quality filtering using fastp (Chen et al., 2018). The resulting clean reads were aligned to the reference genome of S. taeniatus using HISAT2 (Kim et al., 2019). Gene expression quantification was calculated using RSEM (Li and Dewey, 2011). Differentially expressed genes (DEGs) analysis was conducted using DESeq2 (Love et al., 2014), with a threshold value (P value < 0.01 and |log2FC| > 1). Enrichment analysis of Gene Ontology (GO) and Kyoto Encyclopedia of Genes and Genomes (KEGG) was performed using R package clusterProfiler 4.0 (Wu et al., 2021), and results were visualized using ggplot2 and stringr packages. To explore gene co-expression patterns and their associations with phenotypic traits (i.e., chromatophores number and pigments content), weighted gene co-expression network analysis (WGCNA) was performed using R package WGCNA (Langfelder and Horvath, 2008). Gene expression filtering was applied to retain genes with FPKM values ≥ 1 in more than half of all samples. The power parameter was set to 8, and modules were identified using a minimum module size of 30 and an abline of 0.25. Based on the expression levels of all genes and the similarity of module eigengene (ME), the biological modules were then classified. Pearson correlation analysis was conducted to study the correlation coefficient of phenotypic traits (i.e., chromatophores number and pigments content) and modules according to the ME values for modules. Modules with the squared Pearson correlation coefficient (R2) > 0.55 and P < 0.01 were considered significant, and their gene functions were further explored using GO and KEGG enrichment analysis. Intramodular connectivity between genes and intermodular correlations were calculated using the WGCNA package. Based on enrichment analysis results, genes involved in pigmentation pathways were used to construct a gene co-expression network using Cytoscape (Shannon et al., 2003), and hub genes with high connectivity were identified.
2.5 Validation of RNA-Seq results
Dorsal skins from differential development were used to extract total RNA, followed by cDNA was synthesized using the PrimeScript RT Reagent Kit (Takara Bio). Gene expressions were analyzed by real-time PCR (RT-PCR) using TB Green Premix Ex TaqTM II Kit (Takara Bio) and performed on Quant Studio 1 (Thermo Fisher, USA). Primers for target genes were designed based on the genomic and transcriptomic data of S. taeniatus (Supplementary Table A.1). β-actin was employed as the reference gene, and the 2-△△Ct method was utilized to determine relative gene expression levels.
3 Results
3.1 The types of chromatophores in Sinibrama taeniatus
Three chromatophores including melanophore, xanthophore, and iridophore were observed in the scale, fins, and skins of adult S. taeniatus using optical microscopy. Both stellate and punctate melanophores exist in S. taeniatus. Xanthophores are dispersed near melanophores and exhibit an irregular yellow shape. Iridophores, the smallest of the three, display a punctate shape and reflect light (Figure 1). Melanophores first appeared on the head and base of the ventral fin of S. taeniatus at 3 dpf, followed by iridophores on the ventral trunk at 4dpf, and finally xanthophores on the head and base of the ventral fin at 5dpf (Figure 2). These three chromatophores are throughout the body of S. taeniatus, including skin, head, eye, fin, and scale.
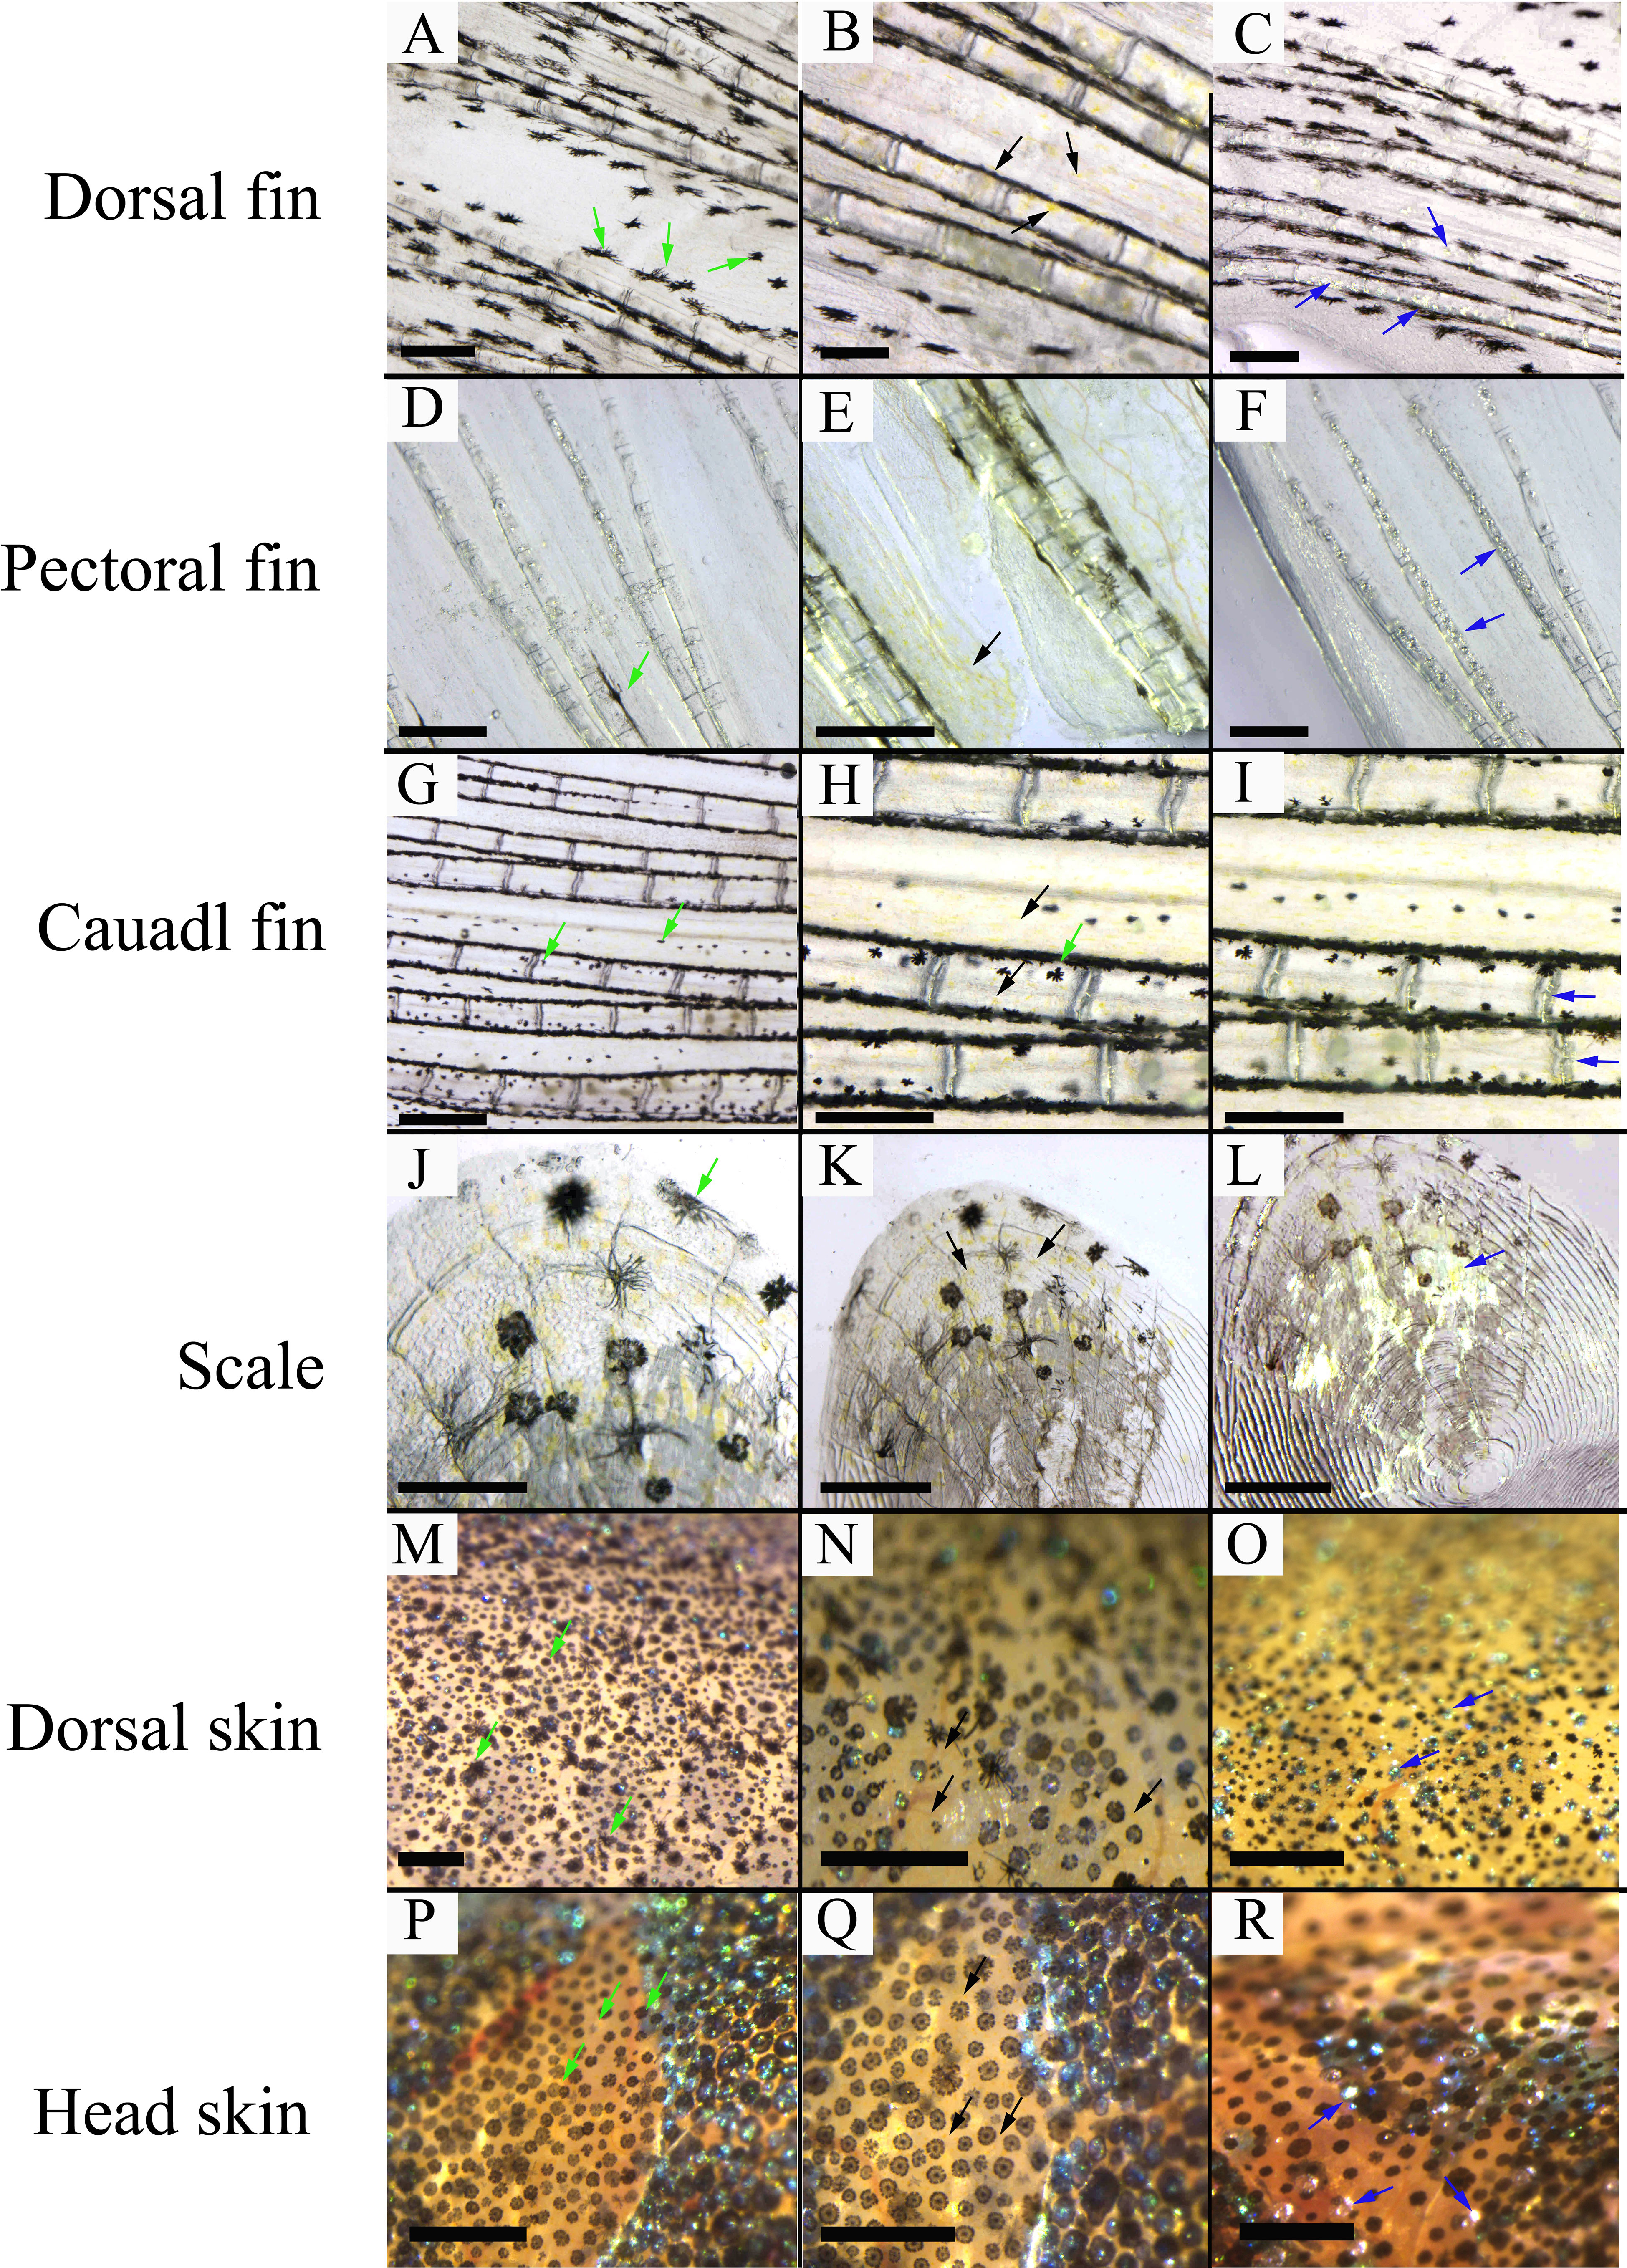
Figure 1 The morphological characteristics of chromatophores in Sinibrama taeniatus. (A–C) Chromatophores on dorsal fin; (D–F) Chromatophores on pectoral fin; (G–I) Chromatophores on tail fin; (J–L) Chromatophores on scale; (M-O) Chromatophores on dorsal skin; (P–R) Chromatophores on head skin. The green, black, and blue arrow indicates melanophore, xanthophore, and iridophore, respectively. The scale bar in Figure 1A-L is 0.5 mm.
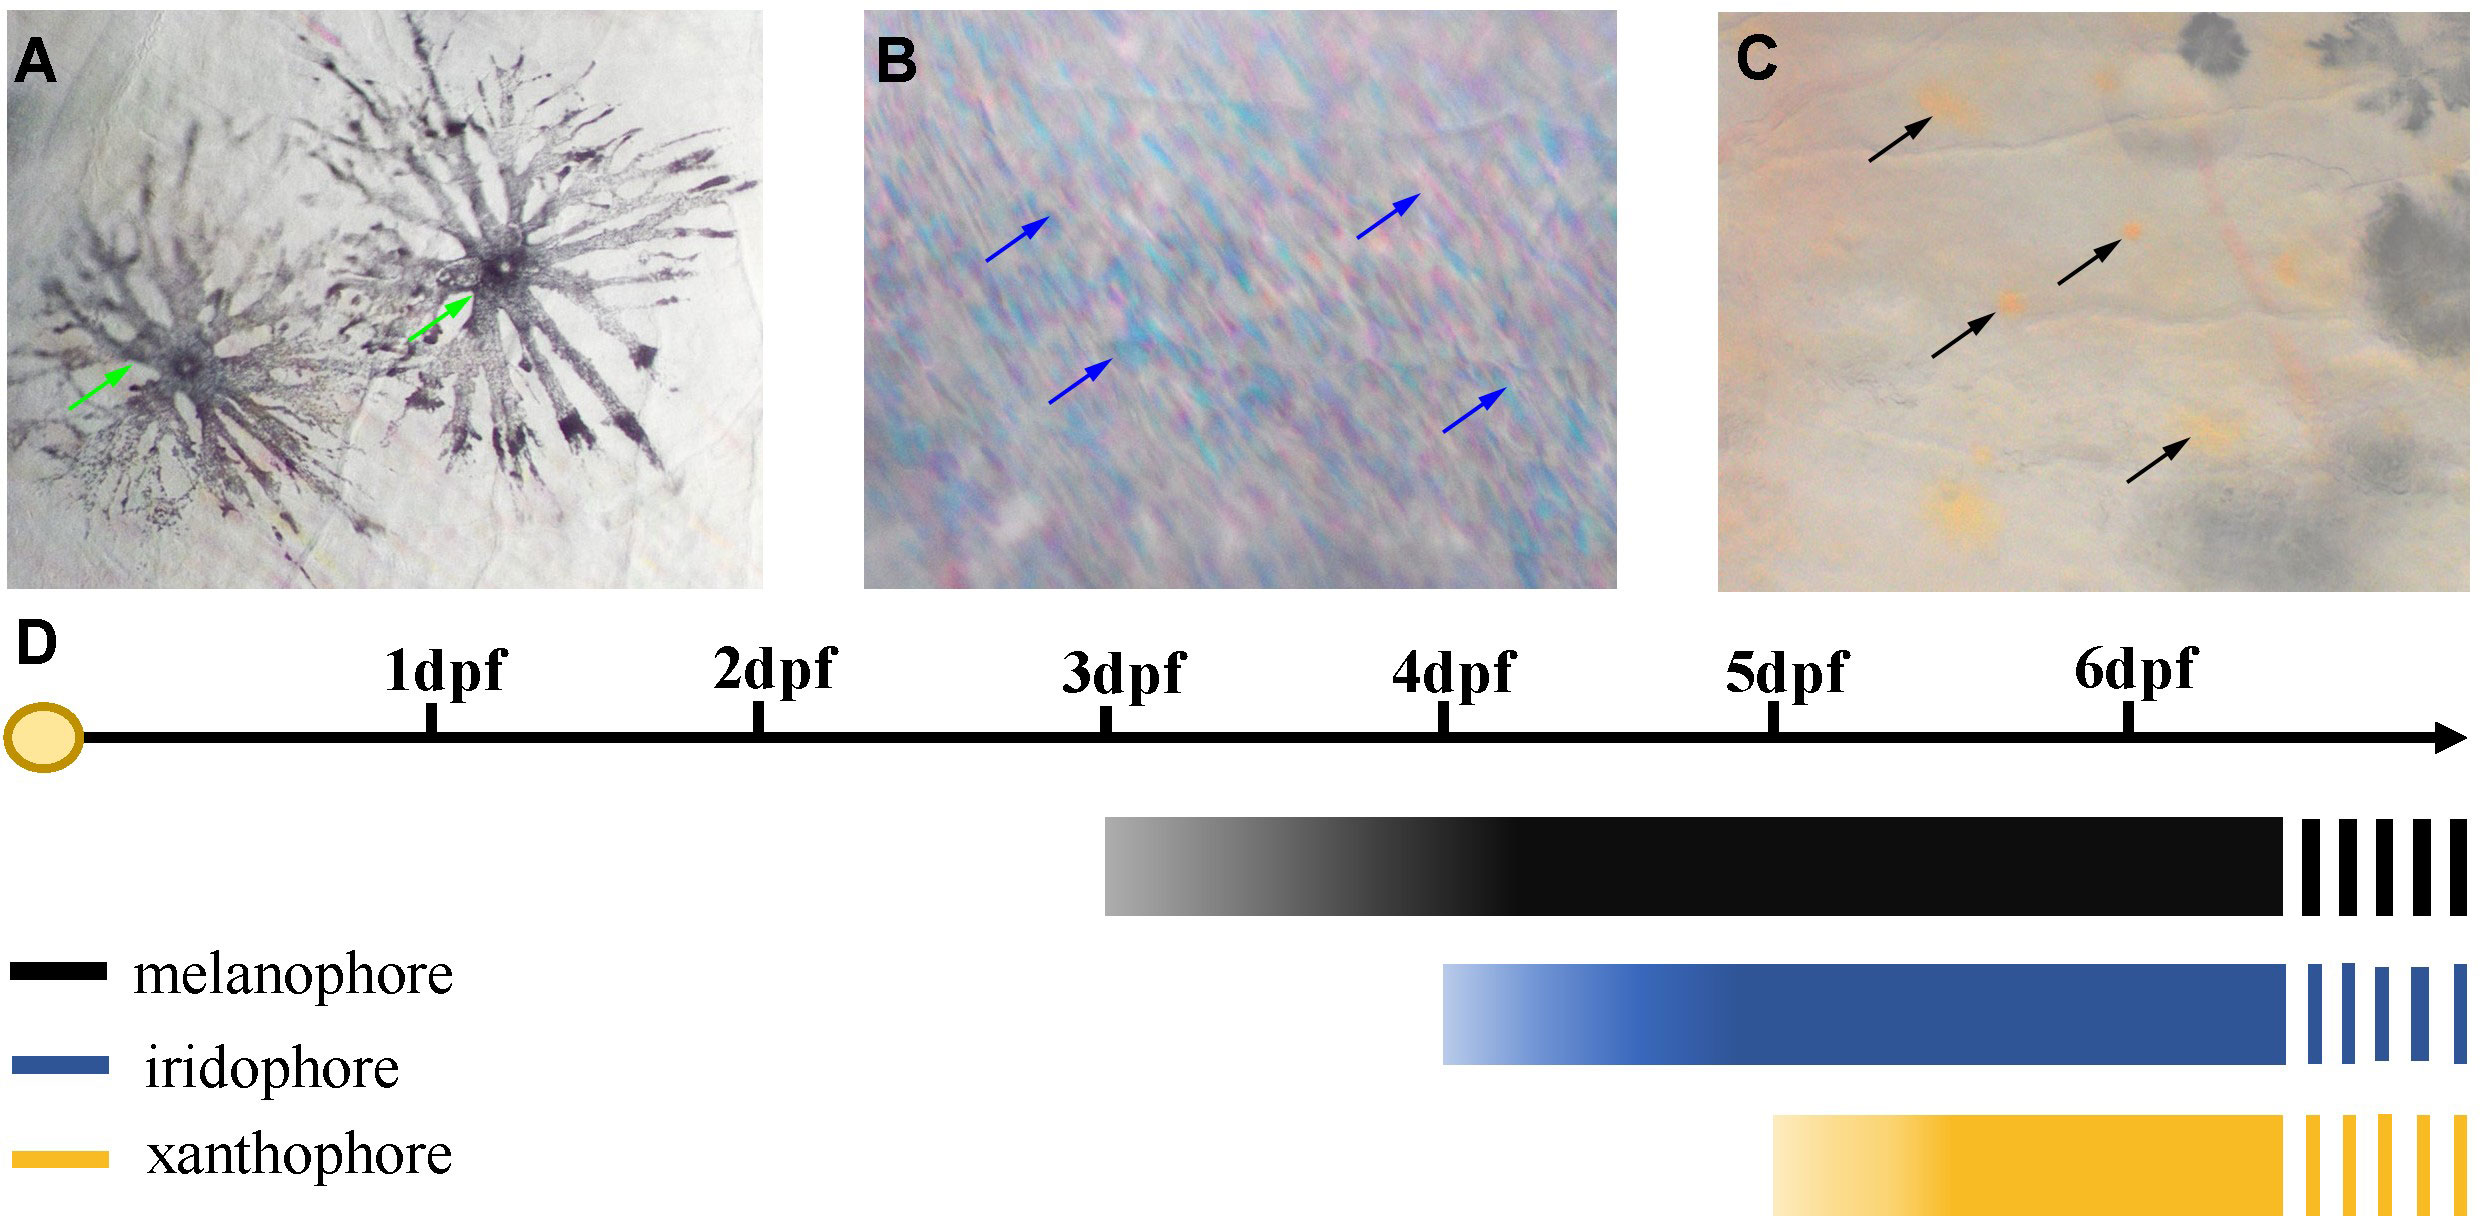
Figure 2 Time of the first occurrence of chromatophores in Sinibrama taeniatus. (A) Melanophore; (B) Iridophore; (C) Xanthophore; (D) Time table of the first appearance of every types of chromatophores.
3.2 Dynamic changes of body color, chromatophores, and pigments at different developmental stages
The yolk-sac larva of S. taeniatus is transparent, gradually developing body color in the postlarva stage. Although most regions of the body are not heavily pigmented, the organ systems remain visible and fish maintains translucence at 2 months post fertilization (mpf). At 3 mpf, the peritoneum becomes covered with chromatophores presenting a silver-black color, while a dark line composed of chromatophores appears below the lateral line at 9 mpf (Figure 3). The body’s pigmented regions increase with development, but the caudal region of the body remains translucent until 12 mpf (Figure 3). The density of melanophores showed a significant increase with individual development, particularly at 12 mpf. However, the density of melanophores in the dorsal skins was no significant change between 6 mpf and 9 mpf. The density of Iridophores in the head skins significantly increased at 3 mpf, 6 mpf, and 9 mpf, before decreasing at 12 mpf. In addition, there is no significant change between 3 mpf and 12 mpf (Figure 4). Xanthophores are obscured by a large number of melanophores, so their density change is not counted in S. taeniatus.
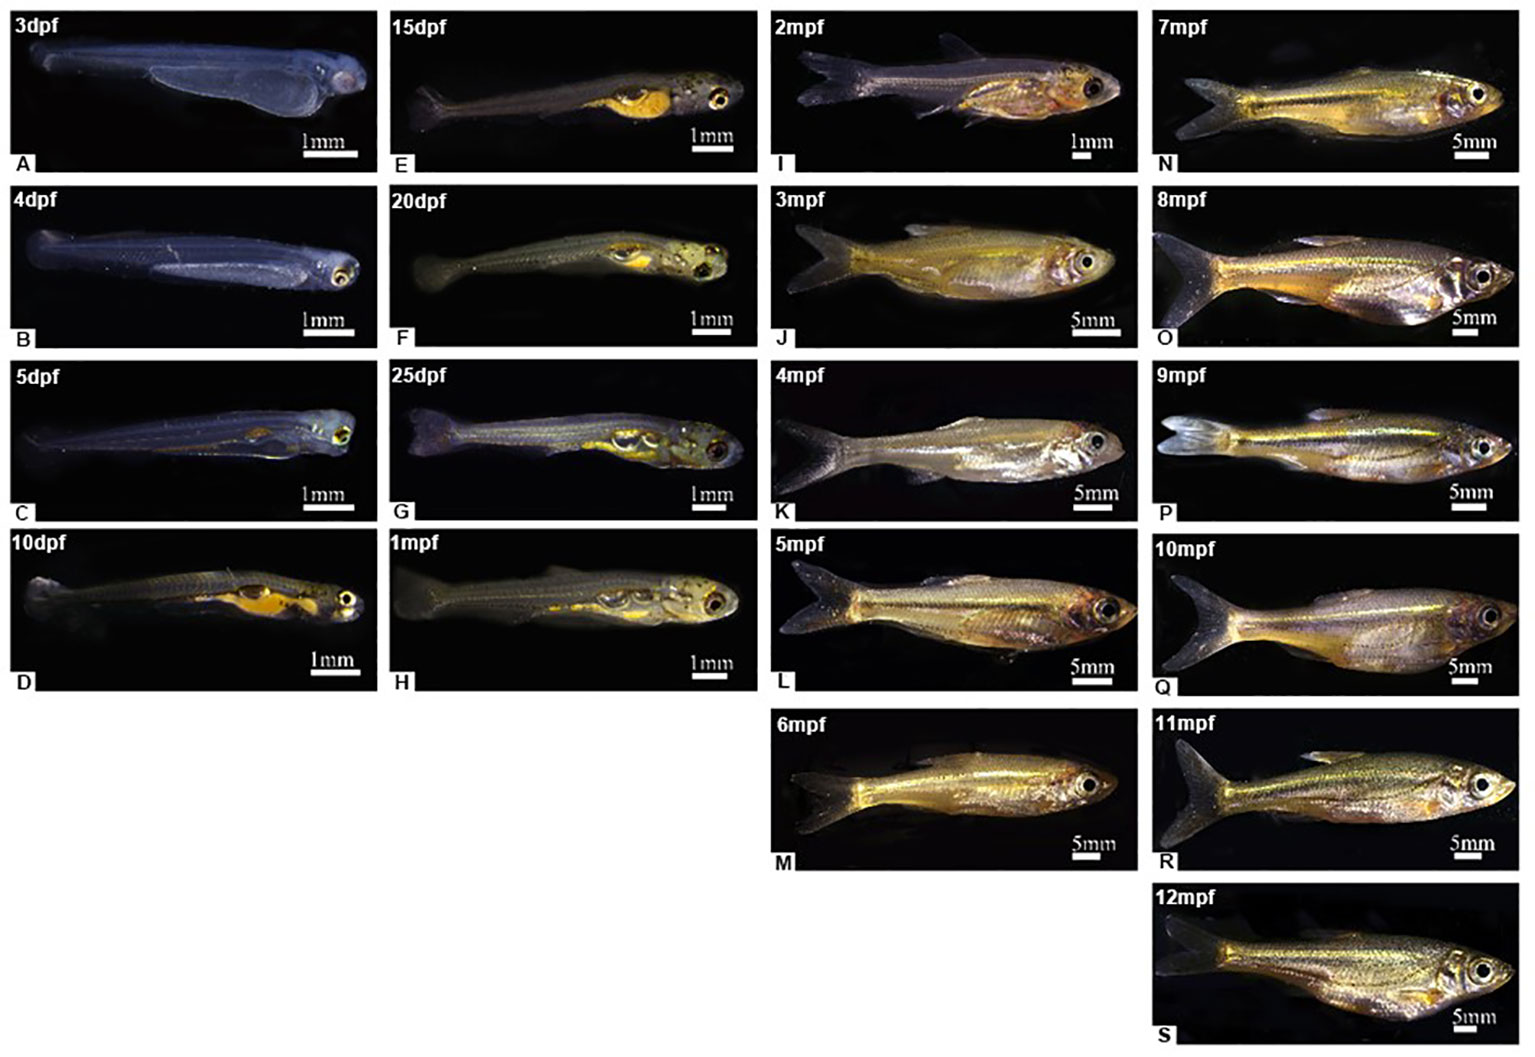
Figure 3 The body color of Sinibrama taeniatus at different developmental stages. (A) 1dpf; (B) 4dpf; (C) 5dpf; (D) 10 dpf; (E) 15 dpf; (F) 20 dpf; (G) 25 dpf; (H) 1 mpf; (I) 2 mpf; (J) 3 mpf; (K) 4 mpf; (L) 5 mpf; (M) 6 mpf; (N) 7 mpf; (O) 8 mpf; (P) 9 mpf; (Q) 10 mpf; (R) 11 mpf; (S) 12 mpf.
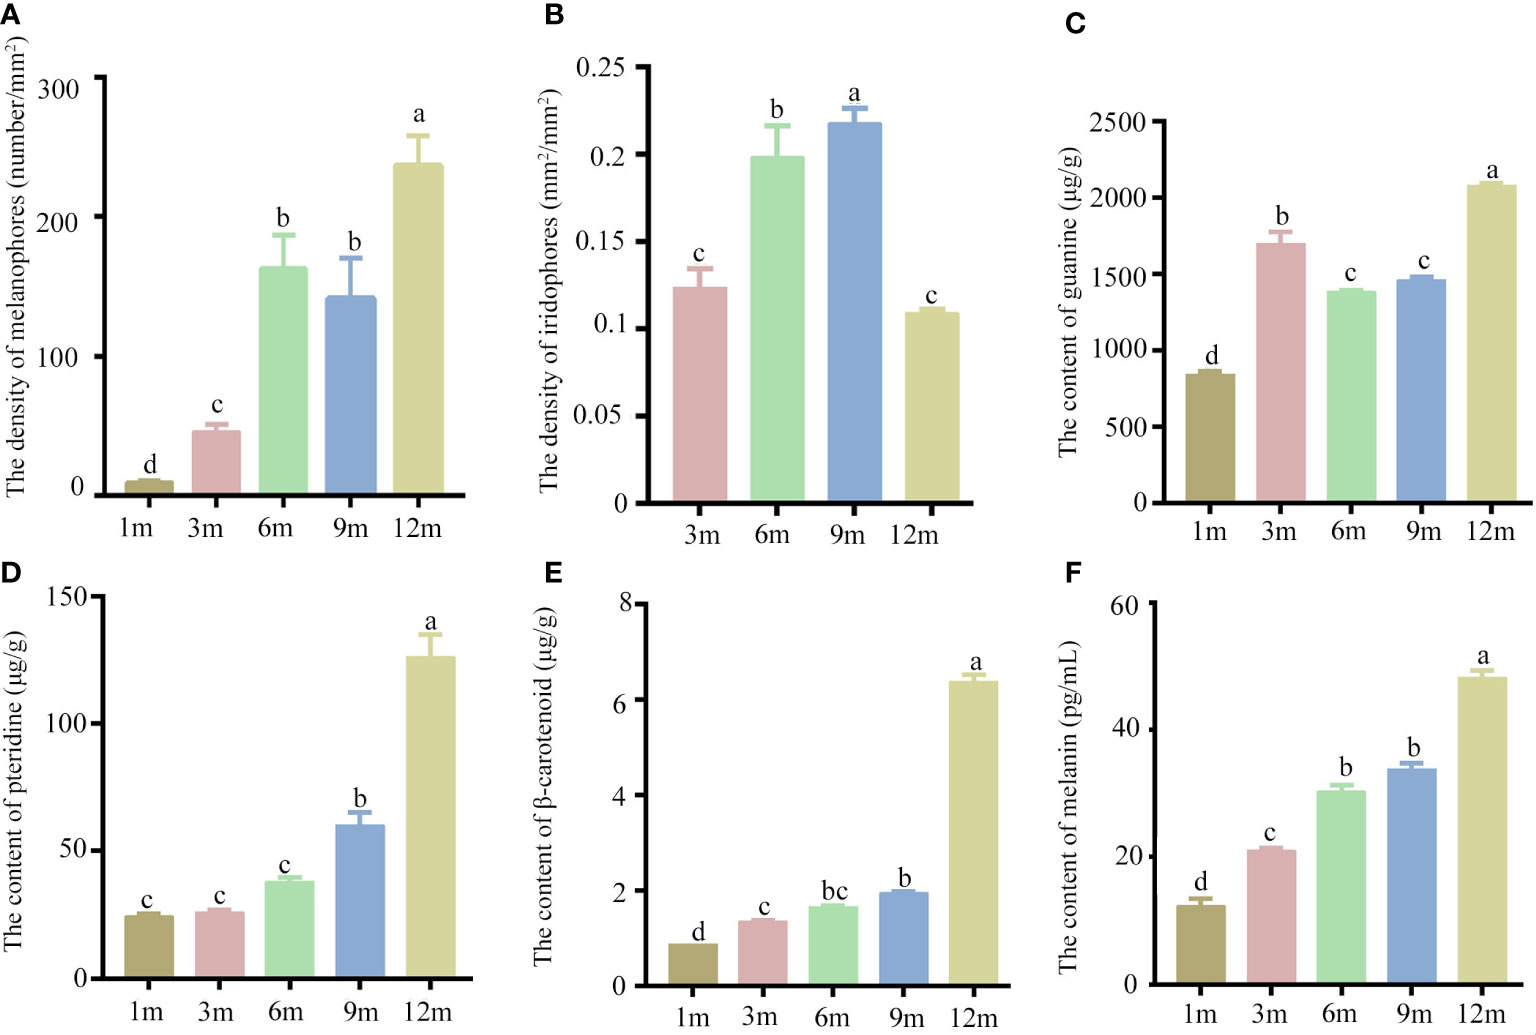
Figure 4 The chromatophores and pigments of Sinibrama taeniatus at different developmental stages. (A) The density of melanophores; (B) The density of iridophores; (C) The content of guanine; (D) The content of pteridine; (E) The content of β-carotenoid; (F) The content of melanin. Significant differences among developmental stages are indicated by different letters above the error bars.
Additionally, the pigments secreted from three chromatophores were analyzed and quantitated. The levels of melanin, pteridine, and β-carotenoid significantly increased during individual development, with peak values observed at 12 mpf (Figure 4). In contrast, the guanine content showed an initial increase at 1 and 3 mpf, followed by a slight decrease at 6 and 9 mpf, and a subsequent increase at 12 mpf (Figure 4).
3.3 Differential expression analysis reveals key pathways involved in pigmentation
A systematic understanding of the transcriptional level changes during color formation was achieved through RNA-seq analysis at various developmental stages (3 dpf, 15 dpf, 1 mpf, 3 mpf, 6 mpf, 9 mpf, and 12 mpf). The raw reads were deposited in the NCBI BioProject database under accession number PRJNA949530. Approximately 957.57 Mb of clean reads were obtained after filtering. The clean reads had an average Q20 and Q30 of 98.11% and 93.99%, respectively, and approximately 90.36% of them were mapped to the reference genome of S. taeniatus (Supplementary Table A.2).
DEGs were identified among seven developmental stages through pairwise transcriptome comparison, and a total of 21 comparative results were obtained. The largest number of DEGs was observed between the ST-3d group and ST-9m group. Conversely, the smallest number of DEGs was observed between the ST-15d group and ST-1m group (Supplementary Table A.3). GO and KEGG functional enrichment analyses for DEGs were conducted to elucidate the predominant pathways involved in pigmentation. The results showed that DEGs were significantly enriched (p < 0.05) in ten pathways, including retinol metabolism, thyroid hormone synthesis, purine metabolism, pyrimidine metabolism, thyroid hormone signaling pathway, tyrosine metabolism, melanogenesis, melanoma, and Wnt signaling pathway (Figure 5; Supplementary Tables A.4, A.5). Among these ten pathways, four pathways with high frequency, including retinol metabolism, thyroid hormone synthesis, purine metabolism, and pyrimidine metabolism, may be closely related to pigmentation in S. taeniatus. Additionally, DEGs from ST-3d vs. ST-15d, ST-3d vs. ST-1m, and ST-15d vs. ST-1m were significantly enriched in tyrosine metabolism. The thyroid hormone signaling pathway was significantly enriched in ST-3d vs. ST-3m, ST-3d vs. ST-6m, ST-3m vs. ST-6m, ST-6m vs. ST-12m. The melanogenesis and Wnt signaling pathways were significantly enriched in ST-6m vs. ST-12m and ST-9m vs. ST-12m. However, melanoma was only significantly enriched in ST-3d vs. ST-9m (Figure 5A). The previously reported pigmentation genes from these ten pathways were chosen (Supplementary Table A.6), and the dynamic expression changes of these genes at different developmental stages were presented in Figure 5B.
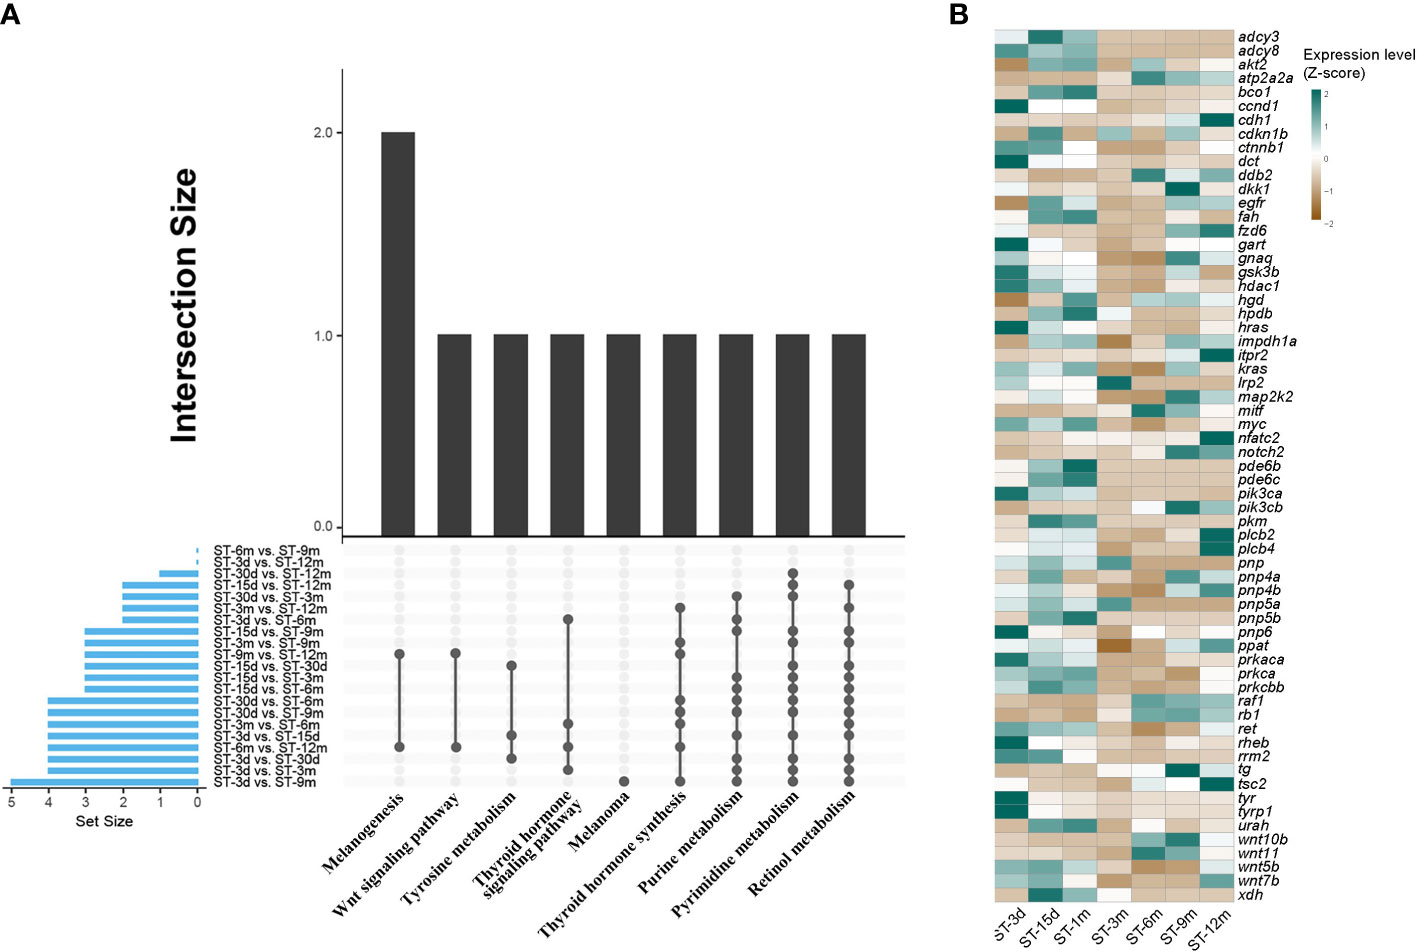
Figure 5 Enriched KEGG and DGEs in different developmental stages of S. taeniatus. (A) Significantly enriched KEGG items of DEGs. (B) Dynamic expression profiles of DEGs.
To validate the RNA-seq results, six differentially expressed pigmentation genes were randomly selected and analyzed by RT-PCR. The gene expression patterns detected using RT-PCR were highly consistent with RNA-seq data (Supplementary Figure A.1).
3.4 WGCNA analysis reveals hub genes involved in pigmentation
A total of 19 modules were obtained by WGCNA based on 21,260 genes with relative expression levels > 1 (Figure 6). Four modules were significantly associated with pigments and chromatophores. The darked module was found to be significantly related to melanin and guanine content, as well as the number of melanophores and iridophores. The thistle module was significantly associated with pteridine content and melanophore count, while the darkorange2 module was significantly related to the number of iridophores. The darkmagenta module was found to be significantly associated with melanin content and iridophore count (Figure 6). Go and KEGG enrichment analyses of genes from these modules revealed significant enrichment of retinol metabolism, thyroid hormone synthesis, thyroid hormone signaling pathway, melanogenesis, melanoma, pyrimidine metabolism, and Wnt signaling pathway (Figure 7; Supplementary Table A.7). Co-expression network analysis identified two hub genes (adcy8 and rdh8) in the darked module and six hub genes (mitfa, wnt9a, wnt10b, wnt11, adcy5, and edn1) in the darkmagenta module (Figure 8), highlighting their potential roles in pigmentation. However, due to insufficient gene numbers, co-expression network analysis was not conducted for the thistle and darkorange2 modules.
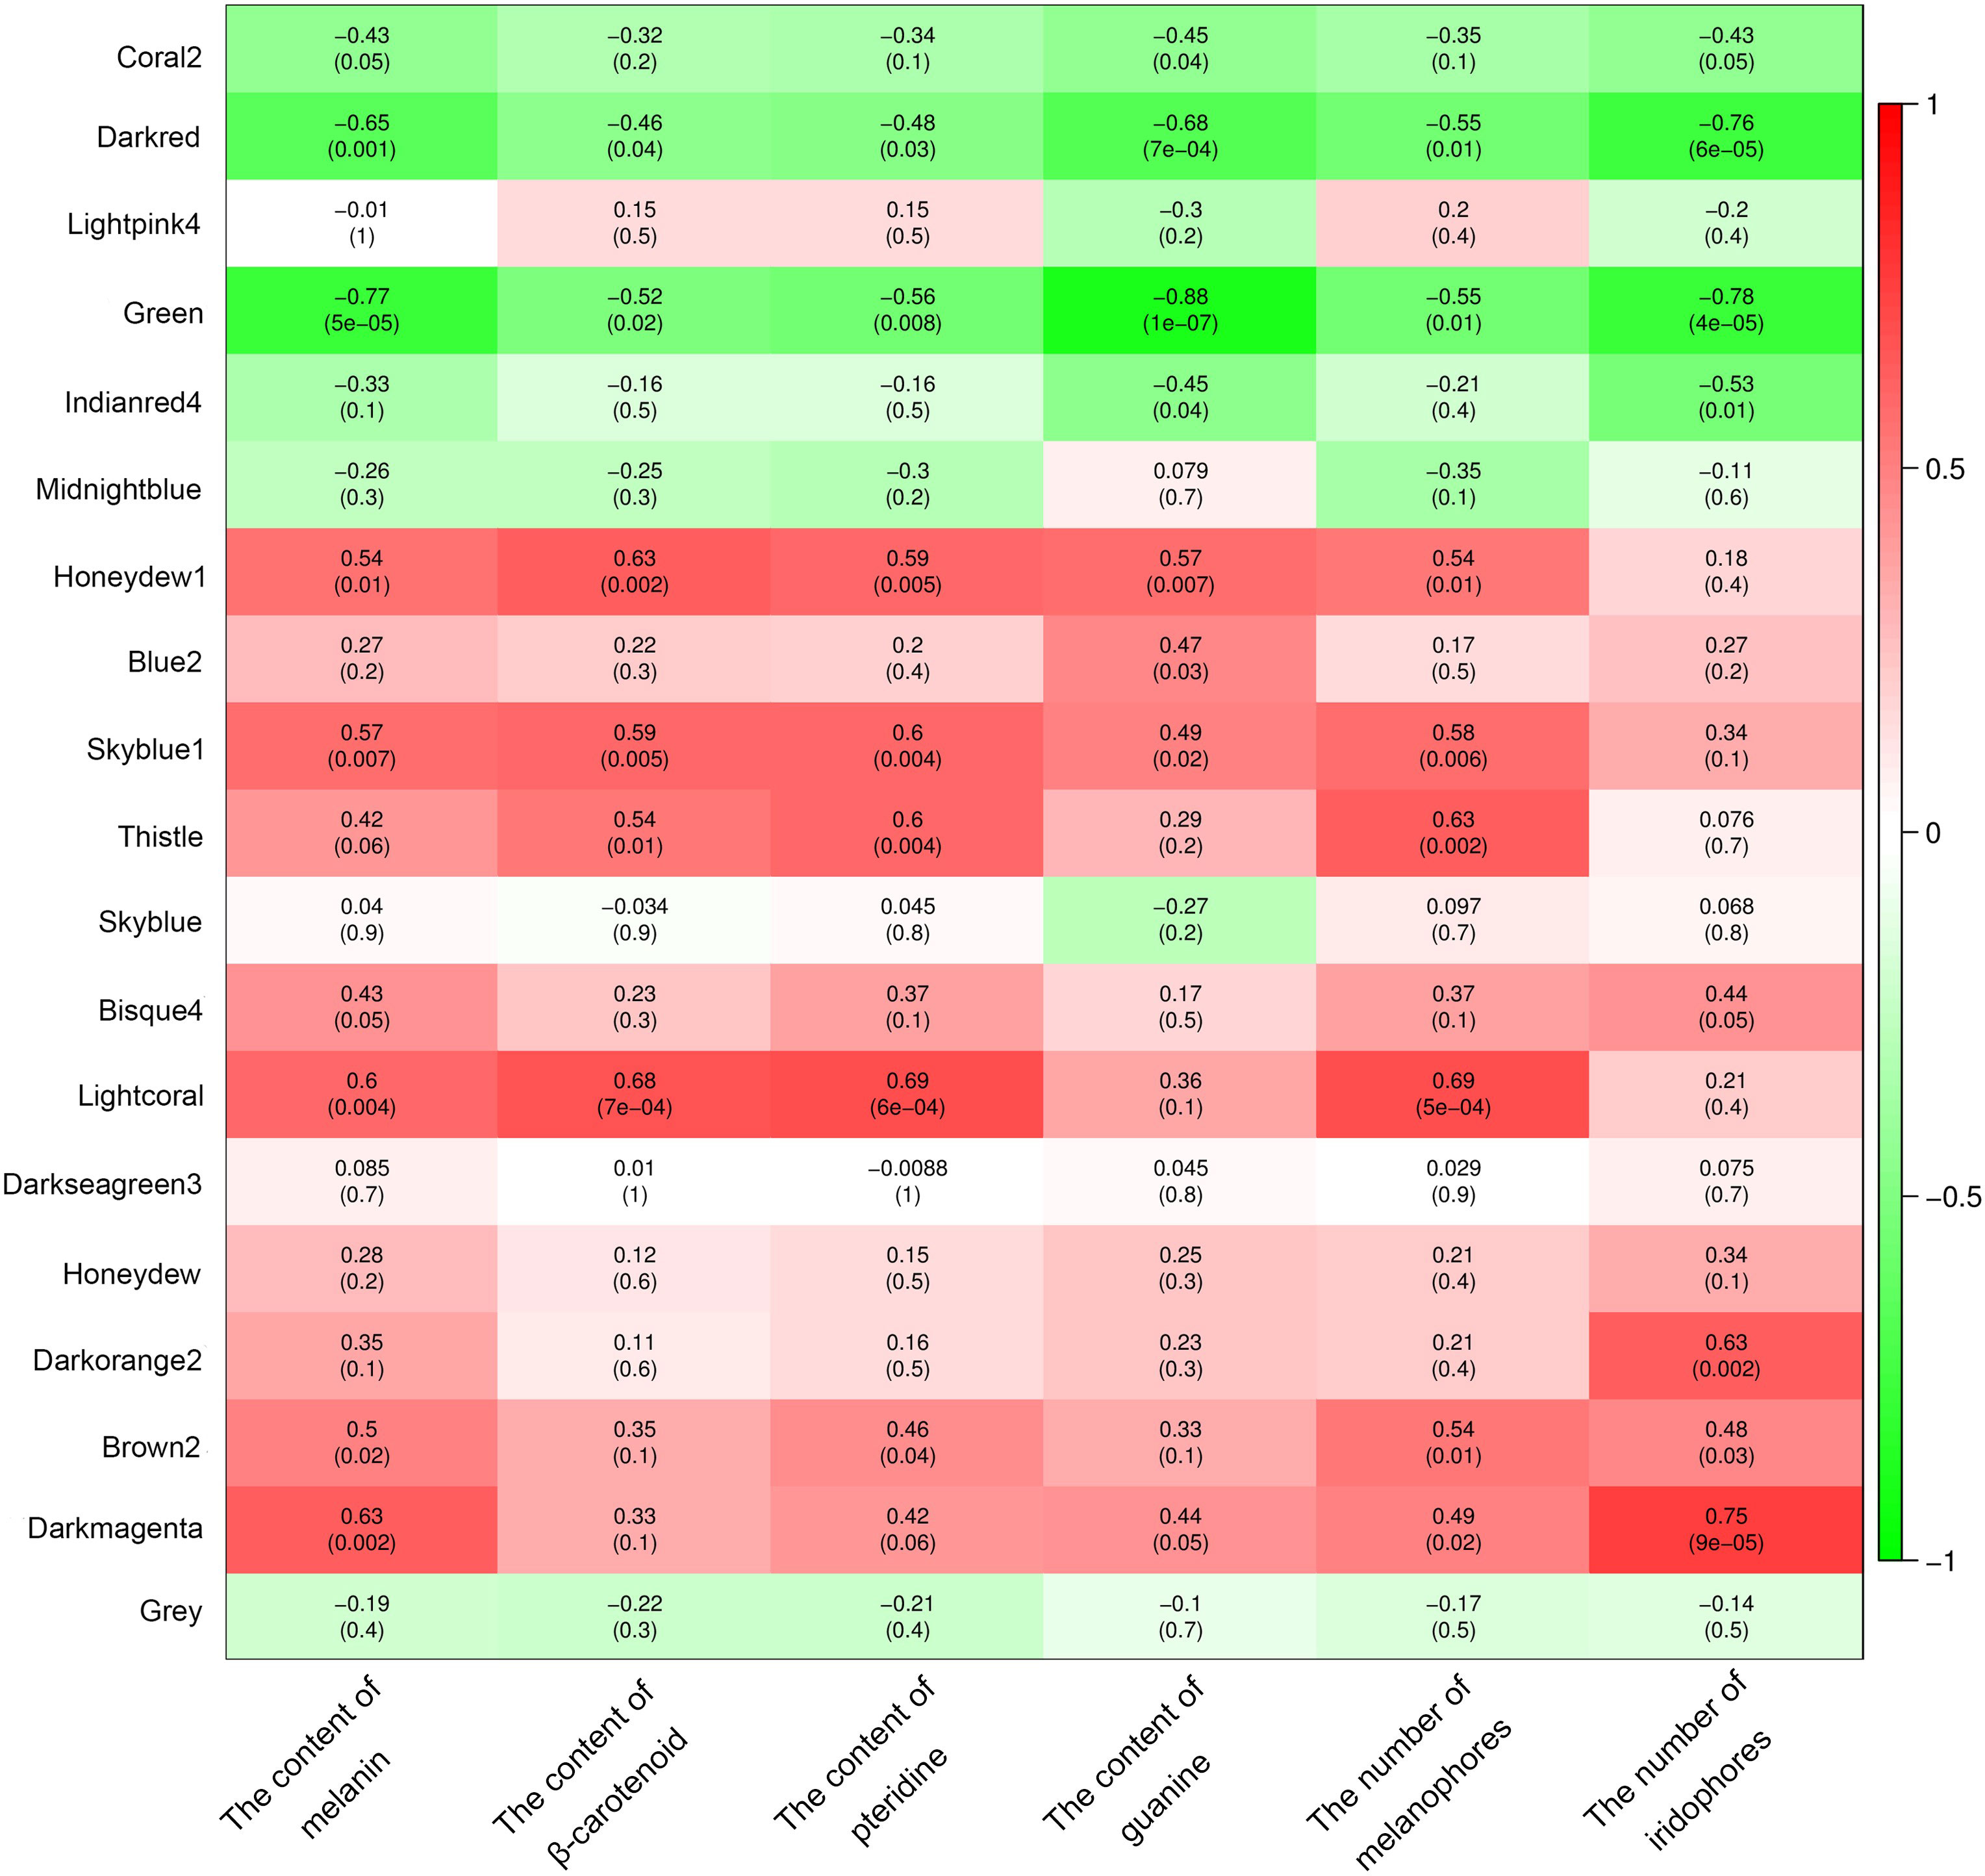
Figure 6 Relationships between modules and chromatophores/pigments. The color scale on the right shows module-trait correlation coefficients from -1 (green) to 1 (red), indicating low to high correlations. The numbers in brackets represent the P value.
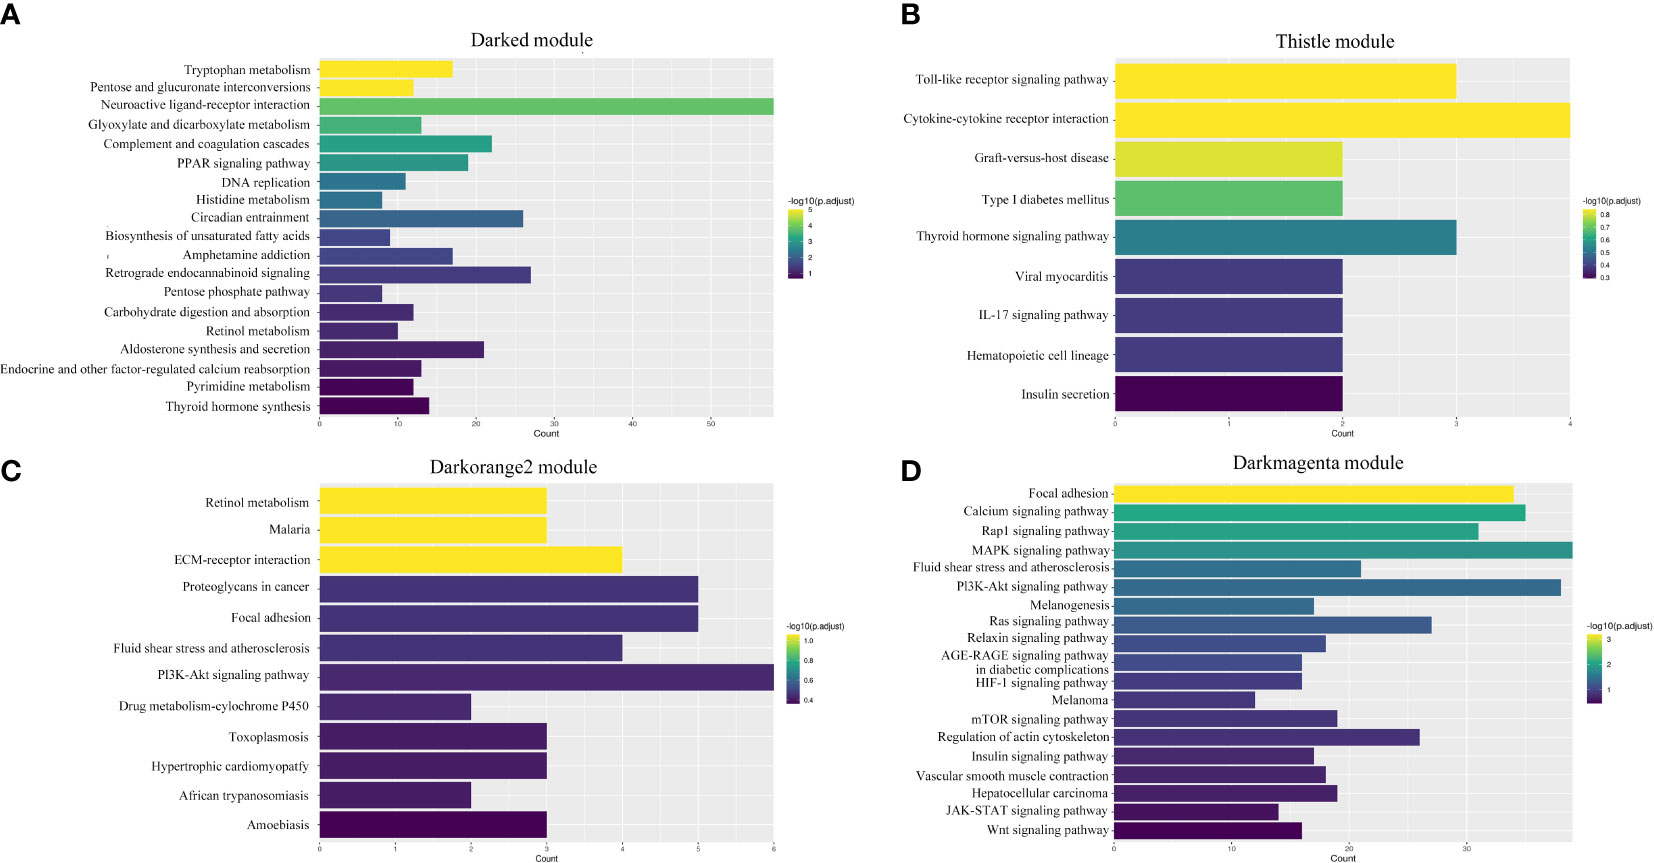
Figure 7 Enrichment analyses of four significant modules. (A) Darked module; (B) Thistle module; (C) Darkorange2 module; (D) Darkmagenta module.
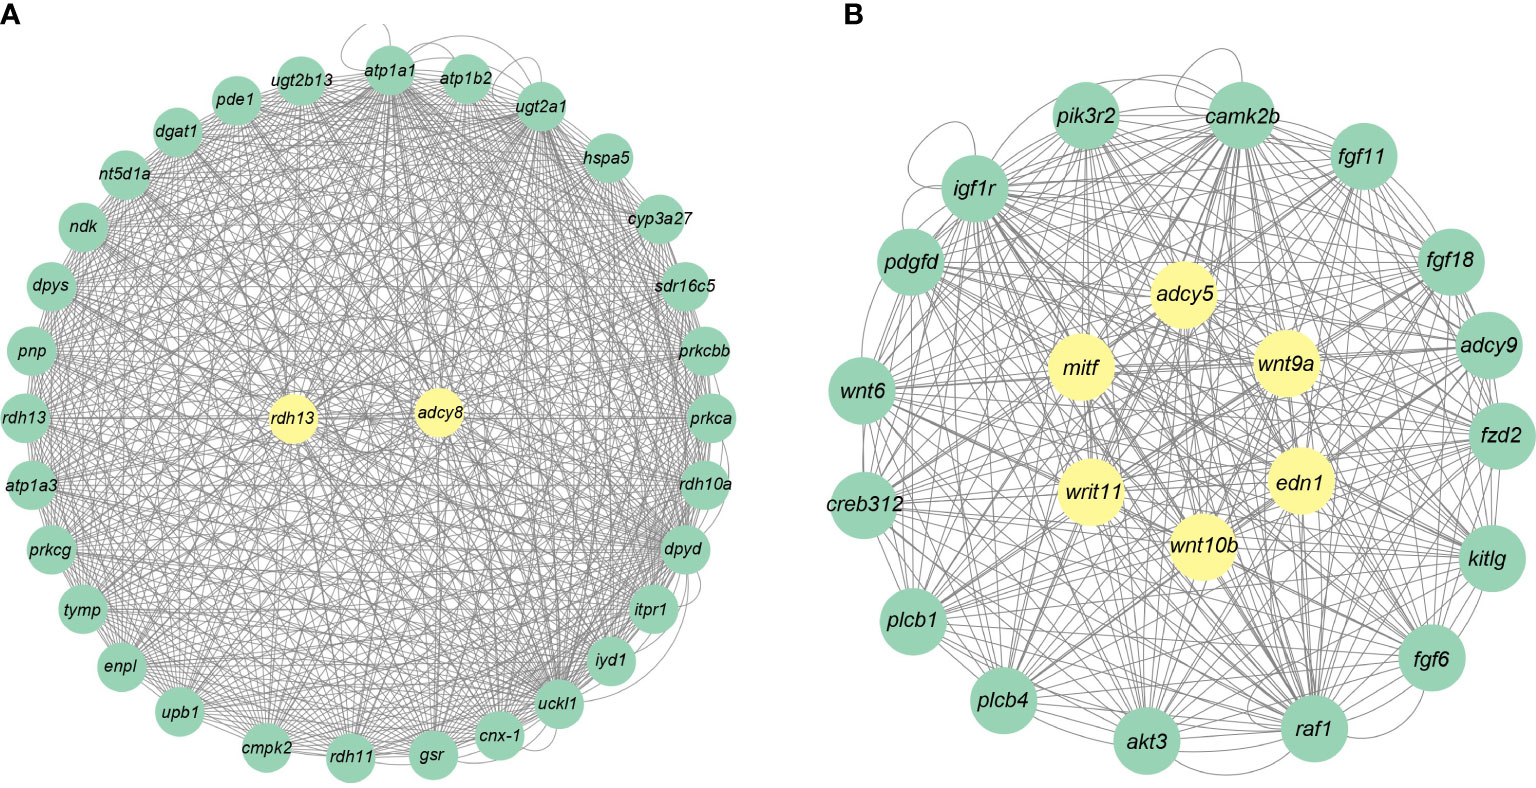
Figure 8 Gene co-expression networks for the darked and darkmagenta modules. (A) Darked module; (B) Darkmagenta module.
4 Discussion
4.1 Changes in chromatophores and pigments along with body color formation
This study aimed to characterize changes in chromatophores and pigments at various developmental stages of S. taeniatus. Chromatophores as a complex palette form the skin colors and color patterns in fish (Sköld et al., 2016). Three types of chromatophores, black melanophore, yellow xanthophore, and silvery or blue iridophore were identified in S. taeniatus. These chromatophores form three monolayers, with iridophores on the top layer, melanophores in the middle layer, and xanthophores on the bottom layer. The appearance of melanophores on the head and base of the ventral fin was observed at 3 dpf followed by iridophores at 4 dpf and xanthophores at 5 dpf. In comparison, zebrafish displays melanophores, xanthophores and iridophores around 30 h postfertilization (hpf), 42 hpf, and 48 hpf, respectively (Kelsh, 2004). In Nile tilapia, melanophores were first observed during embryonic stages, followed by xanthophores, iridophores, and erythrophores at 6 dpf, 8 dpf, and 50 dpf, respectively (Wang et al., 2021). In summary, it can be known that the emergence of chromatophores in fish is species-specific.
Chromatophores’ density and distribution determine the body colors and patterns (Olsson et al., 2013). In the case of S. taeniatus, the larval and juvenile stages exhibit a translucence color due to the low pigmentation in most regions. The body colors of S. taeniatus are not fully developed until 12 mpf, with high concentrations of pigments such as melanin, guanine, pteridine, and carotenoid at this stage. This suggests that S. taeniatus takes longer to develop its body colors compared to other teleosts, such as the juvenile crucian carp (Liu et al., 2016) and Nile tilapia (Wang et al., 2021), which already exhibit adult-like coloration. In nature, species often develop unique phenotypic traits in response to their environment. The translucence color in S. taeniatus may serve as a camouflage strategy under ambient light conditions, reducing the animal’s silhouette and allowing it to evade predators (Zylinski and Johnsen, 2011). However, further studies are required to confirm this hypothesis.
4.2 Key pathways and genes involved in melanin-associated pigmentation
To elucidate the mechanisms of pigmentation in S. taeniatus, RNA-seq was conducted at seven developmental stages (3 dpf, 15 dpf, 1 mpf, 3 mpf, 6 mpf, 9 mpf, and 12 mpf). The analysis revealed significant enrichment of in the tyrosine metabolism, Wnt signaling pathway, thyroid hormone synthesis, and thyroid hormone signaling pathway. Previous studies have linked the tyrosine metabolism pathway to melanin-based pigmentation in fish, which comprises genes such as tyr, tyrp1, hpdb, hgd, dct, and fah (Gan et al., 2021; Wu et al., 2022). Among these genes, tyr is a key regulator that determines the rate of melanin production (Cooksey et al., 1997), and tyrp1 plays a crucial role in the catalysis of melanin synthesis (Burgoyne et al., 2015). Notably, in larval S. taeniatus, the expression of tyr and tyrp1 decreased at 15 dpf and 30 dpf as compared to 3 dpf, indicating early inhibition of melanin synthesis, consistent with the small number of melanophores observed in the larvae. However, in the later stage of development, particularly at 12 mpf, there was a significant increase in melanophore numbers. Our findings indicate that the Wnt signaling pathway plays a dominant role in regulating melanocyte differentiation and pigmentation in fish (Yamada et al., 2010; Lim and Nusse, 2013; Takeo et al., 2016). Specifically, we observed an increase in wnt5b expression at 12 mpf, while wnt10b expression decreased. In a hybrid grouper, wnt5b expression was downregulated in the albino type compared to the wild type (Zhou et al., 2022), whereas wnt10b was found to be higher in the albino type of Astronotus ocellatus (Wang Q. et al., 2022). These results suggest that wnt5b has a positive effect on melanocyte differentiation, while wnt10b has the opposite effect. Additionally, our study revealed that wnt7b and wnt11 were upregulated and downregulated in 12 mpf, respectively, indicating their involvement in the terminal differentiation of melanocytes in S. taeniatus. However, the role of wnt7b and wnt11 in pigmentation in other teleosts remains unknown, and further studies are needed to clarify their function. Furthermore, our WGCNA results identified wnt 9a, wnt10b, and wnt11 as central regulators of pigmentation, closely associated with other pigmentation-related genes such as mitfa, adcy5, and edn1. Nevertheless, the regulatory roles of the wnt gene family in other pigmentation genes require further investigation.
Mitf is a crucial activator of pigmentation genes, such as tyr, tyrp1, and mc1r, and plays a vital regulatory role in melanocyte development, proliferation, survival, and melanin synthesis (Vachtenheim and Borovanský, 2010). Our study revealed high expression levels of mitf at 6 and 9 mpf, suggesting its involvement in melanogenesis during the adult stage of S. taeniatus. A similar expression pattern was observed in the rb1 gene. Studies have shown that Rb1 stimulated melanogenesis via Pka/Creb/Mitf signaling in humans (Lin et al., 2014). However, it remains unclear whether an interaction exists between mitfa and rb1 in fish, and further research is needed to elucidate their relationship.
The thyroid hormone plays a critical role in regulating fish pigmentation by controlling pigment cell development and patterning (McMenamin et al., 2014). In zebrafish, the absence of thyroid hormone leads to an increase in melanophore numbers and a loss of visible xanthophore and carotenoid pigments in the xanthophore (Saunders et al., 2019). Similarly, in clownfish (Amphiprion percula), the thyroid hormone regulates iridophore stripe formation and promotes the expression of duox, a gene involved in iridophore development (Salis et al., 2021). Our WGCNA study found that the thyroid hormone synthesis pathway in S. taeniatus was closely related to melanophore numbers and melanin accumulation, while the thyroid hormone signaling pathway was associated with melanophore numbers and pteridine accumulation. However, the genes involved in the thyroid hormone pathway for pigmentation in fish remain poorly understood. Previous studies in zebrafish have shown that adcy3 and adcy5 play a role in melanosome dispersion and melanocyte stripe formation (Zhang et al., 2022). Our WGCNA results identified adcy5 and adcy8 as hub genes in pigmentation of S. taeniatus. Furthermore, we observed significant changes in the expression of adcy3, adcy5, and adcy8 during color formation, and these three genes were significantly enriched in thyroid hormone synthesis (Supplementary Table A.4). Therefore, we suggest that adcy3, adcy5, and adcy8 may play an essential role in pigmentation regulated by thyroid hormone. Our findings provide insights into the regulatory mechanisms of thyroid hormone on fish pigmentation. Furthermore, the thyroid hormone serves as a crucial endocrine factor that contributes to the process of metamorphosis in teleosts, which involves irreversible changes in both morphology and physiology from larvae to juvenile stages (McMenamin and Parichy, 2013). During the metamorphic stage of fish, the levels of thyroxine (T4) and triiodothyronine (T3) increase, along with markers of gene expression, such as thyroglobulin (tg), thyrotropin (tshb), deiodinase 2 (dio2) (Campinho, 2019). In our study, we observed a significant upregulation of tg expression at 6 mpf and 9 mpf (Supplementary Table A.4; gene ID: Sin0120320). This finding suggests that the thyroid hormone signaling pathway not only plays a crucial role in pigmentation but also contributes to the process of metamorphosis in S. taeniatus. However, considering that thyroid hormone levels must be tightly regulated within the body, further research is necessary to elucidate the simultaneous functioning of thyroid hormones in various physiological processes.
4.3 Key pathways and genes involved in non-melanin-associated pigmentation
Fish have more complex mechanisms of pigmentation than mammals due to their possession of multiple pigment cell types, unlike mammals that only have one type (melanophore). However, compared to melanin-based pigmentation, fewer studies have focused on regulatory pathways underlying non-melanin-associated pigmentation. In our study, WGCNA results showed that the retinol metabolism pathway was also highly related to pigmentation. KEGG analyses showed that carotenoid-associated genes, such as beta-carotene oxygenase 1 (bco1), were significantly enriched in this pathway. Studies on salmon have shown that bco1 and bco2 expression are significantly associated with the red coloration of flesh (Helgeland et al., 2019; Lehnert et al., 2019). In S. taeniatus, bco1 was observed to be highly expressed at 1 mpf, indicating its involvement in carotenoid-based pigmentation during the larval stage. However, at the adult stage, despite the increased generation of xanthophores, the expression of bco1 significantly decreased in S. taeniatus. We suggest that adult S. taeniatus are more likely to absorb carotenoids from their foods. However, we did not observe any significant expression changes in the expression of bco2 concerning body coloration in S. taeniatus. Xanthophores are responsible for the synthesis and storage of both carotenoids and pteridines. Xdh is a key enzyme responsible for pteridine biosynthesis (Ziegler, 2003). Studies on Carassius auratus have identified xdh as a key driver of variation in skin color (Zhang et al., 2017). In our study, xdh was observed to have a high expression level at the early stage of S. taeniatus, coinciding with the accumulation of xanthophores. However, we did not find any reported genes involved in pteridine-based pigmentation with a high expression level during later developmental stages, despite the high levels of pteridine accumulation. Therefore, we speculate that some novel genes may participate in pteridine-based pigmentation during late stages, and further studies are needed to explore new functional genes.
Iridophores reflect light through platelets derived from guanine to generate iridescent colors. In our study, we observed the expression changes of genes in the purine metabolism pathway were observed accompanying body color formation in S. taeniatus. The purine nucleoside phosphorylase (pnp) gene family (i.e., pnp4a, pnp4b, pnp5a, pnp5b, and pnp6) occupied a major part of the purine metabolism pathway. However, these genes exhibited distinct gene expression patterns at different developmental stages of S. taeniatus. Pnp5a and pnp6 had a high expression level during larval/early stages, while pnp4a, pnp4b, and pnp5b were primarily expressed during late stages. This suggests that genes of pnp family may play different roles in the stage-specific pigmentation of S. taeniatus. Previous studies have shown that pnp4a knockout leads to a significant decrease in iridophores, indicating its important role in iridophores-based pigmentation (Kimura et al., 2017). Transcriptome analysis of a body color mutant showed that pnp5a is involved in the pigmentation of a carp-goldfish hybrid (Zhou et al., 2019). However, the roles of pnp4b, pnp5b, and pnp6 in pigmentation are unclear in fish. Further study is required to reveal the function of pnp genes in pigmentation and elucidate the relationship between these genes.
5 Conclusion
In this study, we examined the changes in chromatophores and pigments associated with body color formation in S. taeniatus. We identified key pathways and genes involved in pigmentation using transcriptome analyses, which will provide valuable information for studying the molecular mechanisms underlying body pigmentation in teleosts. However, further research is necessary to investigate how pigmentation genes interact in a coordinated manner to regulate body color formation.
Data availability statement
The datasets presented in this study can be found in online repositories. The names of the repository/repositories and accession number(s) can be found in the article/Supplementary Material.
Ethics statement
The animal study was reviewed and approved by Institutional Animal Care and Use Committee of Southwest University.
Author contributions
ZW and DY conceived and designed the study. DY, XL, and SW collected the samples. LW, LC, and RT raised and managed the experimental fish. XL, SW, and JL performed the molecular experiments. HW, DY, and ZZ performed the bioinformatics analysis. DY, XL, and SW wrote the manuscript. All authors read and approved the final manuscript for submission.
Funding
This work was supported by the Fundamental Research Funds for the Central Universities (Grant No. SWU-KQ22016).
Acknowledgments
We gratefully acknowledge the helpful suggestions of Dr. Chenxu Wang and Dr. Baoyue Lu.
Conflict of interest
The authors declare that the research was conducted in the absence of any commercial or financial relationships that could be construed as a potential conflict of interest.
Publisher’s note
All claims expressed in this article are solely those of the authors and do not necessarily represent those of their affiliated organizations, or those of the publisher, the editors and the reviewers. Any product that may be evaluated in this article, or claim that may be made by its manufacturer, is not guaranteed or endorsed by the publisher.
Supplementary material
The Supplementary Material for this article can be found online at: https://www.frontiersin.org/articles/10.3389/fmars.2023.1202846/full#supplementary-material
References
Burgoyne T., O’Connor M. N., Seabra M. C., Cutler D. F., Futter C. E. (2015). Regulation of melanosome number, shape and movement in the zebrafish retinal pigment epithelium by OA1 and PMEL. J. Cell Sci. 128, 1400–1407. doi: 10.1242/jcs.164400
Cal L., Suarez-Bregua P., Cerdá-Reverter J. M., Braasch I., Rotllant J. (2017). Fish pigmentation and the melanocortin system. Comp. Biochem. Phys. A. 211, 26–33. doi: 10.1016/j.cbpa.2017.06.001
Campinho M. A. (2019). Teleost metamorphosis: the role of thyroid hormone. Front. Endocrinol. 10. doi: 10.3389/fendo.2019.00383
Chen S., Zhou Y., Chen Y., Gu J. (2018). Fastp: an ultra-fast all-in-one FASTQ preprocessor. Bioinformatics 34, i884–i890. doi: 10.1093/bioinformatics/bty560
Cooksey C. J., Garratt P. J., Land E. J., Pavel S., Ramsden C. A., Riley P. A., et al. (1997). Evidence of the indirect formation of the catecholic intermediate substrate responsible for the autoactivation kinetics of tyrosinase. J. Biol. Chem. 272, 26226–26235. doi: 10.1074/jbc.272.42.26226
Cuthill I. C., Allen W. L., Arbuckle K., Caspers B., Chaplin G., Hauber M. E., et al. (2017). The biology of color. Science 357, eaan0221. doi: 10.1126/science.aan0221
D’Agati G., Beltre R., Sessa A., Burger A., Zhou Y., Mosimann C., et al. (2017). A defect in the mitochondrial protein Mpv17 underlies the transparent casper zebrafish. Dev. Biol. 430, 11–17. doi: 10.1016/j.ydbio.2017.07.017
Dijkstra P. D., Maguire S. M., Harris R. M., Rodriguez A. A., DeAngelis R. S., Flores S. A., et al. (2017). The melanocortin system regulates body pigmentation and social behaviour in a colour polymorphic cichlid fish. Proc. R. Soc. B. 284, 20162838. doi: 10.1098/rspb.2016.2838
Du J., Widlund H. R., Horstmann M. A., Ramaswamy S., Ross K., Huber W. E., et al. (2004). Critical role of CDK2 for melanoma growth linked to its melanocyte-specific transcriptional regulation by MITF. Cancer Cell. 6, 565–576. doi: 10.1016/j.ccr.2004.10.014
Gan W., Chung-Davidson Y.-W., Chen Z., Song S., Cui W., He W., et al. (2021). Global tissue transcriptomic analysis to improve genome annotation and unravel skin pigmentation in goldfish. Sci. Rep. 11, 1–14. doi: 10.1038/s41598-020-80168-6
Goda M., Fujiyoshi Y., Sugimoto M., Fujii R. (2013). Novel dichromatic chromatophores in the integument of the mandarin fish Synchiropus splendidus. Biol. Bull. 224, 14–17. doi: 10.1086/BBLv224n1p14
Helgeland H., Sodeland M., Zoric N., Torgersen J. S., Grammes F., von Lintig J., et al. (2019). Genomic and functional gene studies suggest a key role of beta-carotene oxygenase 1 like (bco1l) gene in salmon flesh color. Sci. Rep. 9, 20061. doi: 10.5061/dryad.n2z34tmsb
Hubbard J. K., Uy J. A. C., Hauber M. E., Hoekstra H. E., Safran R. J. (2010). Vertebrate pigmentation: from underlying genes to adaptive function. Trends Genet. 26, 231–239. doi: 10.1016/j.tig.2010.02.002
Irion U., Nüsslein-Volhard C. (2019). The identification of genes involved in the evolution of color patterns in fish. Curr. Opin. Genet. Dev. 57, 31–38. doi: 10.1016/j.gde.2019.07.002
Irion U., Singh A. P., Nüsslein-Volhard C. (2016). The developmental genetics of vertebrate color pattern formation: lessons from zebrafish. Curr. Top. Dev. Biol. 117, 141–169. doi: 10.1016/bs.ctdb.2015.12.012
Kelsh R. N. (2004). Genetics and evolution of pigment patterns in fish. Pigm. Cell Res. 17, 326–336. doi: 10.1111/j.1600-0749.2004.00174.x
Kelsh R. N., Inoue C., Momoi A., Kondoh H., Furutani-Seiki M., Ozato K., et al. (2004). The tomita collection of medaka pigmentation mutants as a resource for understanding neural crest cell development. Mech. Dev. 121, 841–859. doi: 10.1016/j.mod.2004.01.004
Kenny C., Dilshat R., Seberg H. E., Van Otterloo E., Bonde G., Helverson A., et al. (2022). TFAP2 paralogs facilitate chromatin access for MITF at pigmentation and cell proliferation genes. PloS Genet. 18, e1010207. doi: 10.1371/journal.pgen.1010207
Kim D., Paggi J. M., Park C., Bennett C., Salzberg S. L. (2019). Graph-based genome alignment and genotyping with HISAT2 and HISAT-genotype. Nat. Biotechnol. 37, 907–915. doi: 10.1038/s41587-019-0201-4
Kimura T., Takehana Y., Naruse K. (2017). pnp4a is the causal gene of the medaka iridophore mutant guanineless. G3: Genes Genom. Genet. 7, 1357–1363. doi: 10.1534/g3.117.040675
Langfelder P., Horvath S. (2008). WGCNA: an R package for weighted correlation network analysis. BMC Bioinf. 9, 1–13. doi: 10.1186/1471-2105-9-559
Lapedriza A., Petratou K., Kelsh R. N. (2014). Neural crest cells and pigmentation. Neural Crest. Cells, 287–311. doi: 10.1016/B978-0-12-401730-6.00015-6
Leclercq E., Taylor J. F., Migaud H. (2010). Morphological skin colour changes in teleosts. Fish Fish. 11, 159–193. doi: 10.1111/j.1467-2979.2009.00346.x
Le Guyader S., Maier J., Jesuthasan S. (2005). Esrom, an ortholog of PAM (protein associated with c-myc), regulates pteridine synthesis in the zebrafish. Dev. Biol. 277, 378–386. doi: 10.1016/j.ydbio.2004.09.029
Lehnert S., Christensen K., Vandersteen W., Sakhrani D., Pitcher T., Heath J., et al. (2019). Carotenoid pigmentation in salmon: variation in expression at BCO2-l locus controls a key fitness trait affecting red coloration. Proc. R. Soc. B. 286, 20191588. doi: 10.1098/rspb.2019.1588
Li B., Dewey C. N. (2011). RSEM: accurate transcript quantification from RNA-seq data with or without a reference genome. BMC Bioinf. 12, 1–16. doi: 10.1186/1471-2105-12-323
Lim X., Nusse R. (2013). Wnt signaling in skin development, homeostasis, and disease. CSH Perspect. Biol. 5, a008029. doi: 10.1101/cshperspect.a008029
Lin M., Zhang B.-X., Zhang C., Shen N., Zhang Y.-Y., Wang A.-X., et al. (2014). Ginsenosides Rb1 and Rg1 stimulate melanogenesis in human epidermal melanocytes via PKA/CREB/MITF signaling. Evid. Based Compl. Alt. 2014, 892073. doi: 10.1155/2014/892073
Lister J. A. (2019). Larval but not adult xanthophore pigmentation in zebrafish requires GTP cyclohydrolase 2 (gch2) function. Pigment Cell Melanoma Res. 32, 724–727. doi: 10.1111/pcmr.12783
Liu J. J., Fisher D. E. (2010). Lighting a path to pigmentation: mechanisms of MITF induction by UV. Pigment Cell Melanoma Res. 23, 741–745. doi: 10.1111/j.1755-148X.2010.00775.x
Liu J., Zhang Y., Gui S., Liu W., Xiao J., Xiao Y. (2016). Observation and regression models on body colour inheritance and development in crucian carp and carp. Aquacult. Int. 24, 1191–1199. doi: 10.1007/s10499-016-9979-y
Love M. I., Huber W., Anders S. (2014). Moderated estimation of fold change and dispersion for RNA-seq data with DESeq2. Genome Biol. 15, 1–21. doi: 10.1186/s13059-014-0550-8
Lu B., Liang G., Xu M., Wang C. X., Tan D. J., Tao W. J., et al. (2022). Production of all male amelanotic red tilapia by combining MAS-GMT and tyrb mutation. Aquaculture 546, 737327. doi: 10.1016/j.aquaculture.2021.737327
Luo M., Lu G., Yin H., Wang L., Atuganile M., Dong Z. (2021). Fish pigmentation and coloration: molecular mechanisms and aquaculture perspectives. Rev. Aquacult. 13, 2395–2412. doi: 10.1111/raq.12583
Lynn Lamoreux M., Kelsh R. N., Wakamatsu Y., Ozato K. (2005). Pigment pattern formation in the medaka embryo. Pigment Cell Res. 18, 64–73. doi: 10.1111/j.1600-0749.2005.00216.x
McGill G. G., Horstmann M., Widlund H. R., Du J., Motyckova G., Nishimura E. K., et al. (2002). Bcl2 regulation by the melanocyte master regulator mitf modulates lineage survival and melanoma cell viability. Cell 109, 707–718. doi: 10.1016/S0092-8674(02)00762-6
McMenamin S. K., Bain E. J., McCann A. E., Patterson L. B., Eom D. S., Waller Z. P., et al. (2014). Thyroid hormone–dependent adult pigment cell lineage and pattern in zebrafish. Science 345, 1358–1361. doi: 10.1126/science.1256251
McMenamin S. K., Parichy D. M. (2013). Metamorphosis in teleosts. Curr. Top. Dev. Biol. 103, 127–165. doi: 10.1016/B978-0-12-385979-2.00005-8
Minchin J. E., Hughes S. M. (2008). Sequential actions of Pax3 and Pax7 drive xanthophore development in zebrafish neural crest. Dev. Biol. 317, 508–522. doi: 10.1016/j.ydbio.2008.02.058
Nord H., Dennhag N., Muck J., von Hofsten J. (2016). Pax7 is required for establishment of the xanthophore lineage in zebrafish embryos. Mol. Biol. Cell. 27, 1853–1862. doi: 10.1091/mbc.e15-12-0821
Olsson M., Stuart-Fox D., Ballen C. (2013). Genetics and evolution of colour patterns in reptiles. Semin. Cell Dev. Biol. 24 (6-7), 529–541. doi: 10.1016/j.semcdb.2013.04.001
Patterson L. B., Parichy D. M. (2019). Zebrafish pigment pattern formation: insights into the development and evolution of adult form. Annu. Rev. Genet. 53, 505–530. doi: 10.1146/annurev-genet-112618-043741
Quigley I. K., Parichy D. M. (2002). Pigment pattern formation in zebrafish: a model for developmental genetics and the evolution of form. Microsc. Res. Techniq. 58, 442–455. doi: 10.1002/jemt.10162
Rawls J. F., Mellgren E. M., Johnson S. L. (2001). How the zebrafish gets its stripes. Dev. Biol. 240 (2), 301–314. doi: 10.1006/dbio.2001.0418
Salis P., Lorin T., Laudet V., Frédérich B. (2019). Magic traits in magic fish: understanding color pattern evolution using reef fish. Trends Genet. 35, 265–278. doi: 10.1016/j.tig.2019.01.006
Salis P., Roux N., Huang D., Marcionetti A., Mouginot P., Reynaud M., et al. (2021). Thyroid hormones regulate the formation and environmental plasticity of white bars in clownfishes. P. Natl. Acad. Sci. U.S.A. 118, e2101634118. doi: 10.1073/pnas.2101634118
Saunders L. M., Mishra A. K., Aman A. J., Lewis V. M., Toomey M. B., Packer J. S., et al. (2019). Thyroid hormone regulates distinct paths to maturation in pigment cell lineages. Elife 8, e45181. doi: 10.7554/eLife.45181
Schartl M., Larue L., Goda M., Bosenberg M. W., Hashimoto H., Kelsh R. N. (2016). What is a vertebrate pigment cell? Pigment Cell Melanoma Res. 29, 8–14. doi: 10.1111/pcmr.12409
Shannon P., Markiel A., Ozier O., Baliga N. S., Wang J. T., Ramage D., et al. (2003). Cytoscape: a software environment for integrated models of biomolecular interaction networks. Genome Res. 13 (11), 2498–2504. doi: 10.1101/gr.1239303
Singh A. P., Nüsslein-Volhard C. (2015). Zebrafish stripes as a model for vertebrate colour pattern formation. Curr. Biol. 25, R81–R92. doi: 10.1016/j.cub.2014.11.013
Sköld H. N., Aspengren S., Cheney K. L., Wallin M. (2016). Fish chromatophores–from molecular motors to animal behavior. Int. Rev. Cell Mol. Biol. 321, 171–219. doi: 10.1016/bs.ircmb.2015.09.005
Sturm R. A., Teasdale R. D., Box N. F. (2001). Human pigmentation genes: identification, structure and consequences of polymorphic variation. Gene 277, 49–62. doi: 10.1016/S0378-1119(01)00694-1
Takeo M., Lee W., Rabbani P., Sun Q., Hu H., Lim C. H., et al. (2016). EdnrB governs regenerative response of melanocyte stem cells by crosstalk with wnt signaling. Cell Rep. 15, 1291–1302. doi: 10.1016/j.celrep.2016.04.006
Vachtenheim J., Borovanský J. (2010). “Transcription physiology” of pigment formation in melanocytes: central role of MITF. Exp. Dermatol. 19, 617–627. doi: 10.1111/j.1600-0625.2009.01053.x
Wang L. M., Jiang B. J., Zhu W. B., Fu J. J., Luo M. K., Liu W., et al. (2022). The role of melanocortin 1 receptor on melanogenesis pathway in skin color differentiation of red tilapia. Aquacult. Rep. 22, 100946. doi: 10.1016/j.aqrep.2021.100946
Wang Y., Liu Y., Tian J., Yin M., Cai R., Wang Z. (2020). Growth and morphological development of larval and juvenile Sinibrama taeniatus. Prog. Fish Sci. 41, 58–67. doi: 10.19663/j.issn2095-9869.20190627001
Wang C., Lu B., Li T., Liang G., Xu M., Liu X., et al. (2021). Nile Tilapia: a model for studying teleost color patterns. J. Hered. 112, 469–484. doi: 10.1093/jhered/esab018
Wang Q., Zhang Y. S., Peng Q. L., Wen B., Gao J. Z., Chen Z. Z. (2022). Distinct skin morphological and transcriptomic profiles between wild and albino Oscar Astronotus ocellatus. Comp. Biochem. Phys. D. 41, 100944. doi: 10.1016/j.cbd.2021.100944
Wittkopp P. J., Beldade P. (2009). Development and evolution of insect pigmentation: genetic mechanisms and the potential consequences of pleiotropy. Semin. Cell Dev. Biol. 20 (1), 65–71. doi: 10.1016/j.semcdb.2008.10.002
Wu T., Hu E., Xu S., Chen M., Guo P., Dai Z., et al. (2021). clusterProfiler 4.0: a universal enrichment tool for interpreting omics data. Innovation. 2, 100141. doi: 10.1016/j.xinn.2021.100141
Wu S., Huang J., Li Y., Zhao L., Liu Z. (2022). Analysis of yellow mutant rainbow trout transcriptomes at different developmental stages reveals dynamic regulation of skin pigmentation genes. Sci. Rep. 12, 1–17. doi: 10.1038/s41598-021-04255-y
Yamada T., Akamatsu H., Hasegawa S., Inoue Y., Date Y., Mizutani H., et al. (2010). Melanocyte stem cells express receptors for canonical wnt-signaling pathway on their surface. Biochem. Bioph. Res. Co. 396, 837–842. doi: 10.1016/j.bbrc.2010.04.167
Yasumoto K.-i., Yokoyama K., Shibata K., Tomita Y., Shibahara S. (1994). Microphthalmia-associated transcription factor as a regulator for melanocyte-specific transcription of the human tyrosinase gene. Mol. Cell Biol. 14, 8058–8070. doi: 10.1128/mcb.14.12.8058-8070.1994
Yuan D., Chen X., Gu H., Zou M., Zou Y., Fang J., et al. (2020). Chromosomal genome of Triplophysa bleekeri provides insights into its evolution and environmental adaptation. GigaScience 9, giaa132. doi: 10.1093/gigascience/giaa132
Zhang Y., Liu J., Peng L., Ren L., Zhang H., Zou L., et al. (2017). Comparative transcriptome analysis of molecular mechanism underlying gray-to-red body color formation in red crucian carp (Carassius auratus, red var.). Fish Physiol. Biochem. 43, 1387–1398. doi: 10.1007/s10695-017-0379-7
Zhang L., Wan M., Tohti R., Jin D., Zhong T. P. (2022). Requirement of zebrafish Adcy3a and Adcy5 in melanosome dispersion and melanocyte stripe formation. Int. J. Mol. Sci. 23 (22), 14182. doi: 10.3390/ijms232214182
Zhou L., Liang H., Zhou X., Jia J., Ye C., Hu Q., et al. (2019). Genetic characteristic and RNA-seq analysis in transparent mutant of carp–goldfish nucleocytoplasmic hybrid. Genes 10, 704. doi: 10.3390/genes10090704
Zhou K., Zhang K., Fan X., Zhang W., Liang Y., Wen X., et al. (2022). The skin-color is associated with its physiological state: a case study on a colorful variety, hybrid grouper (Epinephelus fuscoguttatus × Epinephelus lanceolatus). Aquaculture 549, 737719. doi: 10.1016/j.aquaculture.2021.737719
Ziegler I. (2003). The pteridine pathway in zebrafish: regulation and specification during the determination of neural crest cell-fate. Pigment Cell Res. 16, 172–182. doi: 10.1034/j.1600-0749.2003.00044.x
Keywords: color formation, chromatophores, pigments, pigmentation gene, Cyprinidae fish
Citation: Yuan D, Liu X, Wang S, Wang H, Li J, Zhao Z, Wei L, Cheng L, Teng R and Wang Z (2023) Identification of key regulatory pathways and genes involved in the dynamic progression of pigmentation in Sinibrama taeniatus. Front. Mar. Sci. 10:1202846. doi: 10.3389/fmars.2023.1202846
Received: 09 April 2023; Accepted: 16 June 2023;
Published: 30 June 2023.
Edited by:
Enric Gisbert, Institute of Agrifood Research and Technology (IRTA), SpainReviewed by:
Mingkun Luo, Nanjing Agricultural University, ChinaPaula Suarez-Bregua, Spanish Institute of Oceanography (IEO), Spain
Copyright © 2023 Yuan, Liu, Wang, Wang, Li, Zhao, Wei, Cheng, Teng and Wang. This is an open-access article distributed under the terms of the Creative Commons Attribution License (CC BY). The use, distribution or reproduction in other forums is permitted, provided the original author(s) and the copyright owner(s) are credited and that the original publication in this journal is cited, in accordance with accepted academic practice. No use, distribution or reproduction is permitted which does not comply with these terms.
*Correspondence: Zhijian Wang, d2FuZ3pqMTk2OUAxMjYuY29t
†These authors have contributed equally to this work and share first authorship