 Tianran Hua1†
 Guanqiong Ye
- 1Ocean College, Zhejiang University, Zhoushan, Zhejiang, China
- 2Renmin Law School, Renmin University of China, Beijing, China
- 3College of Ocean and Earth Sciences, Xiamen University, Xiamen, Fujian, China
- 4Hainan Institute of Zhejiang University, Sanya, Hainan, China
Strengthening scientific research, technological capacity and sustainable use of oceans in developing countries are the goals of the UN’s 2030 Agenda for Sustainable Development. Marine science and education as the key foundation for achieving these goals has been seldom evaluated quantitatively and collectively. This paper adopted the DEA modelling from economics for analyzing the long-term input and output performance of marine science and education at a national scale in China both by region and discipline. It is found that China’s marine science and education level has been improving annually in the last decade. The input/output efficiency of science and education in 11 coastal provinces however has slightly declined except Guangdong. The input/output performance among 14 research disciplines was further evaluated and was found the similar improving trends. The input/output efficiency of 70% research disciplines showed an increasing trend while 30% of which showed a slightly declining trend. The results could provide important references for prioritizing the science and education resources allocation both in different coastal regions and marine research disciplines to save the investment and achieve more progress.
1 Introduction
The 2030 Agenda for Sustainable Development requires enhancing scientific research over the next 14 years, upgrading the technological capabilities of industrial sectors in all countries, in particular developing countries (United Nations, 2015). UN’s 2030 Agenda for Sustainable Development also lists conserve and sustainably use the oceans, seas and marine resources for sustainable development as a goal (Virto, 2018; Liu and Wang, 2022). Different from traditional industries, human beings highly rely on vehicles and detection tools for the development and utilization of the ocean, so marine science and technology innovation plays an extremely important role for marine economic growth (Doloreux and Melancon, 2009; Noailly and Shestalova, 2017; Heredia et al., 2018; Liu BQ. et al., 2021). The realization of science and technology innovation is mainly driven by the allocation of science and education resources, which requires the government to motivate institutions of scientific research (Zhang et al., 2020). Marine science and education is a system for studying the natural phenomena and change of the ocean, as well as knowledge and training related to the development, utilization and protection of the ocean. As the basic support of marine science and technology, marine science and education are of great significance and the United Nations Decade of Ocean Science for Sustainable Development (2021-2030) was also proposed (Visbeck, 2018; United Nations, 2020). However, marine science and education are commonly lagging behind the development of marine economy (Mokos et al., 2020; Freitas et al., 2022). At the same time, irrational allocation of science and education resources will inevitably lead to a waste of resources and poor achievements (Chen and Qian, 2020). To effectively improve the level of marine science and education, especially how to optimize the allocation of marine science and education resources, has become a problem worthy of attention.
Globally, the ability of marine science and technology innovation has become one of the key areas for major maritime countries to compete for the leading position and voice in the global ocean (Li et al., 2021). At present scholars use stochastic frontier analysis (SFA) (Li et al., 2021), data envelopment analysis (DEA) (Sun et al., 2017; Zhang and Wang, 2021), coupling system (Kong and Liu, 2021; Wang JY. et al., 2021; Liu and Wang, 2022), threshold regression model (Shao, 2020; Liu PD. et al., 2021), set pair analysis (Liu BQ. et al., 2021), global Malmquist-Luenberger index model (Ren et al., 2018; Xia et al., 2019; Ren, 2021), Slacks-Based Measure (SBM) model (Zheng et al., 2020; Kong and Liu, 2021), Cobb-Douglas production function (Zhou et al.,), panel fixed effect model and random effect model (Wang LL. et al., 2021) to carry out beneficial exploration. However, marine science and technology are not equivalent to marine science and education. It seems that the current research focuses on the efficiency of marine science and technology and marine economy, and there is no research on the input/output efficiency of marine science and education. How to improve the investment in marine education to achieve better results in marine scientific and technological deserves further consideration. The influencing factors and improvement paths of the input/output efficiency of marine science and education also need to be further analyzed (Hyvattinen and Hilden, 2004; Andersson et al., 2017). In addition, the research on spatial heterogeneity is relatively complete, while the distinction and comparison of the science and education efficiency in various marine disciplines are not developed enough.
China has been accelerating the pace of marine scientific and technological innovation and improve China’s capability of marine innovation for decades (Wang LL. et al., 2021). However, some scholars have pointed out that, the regional marine S&T innovation capacity is uneven, and the overall marine S&T innovation capacity is not strong (Zheng et al., 2020; Li et al., 2021). This indicates that the industrial transformation efficiency of China’s marine science and education achievements can be further improved to promote the greening of the marine industry in this largest developing country, which is of great importance to global environmental protection. We adopt the DEA modelling from economics for analyzing the long-term input and output performance of marine science and education in China by region and discipline. On this basis, the spatial heterogeneity and discipline heterogeneity of marine science and education are further analyzed, and the corresponding improvement direction is pointed out.
2 Materials and methods
2.1 Index system
Based on administrative division, we divided the study area into 11 parts. In the analysis of marine science and education input/output efficiency by discipline, we divide the marine science and education into 4 categories and 14 sub-categories based on the Classification of Marine Industries and Related industries Table 1.
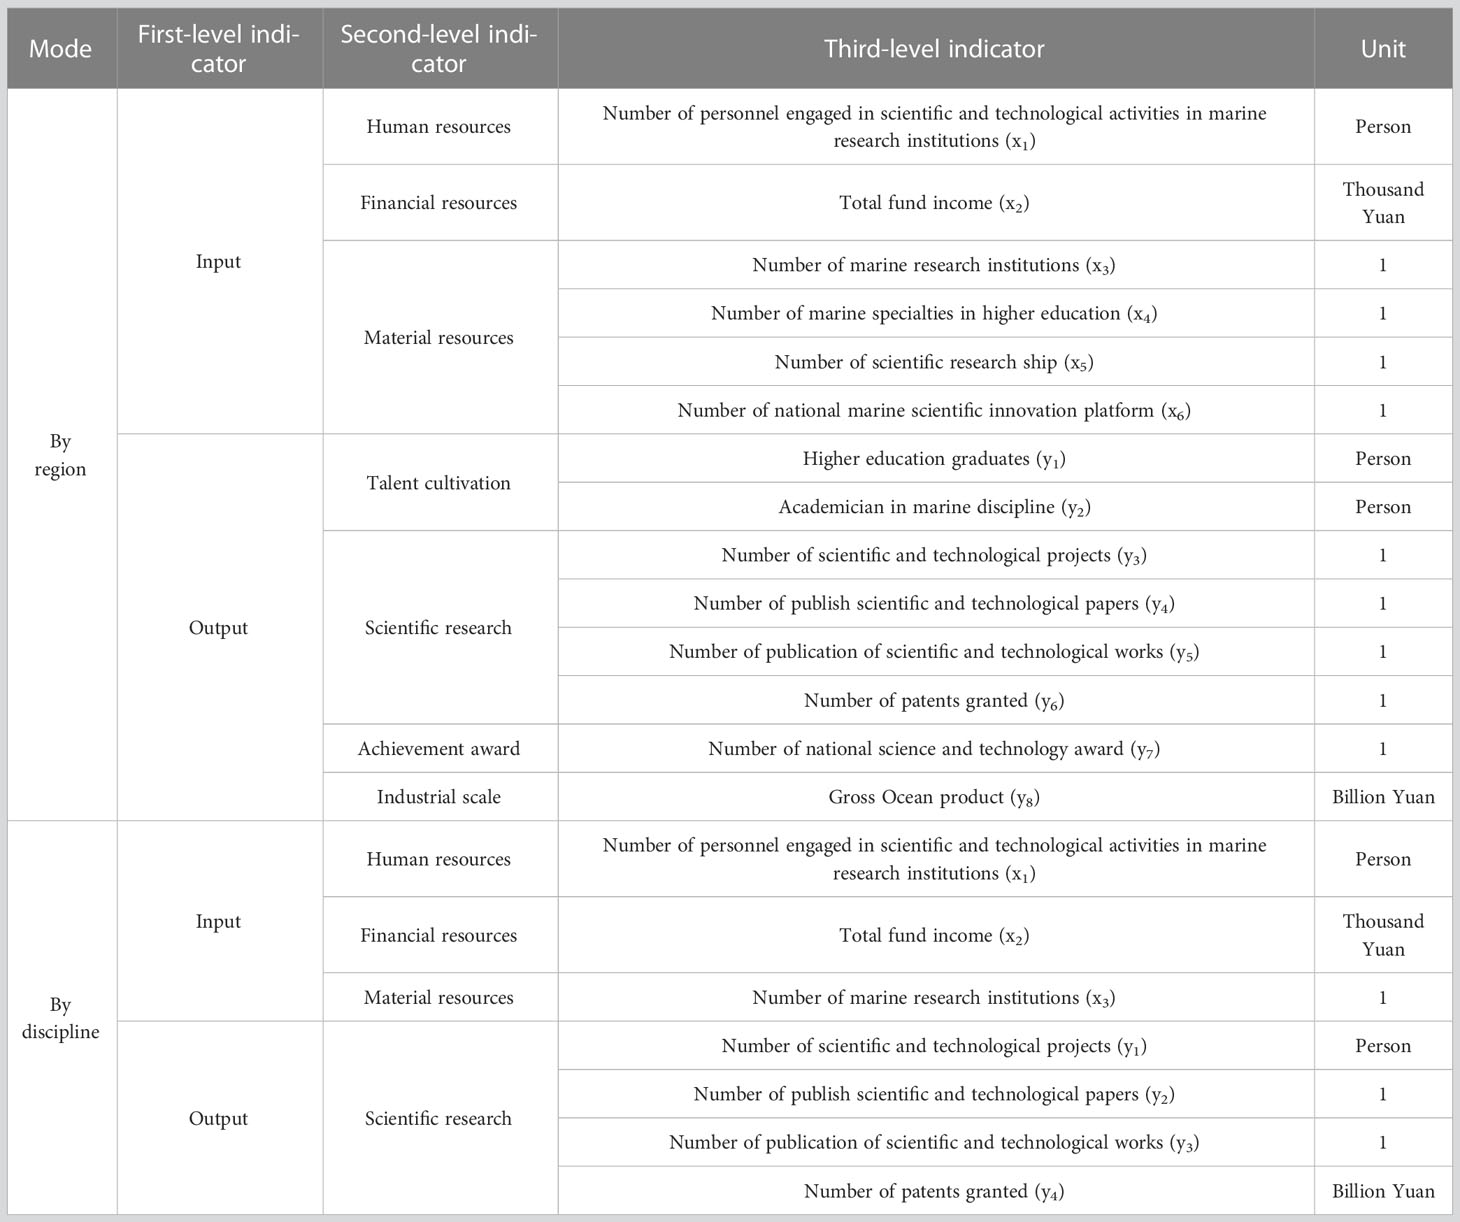
Table 1 Marine Science and Education Evaluation Index System.
Based on the existing literature and data collection, considering the availability of data, the year of the latest data used in this paper is 2015. The original data for the selected indicators is mainly obtained from the China Marine Economic Statistical Yearbook, the official website of the National Science and Technology Awards Office, the National Ocean Survey Fleet, the Chinese Academy of Engineering, the Chinese Academy of Sciences, and the Ministry of Education. Relying on these verified data, we construct an index system to evaluate the input/output efficiency of marine science and education for research purposes. There are magnitude differences in the original data of different indicators, which is not conducive to further analysis. In order to consider all indicators fairly, we first standardize the raw data to realize the quantification of inputs and outputs.
2.2 Methods
The main research methods involved in this study include DEA and Malmquist index model. DEA is used to quantitatively evaluate input/output efficiency, and Malmquist index model is used to explain the influencing factors of efficiency.
2.2.1 Data envelopment analysis
Data envelopment analysis (DEA) was proposed by Charnes et al., which has been widely applied in the research of education (Zhou et al., ; Charnes et al., 1978). DEA is a goal programming model, which uses space coordinate mapping to calculate the relative efficiency of each decision-making unit (DMU), so it can be applied to the input/output efficiency analysis (Zhou et al., 2008; Song and Zheng, 2016). To evaluate the efficiency of unit , the following model can be formed.
while () is the weight of input (output) indicator ( ) is the value of unit and input indicator , and is the value of unit and output indicator . These values all greater than or equal to 0. The number of input and output indicators is and respectively.
DEA model requires that all units are of the same type and comparable. Therefore, in this study, we first use factor analysis (FA) to reduce the index dimension and the original indexes can be represented by different linear combinations of factors. In addition, the traditional DEA often has multiple units with efficiency of 1. The supSBM model is a special DEA model. It can make up for this deficiency, so that the result can be greater than 1, and the efficiency of effective units can be refined to facilitate sorting. In this study, software DEA-Solver Pro5 and DEAP2.1 were used for DEA calculation.
2.2.2 Malmquist index model
Malmquist index was used to measure the change of total factor productivity, and Fare et al. further realized exponential decomposition (Caves et al., 1982; Song and Zheng, 2016). We introduce this model into this study to analyze the efficiency change on the time scale. The Malmquist index formula from to is as follows.
while represents the vector composed of input and output data in period , and different superscripts represent different periods . is the distance function, which can be understood as the distance between the actual value and production frontier. Malmquist index can be decomposed into technical efficiency (TE) and technological progress (TP), and the former can be divided into pure technical efficiency (PE) and scale efficiency (SE).
3 Results
3.1 Interannual variation of marine science and education level
3.1.1 By region
To ensure that factor analysis can be used to evaluate the development level of marine science and education, we first need to preprocess the index data. KMO(Kaiser-Meyer-Olkin) test is used to compare simple correlation coefficient and partial correlation coefficient between variables. If KMO value is greater than 0.7, factor analysis is considered acceptable. Bartlett’s test of sphericity compares the observed correlation matrix to the identity matrix, and factor analysis can only be used if the data is spherically distributed and passes the test. After KMO and Bartlett’s test of sphericity (KMO=0.824>0.7, P<0.05), factor analysis can be used to evaluate the development level of marine science and education in different regions.
According to the contribution of each factor, the weighted calculation is carried out and the comprehensive score of each region is finally obtained (Figure 1A). It is not difficult to find that from 2006 to 2015, marine science and education in all regions showed a trend of improvement. Through quantitative calculation, it can be seen that the average score of all provinces in 2006 was -0.367, which was still negative. The score increased to 0.350 in 2015, and the growth in the past 10 years was continuous. At the same time, the improvement of each province was different, with Guangdong’s score increasing by 1.52, followed by Shandong’s increase of 1.28. The slowest improvement came from Hainan, which also ranked last in terms of marine science and education development.
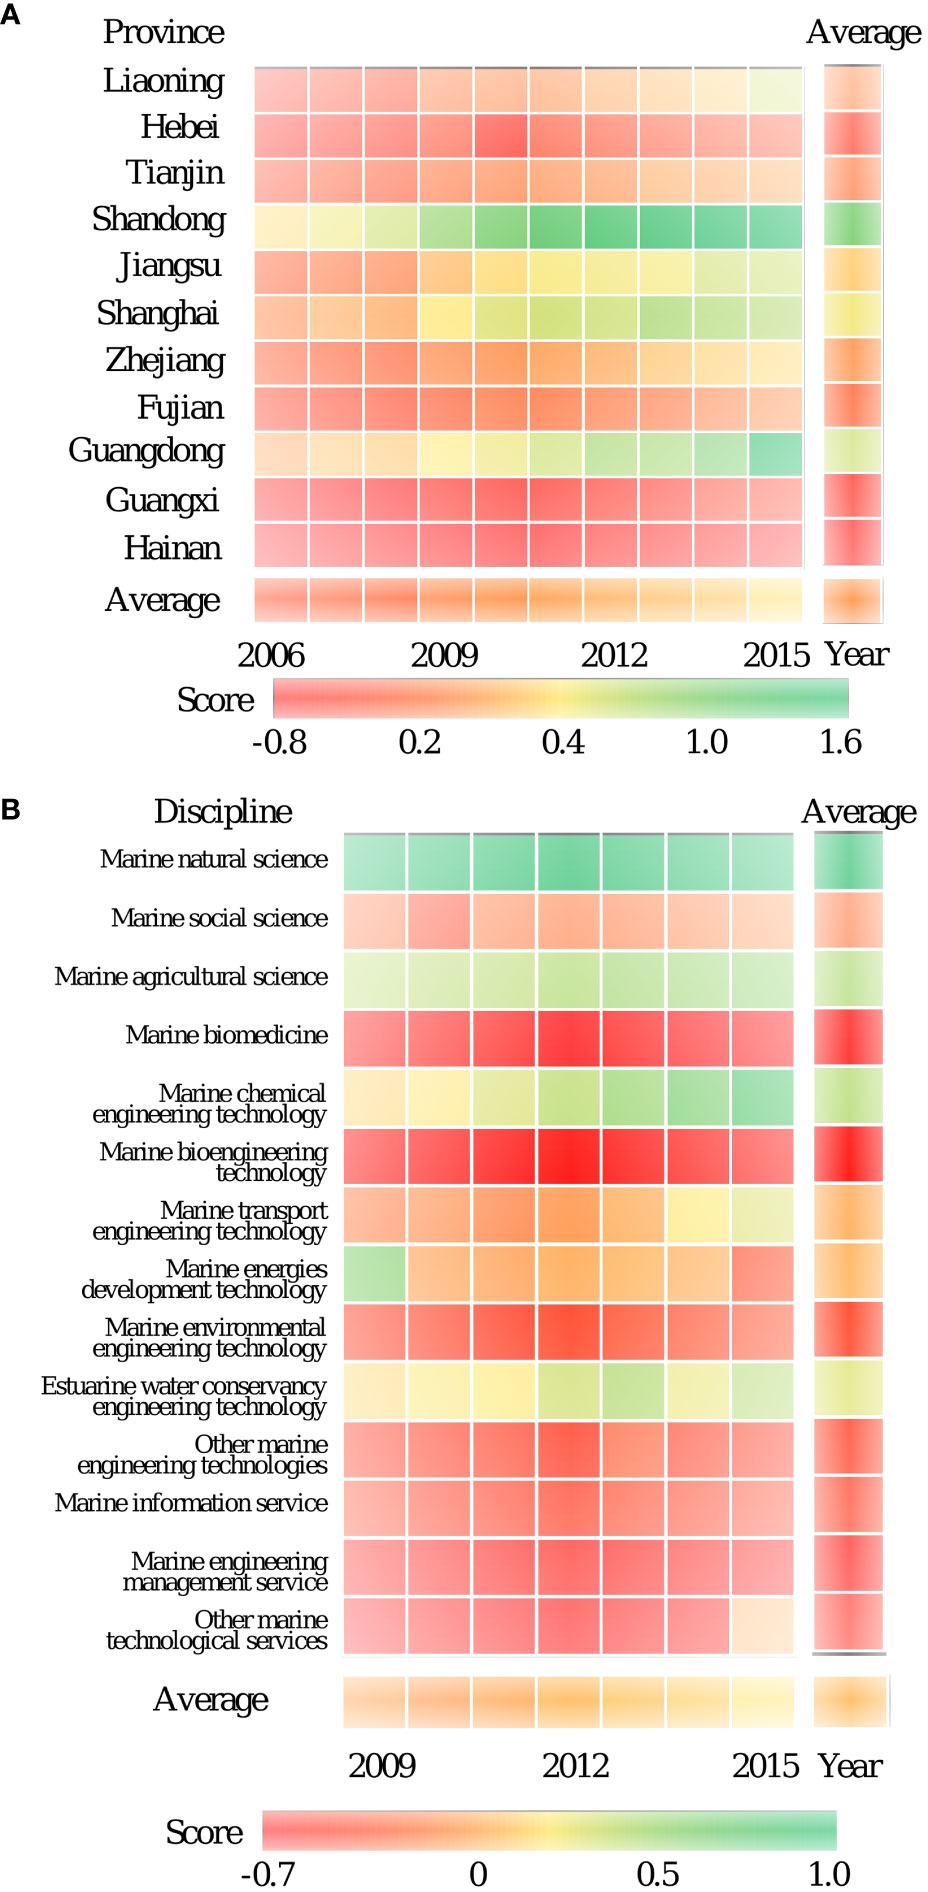
Figure 1 Interannual variation of marine science and education level in China. (A) By region. (B) By discipline.
3.1.2 By discipline
After KMO and Bartlett’s test of sphericity (KMO=0.824>0.7, P<0.05), factor analysis can be used to evaluate the development level of marine science and education in different disciplines. Through factor analysis, we obtained the comprehensive scores of marine science and education in various disciplines from 2009 to 2015 (Figure 1B). The results reveal that the level of science and education in 11 disciplines is improved, especially marine natural science, which has been in a far leading position in scientific research development and can steadily grow. The development level of marine biomedicine, marine energy development technology and marine engineering management service has declined.
3.2 Evaluation of input/output efficiency in marine science and education
3.2.1 By region
Since the DEA method requires the number of units (represented as region in this study) to be at least twice the total number of all indicators (Charnes et al., 1978), the dimensions of input and output indicators are firstly reduced respectively. Among them, there is only one third-level indicator for human resources and financial resources in the input index, which can be directly retained for subsequent evaluation. Only the common factor extraction of material resources input is carried out, and finally five indicators are retained to ensure a positive correlation between the input and output indicators. Then, the input oriented supSBM is used to analyze the marine science and education input/output efficiency of 11 regions from 2006 to 2015 (Figure 2A).
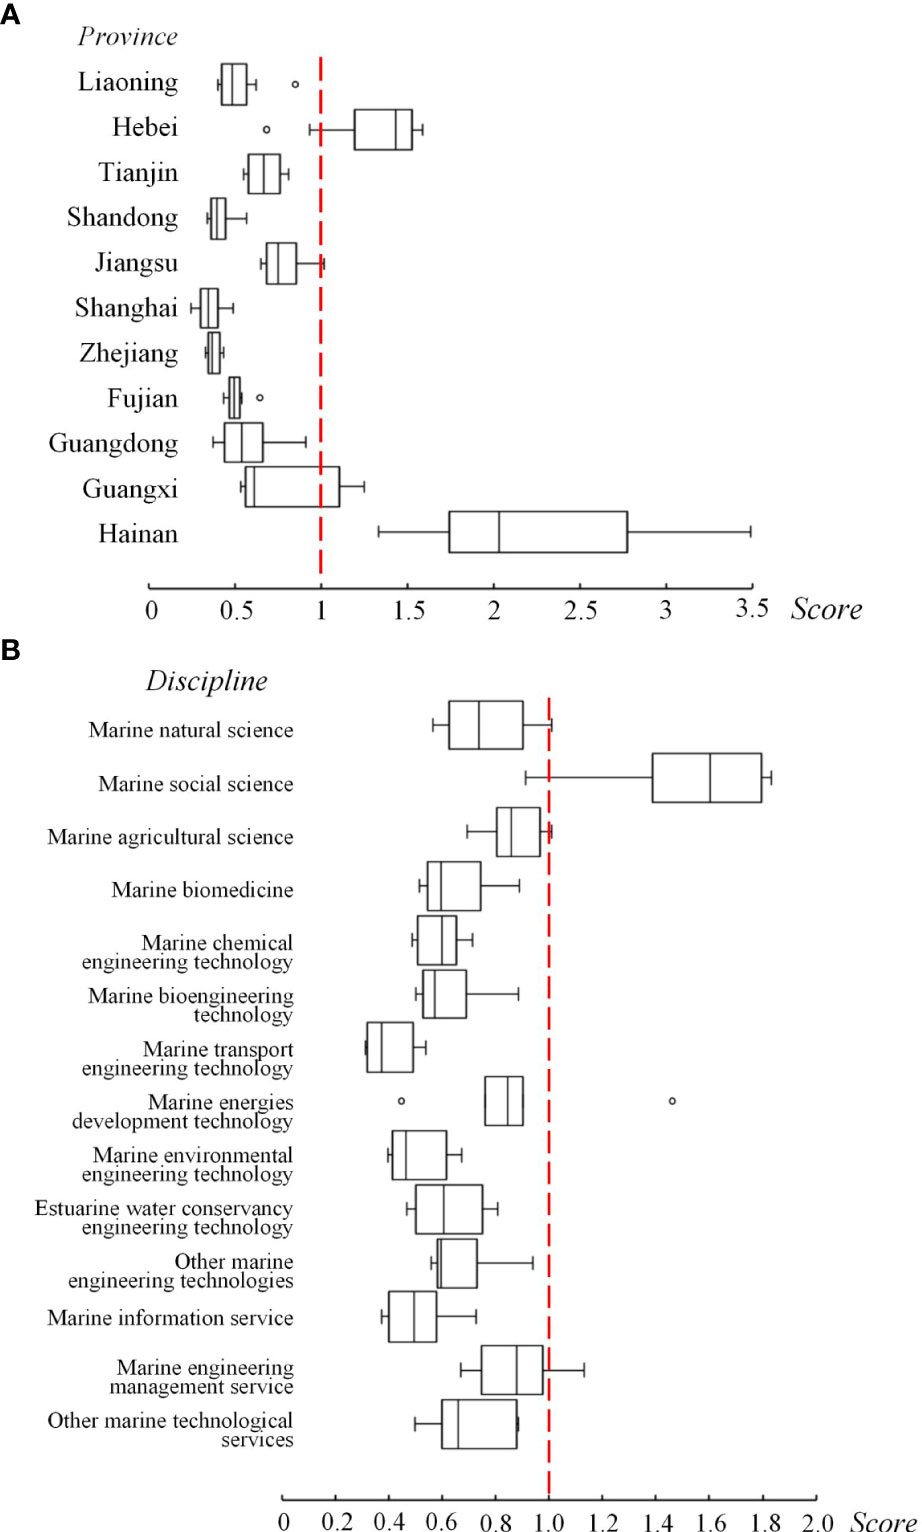
Figure 2 Distribution of marine science and education input/output efficiency in China. (A) By region. (B) By discipline.
The mean DEA values of all regions from 2006 to 2015 basically belong to the non-DEA effective level. DEA was effective in Jiangsu, Hebei, Guangxi and Hainan during the observation period. Hainan is worthy of attention. This province has achieved DEA effectiveness in each year. However, according to the comprehensive score of the development level of the aforementioned provinces, it ranks behind in the comprehensive score. That is, the development level of Marine science and education is obviously inconsistent with the efficiency result.
3.2.2 By discipline
As in the previous section, we first reduce the dimensions of input and output indicators to ensure that they can be used for DEA analysis. Next, the input/output efficiency of 14 marine research disciplines from 2009 to 2015 is analyzed year by year (Figure 2B). In practice, scientific research input can be regarded as the basis and antecedent of scientific research output, and it is easier to control marine research input than to control output. Therefore, this study selects an input based model to fix the output and explore how to adjust the input.
The mean value of DEA from 2009 to 2015 has always been at the level of non-DEA effectiveness. From the perspective of discipline dimension, the efficiency value of marine social science is high, and reaches DEA efficiency in every year except 2010. However, the input/output efficiency of marine transport engineering technology, marine environmental engineering technology, marine energy development technology and marine information service is not satisfactory.
3.3 Influencing factors of marine science and education input/output efficiency
3.3.1 By region
We apply Malmquist index model to calculate the Malmquist index of marine science and education in different regions and decompose it (Figure 3A).
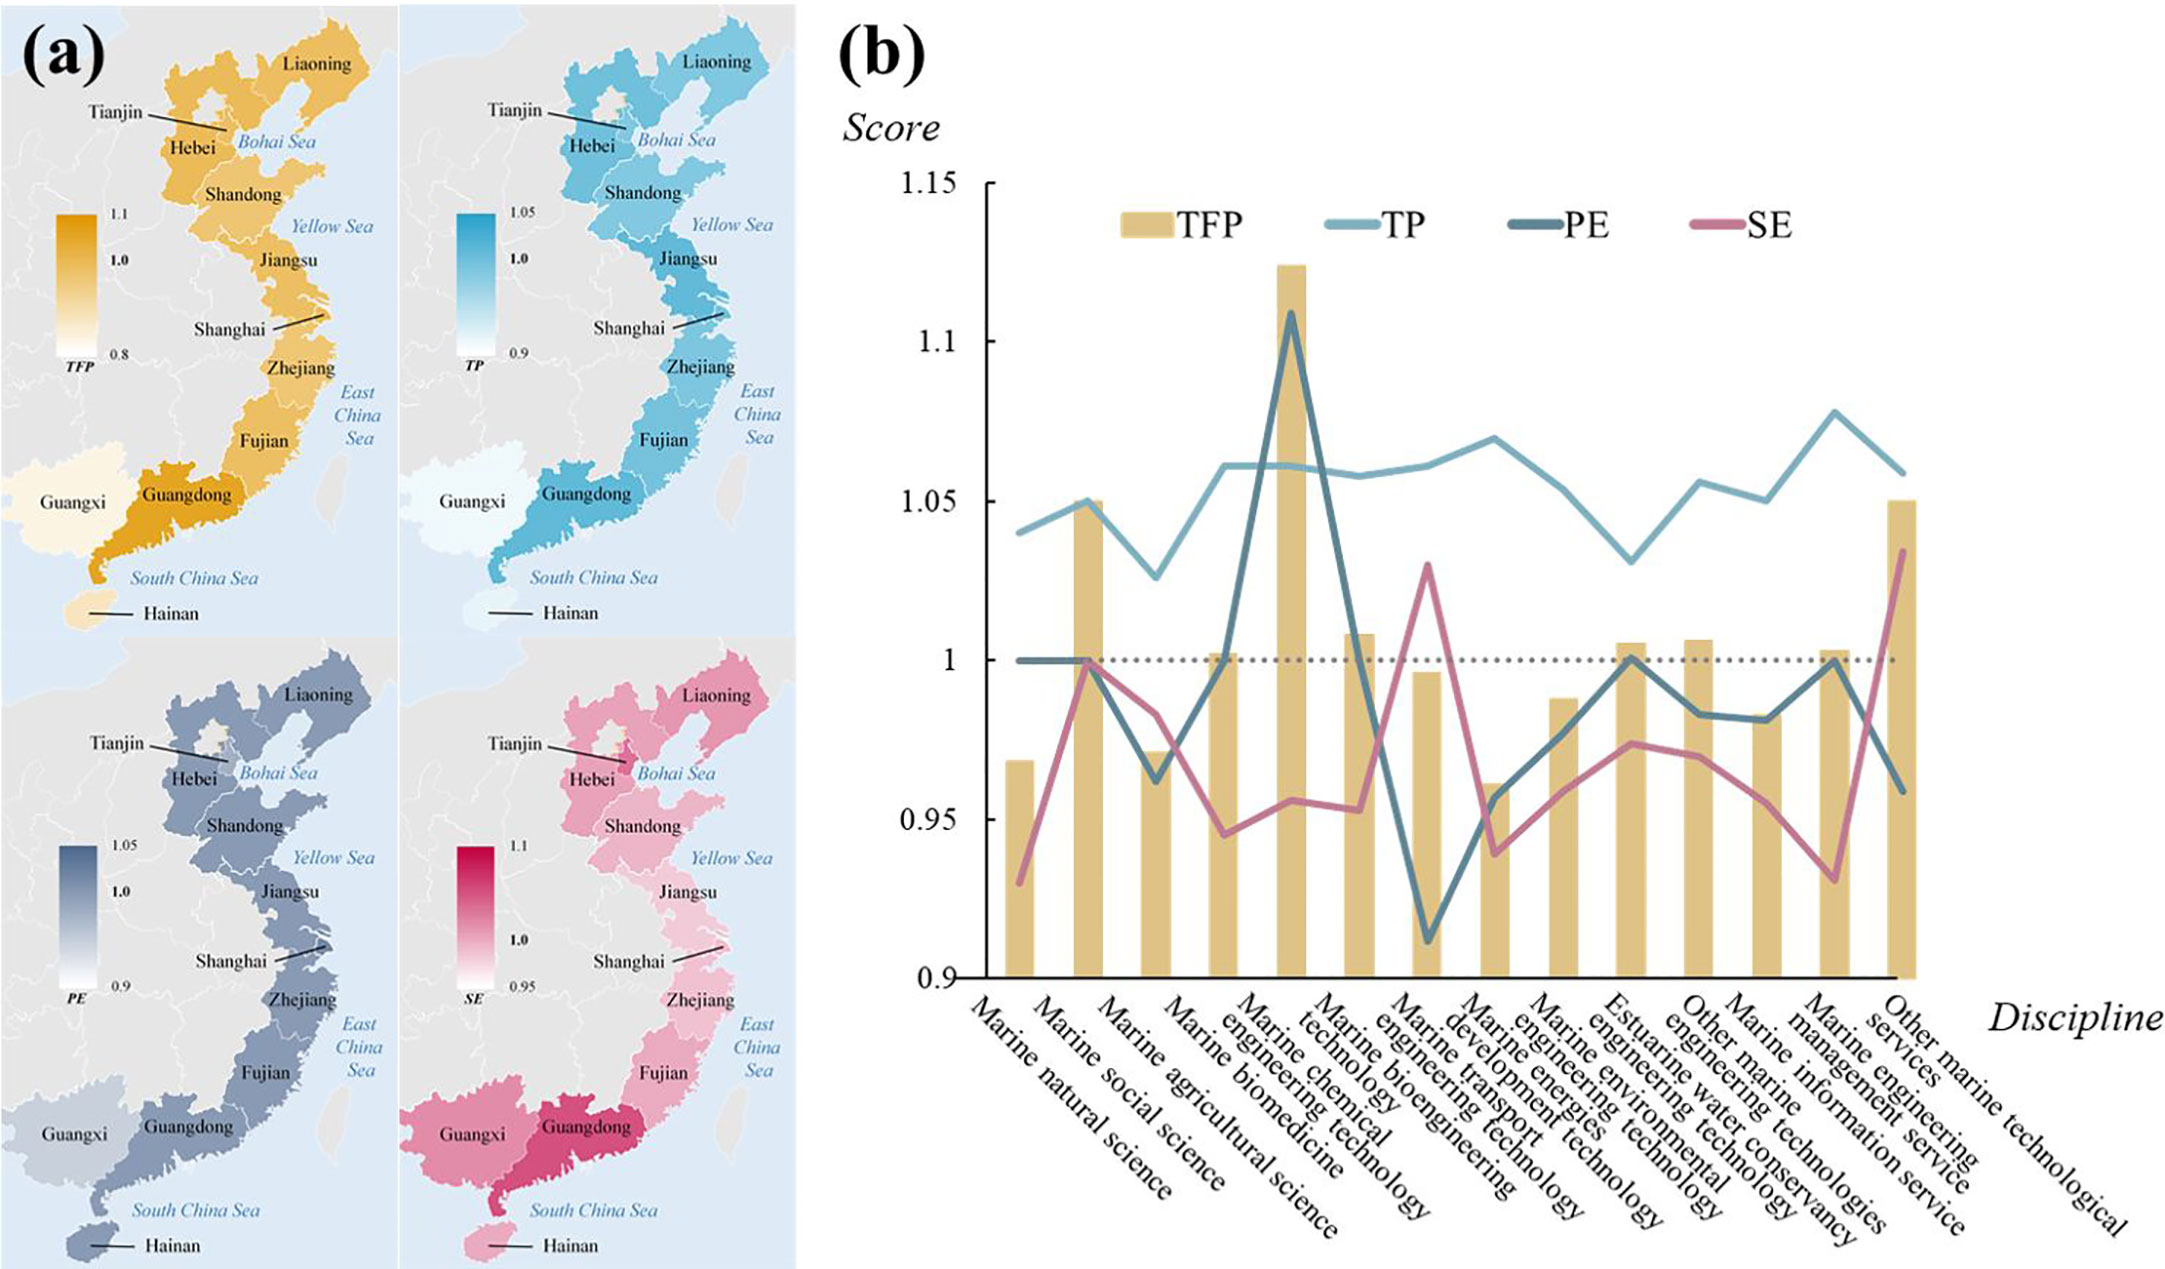
Figure 3 Malmquist index of marine science and education in China. (A) By region. (B) By discipline.
The level of total factor productivity (TFP) in China’s coastal zone decreased slightly at the beginning, and then increased slightly in the fluctuation. The average year-on-year change value is 0.965, and the cumulative multiplication result is less than 1. In other words, the input/output efficiency of marine science and education in China’s coastal provinces decreased slightly from 2006 to 2015. However, at the same time, the level of TFP increased for 5 times on the time basis, but the increase was relatively small. The cumulative multiplication result of PE was 1.009, that is, the cumulative increase of 0.9%. It can be seen that the rationality of resource utilization has been improved, and SE has also been improved.
3.3.2 By discipline
The same method is used to calculate and decompose the Malmquist index of marine science and education in different disciplines to obtain their TFP levels (Figure 3B). On the whole, the level of TFP decreased slightly at the beginning, and then continued to increase. After 2013, it decreased and remained stable, showing fluctuations. The average year-on-year change value is 1.007, showing an upward trend, and the cumulative multiplication result is 1.046. In other words, during the observation period from 2009 to 2015, the average inter-annual variation of marine scientific research efficiency level increased, and the cumulative increase was about 4.6% compared with the base period. Half (7) of the disciplines showed TFP growth, while half experienced decline.
4 Discussions
4.1 Spatial heterogeneity
In order to reveal the imbalance in the development level of marine science and education in various coastal provinces, we take the data of 2006 and 2015 as examples to conduct cluster analysis on the development level of marine science and education in 11 coastal provinces (Figure 4).
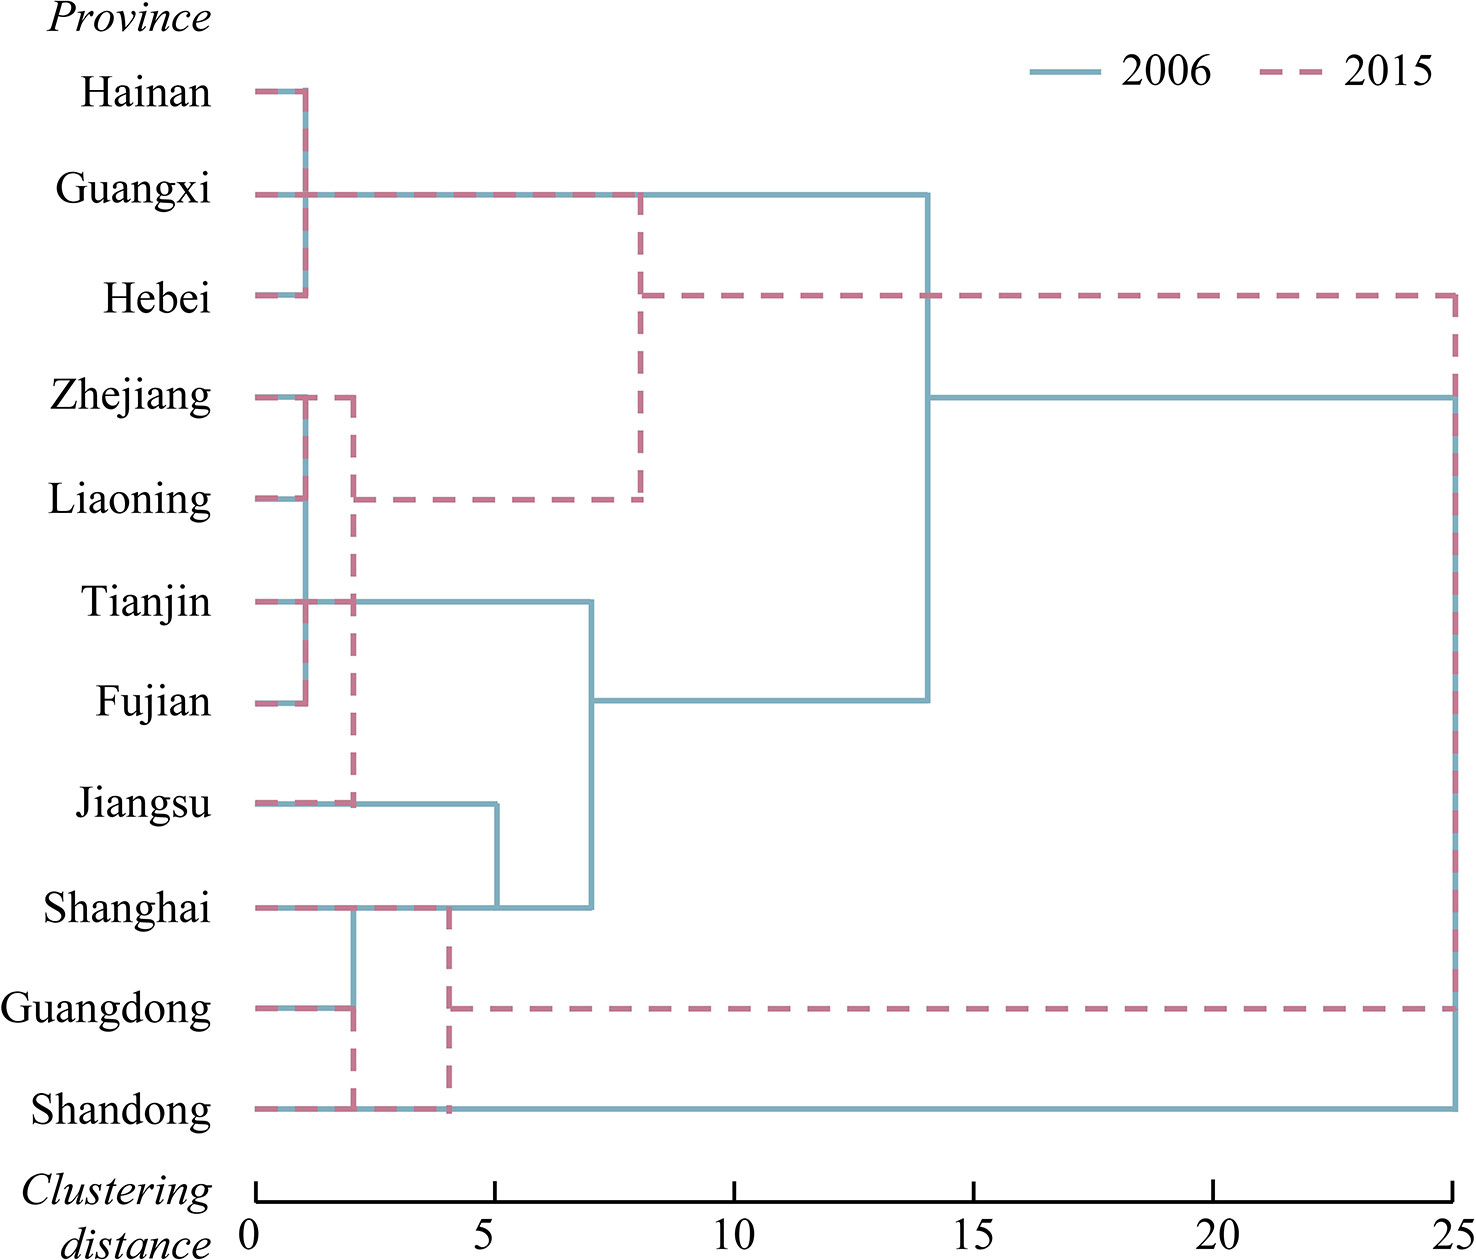
Figure 4 Clustering analysis on the development level of marine science and education in China by region.
The development level of marine science and education in coastal provinces can be divided into four categories. The development of marine science and education in coastal provinces can be divided into four categories. In 2006, Shandong’s marine science and education development was the best, and it was separately classified as the first class. Guangdong, Shanghai and Jiangsu had good development of marine science and education, which are classified as the second class. Zhejiang, Tianjin, Fujian and Liaoning were medium, and the third class contained the largest number of provinces. The development of marine science and education in Hebei, Guangxi and Hainan was slightly poor, which was classified as the fourth class. By 2015, the development of Marine science and education in Shandong and Guangdong was excellent, and was separately classified as the first class. The development of marine science and education in Shanghai was good and fell into the second class. Jiangsu, Liaoning, Zhejiang, Tianjin and Fujian were in the middle category and were classified as the third class. Hebei, Guangxi and Hainan were still in the fourth class, with no significant progress in the development of marine science and education. By comparing the results of the two years, it can be seen that Shandong’s marine science and education level has always been in the first place. Guangdong achieved a significant promotion into the first tier. Jiangsu’s marine science and education level dropped from the second class to the third class. The rank of other provinces has not changed much, but the overall level is improving.
In terms of the input/output efficiency of marine science and education, most provinces have been in a non-DEA effective state. Hainan has achieved DEA effectiveness every year, but the significance of reference is limited. In 2015, Hainan ranked the lowest among the 11 coastal provinces in terms of all input-output indexes, and its overall development scale was the smallest. Therefore, the effective efficiency of Hainan is not due to its considerable amount of scientific and educational output. In terms of output, gross ocean product (GOP) is only about 8.1 per cent of Shandong’s. But at the same time, its input in many human, financial and material resources indicators a significant magnitude gap with most provinces, for example, the total amount of funds is only 2.6% of Shandong Province. Therefore, the effective efficiency of Hainan is calculated from the perspective that Hainan has obtained the relative maximum output with the non-maximum input. The situation of Hebei is similar to that of Hainan, so it also has a larger relative efficiency value. In contrast, the regions with low efficiency value, taking Shanghai as an example, ranked among the top three in two thirds of the six input indicators, especially the number of national marine science and technology innovation platforms ranked the first. However, the output indicators are not outstanding. Therefore, the relative efficiency value of Shanghai is low, which reflects that it has not achieved the output matching level with relatively large input.
From the influencing factors of marine science and education input/output efficiency, only Guangdong has the growth state of TFP, which indicates that the overall science and education input/output efficiency in China’s coastal areas is declining. The PE of most areas is greater than 1 or higher than TFP, which indicates that except Tianjin, the coastal areas of China can basically make full use of the existing educational resources, and transformation is not the main factor restricting the input/output efficiency of marine science and education. For most regions, TP is low, that is to say, the progress of educational level is slow, which is the reason for the inefficiency of marine science and education. Shanghai and Jiangsu are special. The main factor restricting the input/output efficiency of marine science and education in these two regions is the low SE. In other words, educational resources are not fully utilized in these two places, and the current scale of marine scientific research can be further expanded to improve the efficiency of science and education. It can be seen that although the output of marine science and education needs the input of human resources, material resources, financial resources and other resources, it also needs the improvement and progress in the effective utilization of resources. It is not advisable to rely on a large amount of input of resources, which may cause the loss of efficiency.
4.2 Discipline heterogeneity
In order to further reveal the imbalance in the development level of marine science and education in various disciplines, we take the data of 2009 and 2015 as examples to conduct cluster analysis on the development level of 14 marine science and education disciplines (Figure 5).
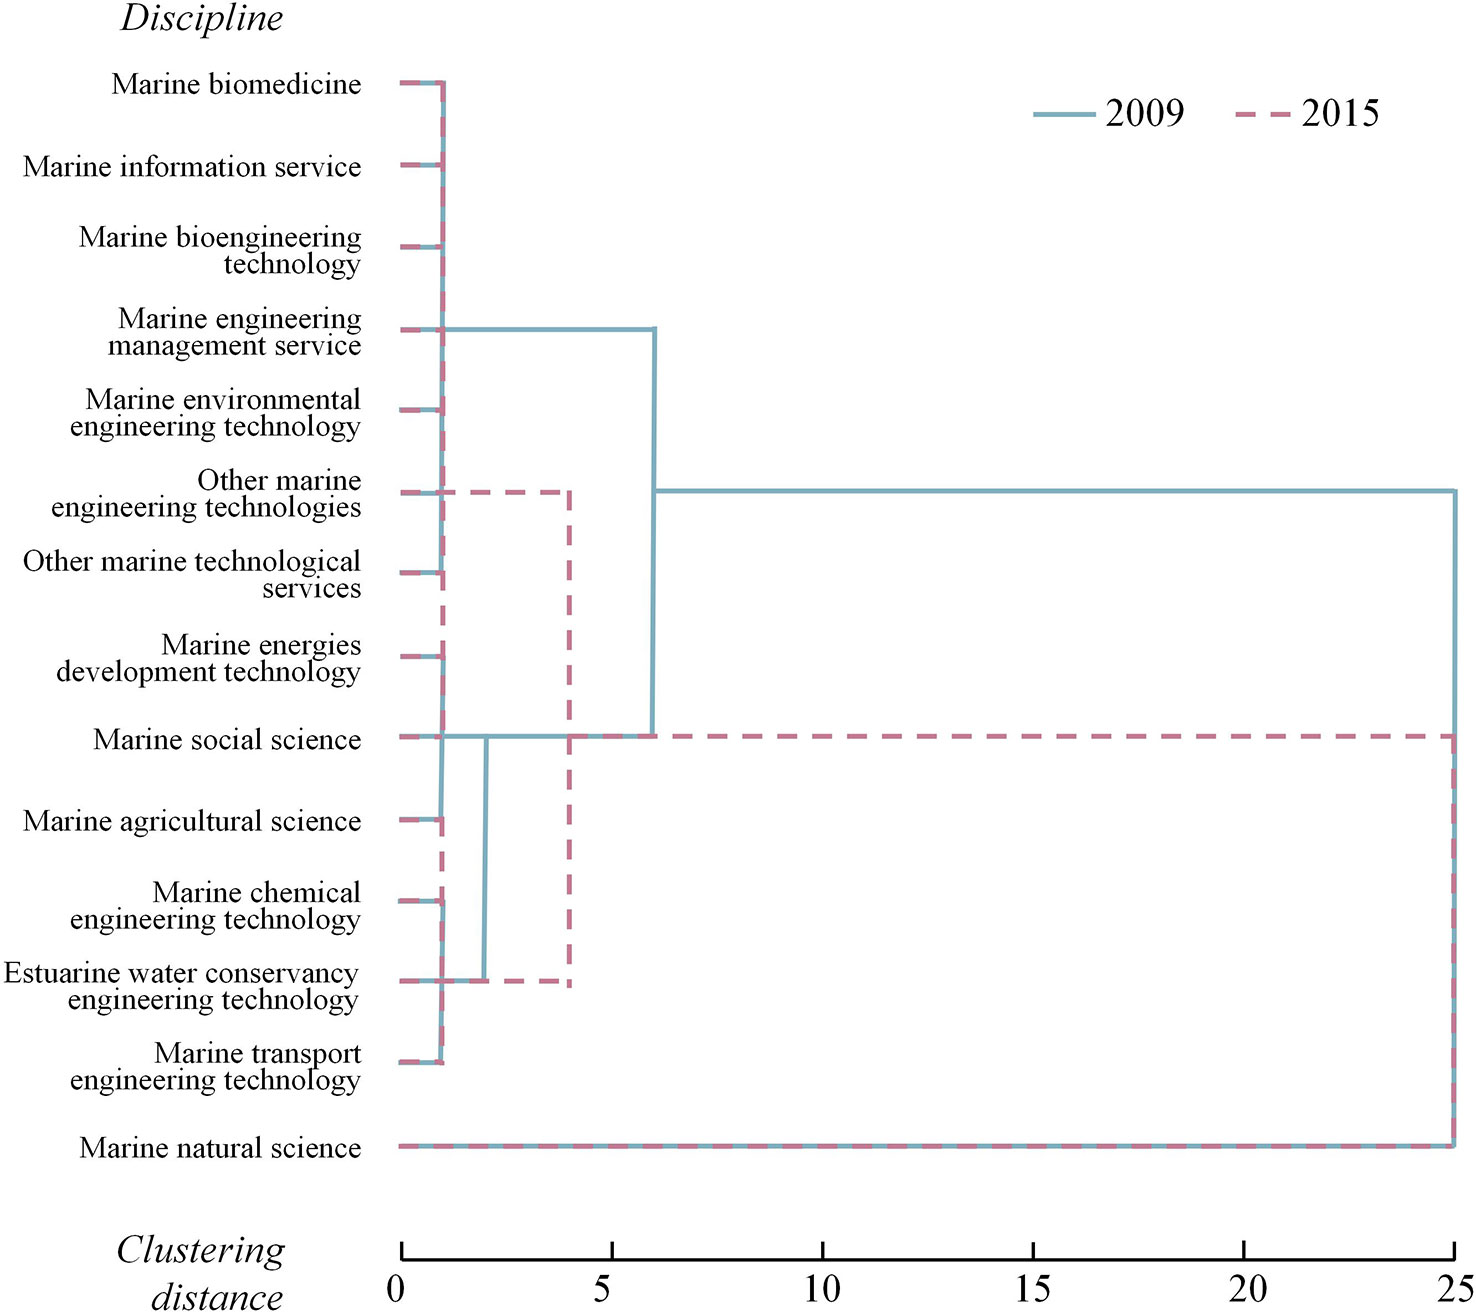
Figure 5 Clustering analysis on the development level of marine science and education in China by discipline.
The development level of marine science and education in each discipline can be divided into three categories. In 2009, marine natural science developed at the highest level and was classified as the first class. Marine energy development technology, marine agricultural science, estuarine water conservancy engineering technology, marine chemical engineering technology, marine transport engineering technology, and marine social science with scores ranking 2-7 were classified into the second class. Other industries with scores ranging from 8 to 14 were classified as the third class, including marine information service, marine environmental engineering technology, other marine engineering technologies, marine engineering management service, marine biomedicine, marine biological engineering technology, and other marine technical services. In 2015, the development level of marine natural science remained the first place, classified as the first class. Marine chemical engineering technology, marine agricultural science, estuarine water conservancy engineering technology, marine transport engineering technology a with scores ranging from 2 to 5 were classified as the second class. The remaining industries are grouped into the third class. By comparing the results of the two years, we can see that marine energy development technology and marine social science were dropped from the second class to the third class. The development level of marine scientific research in the former has decreased obviously, while the latter has improved in the score but the gap with the second class of industries has increased. Other disciplines showed little change.
In terms of marine science and education input/output efficiency, all disciplines are in non-DEA effective state. Science and education in the discipline of marine social science is highly efficient. DEA was effective in all years except 2010. In our view, the efficiency of marine social science is due to its low input and high output. The discipline’s output value in 2015 ranked 5th out of 14, and its three input indicators ranked 10th or below. Among them, the number of personnel engaged in scientific and technological activities in marine scientific research institutions is slightly better, ranking the 10th place with 750 persons in total, and the number of marine research institutions is 3, and the total fund income is 470,242 thousand yuan, ranking the 11th place in both indicators. In general, marine social science is a discipline with less input resources, but this discipline achieves higher scientific research output with less input, especially in the number of publication of scientific and technological works, which is also related to the characteristics of this discipline. The negative example is marine transport engineering technology. The input indicators in this discipline rank in the top three, especially the total fund income, which is second only to the investment in marine natural science, but the output is not outstanding. Therefore, the low efficiency value of marine transport engineering technology reflects that it does not achieve the output matching level with relatively large investment.
From the analysis of the influencing factors of marine science and education input/output efficiency, TFP of the other disciplines is greater than 1 except for marine transport engineering technology, marine environmental engineering technology, marine energy development technology and marine information service, which means that the input/output efficiency of marine science and education in most disciplines is improving. SE of all disciplines is greater than 1, indicating that there has been considerable scientific and technological progress in all disciplines. SE in all disciplines increased by 3.1% to 7.8% from 2009 to 2015, which was the main factor influencing the improvement of marine science and education input/output efficiency. We also note that the dominant factor leading to the low efficiency of marine science and education in the above four disciplines is their low PE, which means that these disciplines fail to make full use of existing educational resources to produce enough achievements. Most of these are disciplines with large investment and return slow. Therefore, we need to take a more patient look at this phenomenon, and we should focus on how to optimize the proportion of resources invested and achieve effective utilization. It is worth mentioning that marine energy development technology. In addition to PE constraints, SE is also very low in this discipline, indicating that according to the current input level, the scale of marine energy research can be further expanded to achieve high efficiency.
4.3 Improvement in inefficient regions
According to statistics, a total of 9 regions were DEA ineffective regions in 2015. Therefore, these regions were selected for comparison and their input redundancy was calculated (Table 2). Tianjin, Shanghai and Guangxi need to improve the efficiency of redundancy and have great potential for improvement. The maximum value of redundancy in the table is 72.81%, indicating that there is obvious and unbalanced redundancy in the total fund income in Guangxi. If science and education funds can be allocated scientifically, its input/output efficiency can be improved. In terms of staff and material resources, Guangxi also had a redundancy rate of 51.52% and 38.93% respectively. This is consistent with the result that the PE of Guangxi is only 0.612, which ranks the bottom, indicating that the utilization of its input resources is obviously inadequate. Tianjin, on the other hand, showed a certain degree of resource waste on the three factors, but the performance of each factor is different. The key improvement direction is the number of personnel engaged in scientific and technological activities in marine scientific research institutions and the total revenue of funds in marine scientific research institutions. The input amount in these two indicators is more mismatched with the output return. In Shanghai, about 38% of the resources are wasted in each of the three factors. Based on the calculation results of redundancy rate, the direction of efficiency improvement and the focus of optimization can be found more accurately. At the same time, combined with the reality, the redundancy of resource input may actually reflect the deficiency of output, so it is still necessary to pay attention to the improvement of resource utilization rate.
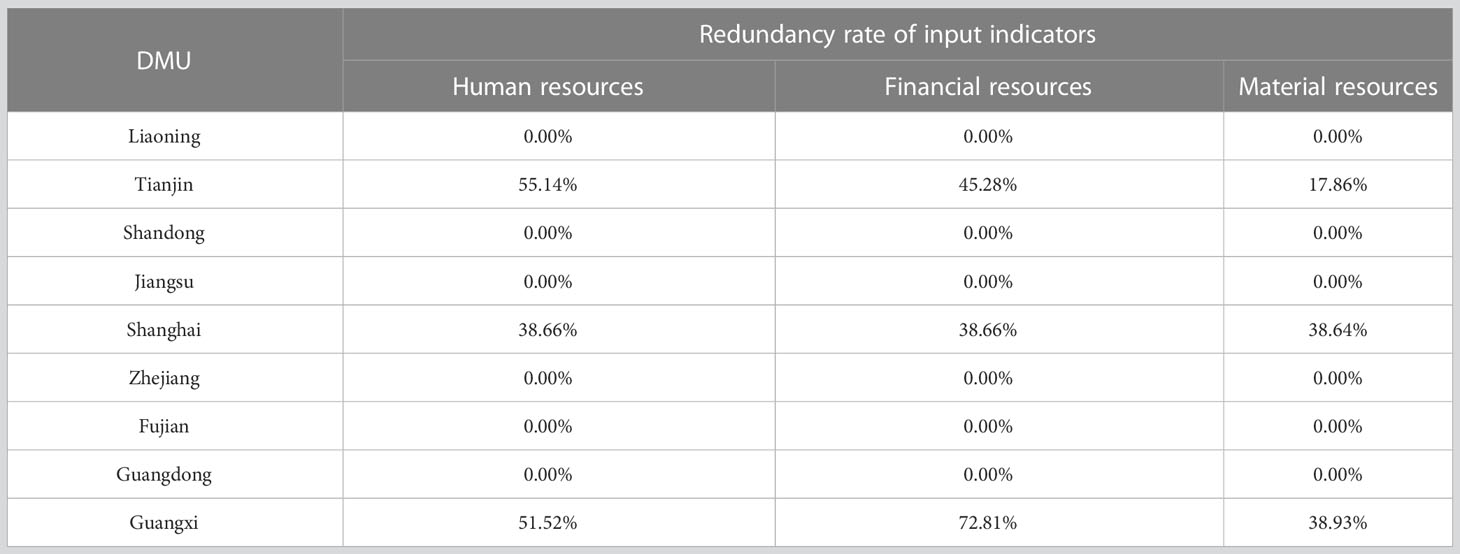
Table 2 Redundancy rate of investment in marine science and education by area (2015).
4.4 Improvement in inefficient disciplines
According to statistics, a total of 13 disciplines showed ineffective DEA in 2015, so these disciplines were selected for comparison and their input redundancy was calculated (Table 3). There are nine disciplines that require efficiency improvements for redundancy and have great potential for improvement. The maximum value of redundancy in the table is 72.90%, indicating that the first factor of marine agricultural science, namely, the number of marine research institutions, has obvious and unbalanced redundancy. From the perspective of improving input/output efficiency, the scientific research institutions of marine agricultural science need to be reorganized and streamlined. Marine transport had more than 50% waste of resources in the three factors. The main improvement direction of marine information service is the number of marine research institutions, while relatively speaking, the input amount of other marine technical services in the number of personnel engaged in scientific and technological activities in marine scientific research institutions is more mismatched with the output return. Here is for each individual factor of the input, each factor needs to do more or less improvement degree, should not be the same.
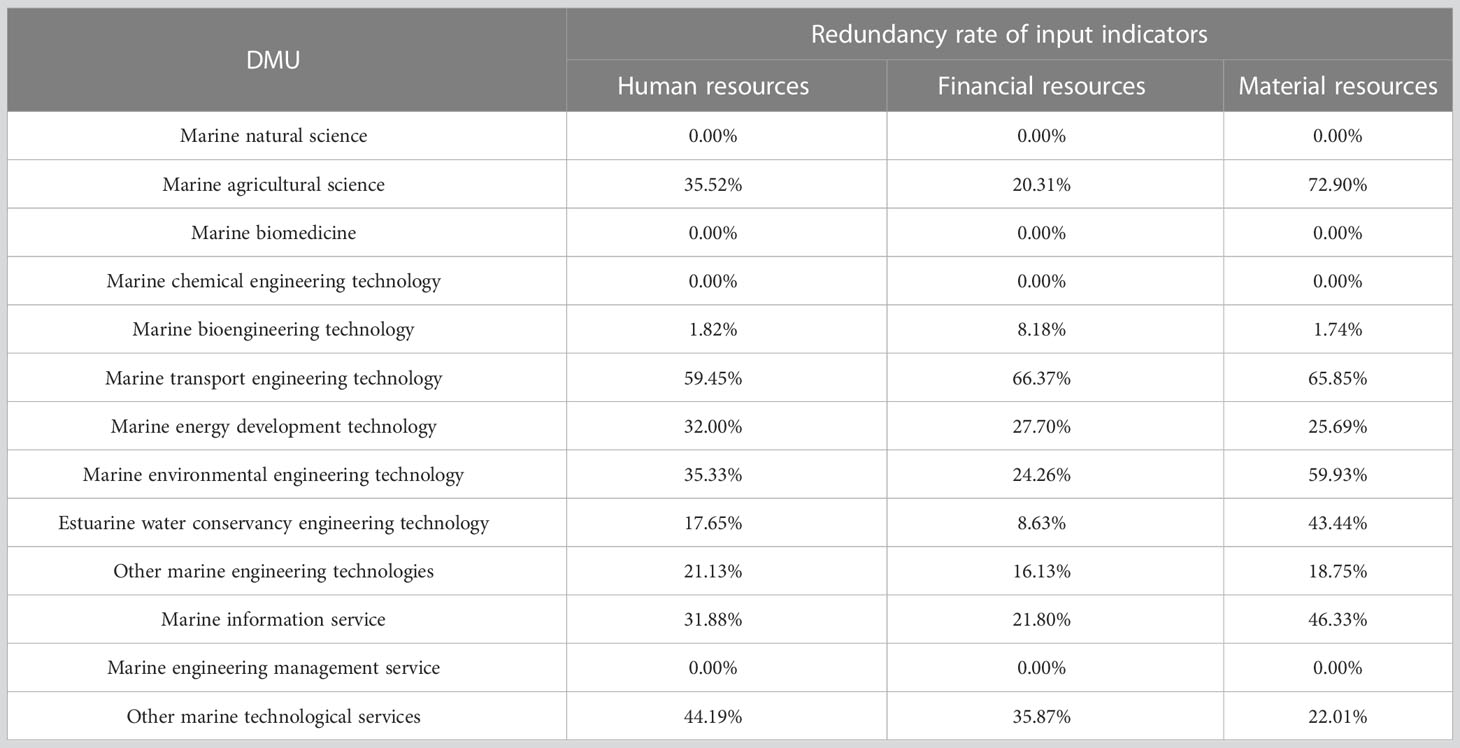
Table 3 Redundancy rate of investment in marine science and education by discipline (2015).
4.5 Comparison with existing research
At present, there are few researches on the input and output efficiency of marine science and education, but some scholars have explored the efficiency of Marine science and technology innovation in China. Li et al. used stochastic frontier analysis (SFA) to calculate the efficiency of marine science and technology innovation based on panel data of 11 coastal provinces and cities in China. The difference is that in this study, they only showed output through the number of published scientific papers. There are more output indicators in this paper, which makes the output evaluation more comprehensive and scientific.
Existing research indicates that the marine science and technology innovation efficiency varies substantially in different regions of China. In terms of the development level of Marine science and education from 2006 to 2015, Shandong was in the leading position, Tianjin, Shanghai, Jiangsu and Guangdong were in the second tier, while Guangxi and Hainan lagged (Li et al., 2021). This is consistent with the conclusion of this paper. This paper also puts forward different measures to improve the efficiency of marine science and education according to the situation of different regions, which is a highlight of this study.
At present, no studies have been found on the input and output efficiency of marine science and education by discipline. Therefore, the research results of this paper have strong guiding significance for improving the science and education efficiency of different marine disciplines.
5 Conclusions
This paper analyzes the input and output of China’s marine science and education, and evaluates the efficiency of China in marine science and education. It may also be the first attempt to analyze the efficiency of marine science and education with different disciplines. From 2006 to 2015, the overall level of marine science and education in China has been upgraded, but correspondingly, the input/output efficiency of marine science and education has decreased slightly and is at the non-DEA effective level. Among her 11 provinces, Jiangsu and Shanghai should further concentrate marine education resources and promote interdisciplinary marine education exchanges, so as to make full use of marine education resources in the two regions, which can promote marine science and technology innovation. Other provinces should pay more attention to improving the level of marine education. They need to make up for their shortcomings in marine education management and avoid institutional rigidity. Among disciplines, marine transport engineering technology, marine environmental engineering technology, marine energy development technology and marine information service are the four disciplines facing the pressure of improving input/output efficiency of marine science and education. These disciplines should optimize the structure of education investment in the future, and achieve a reasonable allocation of hardware investment and software investment. For marine energy development technology, attention should also be paid to integrating relevant educational forces. Too decentralized research teams lead to low input/output efficiency in this discipline. Focusing on education is a driving force for continuous improvement of input/output efficiency in other areas and should be maintained in the future. According to the characteristics of different regions and disciplines, there are different development strategies, so we can accurately promote the development of marine science and education. It is also a highlight of this study to propose measures to improve the efficiency of science and education. However, due to the limitation of research data, we failed to take the data of recent years into consideration, which leads to a certain lag in the conclusion of this paper. At the same time, the government’s investment in marine science and education can also be presented through regulations or policy investment, which is difficult to quantify. In the future, quantitative analysis of policy can be introduced into research to further improve the conclusions.
Data availability statement
Publicly available datasets were analyzed in this study. This data can be found here: https://docs.qq.com/document/DR29PaGlBQ3preVhp.
Author contributions
TH: Methodology, Formal analysis, Investigation, Writing - Original Draft, Writing - Review and Editing, Visualization. XR: Conceptualization, Formal analysis, Validation, Resources, Writing - Review and Editing, Project administration, Funding acquisition. ZQ: Methodology, Software, Resources, Writing - Original Draft. CX: Methodology, Software, Formal analysis, Resources, Writing - Review and Editing. SY: Formal analysis, Writing - Review and Editing, Validation. YY: Validation, Resources, Data Curation, Writing - Review and Editing. GY: Conceptualization, Validation, Resources, Writing - Original Draft, Writing - Review and Editing, Supervision, Project administration, Funding acquisition. All authors contributed to the article and approved the submitted version.
Funding
This work is supported by National Natural Science Foundation of China (No.42176216), the Science Technology Department of Zhejiang of China (No.2022C15008, No.2021C25019), the Key Laboratory of Marine Ecosystem Dynamics, Ministry of Nature Resources (No. MED202001), Fujian Provincial Key Laboratory of Marine Ecological Conservation and Restoration (No. EPR2021003), and Special project of interdisciplinary pre research of Zhejiang University.
Conflict of interest
The authors declare that the research was conducted in the absence of any commercial or financial relationships that could be construed as a potential conflict of interest.
Publisher’s note
All claims expressed in this article are solely those of the authors and do not necessarily represent those of their affiliated organizations, or those of the publisher, the editors and the reviewers. Any product that may be evaluated in this article, or claim that may be made by its manufacturer, is not guaranteed or endorsed by the publisher.
References
Andersson J., Vico E. P., Hammar L., Sanden B. A. (2017). The critical role of informed political direction for advancing technology: the case of Swedish marine energy. Energy Policy 101, 52–64. doi: 10.1016/j.enpol.2016.11.032
Caves D. W., Christensen L. R., Diewert W. E. (1982). The economic-theory of index numbers and the measurement of input, output, and productivity. Econometrica 50 (6), 1393–1414. doi: 10.2307/1913388
Charnes A., Cooper W. W., Rhodes E. (1978). Measuring the efficiency of decision making units. Eur. J. Operational Res. 2 (6), 429–444. doi: 10.1016/0377-2217(78)90138-8
Chen X., Qian W. W. (2020). Effect of marine environmental regulation on the industrial structure adjustment of manufacturing industry: an empirical analysis of china's eleven coastal provinces. Mar. Policy 113. doi: 10.1016/j.marpol.2019.103797
Doloreux D., Melancon Y. (2009). Innovation-support organizations in the marine science and technology industry: the case of quebec's coastal region in Canada. Mar. Policy 33 (1), 90–100. doi: 10.1016/j.marpol.2008.04.005
Freitas C., Bellgrove A., Venzo P., Francis P. (2022). Towards a 2025 national ocean literacy strategy: current status and future needs in primary education. Front. Mar. Sci. 9. doi: 10.3389/fmars.2022.883524
Heredia F. J., Cifuentes-Rubiano J., Corchero C. (2018). Stochastic optimal generation bid to electricity markets with emissions risk constraints. J. Environ. Manage. 207, 432–443. doi: 10.1016/j.jenvman.2017.11.010
Hyvattinen H., Hilden M. (2004). Environmental policies and marine engines - effects on the development and adoption of innovations. Mar. Policy 28 (6), 491–502. doi: 10.1016/j.marpol.2004.01.001
Kong Y. D., Liu J. G. (2021). Sustainable port cities with coupling coordination and environmental efficiency. Ocean Coast. Manage. 205. doi: 10.1016/j.ocecoaman.2021.105534
Li G., Zhou Y., Liu F., Tian A. R. (2021). Regional difference and convergence analysis of marine science and technology innovation efficiency in China. Ocean Coast. Manage. 205. doi: 10.1016/j.ocecoaman.2021.105581
Liu S. G., Wang J. Y. (2022). Coupling coordination between marine S&T innovation and the high-quality development of the marine economy: a case study of china's coastal provinces. Sustainability 14 (12). doi: 10.3390/su14127373
Liu B. Q., Xu M., Wang J., Wang Z. F., Zhao L. (2021). Evaluation of china?s marine economic growth quality based on set pair analysis. Mar. Policy 126. doi: 10.1016/j.marpol.2021.104405
Liu P. D., Zhu B. Y., Yang M. Y. (2021). Has marine technology innovation promoted the high-quality development of the marine economy? –evidence from coastal regions in China. Ocean Coast. Manage. 209. doi: 10.1016/j.ocecoaman.2021.105695
Mokos M., Realdon G., Cizmek I. Z. (2020). How to increase ocean literacy for future ocean sustainability? the influence of non-formal marine science education. Sustainability 12 (24). doi: 10.3390/su122410647
Noailly J., Shestalova V. (2017). Knowledge spillovers from renewable energy technologies: lessons from patent citations. Environ. Innovation Societal Transitions 22, 1–14. doi: 10.1016/j.eist.2016.07.004
Ren W. H. (2021). Research on dynamic comprehensive evaluation of allocation efficiency of green science and technology resources in china's marine industry. Mar. Policy 131. doi: 10.1016/j.marpol.2021.104637
Ren W. H., Ji J. Y., Chen L., Zhang Y. (2018). Evaluation of china's marine economic efficiency under environmental constraints-an empirical analysis of china's eleven coastal regions. J. Cleaner Production 184, 806–814. doi: 10.1016/j.jclepro.2018.02.300
Shao Q. L. (2020). Nonlinear effects of marine economic growth and technological innovation on marine pollution: panel threshold analysis for china's 11 coastal regions. Mar. Policy 121. doi: 10.1016/j.marpol.2020.104110
Song M. L., Zheng W. P. (2016). Computational analysis of thermoelectric enterprises' environmental efficiency and Bayesian estimation of influence factors. Soc. Sci. J. 53 (1), 88–99. doi: 10.1016/j.soscij.2015.10.002
Sun C. Z., Wang S., Zou W., Wang Z. Y. (2017). Estimating the efficiency of complex marine systems in china's coastal regions using a network data envelope analysis model. Ocean Coast. Manage. 139, 77–91. doi: 10.1016/j.ocecoaman.2017.02.005
United Nations (2015). Transforming our world: the agenda for sustainable development (New York: United Nations).
United Nations (2020). United nations decade of ocean science for sustainable development 2021–2030 implementation plan (Paris: UNESCO).
Virto L. R. (2018). A preliminary assessment of the indicators for sustainable development goal (SDG) 14 "Conserve and sustainably use the oceans, seas and marine resources for sustainable development". Mar. Policy 98, 47–57. doi: 10.1016/j.marpol.2018.08.036
Visbeck M. (2018). Ocean science research is key for a sustainable future. Nat. Commun. 9. doi: 10.1038/s41467-018-03158-3
Wang J. Y., Shi X., Du Y. W. (2021). Exploring the relationship among marine science and technology innovation, marine finance, and marine higher education using a coupling analysis: a case study of china's coastal areas. Mar. Policy 132. doi: 10.1016/j.marpol.2021.104706
Wang L. L., Su M., Kong H., Ma Y. X. (2021). The impact of marine technological innovation on the upgrade of china's marine industrial structure. Ocean Coast. Manage. 211. doi: 10.1016/j.ocecoaman.2021.105792
Xia K., Guo J. K., Han Z. L., Dong M. R., Xu Y. (2019). Analysis of the scientific and technological innovation efficiency and regional differences of the land-sea coordination in china's coastal areas. Ocean Coast. Manage. 172, 157–165. doi: 10.1016/j.ocecoaman.2019.01.025
Zhang Y., Wang S. H. (2021). Influence of marine industrial agglomeration and environmental regulation on marine innovation efficiency-from an innovation value chain perspective. Mar. Policy 134. doi: 10.1016/j.marpol.2021.104807
Zhang F. Q., Wang Y., Liu W. (2020). Science and technology resource allocation, spatial association, and regional innovation. Sustainability 12 (2). doi: 10.3390/su12020694
Zheng H., Zhang J. C., Zhao X., Mu H. R. (2020). Exploring the affecting mechanism between environmental regulation and economic efficiency: new evidence from china's coastal areas. Ocean Coast. Manage. 189. doi: 10.1016/j.ocecoaman.2020.105148
Zhou P., He Y. K., Sun D., Zhu J. G., Ieee (2008). “Control and protection of a DFIG-based wind turbine under unbalanced grid voltage Dips.IEEE industry applications society annual meeting [2008 ieee industry applications society annual meeting,” in IEEE Industry-Applications-Society Annual Meeting, Alberta, CANADA, Vol. 1-5.
Keywords: marine science and education, input/output efficiency, DEA, Malmquist index model, China
Citation: Hua T, Ruan X, Qu Z, Xue C, Yang S, Yao Y and Ye G (2023) Decades performance of marine science and education by region and discipline in China. Front. Mar. Sci. 10:1203161. doi: 10.3389/fmars.2023.1203161
Received: 10 April 2023; Accepted: 18 May 2023;
Published: 30 May 2023.
Edited by:
Kum Fai Yuen, Nanyang Technological University, SingaporeCopyright © 2023 Hua, Ruan, Qu, Xue, Yang, Yao and Ye. This is an open-access article distributed under the terms of the Creative Commons Attribution License (CC BY). The use, distribution or reproduction in other forums is permitted, provided the original author(s) and the copyright owner(s) are credited and that the original publication in this journal is cited, in accordance with accepted academic practice. No use, distribution or reproduction is permitted which does not comply with these terms.
*Correspondence: Guanqiong Ye, Z3F5QHpqdS5lZHUuY24=
†These authors have contributed equally to this work and share first authorship