 Elizabeth Duskey1,2*
- 1Department of Environmental and Forest Biology, State University of New York College of Environmental Science and Forestry, Syracuse, NY, United States
- 2Department of Aquatic Resources, Swedish University of Agricultural Sciences, Uppsala, Sweden
Marine hypoxia has had major consequences for both economically and ecologically critical fish species around the world. As hypoxic regions continue to grow in severity and extent, we must deepen our understanding of mechanisms driving population and community responses to major stressors. It has been shown that food availability and habitat use are the most critical components of impacts on individual fish leading to observed outcomes at higher levels of organization. However, differences within and among species in partitioning available energy for metabolic demands – or metabolic prioritization – in response to stressors are often ignored. Here, I use both a multispecies size spectrum model and a meta-analysis to explore evidence in favor of metabolic prioritization in a community of commercially important fish species in the Baltic Sea. Modeling results suggest that metabolic prioritization is an important component of the individual response to hypoxia, that it interacts with other components to produce realistic community dynamics, and that different species may prioritize differently. It is thus suggested that declines in feeding activity, assimilation efficiency, and successful reproduction – in addition to low food availability and changing habitat use – are all important drivers of the community response to hypoxia. Meta-analysis results also provide evidence that the dominant predator in the study system prioritizes among metabolic demands, and that these priorities may change as oxygen declines. Going forward, experiments and models should explore how differences in priorities within and among communities drive responses to environmental degradation. This will help management efforts to tailor recovery programs to the physiological needs of species within a given system.
1 Introduction
Deoxygenating waters are a severe and enduring threat to communities of aquatic organisms (Wu, 2002). Worldwide, oxygen has declined precipitously in both marine and freshwater systems (Diaz and Breitburg, 2009). In the marine environment, declines are driven by warming waters, increased nutrient loading, and changes in stratification (Breitburg et al., 2018). Ocean surface concentrations are expected to continue to decrease by 2-4% by 2100 (Cocco et al., 2013). This can lead to hypoxia. Hypoxia is often defined as concentrations below 2 mg·L -1, though criteria can vary by community (Hofmann et al., 2011). Projected increases in the extent and severity of hypoxia will likely result in negative impacts on the structure and function of marine communities worldwide (Pezner et al., 2023; Thompson et al., 2023).
Fish communities experience marked changes in response to deoxygenation. These include composition, distribution, size structure, availability and diversity of prey, and species interactions (Junk et al., 1983; Saint-Paul and Soares, 1987; Pollock et al., 2007; Roberts et al., 2009; Thompson et al., 2023). Changes in community processes in response to hypoxia ultimately emerge from coping strategies of individual fish, such as: morphological changes (Val et al., 1998), increasing gill perfusion, ventilation, and rates of oxygen extraction (Farrell and Richards, 2009) as well as compensatory declines in metabolic rate and changes in gene expression leading to long-term acclimatization (Richards, 2009). Individuals may also alter their behavior. Changes in habitat selection, locomotor activity, predator avoidance, air breathing (if capable), and aquatic surface respiration (ASR) have all been observed in response to hypoxia (Kramer, 1987). These individual responses can be conceptualized in reference to aerobic scope. Aerobic scope, or the difference between maximum and resting oxygen consumption, is a key parameter determining individual fitness (Portner et al., 2017). It represents an animal’s capacity to deliver oxygen to tissues for activity in excess of cellular maintenance (Fry, 1947). High aerobic scope is typically associated with active fishes with low hypoxia tolerance, while low aerobic scope is associated with relatively sedentary fishes with high hypoxia tolerance, though there is some variability arising from habitat type and evolutionary history (Fu et al., 2022). Oxygen consumption at rest often remains constant, but maximum consumption falls in response to deoxygenation (Oldham et al., 2019). This results in a decrease in aerobic scope and therefore in oxygen available for activity. In fact, hypoxia can be defined in relation to the ambient oxygen levels at which aerobic scope progressively declines (Farrell and Richards, 2009). Declines in individual physiological and behavioral activities which use a large percentage of the aerobic scope are therefore a compensatory mechanism used to protect the remaining scope (Wang et al., 2009).
There is evidence that fish prioritize certain activities as a part of their strategy to cope with declining oxygen (Kramer, 1987; Claireaux and Chabot, 2016). For example, in moderate hypoxia, European sea bass (Dicentrarchus labrax) maintain exercise performance (critical swimming speed, Ucrit) in lieu of specific dynamic action (SDA; Jourdan-Pineau et al., 2010). By contrast, southern catfish (Silurus meridionalis Chen) maintain digestion in lieu of locomotion in moderate hypoxia (Zhang et al., 2010). That is, fish species may prioritize energetically costly activities differently based on habitat, aerobic scope, and evolutionary background (Fu et al., 2022). This is referred to as metabolic prioritization. It is defined as the phenomena in which the proportion of the aerobic scope dedicated to a given behavior or internal process changes with intensifying stressors (Jourdan-Pineau et al., 2010). Metabolic prioritization may be due in part to oxygen demand, as energetically costly processes like digestion can use a larger percentage of scope in hypoxic waters (Jordan and Steffensen, 2007). Several laboratory studies have demonstrated negative impacts of hypoxia on appetite, digestion, activity, and reproduction (Wang et al., 2009; Wu, 2009; Thomas et al., 2015). This can lead to stunted growth and poor body condition (Casini et al., 2016), exacerbated by declines in prey density and availability (Eby et al., 2005). While these phenomena are relatively well-studied in isolation, it is generally unknown how individuals of different species prioritize among behavioral and physiological processes as oxygen declines. Experiments have shown that differences in vulnerability to environmental degradation among species and functional groups can lead to marked changes in species interactions, spatial dynamics, and community composition (Roberts et al., 2009; Smith et al., 2014; de Mutsert et al., 2016; Chu and Gale, 2017). Might these differences arise in part due to differential metabolic prioritization among and within species?
In exploring the impacts of environmental stressors on communities, integrative models can help determine linkages between individual physiology and behavior, and emergent dynamics (Pollock et al., 2007; Koenigstein et al., 2016). This has been shown in a number of systems with several ecological stressors (Carroll and Smit, 2011; Johnston et al., 2011; Parisi et al., 2021). One such integrative tool is the size spectrum model (SSM). This framework can simulate growth, reproduction, mortality, and habitat use of individuals of each species and resource within a community from size-based vital rates (Scott et al., 2014). Dynamics ultimately emerge at the population and community levels, making the SSM an ideal method by which to understand how responses to stressors across biological levels of organization are connected. In a recent study, Duskey et al. (2023) used a SSM to explore how individual vulnerability to hypoxia may lead to observed community structure using the Baltic Sea as a case study. They showed that prey availability and habitat use are critical components structuring fish community responses to hypoxia. They also suggested that physiological and behavioral activities such as search rate, consumption, assimilation, and reproduction may not be as important. While it is possible that fish escape hypoxic waters before they incur significant physiological costs, there is direct evidence that hypoxic waters impact fish physiology in the Baltic Sea (Limburg and Casini, 2019). Furthermore, Duskey et al. (2023) made the simplifying assumption that all physiological and behavioral activities decline in response to hypoxia at the same rate. Thus, individuals in the model were not able to prioritize among these activities. Such simplifying assumptions are common in ecosystem models. Examples include ignoring changes in all but one or two activities in response to hypoxia and the aggregation of several activities into a higher order process such as growth (Karim et al., 2003; de Mutsert et al., 2016; LaBone et al., 2021). This is a valid approach which provides valuable insight into fish population and community response to hypoxia. However, in order to use integrative models to better anticipate the effects of marine hypoxia across levels of biological organization, we must have an adequate understanding of how individuals balance metabolic demands as environmental stressors intensify.
Here, I used both a SSM and a meta-analysis to explore evidence for metabolic prioritization in fish communities. For the SSM, I used the same model structure and data sources found in Duskey et al. (2023). In contrast to this study, I allowed for metabolic prioritization by relaxing the assumption that all physiological and behavioral activities decline with oxygen at the same rate. In order to test this new model’s predictive capabilities relative to those of the model in Duskey et al. (2023), I calibrated it to reflect the same community of commercially important fishes in the Central Baltic Sea: Baltic cod (Gadus morhua), flounder (Platichthys flesus and the recently discovered Platichthys solemdali), sprat (Sprattus sprattus), and Atlantic herring (Clupea harengus). While some were ignored, the Baltic Sea is overall a species poor system (Bonsdorff, 2006), and those included represent the dominants. I compared the results of this novel model to address the following questions: (1) is there evidence for metabolic prioritization in observed dynamics of somatic growth, biomass, and fisheries yield? (2) does this match evidence of metabolic prioritization from laboratory experiments on benthic species exposed to hypoxia? and (3) do predicted impacts of hypoxia on growth, population dynamics, and energy flow change when individuals are allowed to prioritize among metabolic demands? Respectively, I hypothesized: (1) predictions of growth and population dynamics from the SSM would improve with the inclusion of metabolic prioritization; (2) the meta-analysis would provide additional evidence of metabolic prioritization in species exposed to hypoxia, and that the observed and predicted patterns of prioritization would match those of the SSM; but that (3) predicted impacts would be similar among this study and that of Duskey et al. (2023). That is, while simulated outcomes at higher levels of biological organization would be similar, the mechanisms leading to those outcomes would be different. The results of this set of analyses can help to guide both model parameterization and further experimentation as we continue to investigate the effects of hypoxia on marine communities.
2 Methods
I used two methods to investigate metabolic prioritization in marine fish communities. First, I repeated the analysis presented in Duskey et al. (2023) with separate sets of oxygen-dependent parameters for each of the following physiological and behavioral rates: (1) search, (2) maximum consumption, (3) reproductive efficiency (alternatively understood as egg survival), (4) assimilation efficiency, and (5) maintenance costs i.e. the proportion of total ingested mass used for cellular maintenance. I then compared the results to those from the original analysis, in which there was only one set of parameters for rates (1-4), which are expected to decline in hypoxic conditions, and another set for rate (5), which is expected to rise in hypoxic conditions due to accumulation of byproducts of anaerobiosis (Thomas et al., 2019). The following two outcomes are considered to be evidence in favor of metabolic prioritization: (1) inclusion of physiological and behavioral rates in the best fitting model to observed community dynamics, and (2) a reduction in error in models with metabolic prioritization compared to their counterparts without metabolic prioritization. The first implies that oxygen dependence of individual physiology and behavior impact higher-order dynamics. The second implies that metabolic prioritization is critical to the proper characterization of physiology and behavior. Taken together, (1) and (2) lead to the conclusion that metabolic prioritization is an important component of fish community response to deoxygenation.
Second, I looked for evidence in the literature by performing a meta-analysis on the effects of deoxygenation on proportional declines in rates of activity, consumption, and food conversion efficiency (FCE) in the top predator in my study system, Atlantic cod (Gadus morhua). Here, evidence in favor of metabolic prioritization is construed as a statistically significant improvement in model fit when activity, consumption, and FCE are allowed to decline with oxygen independently as compared to when they must all decline at the same rate.
The files necessary to replicate this study can be found in the GitHub repository: https://github.com/epduskey/physoxiaSSM.
2.1 Study system
The Baltic Sea is a large inland sea characterized by broad environmental gradients in temperature, salinity, and oxygen (Snoeijs-Leijonmalm and Andren, 2017). As in Duskey et al. (2023) this study focuses on the Central Baltic Sea. This region experiences year-round hypoxic conditions, the extent and severity of which has increased over the past few decades (Carstensen and Conley, 2019). There are extensive databases on both oceanographic and biological attributes of the Baltic Sea. Estimates of spawning stock biomass (SSB), fisheries yield, and size-at-age were extracted either from the ICES Database on Trawl Surveys (DATRAS; ICES, 2020b) or from stock assessments (ICES, 2020a). Oxygen data were extracted from the Swedish Meteorological and Hydrological Institute (SMHI) for the years 1980–2020. Bottle data from ICES statistical rectangles with a depth of 50–120 m were used to estimate average temporal trends of oxygen in the pelagic (10–40 m) and benthic (bottom 10m) habitats in the entire Central Baltic Sea. The presence of widespread hypoxia and the availability of data make this an ideal system for the investigation of community responses to deoxygenation.
2.2 Size spectrum model
I used a multispecies size structured food web model, referred to here as a size spectrum model (SSM), to simulate fish community dynamics in my study system. In these models, individual-level rates of growth, reproduction, and mortality are determined in large part by allometric functions of body size. Energy flows via trophic relationships, and conservation of mass is determined by the McKendrick-von Foerster equation (Silvert and Platt, 1978):
where ni is population size, gi is somatic growth, and mi is mortality of species i. This partial differential equation describes the balance between gains in mass due to somatic and population growth, and losses due to mortality. Recruitment, R, of individuals of species i at size w0 is determined by the boundary condition:
Costs of maintenance and imperfect assimilation of consumed food constitute losses. Recruitment is limited by a Beverton-Holt stock-recruitment relationship. Species are distinguished by unique estimates of von Bertalanffy growth parameters, maturity ogives, and both size- and species-based feeding preferences. Natural mortality may occur either via predation or additional unspecified processes, and fishing mortality is determined by the user. This model structure produces dynamics at the population and community level. Therefore, one can use it to explore the effects of changes in individual physiological and behavioral processes on higher levels of organization. Results can be compared to observed dynamics, including estimates of biomass, yield, and growth arising from stock assessment procedures.
The effects of stressors can be included by linking food availability, habitat use, mortality, and physiological and behavioral rates to the oxygen concentration experienced by each individual. In the model described in Duskey et al. (2023), benthic food availability (B), occupancy of individuals in the benthic habitat (O), mortality (M), and physiological and behavioral rates (search, maximum consumption, assimilation efficiency, and reproductive efficiency/egg survival; P) are all rendered as functions of oxygen. Each of these were expressed as a product of the value without oxygen dependence (ξ0) and a scaling equation varying with oxygen. For B, modeled with a simple semi-chemostat equation (Scott et al., 2014), the carrying capacity κb is a logistic (S-curve) type function of benthic oxygen at time t, Ob,t:
Parameters Uκb and kκb determine the rate of decline of carrying capacity at normoxia, κ0,b, with oxygen and the inflection point, respectively. O and P (with the exception of maintenance costs) for an individual of species i at weight w and time t are a similar logistic function of oxygen:
where Oiwt is oxygen exposure. The symbol ξ is a dummy variable meant to stand in for all rates falling within categories O and P relative to ξ0,iw the rate at normoxia. As above, parameter Uξ,i determines the rate of decline with oxygen. The inflection point is a product of kξ,i and critical oxygen level, or Pcrit,iw. This can be defined as the minimum ambient oxygen concentration at which standard metabolic rate (SMR) can be maintained. Maintenance costs (ks), increase exponentially with declining oxygen:
where ks0,iw represents approximate maintenance costs at normoxia. The value of Uks,i determines the rate of increasing costs with declining oxygen. The oxygen level at which costs double is a product of kks,i and Pcrit,iw. Finally, mortality is a simple hazard function (Chechile, 2003) of oxygen exposure:
The values of h(t) for each species are added to values of natural mortality from unknown sources chosen during calibration.
The oxygen exposure Oiwt for each individual is determined by habitat use. This is a weighted average of oxygen in both habitats:
where O b,t and O p,t are oxygen in the benthic and pelagic habitats, respectively, at time t, and where ρiwt is the probability of a fish of species i at weight w occupying the benthic habitat at time t.
Additional spatial structure can be included implicitly in a n×n matrix (n = # of species) which describes horizontal overlap of each species with all other species. Here, this matrix is multiplied by vertical overlap. This vertical overlap arises from the occupancy probability described above. These calculations can be used to approximate three-dimensional spatial interactions of species in the community (Duskey et al., 2023).
This model provides several pathways by which impacts of oxygen on individual fish can result in emergent population dynamics. These dynamics can then be fit to observations by optimizing values of and (equation 3), and (equation 4), and (equation 5), and b0,i and bi (equation 6). This can provide evidence of differential sensitivity to stressors of species within the community, individuals within species, rates within individuals, and their combined impact on the community as a whole.
I used this new model structure and repeated the analysis performed in Duskey et al. (2023). Details are described within. Briefly, I calibrated all 16 possible combinations of oxygen dependence of benthic resources (B), cod benthic occupancy (O), mortality (M), and behavioral and phsyiological rates (P), including a model with no oxygen dependence, to observations of fish community dynamics in the Central Baltic Sea. In addition to the fish species listed above, the model also includes a pelagic food source (referred to as “plankton”) and a benthic food source (referred to as “benthos”). The calibration period included the years 1991-2000. This period was chosen because it includes high contrast in oxygen levels and species responses (Duskey et al., 2023). Unlike in Duskey et al. (2023), I included metabolic prioritization for species directly exposed to hypoxia i.e. cod and flounder. In practice, this means that I allowed all rates within P – search, maximum consumption, assimilation, reproductive efficiency/egg survival, and maintenance costs – to change with oxygen independently of one another. I projected biomass, fisheries yield, and individual somatic growth during the years 2001–2019 in order to choose a model. I calculated weighted error in fits of these projections to published observations of SSB, fisheries yield, and growth for each species during this time period. The best model was considered to be the one with the lowest total error. This out-of-sample approach to fitting and model selection is generally very robust (Cooke et al., 2014).
I also performed a sensitivity analysis on the models with metabolic prioritization as in Duskey et al. (2023). I reran the analysis described above three additional times with randomly generated starting values for each set of parameters. This gave a rough measure of variability in error in fits to observations as a result of the nature of the optimization procedure. If the best model included oxygen dependence of physiological and behavioral rates (P) across all four repetitions of the analysis, then I considered this to be evidence in favor of metabolic prioritization.
2.3 Meta-analysis
In addition to the analytical approach described above, I also performed a meta-analysis to examine how activity, consumption, and food conversion efficiency of Gadiform fishes respond to declining oxygen. Studies of all of these rates, or analogous rates, together in response to declining oxygen appear to be rare. I combine them here to investigate differences in effect sizes among rates. While my intention was to examine all species exposed to hypoxia in the benthic environment, I ultimately chose not examine Pleuronectiformes for two reasons: (1) experimental data availability on Pleuronectiformes was poor (see GitHub repository), and (2) because growth of the flounder in the models was fit to just one year of data. Furthermore, estimates of SSB were not available, and were based on a constant ratio of flounder to cod SSB. The very high level of uncertainty in flounder data produces equally uncertain estimates of hypoxia sensitivity. Therefore, I only examined cod and their relatives.
I used Web of Science to search for experimental studies on 3 February, 2023. The search terms were: “(gadiform* OR gadid* OR gadus) AND (search OR activity OR speed OR consumption OR intake OR conversion OR assimilation OR “specific dynamic action” OR SDA OR “egg survival” OR “egg mortality” OR “metabolic rate”) AND (hypoxi* OR oxygen* OR deoxygen*).” The query can be found at https://www.webofscience.com/wos/woscc/summary/bf15bcf6-1574-4042-b48f-0a603fad426a-6dcdc03f/relevance/1. This produced 474 papers. I selected those whose title or abstract made it clear that an experiment was conducted with gadiform fishes and oxygen levels either observed or made to vary. This resulted in 25 papers in total. I performed forwards and backwards citation searches, which produced an additional 964 and 586 studies, respectively. None of these were retained in the final analysis. The results of all searches are included as Supplementary files.
In examining the 25 papers chosen during the initial search, I applied the following inclusion criteria: the use of Gadiform fishes; controlled and measured oxygen variability; and measurements of activity, consumption, or food conversion efficiency (FCE) taken during periods of steady oxygen. This whittled down the number of papers to 10 in total (Thorarensen et al., 2017; Zhang et al., 2018; Koedijk et al., 2012; Herbert et al., 2011; Petersen and Gamperl, 2010; Skjæraasen et al., 2008; Dutil et al., 2007; Johansen et al., 2006; Herbert and Steffensen, 2005; Chabot and Dutil, 1999; Schurmann and Steffensen, 1994). I extracted data and experimental details from each of these studies either by copying directly from tables, when available, or by using Web Plot Digitizer (Rohatgi, 2021). I then calculated a proportional measure of effect size within each experiment and rate:
While standardized effect size is often used in meta-analysis, I chose to use a proportional measure as it is scale-independent of the variance, interpretable, and easy to calculate, much like the simple effect size (Baguley, 2009). This transformed measure of effect size also corresponds to the logistic model of oxygen dependence (equation 4). Given the largest possible values of each rate typically appear at the highest oxygen levels tested, this transformation corresponds approximately to a measure often reported in behavioral research referred to as percentage of maximum possible score (POMP; Cohen et al., 1999). I did not scale results with standard deviation, as within each physiological rate, the values are already comparable (Bond et al., 2003). I did, however, calculate a relative measure of standard error for each rate within each study:
Data processing ultimately resulted in 119 effect sizes: 91 observations of activity, 14 observations of consumption, and 14 observations of FCE.
To test for metabolic prioritization in these data, I built three models in Stan (Carpenter et al., 2017; R Stan, 2023). The first, the null hypothesis model, included just one set of parameters – U and k as in equation 4, as well as population standard deviation σ – for all rates. The alternative hypothesis model included a separate set of parameters for each of the three rates. While data on temperature and age class of individuals upon capture were available, I chose not to include these in the model. Several of the studies included growth experiments, and often the size during experimentation was not reported. Contrast in temperature was not adequate for the estimation of interaction terms. However, both the null and the alternative models were weighted by the inverse of the relative standard error (equation 9) and assumed a random, multiplicative effect of study for each of the three rates. I used standard, so-called uninformative priors for the parameters:
The parameters U, k, and σ are as stated directly above. The modifier T[0,] indicates that the distribution is truncated below at zero. The effect of study is given by a normal distribution with mean µstudy and standard deviation σstudy. I compared the null hypothesis model to the alternative hypothesis model using approximate leave-one-out cross-validation (LOO-CV; Vehtari et al., 2017). Briefly, if the expected predictive accuracy of the alternative model is higher, then the difference between this and the null hypothesis model will be negative. I considered this estimated difference to be statistically meaningful if its absolute value was greater than twice its standard error.
As an additional test of the appropriateness of scaling physiological and behavioral rates using a logistic function (e.g. equation 4), I also compared the alternative hypothesis model to an additional model in which rates were instead dependent upon a Michaelis-Menten function of oxygen:
All subscripts, and fixed and independent variables are given as in equation 4. The only parameter in this function is k, which determines the oxygen exposure at which rate ξ falls to half its observed maximum. This parameter had the following prior:
The priors for the random study effect and rate-dependent standard deviation were all identical to those in equation 10. I used LOO-CV for this comparison as well.
2.4 Implementation
I built, calibrated, and projected all multispecies size spectrum models using the mizer package (Scott et al., 2014; Delius et al., 2022) in R (R Core Team, 2022). The details of calibration, projection, and error calculation are described in in Duskey et al. (2023). I built all Bayesian models for the meta-analysis using the R package RStan (Stan Development Team, 2023). The target average acceptance probability (adapt-delta) was set to 0.99 and the maximum tree depth to 15. Each model ran on 4 parallel cores with 5,000 warmup iterations and 5,000 sampling iterations. All models converged according to the Gelman-Rubin diagnostic ( ; Gelman and Rubin, 1992). There were no divergent transitions, and no iterations exceeded the maximum tree depth. The estimated Bayesian fraction of missing information (E-BFMI) indicated that there was no pathological behavior in the sampler. Each parameter from all three models had more than 4,000 effective samples. Therefore, I considered each model well-behaved and well-suited for hypothesis testing and inference.
3 Results
The size spectrum model (SSM) analysis and the meta-analysis both provide strong support for metabolic prioritization in response to marine deoxygenation. I discuss the results of each of these analyses separately below.
3.1 Size spectrum model
The results of the calibration and projection procedure indicated that the model which included oxygen dependence of benthic resource carrying capacity (B), occupancy of cod in the benthic environment (O), and physiological and behavioral rates (P) is best (Figure 1). In fact, the sensitivity analysis suggested the best model will always include B, O, and P (Figure 2). In two iterations, the best model also included oxygen dependence of mortality (M; Figure 2). However, parameter estimates for the hazard function (equation 6) describing M showed that it was independent of oxygen, i.e. bi ≈ 0. This was true across all models that included M, whether with or without metabolic prioritization. In contrast to results among models which included metabolic prioritization, the BOM model was best among those without (Duskey et al., 2023). Across four repetitions of the calibration and projection procedure, just one model included oxygen dependence of P (Duskey et al., 2023). Thus, when we allow for species directly impacted by hypoxia to prioritize distribution of energy among physiological and behavioral rates, the model selection procedure is much more likely to indicate that this is an important process in the individual, population, and community level response to marine deoxygenation.
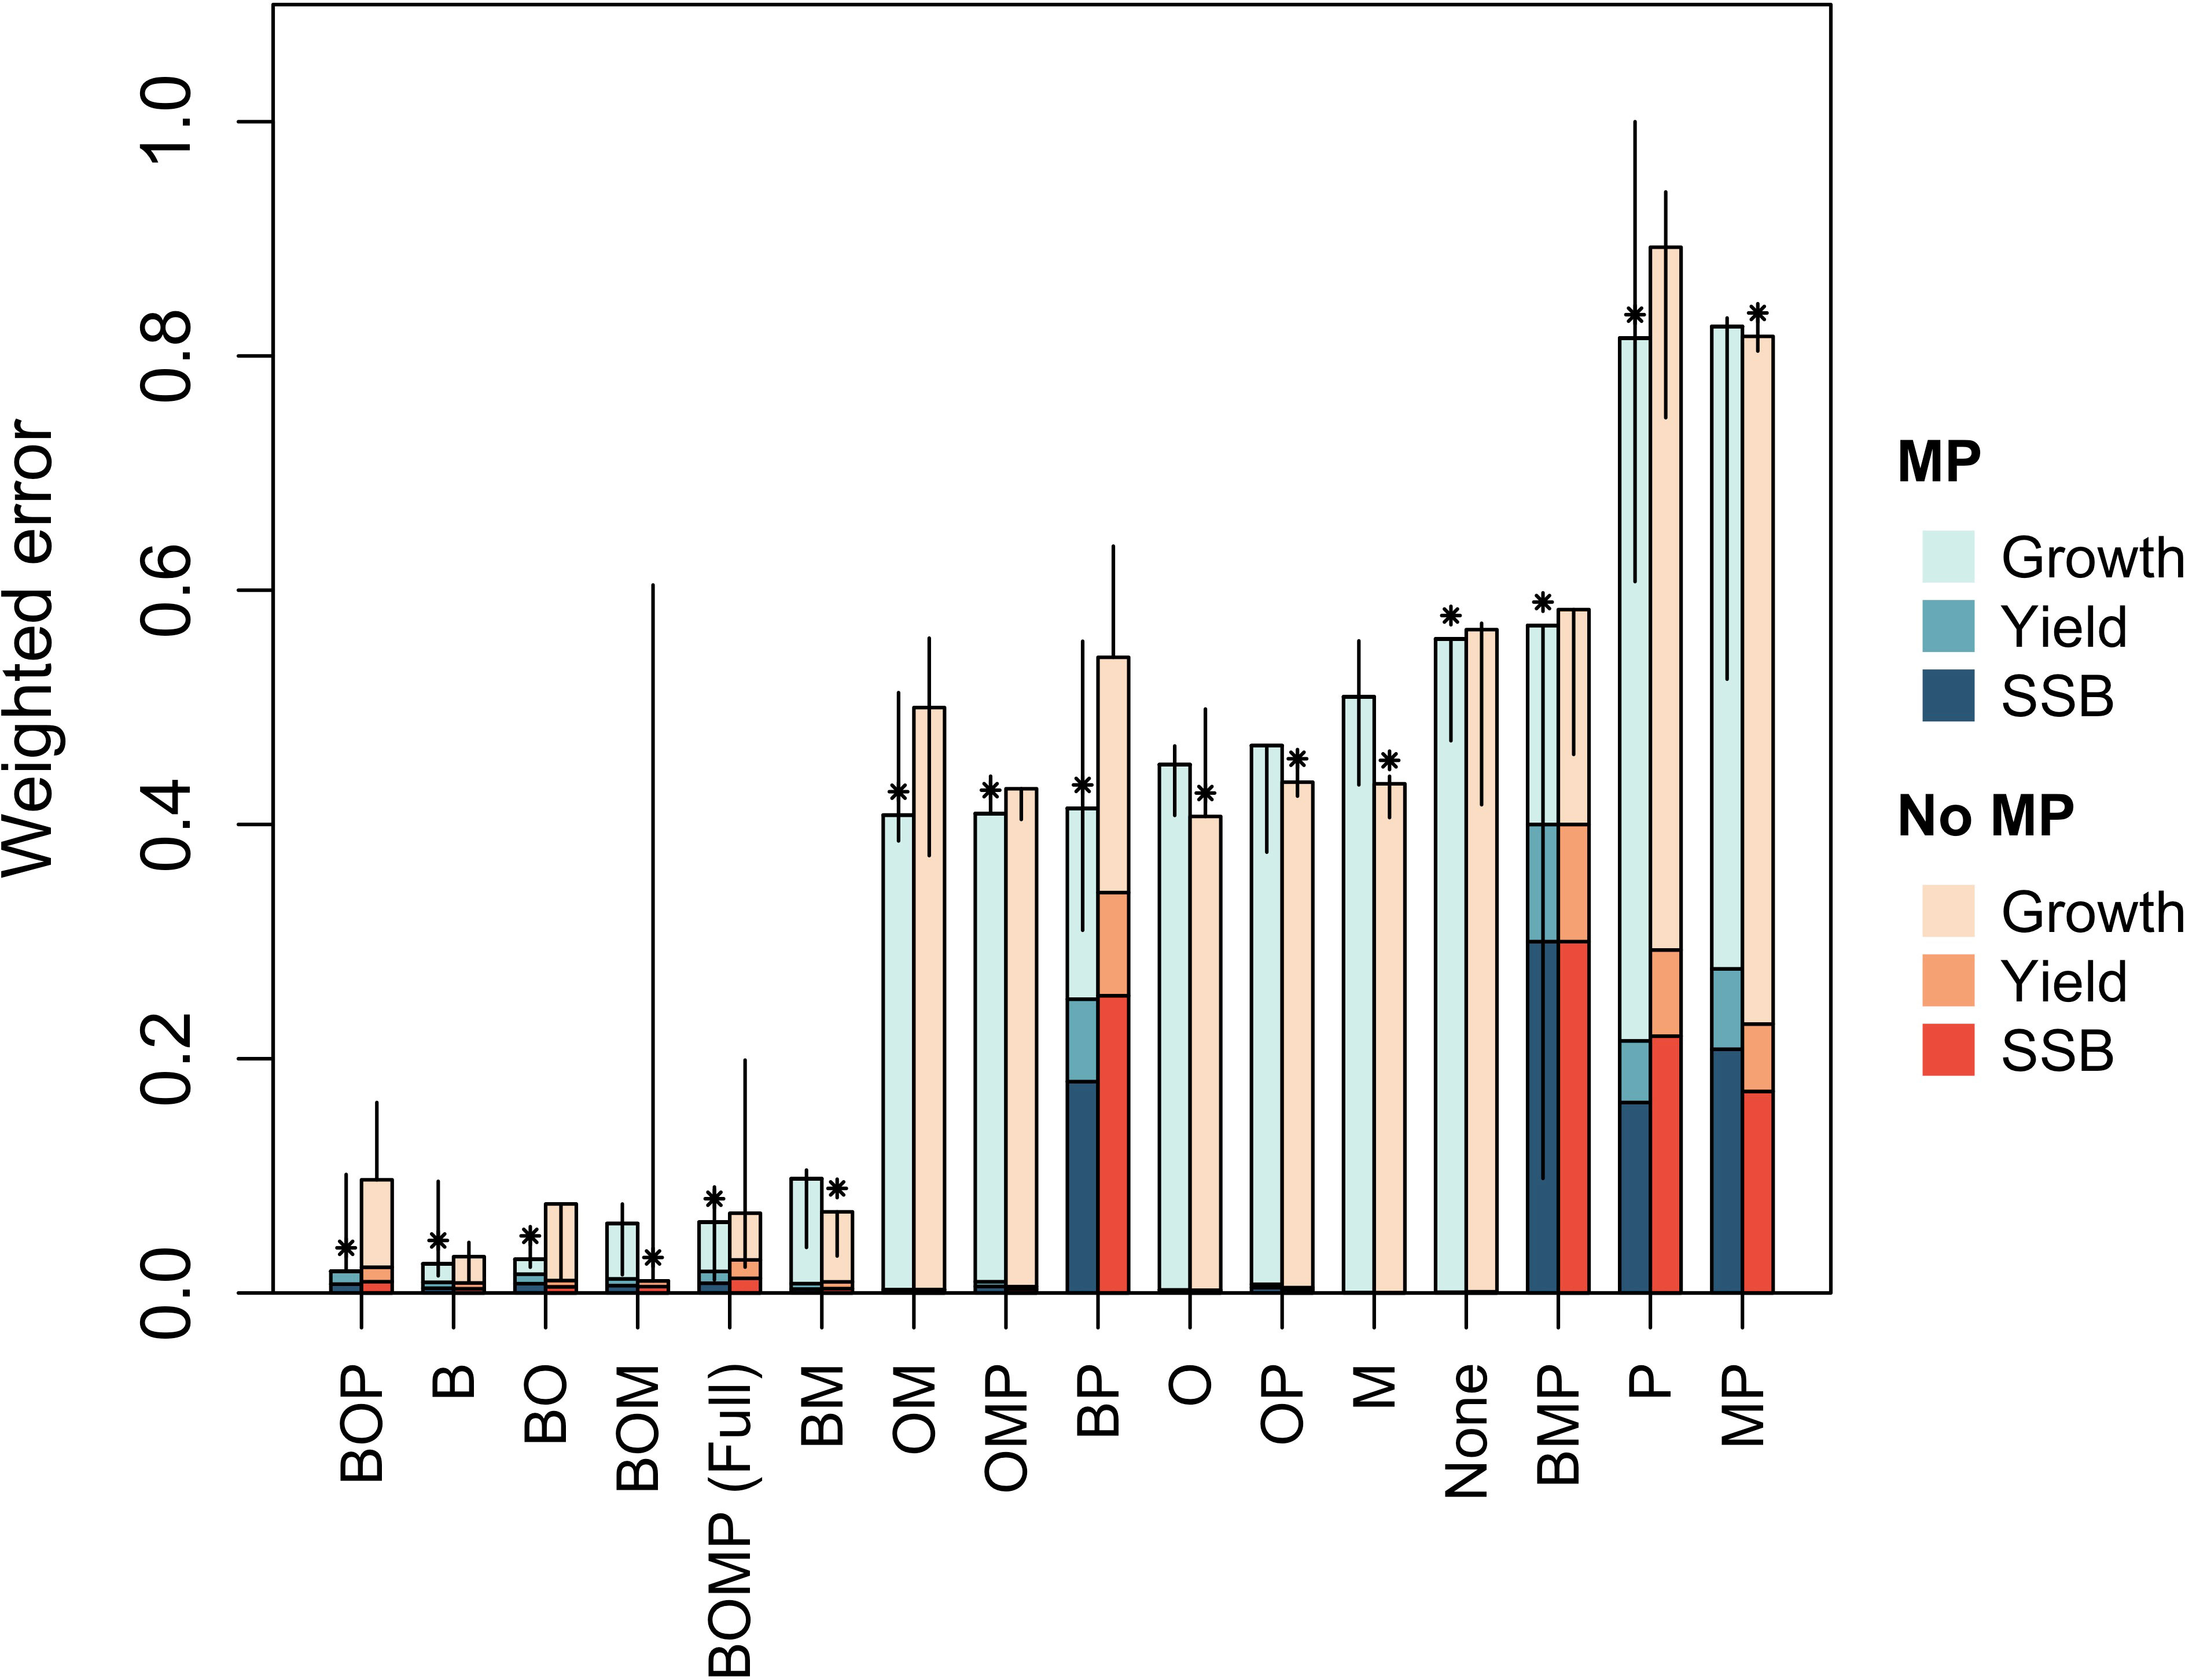
Figure 1 Weighted error for each model with (MP) and without (No MP) metabolic prioritization. Errors are scaled to fall between the minimum (0) and the maximum (1) error within each category – i.e. growth, yield, and spawning stock biomass (SSB) – and within each calibration and projection procedure. Bars give the range of total weighted error values calculated during the sensitivity analysis. Asterisks mark the best model within each pair. Models are ordered left to right from best (lowest error) to worst (highest error) according to rankings within the models with metabolic prioritization.
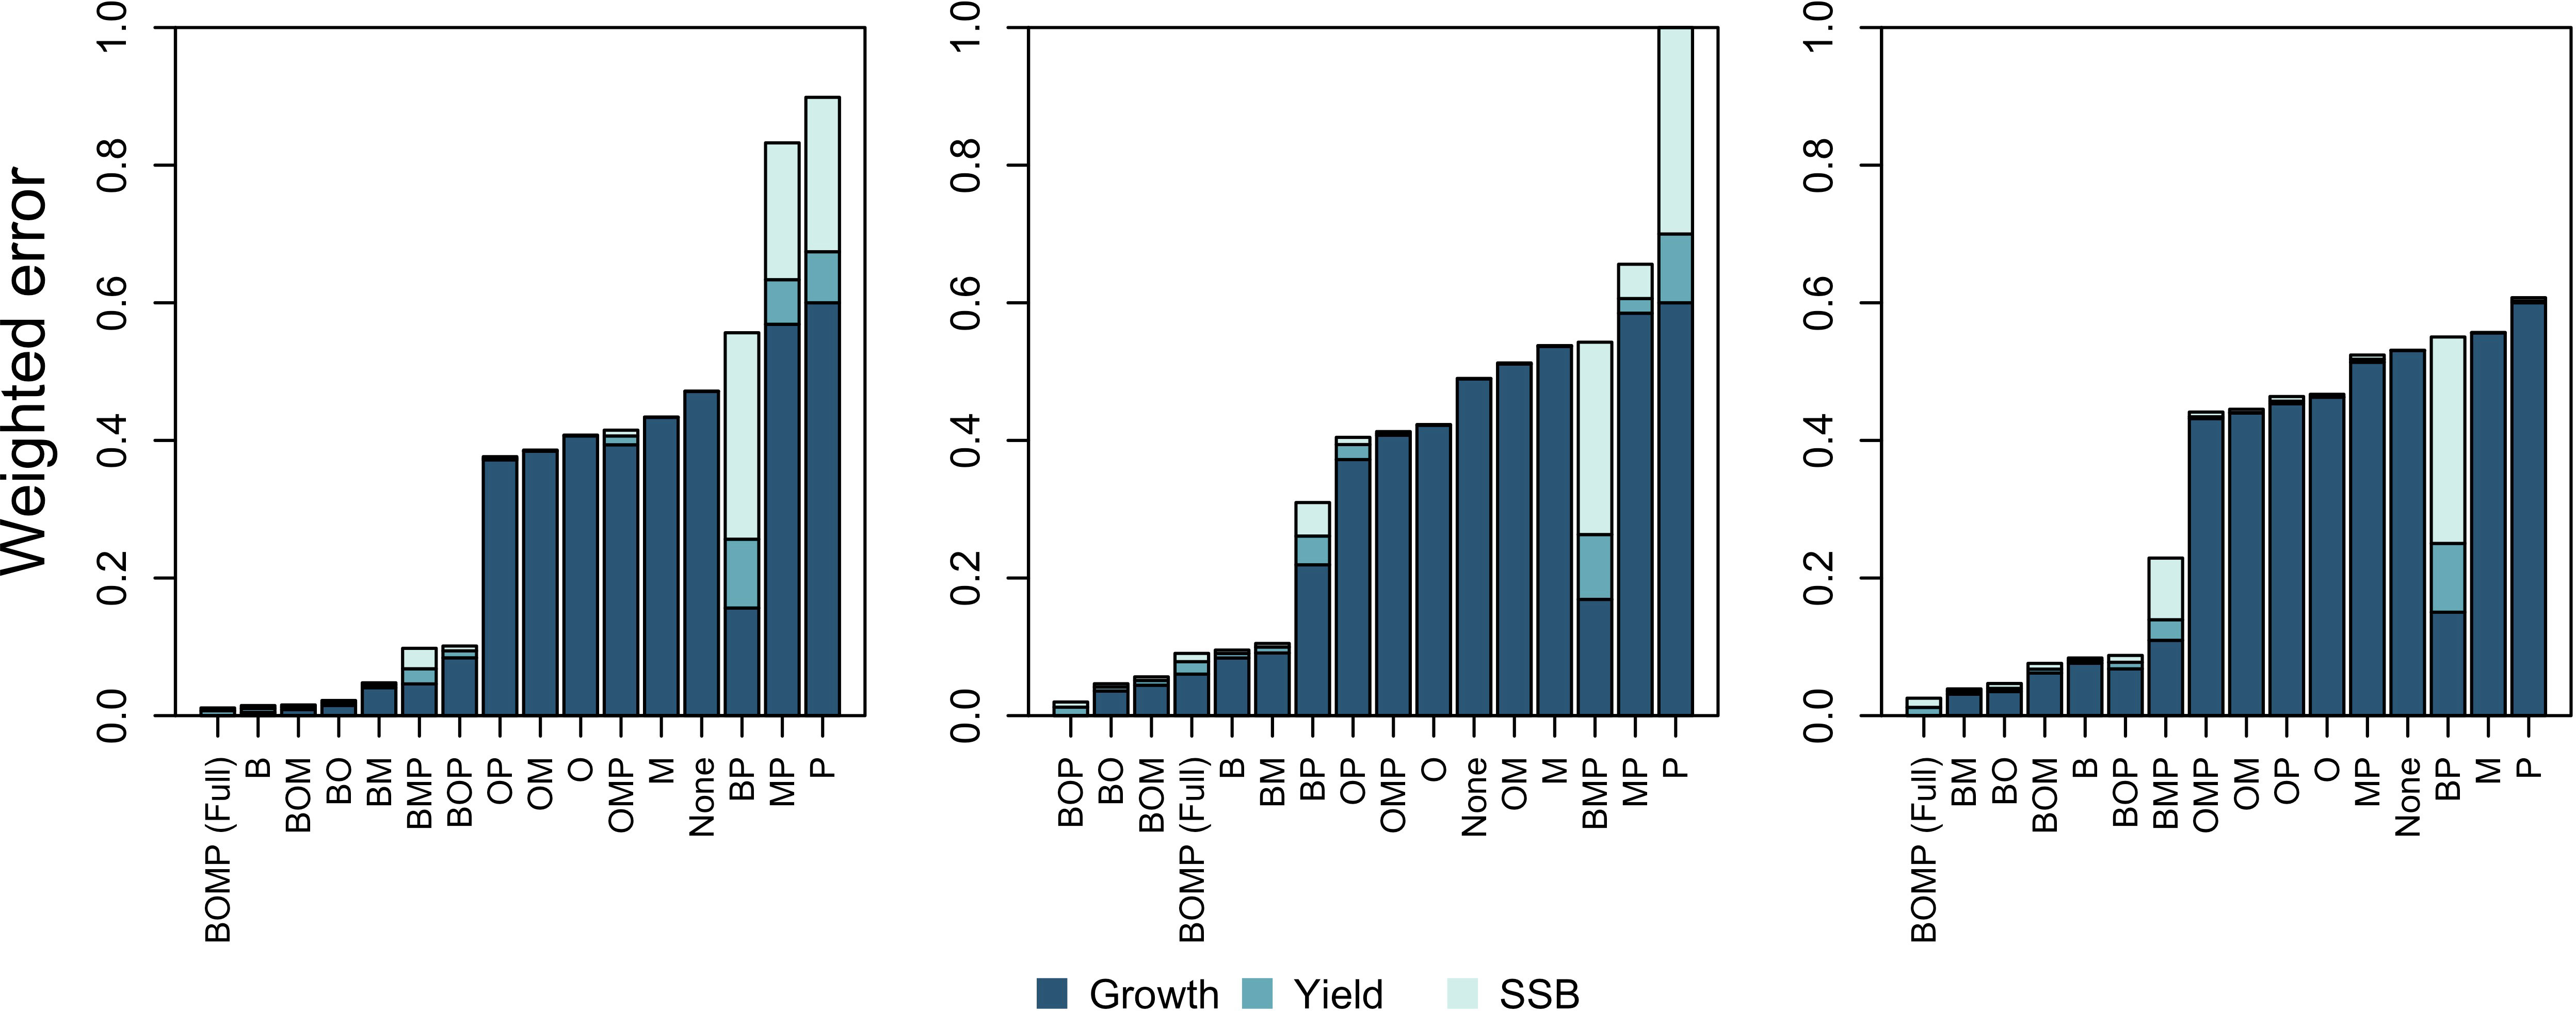
Figure 2 Weighted error across all three repetitions of the calibration and projection procedure performed for the sensitivity analysis. Stacked bars give total weighted error in growth, yield, and spawning stock biomass (SSB). Models are ordered left to right from best (lowest error) to worst (highest error).
The results from the BOP model with metabolic prioritization suggest that cod and flounder prioritize differently among rates (Table 1). Generally, cod are more sensitive to hypoxia than flounder (Figure 3). As oxygen declines, search rate is most impacted, followed by food conversion efficiency (FCE), egg survival, and lastly by consumption (Figure 3, bottom left). Partitioning among these rates also changes as oxygen falls, with FCE falling more precipitously than search rate below about 2 mL·L -1. Maintenance costs of cod increase anywhere from 1.1 to nearly 1.5 times the baseline value at oxygen concentrations just above 1 mL·L -1 (Figure 3, top left). Maintenance costs still decline, and search rate increases, at very low oxygen values as cod move into oxygenated pelagic waters (Figure 3, left). Flounder, however, appear to exhibit the opposite order of prioritization. Search rate is maintained, while consumption and FCE fall by as much as 10%. There was very little variability in flounder rates across repetitions of the fitting procedure. Egg survival had much more variability, and fell by as much as 50% in some repetitions.
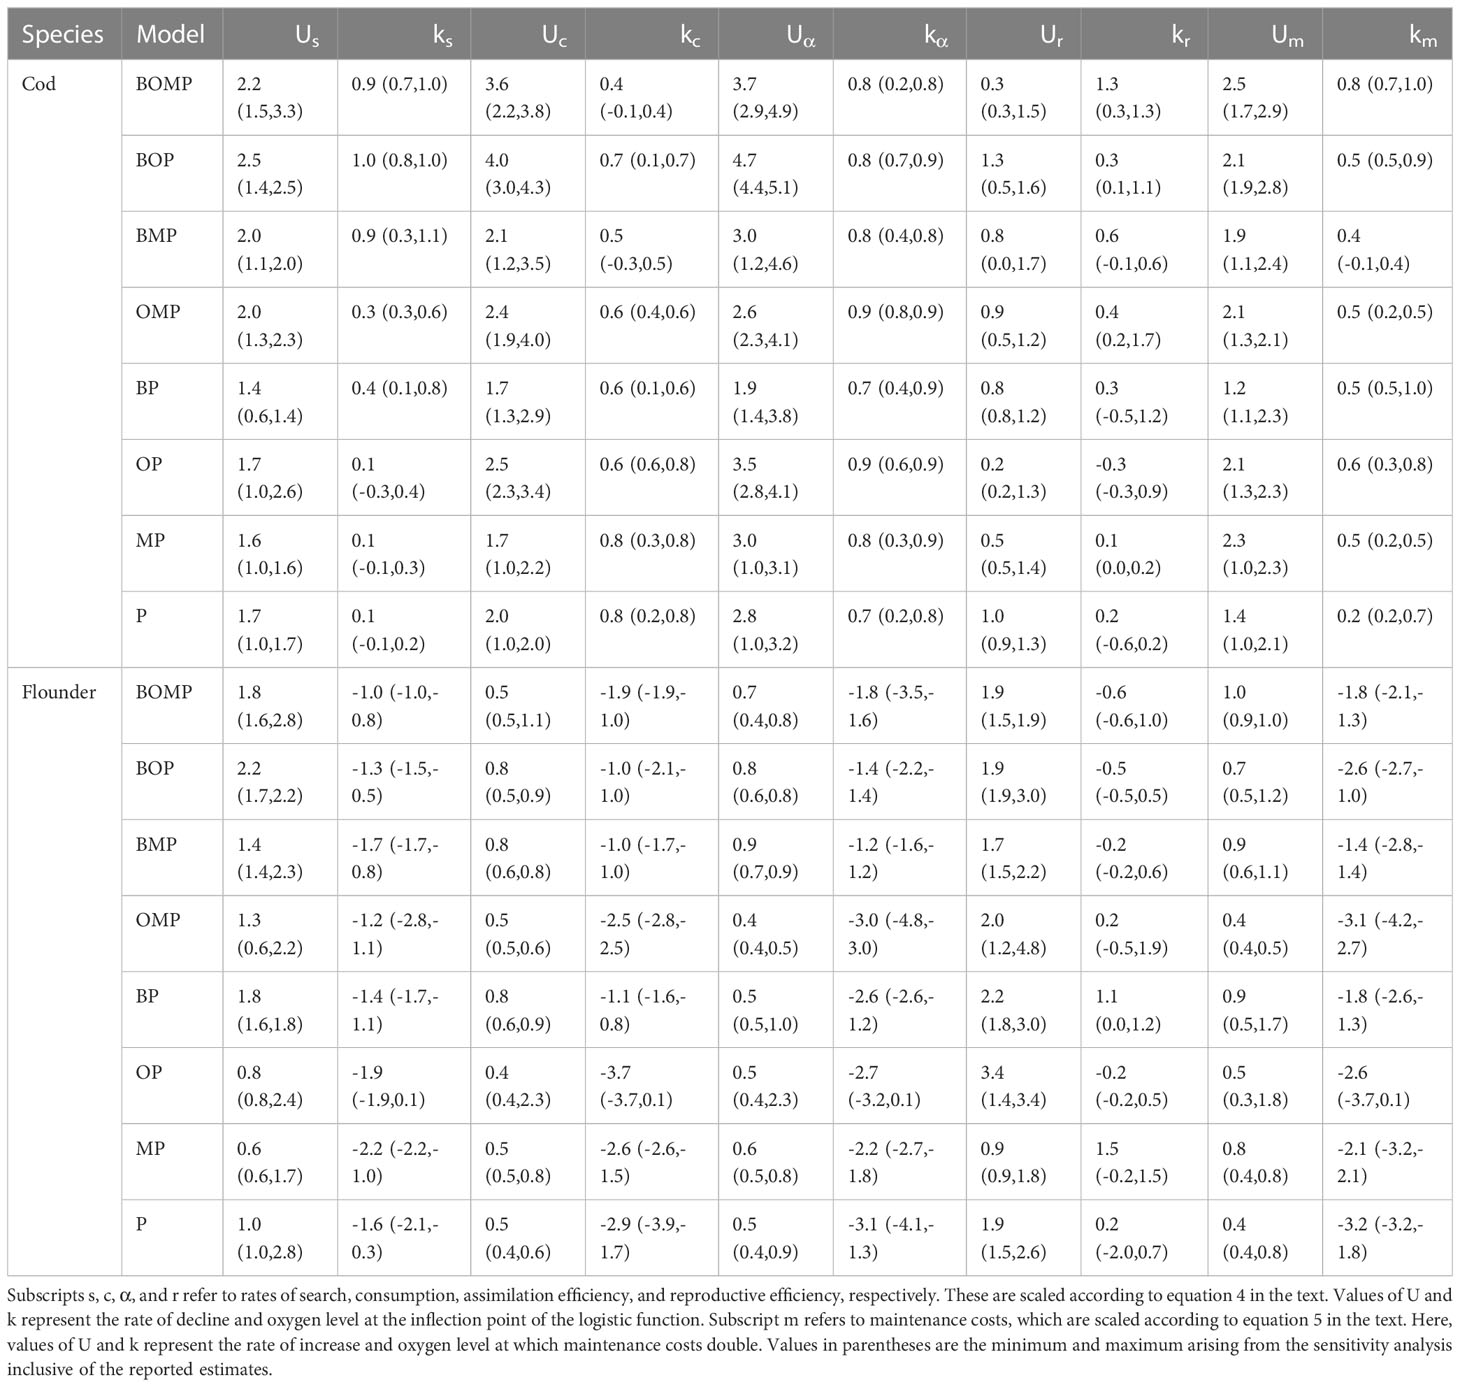
Table 1 Physiological and behavioral oxygen dependence parameter estimates from each model.
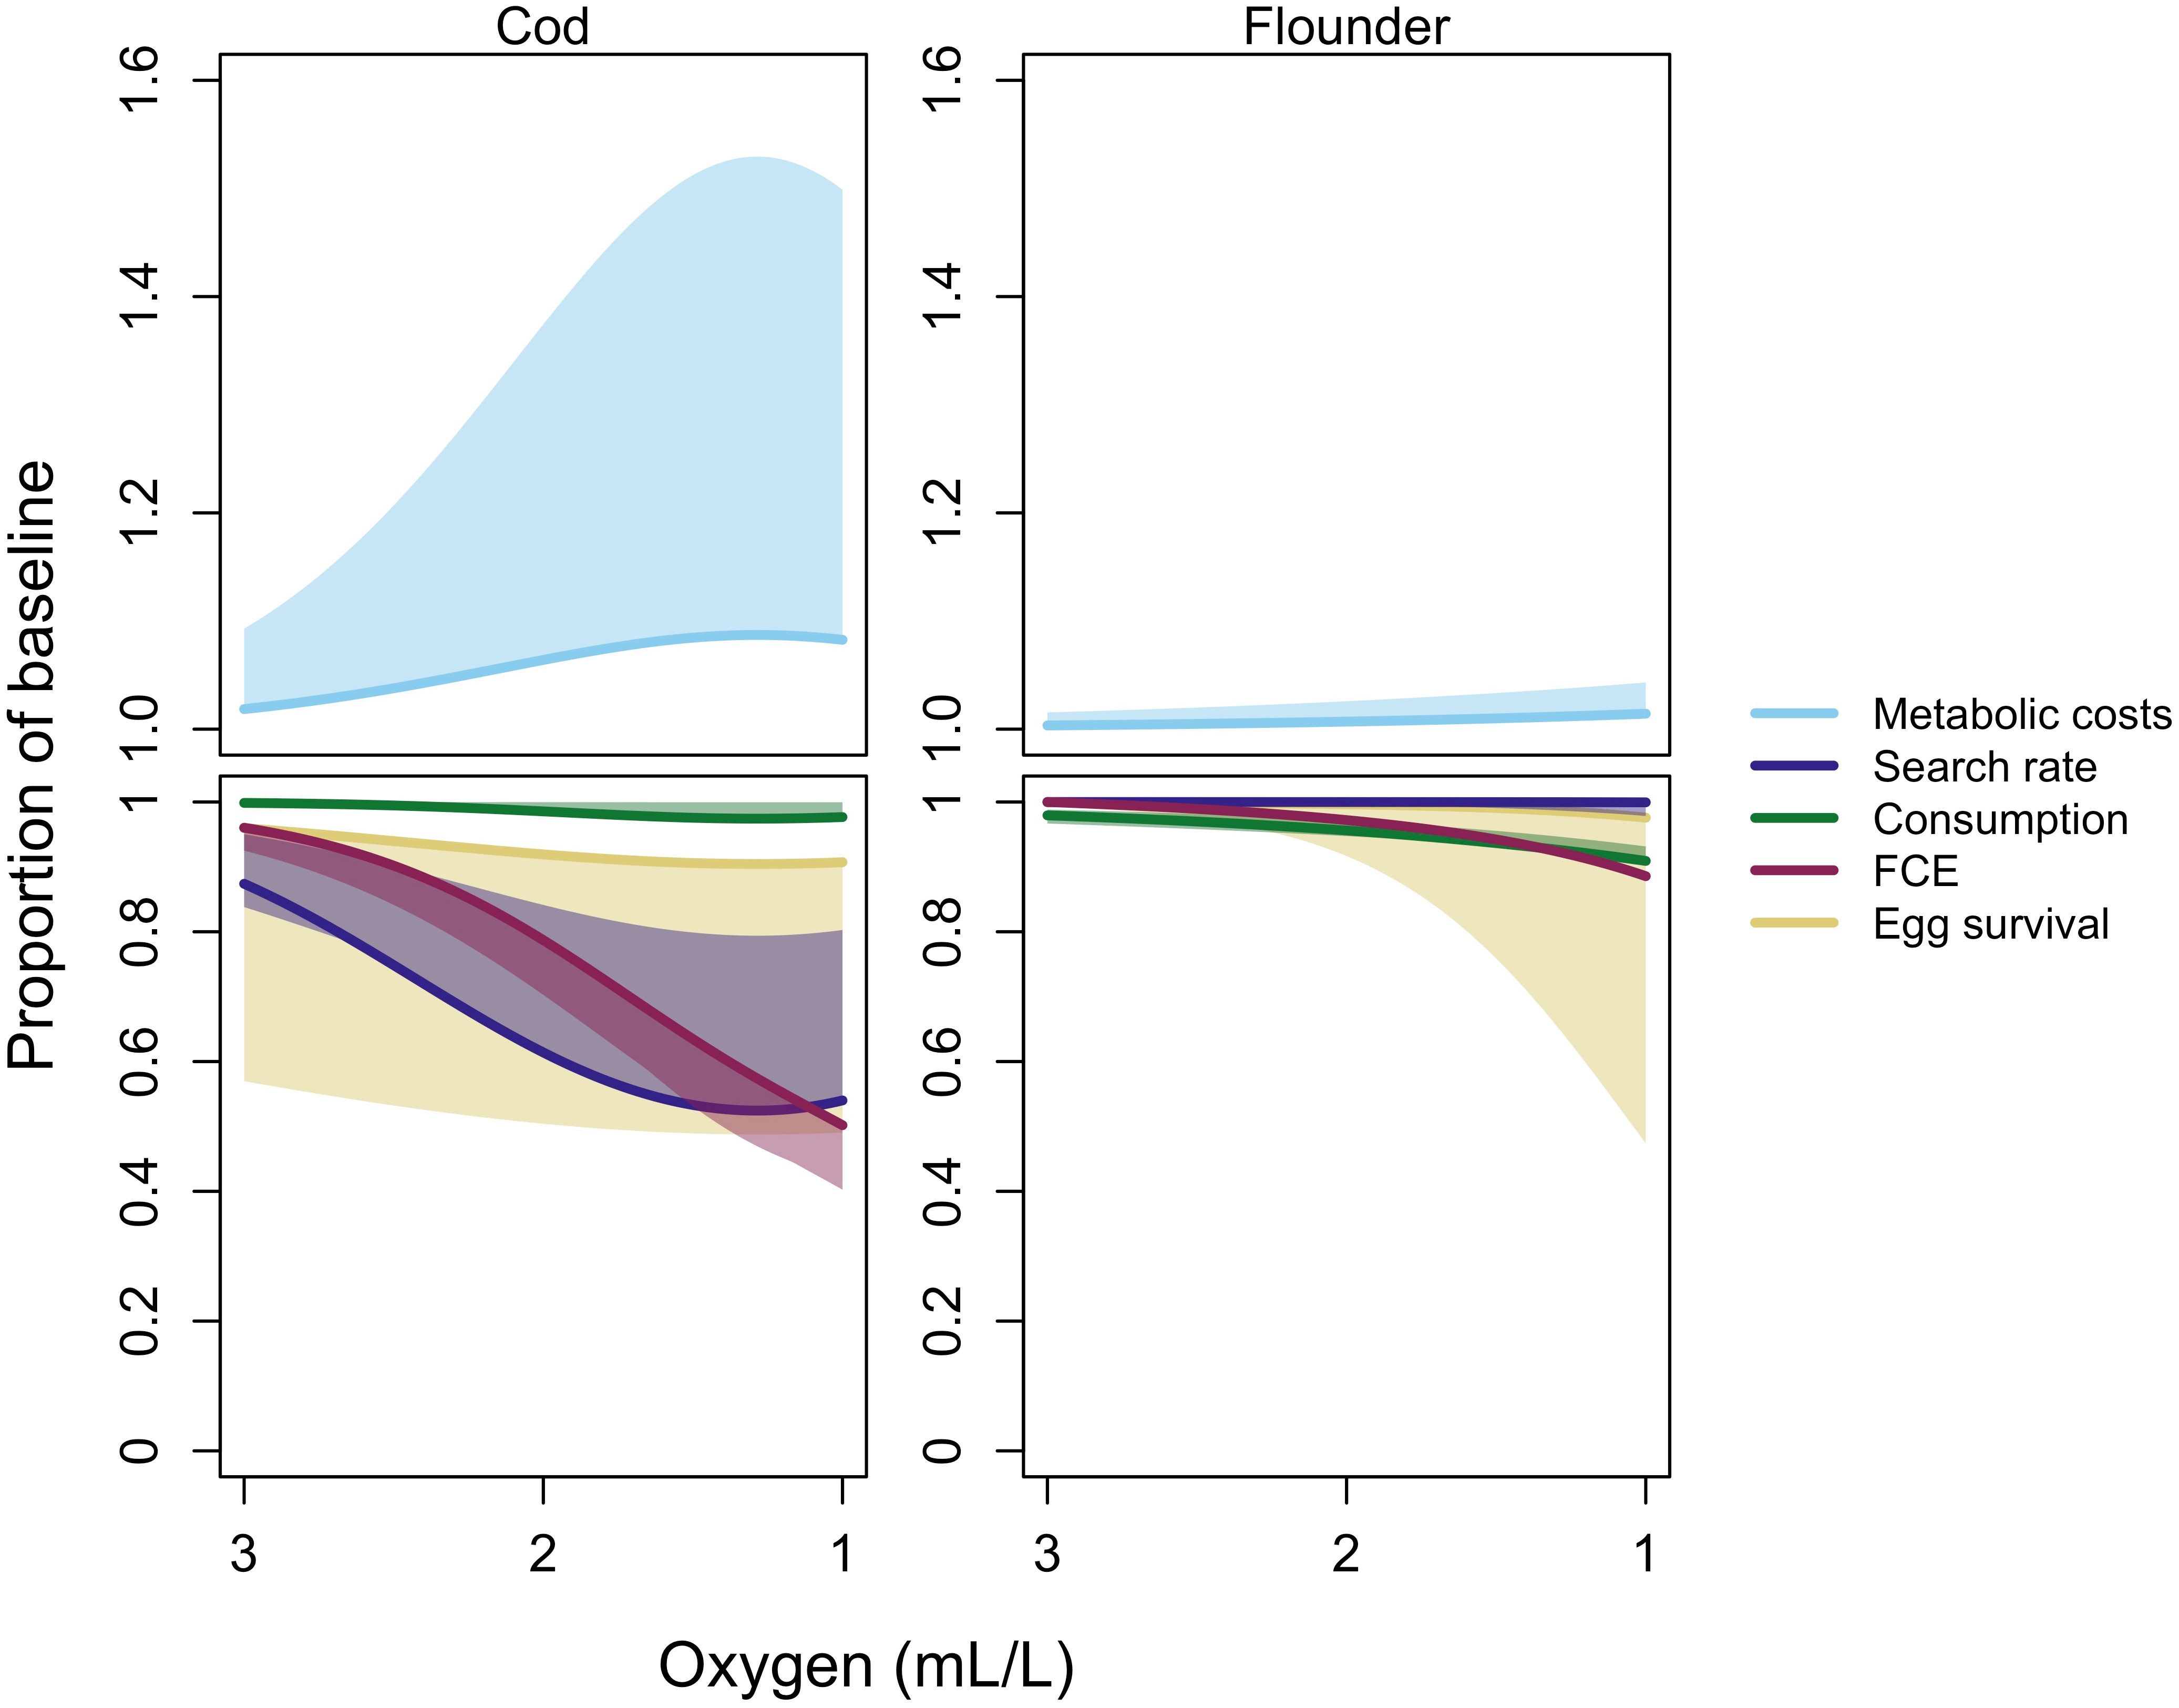
Figure 3 Oxygen dependence of physiological and behavioral rates (P) for cod and flounder in the best model with metabolic prioritization (BOP). Results are given as a proportion of the maximum in normoxic conditions for search rate, consumption, food conversion efficiency (FCE), and egg survival. They are given as a proportion of the minimum for metabolic costs. All results are reported for individuals at maturation weight, about 577 g and 64 g for cod and flounder, respectively. The top two graphs give increases in maintenance costs (light blue line). The bottom two graphs give search rate (dark blue line), consumption (dark green line), food conversion efficiency (FCE; dark red line), and egg survival (yellow line) as oxygen declines. Shaded areas give the range of oxygen dependence values at each oxygen concentration arising from the sensitivity analysis.
Comparison of error among growth, yield, and SSB between models with and without metabolic prioritization show that the former are not always superior to the latter (Figure 1). However, the error of the best model, the BOP model, is about an order of magnitude lower when metabolic prioritization is included (Figure 1). Even when considering the range of weighted error rankings across repetitions, the total error in the BOP model is consistently similar or lower with than without metabolic prioritization (Figure 1). Models with less explanatory power tend to be more similar, and a large proportion of their error is driven by poor fits to growth data. Note, however, that the range in total weighted error is quite large in some cases (Figure 1). This is not entirely unexpected, given the nature of the range as a statistic. One must be careful when drawing conclusions on so small a sample size as just four model repetitions. This is why I draw conclusions primarily based on comparisons in error within repetitions of the calibration and projection procedure.
Both the BOP model with metabolic prioritization, and the BOM model without, produce similar estimates of SSB and yield (Figures 4, 5). Estimates for cod and flounder from the BOP model are more accurate, but only slightly (Figures 4, 5). This suggests that a number of mechanisms could be responsible for biomass and fishery dynamics. The largest discrepancy between these models arises in their estimates of energy flow and ultimately of growth. In the BOP model, the flow of energy as mass from benthos to cod declines precipitously as oxygen falls (Figure 6A). This is a function both of declining carrying capacity of the benthos and of declining search rate, conversion efficiency, and consumption, in that order, and an increase in maintenance costs of cod. Flow from herring and sprat to cod only declines slightly, as changes in physiology and behavior are balanced by increasing occupancy of cod within the pelagic environment, and therefore in availability of clupeids as prey. Cod body size at maximum observed age falls about 70% from nearly 15 kg to just over 5 kg. At oxygen levels below 2 mL·L -1, these estimates of body size coincide fairly well with values of W∞. At higher oxygen levels, they appear to be underestimates relative to maximum observed size (Figure 6A). There could be a number of factors influencing this, including underestimates of the Baltic cod’s ability to maintain high rates of search, consumption, and conversion at such low benthic oxygen concentrations. By contrast, in the BOM model, physiology and behavior are unaffected by hypoxia. Declines in the flow of benthos to cod are caused by movement into the pelagic environment. Body size is maintained from about 3 to 2 mL·L -1 (Figure 6B). However, as cod continue to move away from the benthic habitat, and the proportion of flow from sprat and herring increases, body size declines by as much as 30% (Figure 6B). This is due to a mismatch between size requirements and availability of food. While the BOM model appears to be better able to capture body size at higher oxygen levels, the BOP model is better able to capture the consequences of very low oxygen (Figure 6).
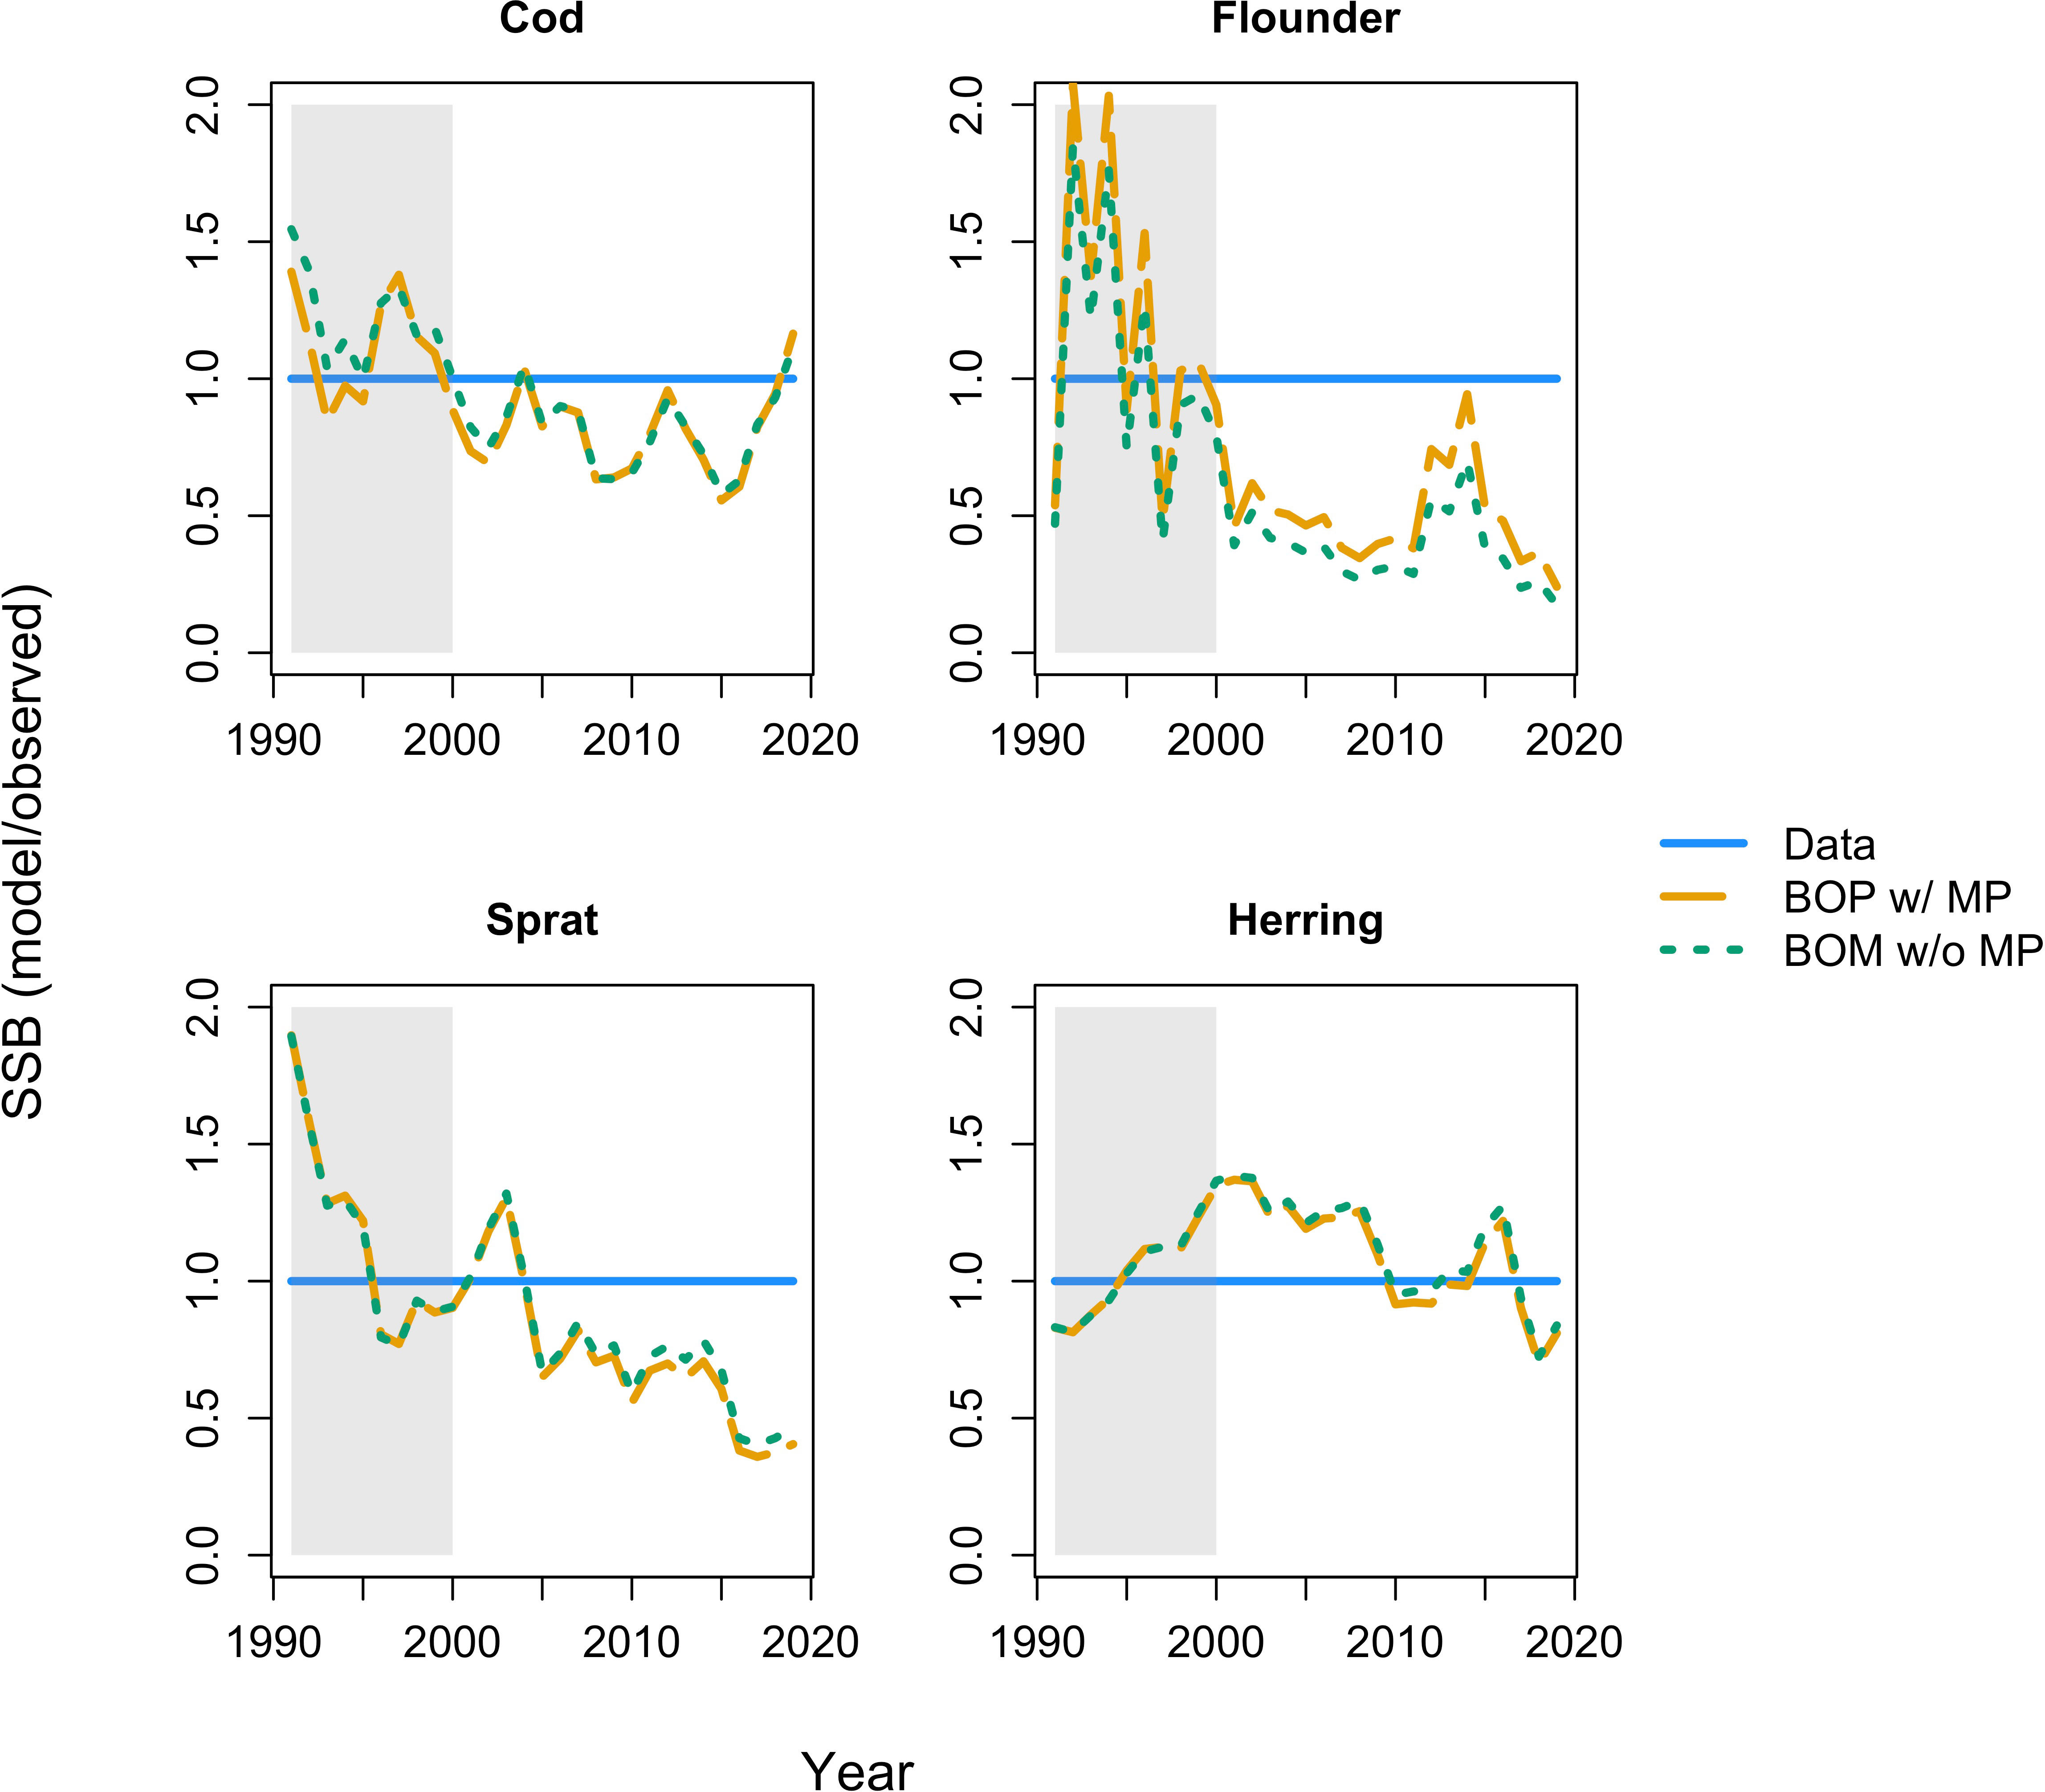
Figure 4 Spawning stock biomass (SSB) of the BOP model (oxygen dependence of benthic resource carrying capacity, B, benthic occupancy of cod, O, and physiological and behavioral rates, P; dashed orange line) with metabolic prioritization (w/MP) and the BOM model (oxygen dependence of B, O, and natural mortality, M; the dotted green line) without metabolic prioritization (w/o MP). The solid blue line gives observations. All results are reported relative to (i.e. divided by) the observations. Shaded region is the calibration period (1991-2000), un-shaded region is the projection period (2001-2019).
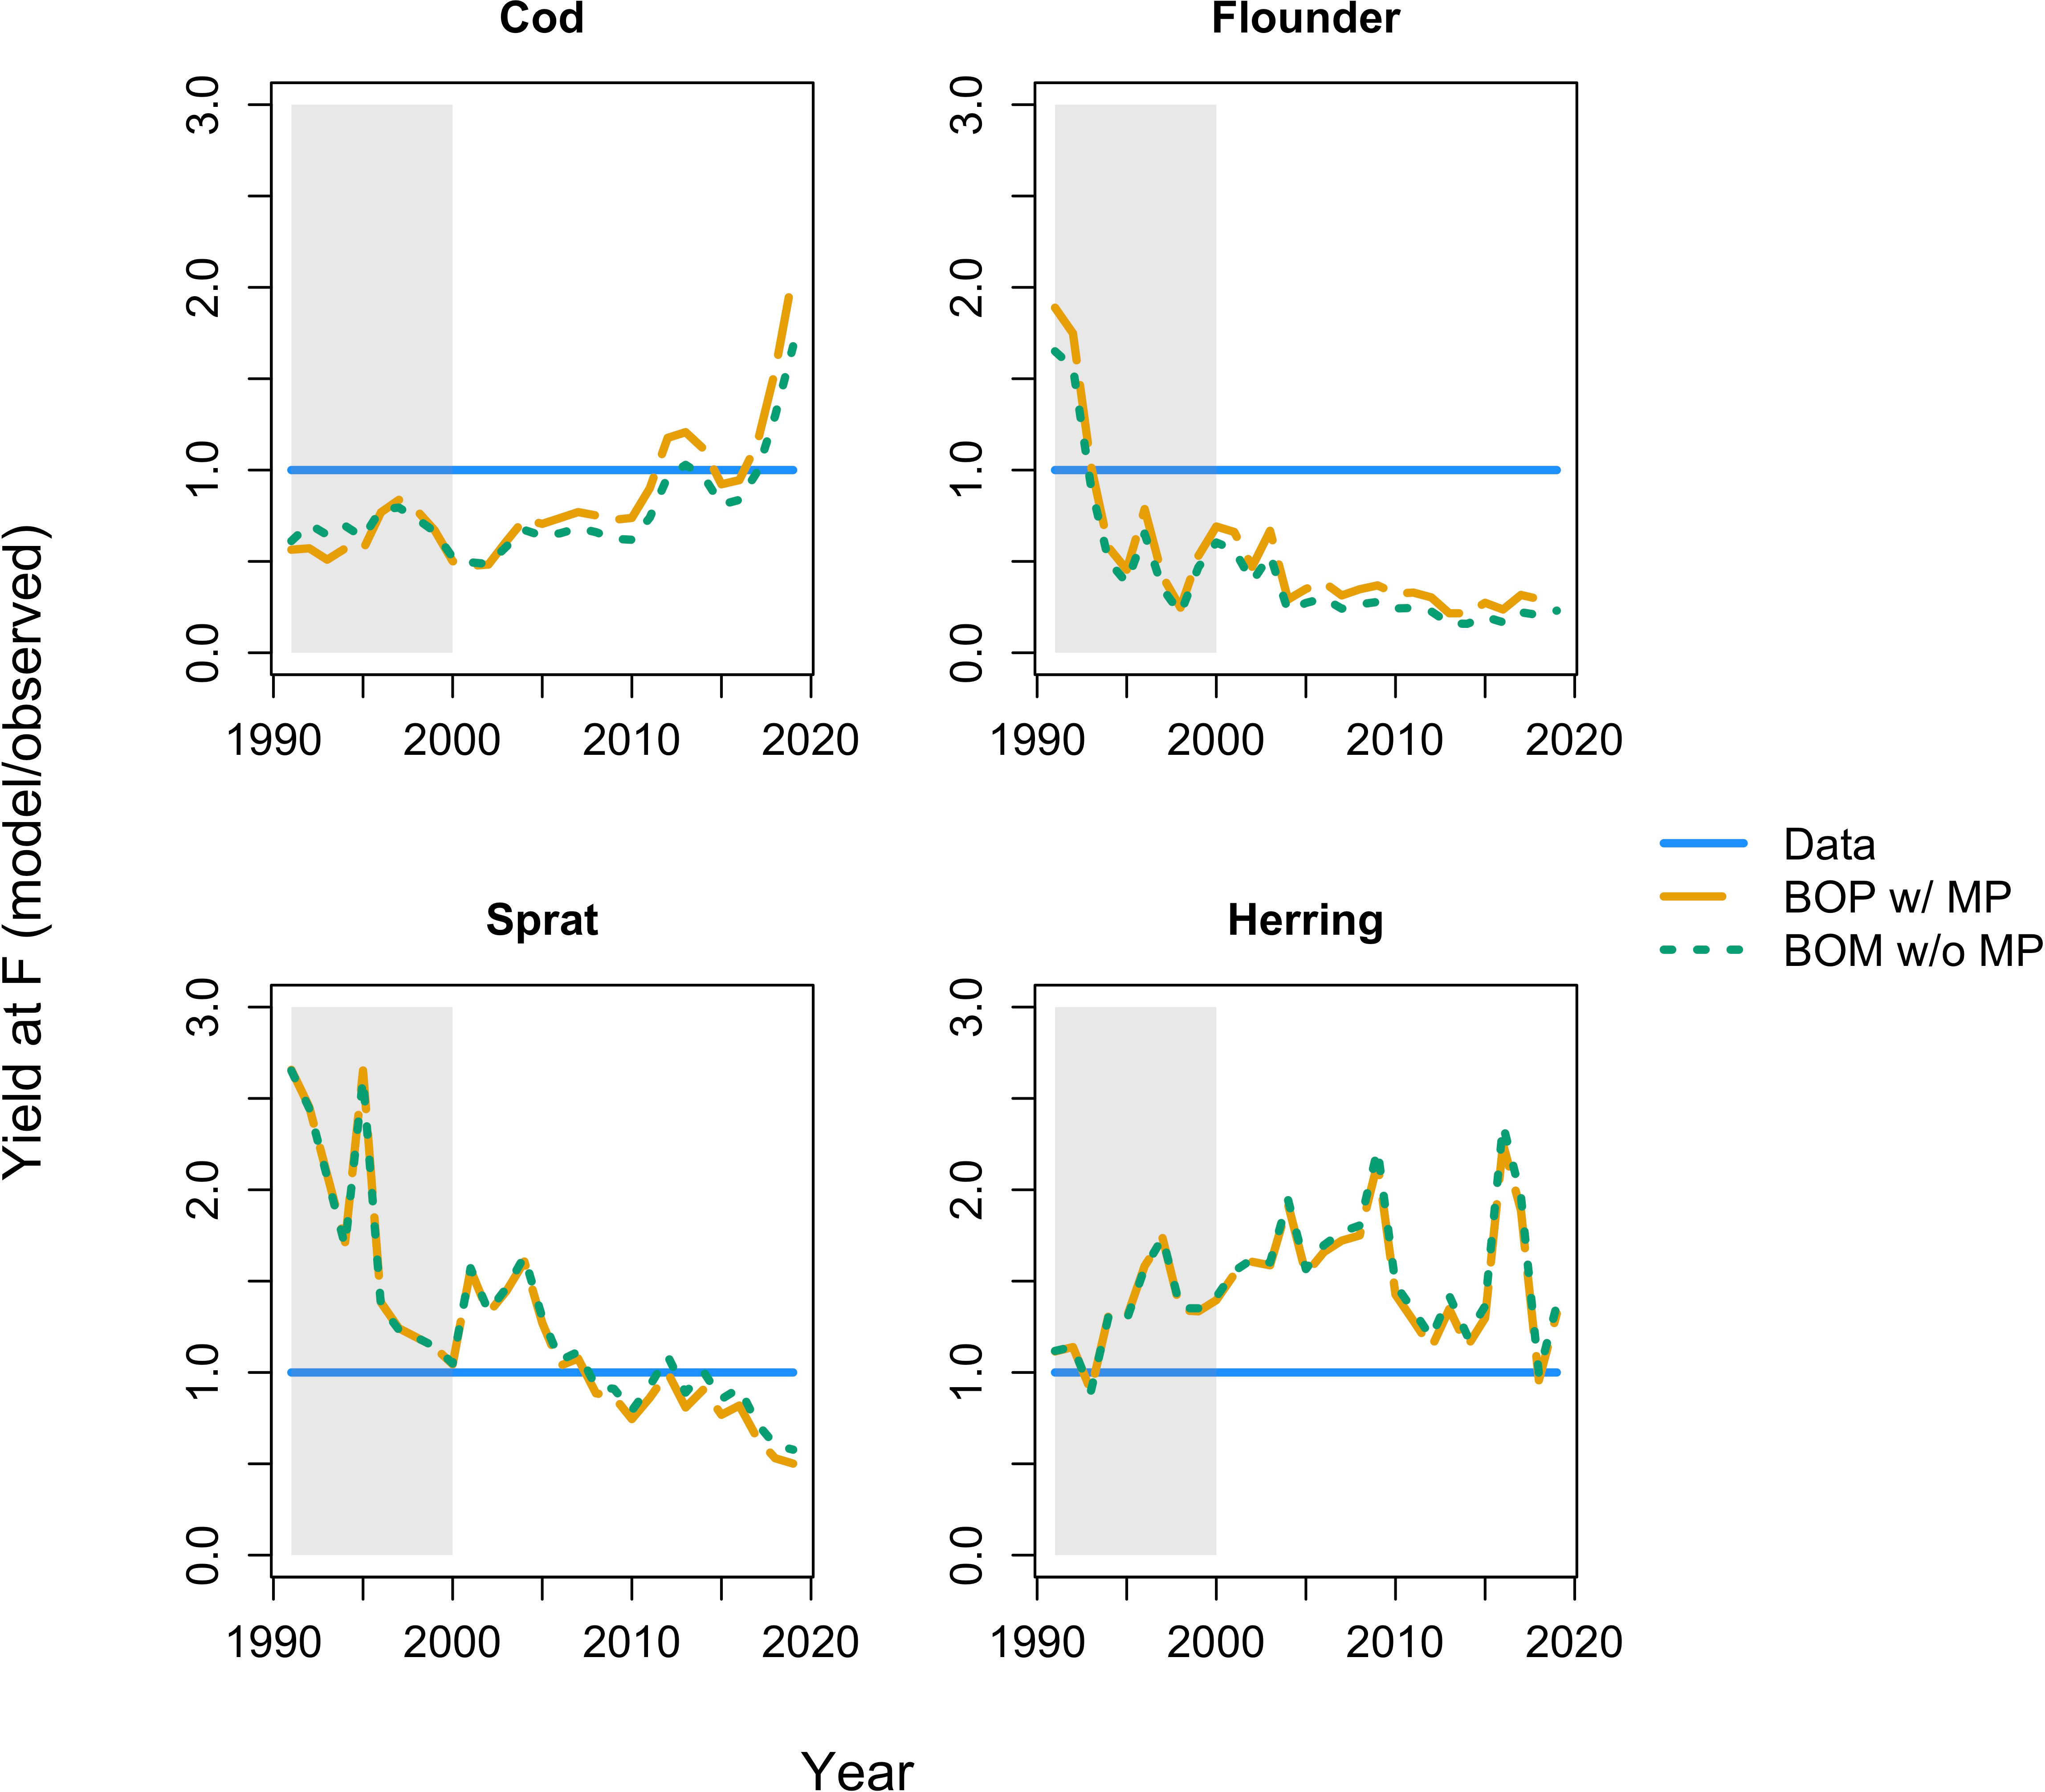
Figure 5 Yield at fishing mortality (F) of the BOP model (dashed orange line) with metabolic prioritization and the BOM model (dotted green line) without metabolic prioritization. Abbreviations are given as in Figure 4. The solid blue line gives observations. All results are reported relative to, or divided by, the observations. Shaded region is the calibration period (1991-2000), un-shaded region is the projection period (2001-2019).
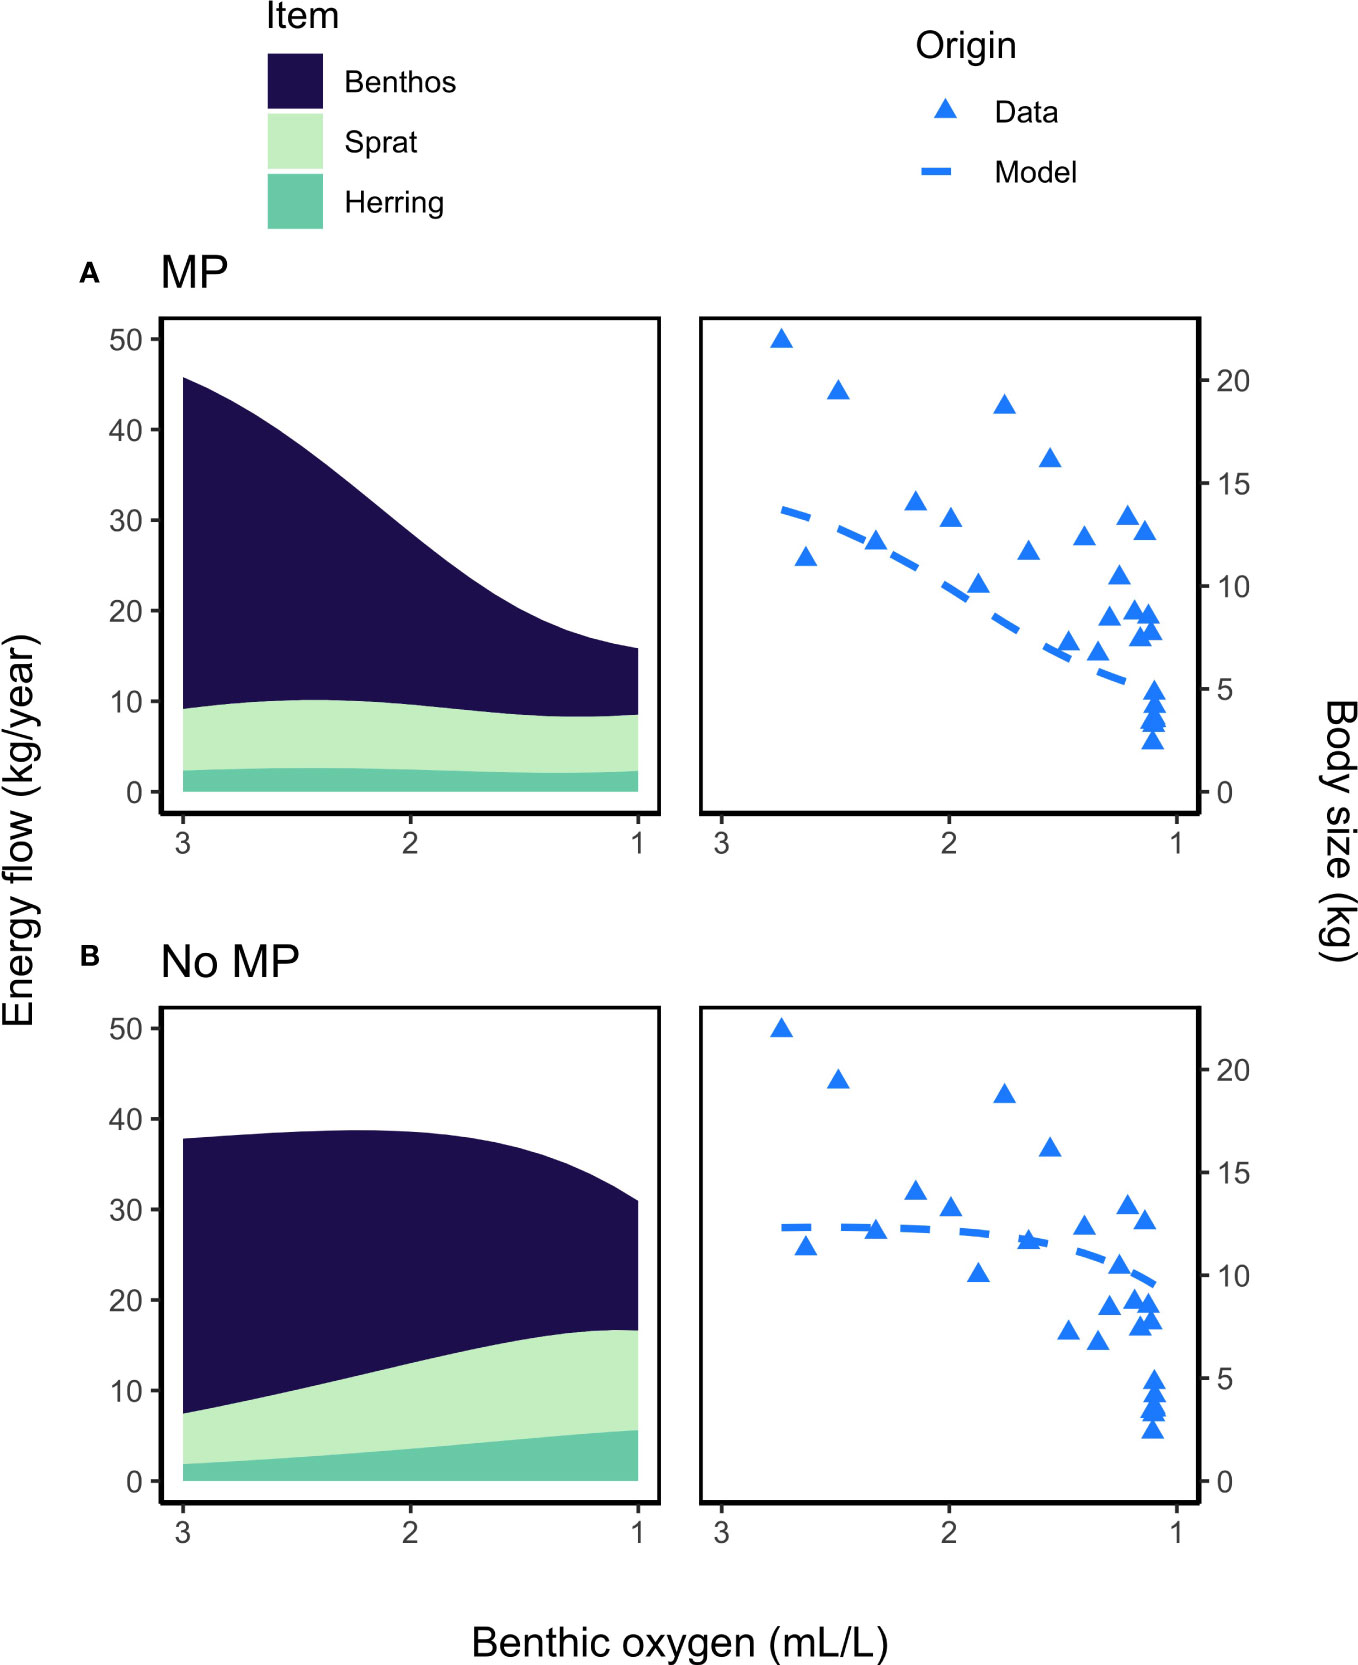
Figure 6 Stacked area plots of energy flow to cod (left) and body size at maximum observed age (right) as a function of a range of benthic oxygen concentrations (3-1 mL·L-1) for (A) the BOP model with metabolic prioritization (MP) and (B) the BOM model without metabolic prioritization (No MP). Energy flow (kg/year) is given as the average for mature individuals weighted by abundance. Abbreviations are given as in Figure 4. The legends above the plots lists all possible food items that make up more than 2% of the diet (left) and the origin of the reported body sizes (right). Pelagic oxygen was held constant at 6 mL/L across all scenarios. Maximum modeled body size (kg, dashed blue line) of cod is given in contrast to maximum observed size (blue triangles) in a given year datrasdata2020 as a function of annual estimates of benthic oxygen concentration during 1991–2019 (ICES, 2020b).
Overall, the size spectrum model analysis provides strong evidence in favor of metabolic prioritization. The best models include oxygen dependence of physiological and behavioral rates (P) across repetitions of the fitting procedure (Figures 1, 2). Oxygen dependence parameter estimates are very different both within and among species (Figure 3). Lastly, estimates of body size in very low oxygen are better represented by the best model among those with metabolic prioritization than by the best model among those without. This further strengthens evidence in favor of metabolic prioritization in combination with declining food availability and changing habitat use as drivers of observed dynamics in hypoxic waters.
3.2 Meta-analysis
The results of the meta-analysis suggest that Atlantic cod prioritize among different rates as ambient oxygen concentrations decline, though the ideal form of the oxygen dependence equation is less certain. The logistic model without metabolic prioritization is referred to as H0, and the logistic and Michaelis-Menten models with metabolic prioritization as H1 and H2, respectively. The difference in expected predictive accuracy between H0 and H1 was -23.8 (SE: 6.3). Given that the absolute difference is more than three times the SE, the data from the meta-analysis provide strong support in favor of H1 over H0. The difference in expected predictive accuracy between H1 and H2 was -4.6. The standard error of this difference was only 3.5, indicating that this difference was statistically negligible. That said, both H1 and H2 include metabolic prioritization, and show roughly similar oxygen dependence of each rate (Figure 7).
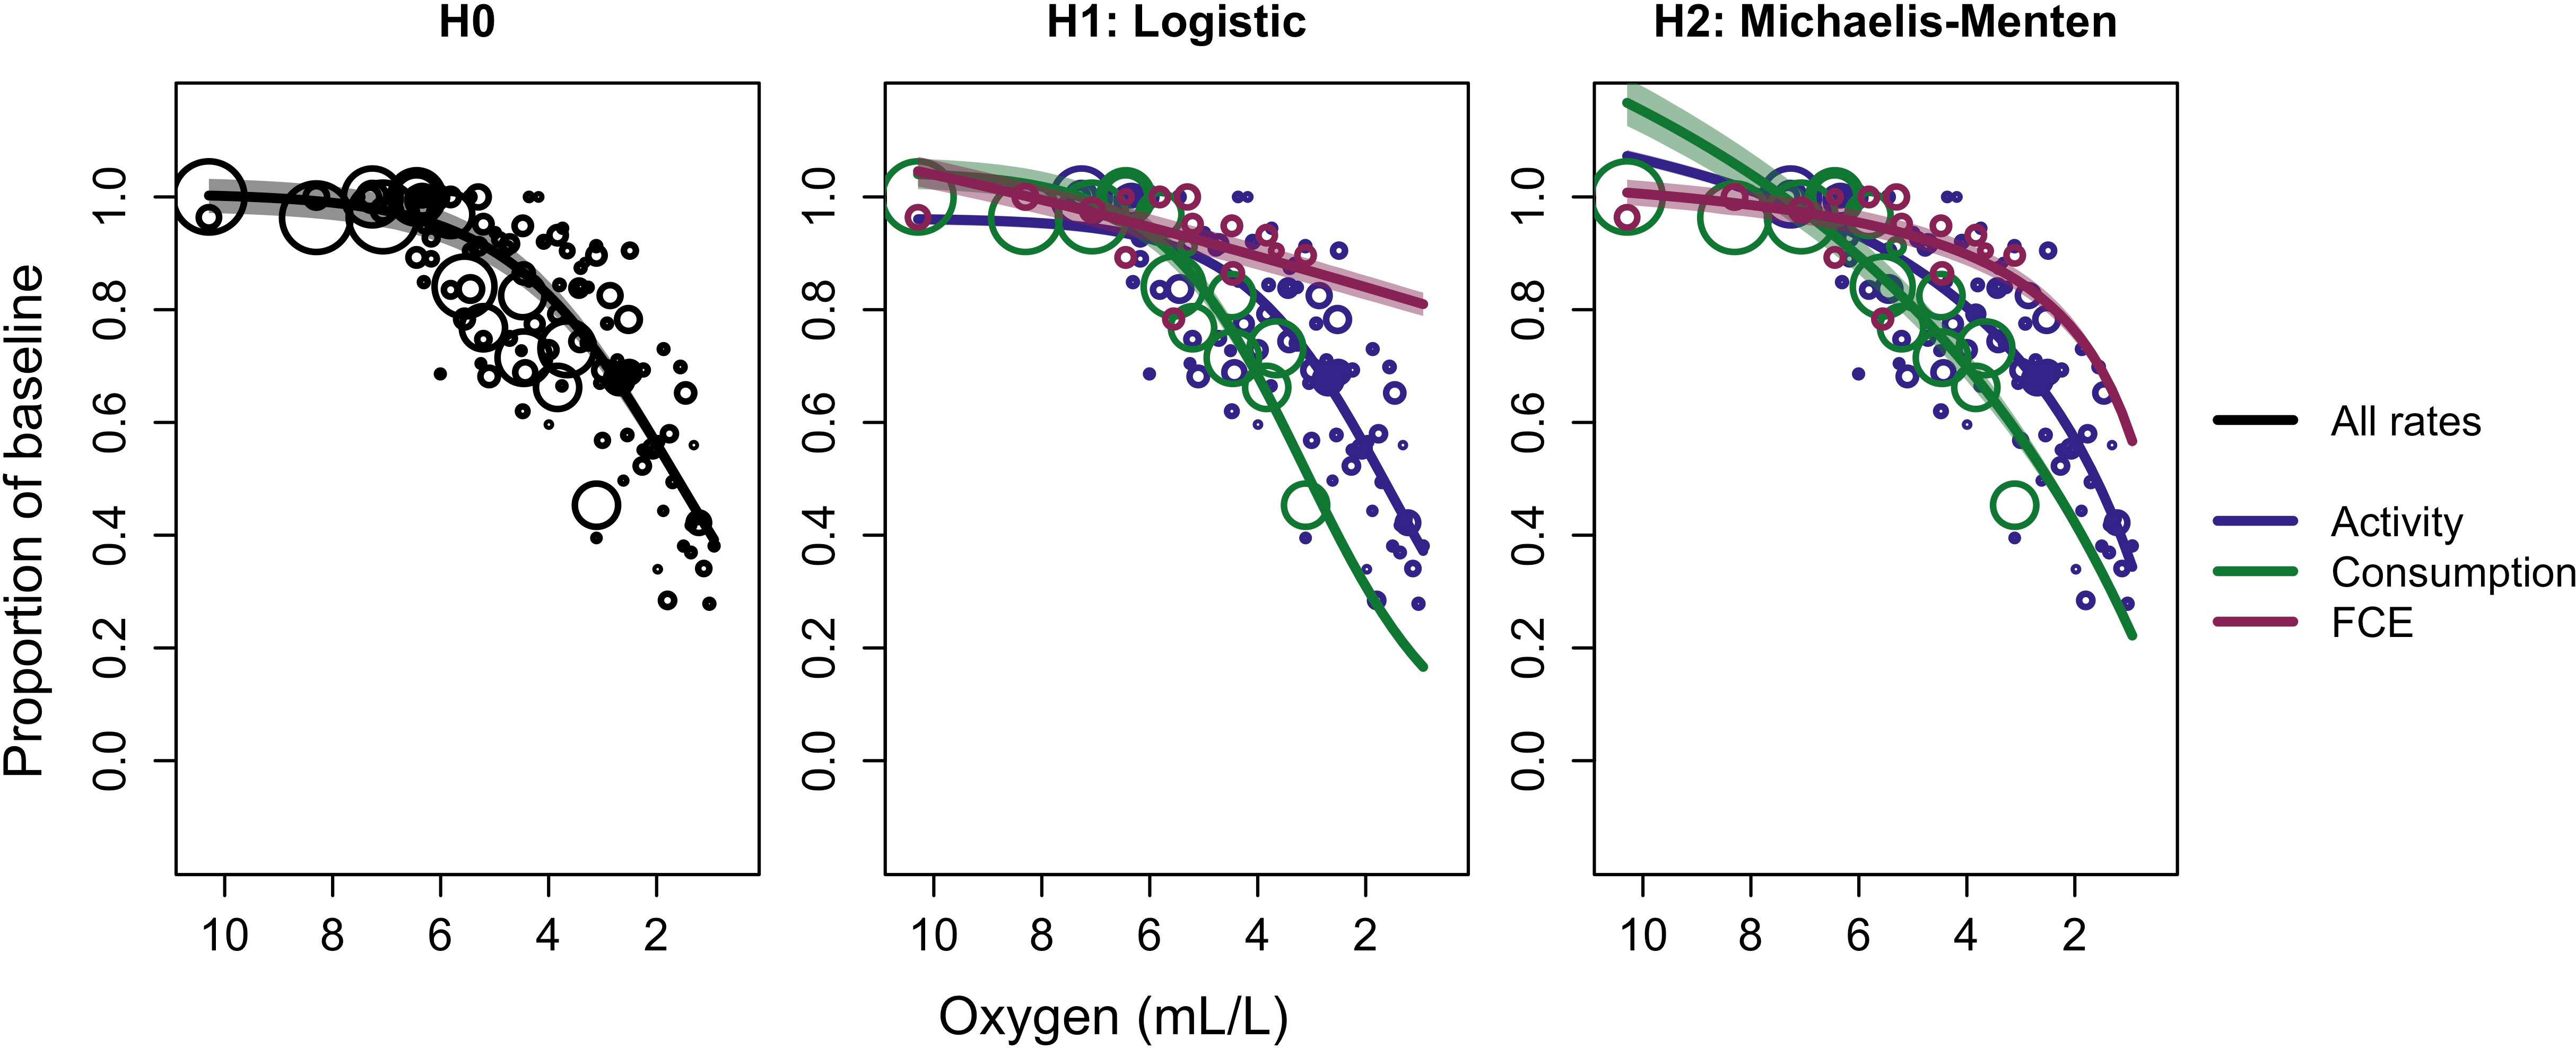
Figure 7 Bayesian meta-analysis results on evidence for metabolic prioritization in Atlantic cod (Gadus morhua) among swimming activity, consumption, and food conversion efficiency (FCE). The null hypothesis model, H0, applied equation 4 to all data, while the alternative hypotheses models H1 and H2 applied equation 4 and a Michaelis-Menten equation, respectively, to data on each of the three rates. The size of each point is proportional to the inverse of the standard error divided by the mean and number of replicates within each study. Shaded regions are 95% highest posterior density intervals (HDI).
The size spectrum model (SSM) analysis and the meta-analysis suggest somewhat different relative oxygen dependence among physiological rates. Note that the SSM conceives of “search rate” strictly in relation to the amount of food consumed, while the observations gathered in the meta-analysis conceive of “activity” as some measure of movement speed or distance. For the SSM, the values for oxygen dependence of search rate and consumption are ultimately multiplied together. While patterns in the declines in search + consumption and FCE are similar in the SSM and meta-analysis, percent declines differ. Consumption of cod falls by nearly 80% from its projected maximum in normoxic conditions at 1 mL·L -1 according to the meta-analysis (Figure 7, H1 and H2), while activity only falls by about 20-40% in the SSM (Figure 3, bottom left). FCE falls by as much as 40-60% in the SSM. In the meta-analysis, FCE falls by 20-40% when considering both H1 and H2 (Figure 7). Note that the SSM was restricted to a much narrower range of oxygen values, about 1-3 mL·L -1. When considering only this range, consumption falls from about 50% to 20% of its maximum, or about 30% in total when oxygen declines from 3 to 1 mL·L -1. FCE falls from about 90% of its maximum to 60-80%, or about 10-30%. Though the latter are slightly more optimistic relative to the SSM, results are generally comparable. The agreement between the model results and the meta-analysis was much greater than expected, and provides additional strong evidence in favor of metabolic prioritization.
In summary, meta-analysis results support metabolic prioritization in Atlantic cod. They also support the conclusions of the SSM analysis. Together, these results suggest that not only do cod prioritize among energy-consuming processes, but that this has a demonstrable effect on population and community dynamics.
4 Discussion
Marine deoxygenation is an urgent issue around the globe. While it occurs naturally in some systems, it has increased in both extent and frequency in recent decades (Breitburg et al., 2018). Among the tools we can use to investigate the mechanisms behind its deleterious effects are integrative models. These models must accurately represent individual-level responses to declining oxygen in order to reproduce dynamics at higher levels of organization. Results from this study strongly suggest that fish prioritize among metabolic demands in response to worsening hypoxia, and that this is an important component of the emergent community response.
The size spectrum model (SSM) analysis indicates that the inclusion of metabolic prioritization improves estimates of observed population and community dynamics, as hypothesized. Main model results, combined with the sensitivity analysis, also show that the best model always includes oxygen dependence of physiological and behavioral rates (Figures 1, 2). This implies that these individual-level impacts of hypoxia are critical components of higher-level dynamics. In contrast, the best model in Duskey et al. (2023) which assumed no metabolic prioritization, almost never included oxygen dependence of these rates. Note that the only difference between this study and that of Duskey et al. (2023) in both model structure and data sources is relaxation of the assumption that all physiological and behavioral activities decline with oxygen at the same rate. Thus, all discrepancies in fits and model selection are attributable to the inclusion of metabolic prioritization. The analysis presented here also produced superior fits to observations (Figure 1). This is particularly true of growth, as differences in predictions of spawning stock biomass (SSB) and yield were relatively minor (Figures 4, 5). That said, the explanatory power of the best model from the analysis with metabolic prioritization, compared to that without, was higher across all metrics (Figure 1). Thus, it is highly likely that the inclusion of metabolic prioritization is an important driver of observed outcomes.
The SSM also produces estimates of oxygen dependence that generally concur with the literature. Model results suggest that cod are sensitive to deoxygenation, whereas flounder are relatively tolerant (Figure 3). Note that flounder parameters are fit to just one year of growth data, and that dynamics in SSB and yield are very rough estimates (Duskey et al., 2023). Therefore, flounder parameter estimates are likely not very reliable. That said, flounder are generally known to be tolerant of hypoxia (Weber and de Wilde, 1975) while cod are intolerant (Plante et al., 1998). Therefore, these results are not surprising. When allowed to prioritize among physiological and behavioral rates, both cod and flounder do so, and in accordance with expectations.
Metabolic prioritization results are similarly encouraging. Cod selectively decrease search rate in moderate hypoxia (Figure 3). While consumption rate remains high, overall food intake (search rate*consumption) thus declines steeply in response to deoxygenation. For fish whose regular activities use a significant portion of their aerobic scope, limitations imposed by hypoxia can change distribution, and restrict growth and survival (Norin and Clark, 2016). For cod in particular, digestion uses up to half of the aerobic scope (Jordan and Steffensen, 2007). This is several times the amount typically used by fish in general (Norin and Clark, 2016). This may explain both why cod are vulnerable to hypoxia and why search rate receives such a low priority (Figure 3). Declining oxygen may thus impact energy acquisition and lead to a decline in growth (Chabot and Claireaux, 2008), which is exactly the outcome observed in the Baltic Sea (Casini et al., 2016). Cod do have a low aerobic scope compared to more active groups of fish (Schurmann and Steffensen, 1997) which implies they are visceral metabolic type and therefore relatively tolerant of hypoxia (Fu et al., 2022). However, flounder have an even lower aerobic scope (Duthie, 1982; Soofiani and Priede, 1985). Note that model parameterization also predicts a lower Pcrit for flounder at a given body size relative to cod (Rogers et al., 2016). This may explain the weak oxygen dependence of physiological and behavioral rates in this species (Figure 3). Such differential responses to hypoxia, as well as their impacts on assemblages, have been shown in other systems (Petry et al., 2013). It is promising that the model structure generally matches these expectations. It implies that metabolic prioritization must be examined for different species, or among different classes of species, in order to represent individual-level responses to hypoxia.
Conclusions regarding community dynamics are also different for the best model with metabolic prioritization (BOP, i.e. oxygen dependence of benthic resource carrying capacity, B, benthic occupancy of cod, O, and physiological and behavioral rates, P) versus the best model without (BOM, i.e. oxygen dependence of B, O, and natural mortality, M). The latter implies that observed changes in growth arise primarily from hypoxia avoidance behaviors (Duskey et al., 2023). Cod move away from the benthic habitat and into the pelagic habitat. While they have increased access to plankton, sprat, and herring, this does not match their dietary needs. This is exacerbated by a decline in benthic food availability (Figure 6B). The BOP model, however, shows a much sharper decline in flow of energy from benthos to cod (Figure 6A). Estimates of oxygen dependence of cod benthic occupancy and sensitivity of benthos carrying capacity are nearly identical among the BOP and BOM models. This difference, then, is driven primarily by changes in feeding activity. The BOP model may underestimate maximum size at intermediate benthic oxygen levels, but it captures the consequences for growth at very low levels (Figure 6A). Given its superior fit to overall dynamics, it is more likely that reduced growth in cod is a consequence of a combination of impacts on food sources, habitat compression, and physiology and behavior, perhaps due in part to increased parasite load and disease (Ryberg et al., 2020). Partitioning of changes in growth, yield, and SSB among drivers at different oxygen levels may be a fascinating area of future research.
Meta-analysis results provide additional evidence in favor of metabolic prioritization. Estimates of prioritization from this analysis generally agree with those from the SSM. Feeding activity falls quite sharply (Figure 7, center and right) just as it does in the SSM (Figure 3, bottom left). One might also be tempted to consider agreement between the meta-analysis and the SSM to indicate that estimated oxygen dependence of other species may be reliable. While this may be the case, one should also be careful to evaluate the reliability of the data upon which these estimates are based. This meta-analysis was limited to Atlantic cod due to data availability. However, effects of hypoxia on feeding, assimilation, and growth have been shown to be species-specific across several families (Jourdan-Pineau et al., 2010; Yang et al., 2013). As a caveat, there are stark differences between a set of SSM analyses and laboratory experiments. The latter are highly controlled, and often do not offer fish the opportunity to escape hypoxia as they do in the wild (Kramer, 1987; Eby et al., 2005). Also, oxygen concentrations for the SSM fitting procedure were estimated on very broad spatial scales. This means that estimates of oxygen dependence are associated with general trends across the Central Baltic Sea, whereas experimental oxygen levels are known within a highly precise range. Oxygen concentrations specific to the time and place at which individuals were captured and measured for DATRAS (ICES, 2020) could likely be estimated from Swedish Meterological and Hydrological Institute SMHI bottle data, but this would be a significant endeavor that is outside the scope of this study. While comparisons are limited by these caveats, it is promising that model estimates are so similar.
The SSM framework makes certain assumptions, and these must be heeded while drawing conclusions. Broadly, this model structure was designed for newly hypoxic habitats. This is in contrast to systems that experience natural, perennial hypoxia, such as the Amazon River and its seasonal floodplains. Given high diversity, low abundance, and a wider range of adaptations to hypoxia (Val et al., 1998), results may differ substantially. While hypoxic conditions are natural, changing hydrological regimes and warming temperatures have made the mechanisms underlying fish community structure an urgent area of research (Chaudhari et al., 2019; Jung et al., 2020). There are also mechanisms within the model that operate based on simplifying assumptions. For example, as in Duskey et al. (2023), I assume that all species besides cod are restricted to the benthic or pelagic habitat, that oxygen dependence is a logistic function of broad spatial estimates of oxygen, and that size at maturation is constant in time and space. There are also no additional stressors in the model, yet temperature and infection can have severe impacts on communities in the Baltic Sea (Olsson et al., 2012; Haarder et al., 2014). The SSM also essentially assumed no impact of hypoxia on locomotion besides search area. Swimming can use a large percentage of the aerobic scope (Chapman and Mckenzie, 2009). The meta-analysis results suggest that while swimming activity receives a higher priority than consumption in cod, it still declines by as much as 60% as oxygen approaches 1 mL·L -1 (Figure 7). In the future, swimming may be accounted for as a size-dependent component of maintenance costs (Delius et al., 2022). More sophisticated approaches to oxygen-dependence may wish to take advantage of this functionality. In general, mizer is highly flexible, and allows the inclusion of stressors in several ways (Delius et al., 2022).
Lastly, while there is some concern that the superiority of model fits with metabolic prioritization could be due to a complexity bias, the second best model often did not include P. Those that do include P, for example the BMP and BP models, often have very high total error. This is because cod that are physiologically and behaviorally vulnerable to hypoxia must have a way to escape this habitat (O) lest their growth rate effectively drop to zero. This produces very large errors in fits to growth data, as well as in fits to SSB and in yield (Figures 1, 2). Error is not simply a function of the number of parameters, but rather the nature of each component of oxygen dependence and how it interacts with other components. Therefore, I do not believe that complexity bias is a problem.
In conclusion, there is strong evidence of metabolic prioritization in the study system. Species prioritize among metabolic demands differently, and therefore each system likely has a unique suite of responses to environmental degradation. We must examine how species respond physiologically and behaviorally in order to predict how environmental change will ultimately affect populations and communities.
Data availability statement
The datasets presented in this study can be found in online repositories. The names of the repository/repositories and accession number(s) can be found in the article/supplementary material.
Author contributions
The author confirms being the sole contributor of this work and has approved it for publication.
Funding
This study was supported by funding for Project Breathless (NSF OCE1923965; to Karin Limburg, Michele Casini and Anna Gårdmark). Additional funding was provided by the Swedish Research Council Formas (grant no. 2018-00775 to MC).
Acknowledgments
I am grateful to Anna Gårdmark, Michele Casini, and Karin Limburg for several discussions regarding the application of size spectrum models within the Baltic Sea, and both the empirical and theoretical considerations. I am also grateful to the SPECTRE reading and discussion group, which continues to foster creative and practical use of the size spectrum modeling framework.
Conflict of interest
The author declares that the research was conducted in the absence of any commercial or financial relationships that could be construed as a potential conflict of interest.
Publisher’s note
All claims expressed in this article are solely those of the authors and do not necessarily represent those of their affiliated organizations, or those of the publisher, the editors and the reviewers. Any product that may be evaluated in this article, or claim that may be made by its manufacturer, is not guaranteed or endorsed by the publisher.
References
Baguley T. (2009). Standardized or simple effect size: what should be reported? Br. J. Psychol. 100, 603–617. doi: 10.1348/000712608X377117
Bond C. F. Jr, Wiitala W. L., Richard F. D. (2003). Meta-analysis of raw mean differences. Psychol. Methods 8 (4), 406–418. doi: 10.1037/1082-989X.8.4.406
Bonsdorff E. (2006). Zoobenthic diversity-gradients in the Baltic Sea: continuous post-glacial succession in a stressed ecosystem. J. Exp. Mar. Biol. Ecol. 330 (1), 383–391. doi: 10.1016/j.jembe.2005.12.041
Breitburg D., Levin L. A., Oschlies A., Gregoire M., Chavez F. P., Conley D. J., et al. (2018). Declining oxygen in the global ocean and coastal waters. Science 359 (6371), eaam7240. doi: 10.1126/science.aam7240
Carpenter B., Gelman A., Hoffman M. D., Lee D., Goodrich B., Betancourt M., et al. (2017). Stan: A probabilistic programming language. J. Stat. Softw. 76 (1), 1–32. doi: 10.18637/jss.v076.i01
Carroll J., Smit M. (2011). “An Integrated modeling framework for decision support in ecosystem based management: case study Lofoten/Barents sea.” SPE European Health, Safety and Environmental Conference in Oil and Gas Exploration and Production, Vienna, Austria. doi: 10.2118/140431-MS. SPE-140431-MS.
Carstensen J., Conley D. J. (2019). Baltic Sea Hypoxia takes many shapes and sizes. Limnol. Oceanogr. Bull. 28 (4), 125–129. doi: 10.1002/lob.10350
Casini M., Kall F., Hansson M., Plikshs M., Baranova T., Karlsson O., et al. (2016). Hypoxic areas, density-dependence and food limitation drive the body condition of a heavily exploited marine fish predator. R. Soc. Open Sci. 3 (10), 160416. doi: 10.1098/rsos.160416
Chabot D., Claireaux G. (2008). Environmental hypoxia as a metabolic constraint on fish: the case of Atlantic cod, gadus morhua. Mar. Pollut. Bull. 57 (6), 287–294. doi: 10.1016/j.marpolbul.2008.04.001
Chabot D., Dutil J.-D. (1999). Reduced growth of Atlantic cod in non-lethal hypoxic conditions. J. Fish Biol. 55 (3), 472–491. doi: 10.1111/j.1095-8649.1999.tb00693.x
Chapman L. J., Mckenzie D. J. (2009). “Chapter 2 behavioral responses and ecological consequences,” in Hypoxia, vol. 27 . Eds. Richards J. G., Farrell A. P., Brauner C. J. (Fish Physiology. Academic Press), 25–77. doi: 10.1016/S1546-5098(08)00002-2
Chaudhari S., Pokhrel Y., Moran E., Miguez-Macho G. (2019). Multi-decadal hydrologic change and variability in the Amazon river basin: understanding terrestrial water storage variations and drought 570 characteristics. Hydrol. Earth Syst. Sci. 23 (7), 2841–2862. doi: 10.5194/hess23-2841-2019
Chechile R. A. (2003). Mathematical tools for hazard function analysis. J. Math. Psychol. 47 (5), 478–494. doi: 10.1016/S0022-2496(03)00063-4
Chu J. W. F., Gale K. S. P. (2017). Ecophysiological limits to aerobic metabolism in hypoxia determine epibenthic distributions and energy sequestration in the northeast pacific ocean. Limnol. Oceanogr. 62 (1), 59–74. doi: 10.1002/lno.10370
Claireaux G., Chabot D. (2016). Responses by fishes to environmental hypoxia: integration through fry’s concept of aerobic metabolic scope. J. Fish. Biol. 88 (1), 232–251. doi: 10.1111/jfb.12833
Cocco V., Joos F., Steinacher M., Frolicher T. L., Bopp L., Dunne J., et al. (2013). Oxygen and indicators of stress for marine life in multi-model global warming projections. Biogeosciences 10 (3), 1849–1868. doi: 10.5194/bg-10-1849-2013
Cohen P., Cohen J., Aiken L. S., West S. G. (1999). The problem of units and the circumstance for POMP. Multivariate. Behav. Res. 34 (3), 315–346. doi: 10.1207/S15327906MBR3403_2
Cooke R. M., Wittmann M. E., Lodge D. M., Rothlisberger J. D., Rutherford E. S., Zhang H., et al. (2014). Out-of-Sample validation for structured expert judgment of Asian carp establishment in lake Erie. Integrated. Environ. Assess. Manage. 10 (4), 522–528. doi: 10.1002/ieam.1559
Delius G., Scott F., Blanchard J., Andersen K. (2022) Mizer: multi-species sIZE spectrum modelling in r. Available at: https://CRAN.R-project.org/package=mizer.
de Mutsert K., Steenbeek J., Lewis K., Buszowski J., Cowan J. H., Christensen V. (2016). Exploring effects of hypoxia on fish and fisheries in the northern gulf of Mexico using a dynamic spatially explicit ecosystem model. Ecol. Model. 331, 142–150. doi: 10.1016/j.ecolmodel.2015.10.013. Ecopath.
Diaz R. J., Breitburg D. L. (2009). The hypoxic environment. Fish. Physiol. 27, 1–23. doi: 10.1016/S1546-5098(08)00001-0
Duskey E., Casini M., Limburg K., Gardmark A. (2023). Declining food availability and habitat shifts 600 drive community responses to marine hypoxia. bioRxiv (Cold Spring Harbor Laboratory) 2023, 04. doi: 10.1101/2023.04.14.536810
Duthie G. G. (1982). The respiratory metabolism of temperature-adapted flatfish at rest and during swimming activity and the use of anaerobic metabolism at moderate swimming speeds. J. Exp. Biol. 97 (1), 359–373. doi: 10.1242/jeb.97.1.359
Dutil J.-D., Sylvestre E.-L., Gamache L., Larocque R., Guderley H. (2007). Burst and coast use, swimming performance and metabolism of Atlantic cod Gadus morhua in sub-lethal hypoxic conditions. J. Fish Biol. 71 (2), 363–375. doi: 10.1111/j.1095-8649.2007.01487.x
Eby L. A., Crowder L. B., McClellan C. M., Peterson C. H., Powers M. J. (2005). Habitat degradation from intermittent hypoxia: impacts on demersal fishes. Mar. Ecol. Prog. Ser. 291, 249–262. doi: 10.3354/meps291249
Farrell A. P., Richards J. G. (2009). “Defining hypoxia: an integrative synthesis of the responses of fish to Hypoxia,” in Hypoxia, vol. 27. Eds. Richards J. G., Farrell A. P., Brauner C. J. (Academic Press), 487–503. doi: 10.1016/S1546-5098(08)00011-3
Fry F. (1947). Effects of the environment on animal activity. pub. Ontario fish. lab. no. 68. U. Toronto. Studies. Biol. Ser. 55, 1–52. Available at: https://cir.nii.ac.jp/crid/1571698600592027776.
Fu S.-J., Dong Y.-W., Killen S. S. (2022). Aerobic scope in fishes with different lifestyles and across habitats: trade-offs among hypoxia tolerance, swimming performance and digestion. Comp. Biochem. Physiol. Part A.: Mol. Integr. Physiol. 272, 111277. doi: 10.1016/j.cbpa.2022.111277
Gelman A., Rubin D. B. (1992). Inference from iterative simulation using multiple sequences. Stat. Sci. 7 (4), 457–472. doi: 10.2307/2246093
Haarder S., Kania P. W., Galatius A., Buchmann K. (2014). Increased contracaecum osculatum infection in Baltic cod (Gadus morhua) livers, (1982–2012) associated with increasing grey seal (Halichoerus gryphus) populations. J. Wildlife. Dis. 50 (3), 537–543. doi: 10.7589/2012-12-320
Herbert N. A., Skjæraasen J. E., Nilsen T., Salvanes A. G. V., Steffensen J. F. (2011). The hypoxia avoidance behaviour of juvenile atlantic cod (Gadus morhua l.) depends on the provision and pressure level of an O2 refuge. Mar. Biol. 158 (4), 737–746. doi: 10.1007/s00227-010-1601-7
Herbert N. A., Steffensen J. F. (2005). The response of atlantic cod, Gadus morhua, to progressive hypoxia: fish swimming speed and physiological stress. Mar. Biol. 147 (6), 1403–1412. doi: 10.1007/s00227-005-0003-8
Hofmann A., Peltzer E., Walz P., Brewer P. (2011). Hypoxia by degrees: establishing definitions for a changing ocean. Deep. Sea. Res. Part I.: Oceanogr. Res. Papers. 58 (12), 1212–1226. doi: 10.1016/j.dsr.2011.09.004
ICES. (2020a). Baltic fisheries assessment working group (WGBFAS). ICES. Sci. Rep. 2 (45), 643. doi: 10.17895/ices.pub.6024
ICES. (2020b) ICES database of trawl surveys (DATRAS). Available at: https://www.ices.dk/data/dataportals/Pages/DATRAS.aspx.
Johansen J. L., Herbert N. A., Steffensen J. F. (2006). The behavioural and physiological response of atlantic cod Gadus morhua L. @ to short-term acute hypoxia. J. Fish Biol. 68 (6), 1918–1924. doi: 10.1111/j.1095-8649.2006.01080.x
Johnston J. M., McGarvey D. J., Barber M. C., Laniak G., Babendreier J., Parmar R., et al. (2011). An integrated modeling framework for performing environmental assessments: application to ecosystem services in the albemarle-pamlico basins (NC and VA, USA). Ecol. Model. 222 (14), 2471–2484. doi: 10.1016/j.ecolmodel.2011.03.036
Jordan A., Steffensen J. (2007). Effects of ration size and hypoxia on specific dynamic action in the cod. Physiol. Biochem. Zool. 80 (2), 178–185. doi: 10.1086/510565
Jourdan-Pineau H., Dupont-Prinet A., Claireaux G., McKenzie D. (2010). An investigation of metabolic prioritization in the European Sea bass, Dicentrarchus labrax. Physiol. Biochem. Zool. 83 (1), 68–77. doi: 10.1086/648485
Jung E. H., Brix K. V., Richards J. G., Val A. L., Brauner C. J. (2020). Reduced hypoxia tolerance and survival at elevated temperatures may limit the ability of Amazonian fishes to survive in a warming world. Sci. Total. Environ. 748, 141349. doi: 10.1016/j.scitotenv.2020.141349
Junk W. J., Soares G. M., Carvalho F. M. (1983). “Distribution of fish species in a lake of the Amazon river floodplain near manaus (Lago camaleao), with special reference to extreme oxygen conditions,” in Amazoniana: limnologia et oecologia regionalis systematis fluminis Amazonas (Kommissions-Verlag WG Mühlau) 7 (4), 397–431. Available at: https://hdl.handle.net/21.11116/0000-0004-6B48-4.
Karim M., Sekine M., Higuchi T., Imai T., Ukita M. (2003). Simulation of fish behavior and mortality in hypoxic water in an enclosed bay. Ecol. Model. 59 (1), 27–42. doi: 10.1016/S0304-3800(02)00282-X
Koedijk R., Imsland A. K., Folkvord A., Stefansson S. O., Jonassen T. M., et al. (2012). Larval rearing environment influences the physiological adaptation in juvenile atlantic cod, gadus morhua. Aquac. Int. 20 (3), 467–479. doi: 10.1007/s10499-011-9478-0
Koenigstein S., Mark F. C., Goßling-Reisemann S., Reuter H., Poertner H.-O. (2016). Modelling climate change impacts on marine fish populations: process-based integration of ocean warming, acidification and other environmental drivers. Fish Fish 17 (4), 972–1004. doi: 10.1111/faf.12155
Kramer D. L. (1987). Dissolved oxygen and fish behavior. Environ. Biol. Fishes. 18 (2), 81–92. doi: 10.1007/BF00002597
LaBone E. D., Rose K. A., Justic D., Huang H., Wang L. (2021). Effects of spatial variability on the exposure of fish to hypoxia: a modeling analysis for the gulf of Mexico. Biogeosciences 18 (2), 487–507. doi: 10.5194/bg-18-487-2021
Limburg K. E., Casini M. (2019). Otolith chemistry indicates recent worsened Baltic cod condition is linked to hypoxia exposure. Biol. Lett. 15 (12), 20190352. doi: 10.1098/rsbl.2019.0352
Norin T., Clark T. D. (2016). Measurement and relevance of maximum metabolic rate in fishes. J. Fish. Biol. 88 (1), 122–151. doi: 10.1111/jfb.12796
Oldham T., Nowak B., Hvas M., Oppedal F. (2019). Metabolic and functional impacts of hypoxia vary with size in Atlantic salmon. Comp. Biochem. Physiol. Part A.: Mol. Integr. Physiol. 231, 30–38. doi: 10.1016/j.cbpa.2019.01.012
Olsson J., Bergström L., Gårdmark A. (2012). Abiotic drivers of coastal fish community change during four decades in the Baltic Sea. ICES. J. Mar. Sci. 69 (6), 961–970. doi: 10.1093/icesjms/fss072
Parisi M., Giacoletti A., Mandaglio C., Cammarata M., Sara G. (2021). The entangled multi-level responses of mytilus galloprovincialis (Lamarck 1819) to environmental stressors as detected by an integrated approach. Mar. Environ. Res. 168, 105292. doi: 10.1016/j.marenvres.2021.105292
Petersen L. H., Gamperl A. K. (2010). Effect of acute and chronic hypoxia on the swimming performance, metabolic capacity and cardiac function of atlantic cod (Gadus morhua). J. Exp. Biol. 213 (5), 808–819. doi: 10.1242/jeb.033746
Petry A. C., Abujanra F., Gomes L. C., Julio H. F. Jr., Agostinho A. A. (2013). Effects of the interannual variations in the flood pulse mediated by hypoxia tolerance: the case of the fish assemblages in the upper parana river floodplain. Neotropical. Ichthyol. 11 (2), 413–424. doi: 10.1590/S1679-62252013005000008
Pezner A. K., Courtney T. A., Barkley H. C., Chou W.-C., Chu H.-C., Clements S. M., et al. (2023). Increasing hypoxia on global coral reefs under ocean warming. Nat. Climate Change 13 (4), 403–409. doi: 10.1038/s41558-023-01619-2
Plante S., Chabot D., Dutil J.-D. (1998). Hypoxia tolerance in Atlantic cod. J. Fish. Biol. 53 (6), 1342–1356. doi: 10.1111/j.1095-8649.1998.tb00253.x
Pollock M., Clarke L., Dube M. (2007). The effects of hypoxia on fishes: from ecological relevance to physiological effects. Environ. Rev. 15, 1–14. doi: 10.1139/a06-006
Portner H.-O., Bock C., Mark F. C. (2017). Oxygen- and capacity-limited thermal tolerance: bridging ecology and physiology. J. Exp. Biol. 220 (15), 2685–2696. doi: 10.1242/jeb.134585
R Core Team. (2022). R: a language and environment for statistical computing (Vienna, Austria: R Foundation for Statistical Computing). Available at: https://www.R-project.org/.
Richards J. G. (2009). “Chapter 10 metabolic and molecular responses of fish to hypoxia,” in Hypoxia, vol. 27 . Eds. Richards J. G., Farrell A. P., Brauner C. J. (Fish Physiology. Academic Press), 443–485. doi: 10.1016/S1546-5098(08)00010-1
Roberts J. J., Höök T. O., Ludsin S. A., Pothoven S. A., Vanderploeg H. A., Brandt S. B. (2009). Effects of hypolimnetic hypoxia on foraging and distributions of lake Erie yellow perch. J. Exp. Mar. Biol. Ecol. 381, S132–S142. doi: 10.1016/j.jembe.2009.07.017
Rogers N. J., Urbina M. A., Reardon E. E., McKenzie D. J., Wilson R. W. (2016). A new analysis of hypoxia tolerance in fishes using a database of critical oxygen level (Pcrit). Conserv. Physiol. 4 (1), cow012. doi: 10.1093/conphys/cow012
Rohatgi A. (2021) Webplotdigitizer: version 4.5. Available at: https://automeris.io/WebPlotDigitizer.
Ryberg M. P., Skov P. V., Vendramin N., Buchmann K., Nielsen A., Behrens J. W. (2020). Physiological condition of Eastern Baltic cod, gadus morhua, infected with the parasitic nematode contracaecum osculatum. Conserv. Physiol. 8 (1), coaa093. doi: 10.1093/conphys/coaa093. ISSN: 2051-1434.
Saint-Paul U., Soares G. M. (1987). Diurnal distribution and behavioral responses of fishes to extreme hypoxia in an Amazon floodplain lake. Environ. Biol. Fishes. 20 (2), 91–104. doi: 10.1007/BF00005289
Schurmann H., Steffensen J. F. (1994). Spontaneous swimming activity of atlantic cod gadus morhua exposed to graded hypoxia at three temperatures. J. Exp. Biol. 197 (1), 129–142. doi: 10.1242/jeb.197.1.129
Schurmann H., Steffensen J. F. (1997). Effects of temperature, hypoxia and activity on the metabolism of juvenile Atlantic cod. J. Fish. Biol. 50 (6), 1166–1180. doi: 10.1111/j.1095-8649.1997.tb01645.x
Scott F., Blanchard J. L., Andersen K. H. (2014). Mizer: an r package for multispecies, trait-based and community size spectrum ecological modelling. Methods Ecol. Evol. 5 (10), 1121–1125. doi: 10.1111/2041-210X.12256
Silvert W., Platt T. (1978). Energy flux in the pelagic ecosystem: a time-dependent equation. Limnol. Oceanogr. 23 (4), 813–816. doi: 10.4319/lo.1978.23.4.0813
Skjæraasen J. E., Nilsen T., Meager J. J., Herbert N. A., Moberg O., Tronci V., et al. (2008). Hypoxic avoidance behaviour in cod (Gadus morhua L.): The effect of temperature and haemoglobin genotype. J. Exp. Mar. Biol. Ecol. 358 (1), 70–77. doi: 10.1016/j.jembe.2008.01.010
Smith M. D., Asche F., Bennear L. S., Oglend A. (2014). Spatial-dynamics of hypoxia and fisheries: The case of gulf of mexico brown shrimp. Mar. Resour. Econ. 29 (2), 111–131. doi: 10.1086/676826
Snoeijs-Leijonmalm P., Andren E. (2017). “Why is the Baltic Sea so special to live in?,” in Biological oceanography of the Baltic Sea. Eds. Snoeijs-Leijonmalm P., Schubert H., Radziejewska T. (Dordrecht: Springer Netherlands), 23–84, ISBN: 978-94-007-0668-2978-94-007-0668-2. doi: 10.1007/978-94-725007-0668-2_2
Soofiani N. M., Priede I. G. (1985). Aerobic metabolic scope and swimming performance in juvenile cod, gadus morhua l. J. Fish. Biol. 26 (2), 127–138. doi: 10.1111/j.1095-8649.1985.tb04249.x
R Stan (2023) RStan: the r interface to stan. R package version 2.26.15. Available at: https://mc-stan.org/.
Stierhoff K. L., Targett T. E., Miller K. (2006). Ecophysiological responses of juvenile summer and winter flounder to hypoxia: experimental and modeling analyses of effects on estuarine nursery quality. Mar. Ecol. Prog. Ser. 325, 255–266. doi: 10.3354/meps325255
Thomas Y., Flye-Sainte-Marie J., Chabot D., Aguirre-Velarde A., Marques G. M., Pecquerie L. (2019). Effects of hypoxia on metabolic functions in marine organisms: observed patterns and modelling assumptions within the context of dynamic energy budget (DEB) theory. J. Sea. Res. 143, 231–242. doi: 10.1016/j.seares.2018.05.001
Thomas P., Rahman M. S., Picha M. E., Tan W. (2015). Impaired gamete production and viability in Atlantic croaker collected throughout the 20,000km2 hypoxic region in the northern Gulf of Mexico. Mar. Pollut. Bull. 101 (1), 182–192. doi: 10.1016/j.marpolbul.2015.11.001
Thompson P. L., Nephin J., Davies S. C., Park A. E., Lyons D. A., Rooper C. N., et al. (2023). Groundfish biodiversity change in northeastern pacific waters under projected warming and deoxygenation. Philos. Trans. R. Soc. B.: Biol. Sci. 378 (1881), 20220191. doi: 10.1098/rstb.2022.0191
Thorarensen H., Gústavsson A., Gunnarsson S., Árnason A., Steinarsson A., Björnsdóttir R., et al. (2017). The effect of oxygen saturation on the growth and feed conversion of juvenile atlantic cod (Gadus morhua l.). Aquaculture 475, 24–28. doi: 10.1016/j.aquaculture.2017.04.002
Val A., Silva M., Almeida-Val V. (1998). Hypoxia adaptation in fish of the Amazon: a never-ending task. South Afr. J. Zool. 33 (2), 107–114. doi: 10.1080/02541858.1998.11448459
Vehtari A., Gelman A., Gabry J. (2017). Practical Bayesian model evaluation using leave-one-out cross-validation and WAIC. Stat Comput. 27 (5), 1413–1432. doi: 10.1007/s11222-016-9696-4
Wang T., Lefevre S., Huong D. T. T., van Cong N., Bayley M. (2009). “The effects of hypoxia on growth and digestion,” in Hypoxia, vol. 27 . Eds. Richards J. G., Farrell A. P., Brauner C. J. (Fish Physiology. Academic Press), 361–396. doi: 10.1016/S1546-5098(08)00008-3
Weber R. E., de Wilde J. A. M. (1975). Oxygenation properties of haemoglobins from the flatfish plaice (Pleuronectes platessa) and flounder (Platichthys flesus). J. Comp. Physiol. 101, 99–110. doi: 10.1007/BF00694151
Wu R. S. (2002). Hypoxia: from molecular responses to ecosystem responses. Mar. pollut. Bull. 45 (1), 35–45. doi: 10.1016/S0025-326X(02)00061-9. ISSN: 0025-326X.
Wu R. S. (2009). “Chapter 3 effects of hypoxia on fish reproduction and development,” in Hypoxia, vol. 27 . Eds. Richards J. G., Farrell A. P., Brauner C. J. (Fish Physiology. Academic Press), 79–141. doi: 10.1016/S1546-5098(08)00003-4
Yang H., Cao Z.-D., Fu S.-J. (2013). The effects of diel-cycling hypoxia acclimation on the hypoxia tolerance, swimming capacity and growth performance of southern catfish (Silurus meridionalis). Comp. Biochem. Physiol. Part A.: Mol. Integr. Physiol. 165 (2), 131–138. doi: 10.1016/j.cbpa.2013.02.028
Zhang W., Cao Z.-D., Peng J.-L., Chen B.-J., Fu J. (2010). The effects of dissolved oxygen level on the metabolic interaction between digestion and locomotion in juvenile southern catfish (Silurus meridionalis chen). Comp. Biochem. Physiol. Part A.: Mol. Integr. Physiol. 157 (3), 212–219. doi: 10.1016/j.cbpa.2010.06.184
Keywords: marine hypoxia, metabolic prioritization, integrative modeling, meta-analysis, fish community dynamics, Baltic Sea
Citation: Duskey E (2023) Metabolic prioritization of fish in hypoxic waters: an integrative modeling approach. Front. Mar. Sci. 10:1206506. doi: 10.3389/fmars.2023.1206506
Received: 15 April 2023; Accepted: 28 June 2023;
Published: 26 July 2023.
Edited by:
Ibon Galparsoro, Technological Center Expert in Marine and Food Innovation (AZTI), SpainReviewed by:
Adam Downie, The University of Queensland, AustraliaShijian Fu, Chongqing Normal University, China
Vera Maria Fonseca Almeida-Val, National Institute of Amazonian Research (INPA), Brazil
Copyright © 2023 Duskey. This is an open-access article distributed under the terms of the Creative Commons Attribution License (CC BY). The use, distribution or reproduction in other forums is permitted, provided the original author(s) and the copyright owner(s) are credited and that the original publication in this journal is cited, in accordance with accepted academic practice. No use, distribution or reproduction is permitted which does not comply with these terms.
*Correspondence: Elizabeth Duskey, ZWxpemFiZXRoLmR1c2tleUBzbHUuc2U=