 Laura Rojas1,2
 Martin Haulena3
 Colleen Reichmuth4
 Björn Busse5L. Aurora Ramos-Garduño1
 Oscar Rico-Chávez1
 Ursula Siebert2
 Maria Morell2*
- 1Faculty of Veterinary Medicine and Zootechnics, National Autonomous University of Mexico, Mexico City, Mexico
- 2Institute for Terrestrial and Aquatic Wildlife Research (ITAW), University of Veterinary Medicine Hannover, Foundation, Büsum, Germany
- 3Vancouver Aquarium Marine Science Center, Vancouver, BC, Canada
- 4Institute of Marine Sciences, University of California, Santa Cruz, Santa Cruz, CA, United States
- 5Department of Osteology and Biomechanics, University Medical Center Hamburg-Eppendorf, Hamburg, Germany
Ultrastructural descriptions of the inner ear of highly sound-dependent mammalian species are lacking and needed to gain a better understanding of the hearing sense. Here, we present the first morphometric descriptions of the sensory cells of the inner ear in the harbor seal (Phoca vitulina), a mammal with broadly sensitive amphibious hearing. Scanning electron micrographs of the apical surface of the outer hair cells (OHCs) and inner hair cells (IHCs) within the organ of Corti were obtained from five individuals and analyzed by linear and geometric morphometrics. Measurements were taken at regular locations along the cochlea. The spiral shape of the seal cochlea contained two and a half turns. The organ of Corti had an average length of 27.7 mm with 12,628 OHCs (12,400-12,900). Six linear morphometric parameters showed significant patterns of change associated with their location within the cochlear spiral. Likewise, these trends were similarly expressed in cell configuration (cell blocks with 57 landmarks in 12 representative cells) revealed by geometric morphometry. Cell configuration varied predictably with position in the cochlea according to clustering analyses and Procrustes ANOVA (F= 25.936, p<0001). Changes associated with OHCs were primarily responsible for observed changes in cell configuration. An integration trend in cell shape change was also observed in which IHCs and OHCs share features in their morphological variation by the two-block partial least squares analysis (CR=0.987, p<0.001) and the modularity hypothesis (CV=0.99, p=0.05). These descriptive and quantitative findings provide a baseline for the morphology and morphometry of the sensory cells of the organ of Corti in harbor seals, allowing for comparisons between normal and pathological features. This initial morphological description should enable the correlation between position, morphometric features, and frequency coding along the spiral of the inner ear in this species, whose hearing ability is well studied.
1 Introduction
The effects of human-generated noise in marine ecosystems are observed and reflected in highly sound-dependent species. For marine mammals, studies of hearing, sound production, and auditory anatomy contribute to understanding the potential harm of intense sounds (e.g., Southall et al., 2005). In particular, understanding the morphology of the inner ear of different species provides insight into auditory adaptations (Ketten, 2012; Martins et al., 2020) and enables the identification of tissue damage that may be associated with exposure sound sources (Morell et al., 2015; Morell et al., 2017; Morell et al., 2021; Morell et al., 2022a; Rohner et al., 2022). The organ of Corti, which contains the sensory cells, allows for the transduction of sound vibrations into neural signals. The arrangement of this specialized sensory epithelium has been documented in many terrestrial species (Lim, 1980; Lim, 1986) and the arrangement of sensory cells, dimensions of the basilar membrane and type I afferent innervation in some marine mammals (Wever et al., 1971; Wever et al., 1972; Guofu and Kaiya, 1992; Wartzok and Ketten, 1999; Morell et al., 2015; Sensor et al., 2015; Ketten et al., 2021; Morell et al., 2022a). The organ of Corti follows the length of the cochlear spiral and contains one row of inner hair cells (IHCs) and three parallel rows of outer hair cells (OHCs). The OHCs are responsible for frequency sensitivity and signal enhancement, while IHCs are involved in the transduction of mechanical stimuli to encoded neural signals (Lim, 1986).
Detailed studies of the inner ear reveal characteristics of the organ of Corti related to sensory cell innervation and biomechanics (Von Békésy and Wever, 1960; Dallos, 1992; Raphael and Altschuler, 2003). For example, in guinea pigs (Cavia porcellus), associations have been found between variation in the microstructure of sensory cells and their corresponding coded frequencies with respect to their location in the cochlear spiral (Yarin et al., 2014).
Knowledge of microscopic anatomy within the inner ear is scarce in phocid carnivores (true seals). Histological descriptions of soft tissue structures have been reported for only two species, the harp seal (Pagophilus groenlandicus; Ramprashad et al., 1972) and the Weddell seal (Leptonychotes weddellii; Welsch and Riedelsheimer, 1997). Harbor seals have the widest geographic distribution among phocids (Teilmann and Galatius, 2018) and their broadly sensitive underwater hearing ability, with range of best hearing from 300 Hz to 60 kHz, is well studied (Møhl, 1968; Terhune, 1989; Kastak and Schusterman, 1998; Southall et al., 2005; Kastelein et al., 2009; Reichmuth et al., 2013; Cunningham and Reichmuth, 2016, Terhune, 1991; Wolski et al., 2003). However, there is no anatomical record of the organ of Corti for this species.
The aim of this study is to provide the first morphological characterization of sensory cells in the organ of Corti using linear and geometric morphometric techniques in the harbor seal (Phoca vitulina). These techniques allow the identification of variation in shape and key anatomical structures of sensory cells in the organ of Corti, essential in the hearing process. These descriptive and quantitative findings will provide a baseline for the morphology and morphometry of the sensory cells of the organ of Corti in harbor seals, which will allow comparing between normal and pathological features.
2 Materials and methods
2.1 Animals
Samples were obtained from five harbor seals euthanized for medical reasons. Since the inner ear must be fixed quickly after death to ensure adequate preservation of the cochlear epithelial tissue, priority was given to collecting the ears during necropsy.
Samples were from four neonatal individuals (one male, three females) from the Vancouver Aquarium Marine Science Centre, Vancouver, Canada. One additional sample was from an adult male at the University of California Santa Cruz, USA. One ear from each seal was evaluated (Table 1).
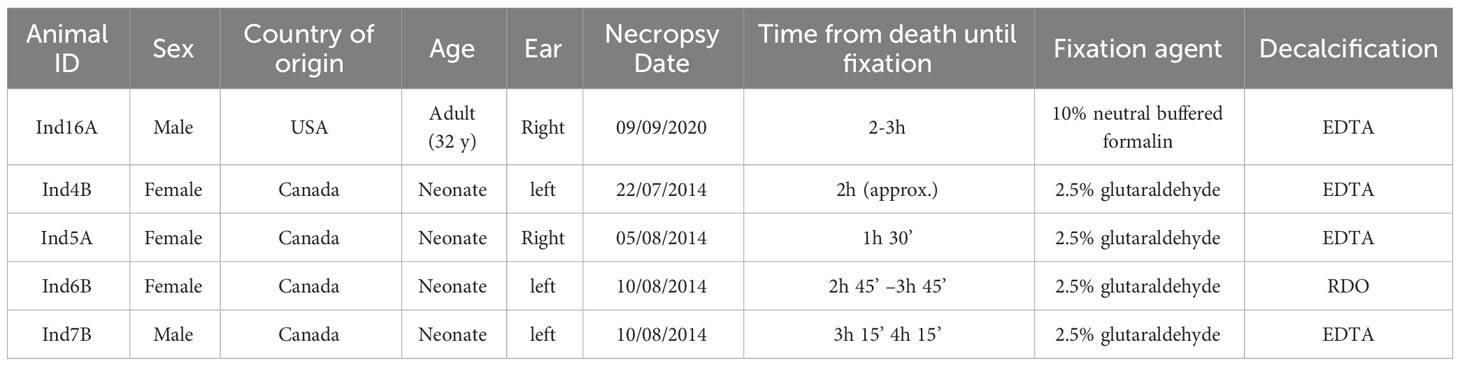
Table 1 General data of the seals used for the study.
2.2 Tissue sampling
The removal and fixation of ears were performed following the protocol by Morell et al. (2022b). The inner ears of the four neonates were perfused with 2.5% glutaraldehyde in 0.1M cacodylate buffer perilymphatically. The ears of the adult were immersed in 10% neutral buffered formalin (Table 1).
The periotic bone around the cochlea was decalcified by submersion in 14% ethylenediaminetetraacetic acid (EDTA) tetrasodium salt (pH 7.4). This solution was changed every 7-10 days, following the protocol described in Callis and Sterchi (1998). One sample was decalcified with RDO® following Morell et al. (2009) (Table 1). In both cases, decalcification was stopped when the vestibular scala of the cochlea was uncovered. Dissection of the cochlea was performed to expose the apical part of the sensory cells along the organ of Corti. Samples were dehydrated with increasing concentrations of ethanol, dried at the critical point with CO2, coated with platinum-palladium or gold, and observed using a Zeiss Focus Ion Beam (FIB) Crossbeam 340 scanning electron microscope (SEM) at Universitätsklinikum Hamburg-Eppendorf (UKE), Germany for ultrastructural evaluation.
Three samples from Canada (Ind4B, Ind5A, Ind7B) were kept in 0.1M cacodylate buffer until they were processed for SEM in 2020-2021. Meanwhile, the Ind6B sample was processed for SEM a few days after fixation. On the other hand, the sample from USA (Ind16A) was processed for SEM seven months after collection.
2.3 Cochlear length and characterization of the locations
Consecutive SEM images were taken of the organ of Corti along the cochlear spiral from apex to base. The complete sample was tilted to ensure that each image was flat in the area of interest. Cochlear length was measured at the boundary between the first OHC and the inner pillar cells in successive images using ImageJ® [NIH, Rasband, (1997-2018)]. By overlaying these consecutive images, the total cochlear length was obtained (Figure 1).
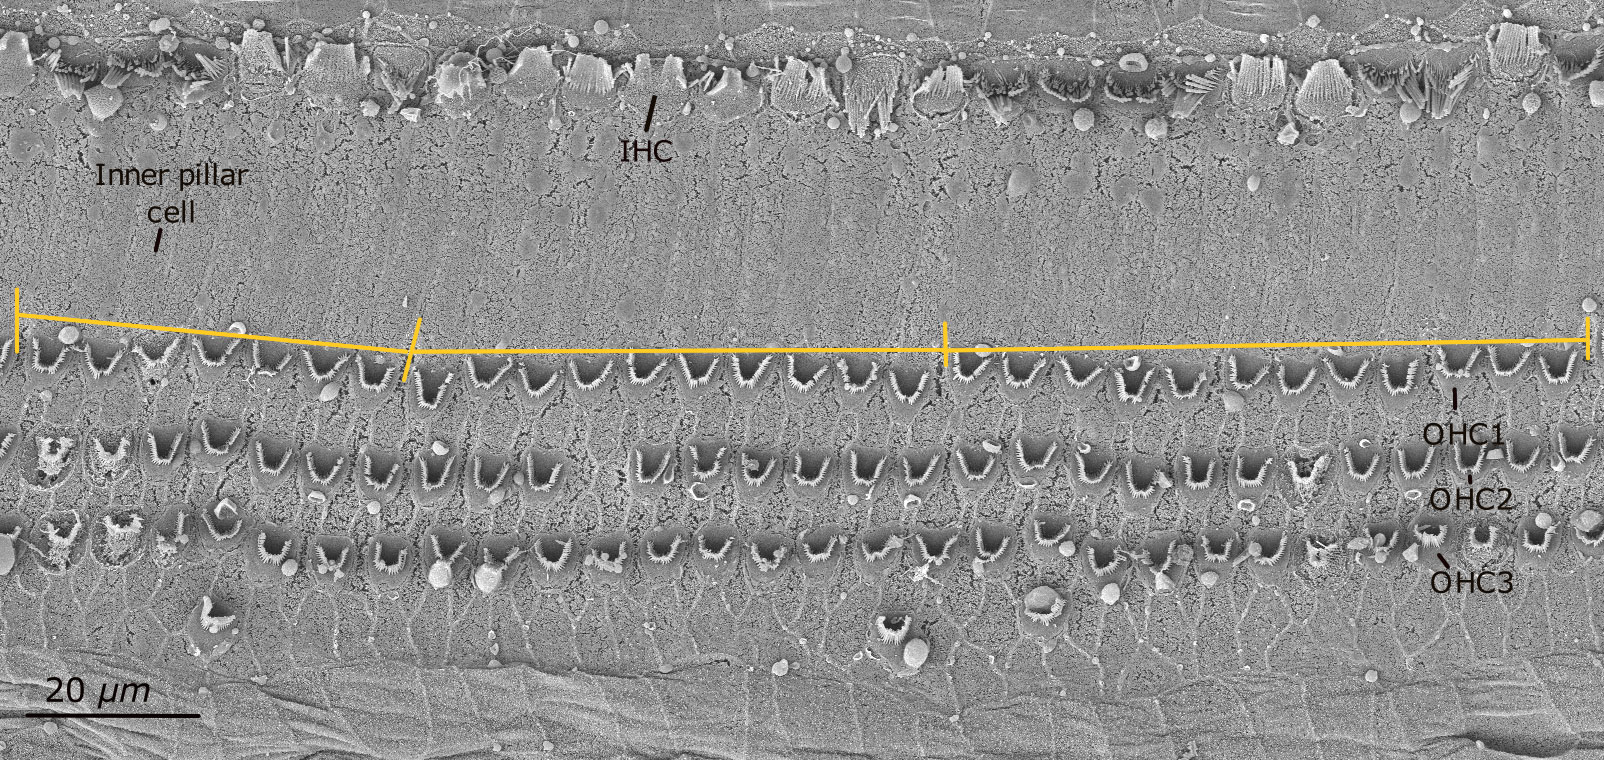
Figure 1 Scanning electron micrograph of one segment of the organ of Corti in the harbor seal (sample Ind5A). Inner hair cells (IHCs) are seen in the first row. The boundary between the first row of outer hair cells (OHC1) and the inner pillar cells was measured in linear distance for cochlear length calculation (shown by the yellow line).
Once the total cochlear length was measured, images were obtained at higher magnification at ten equally spaced positions along the cochlear spiral from 5% ( ± 2%) from the apex to 95% (± 2%), near the base (Figure 2). Images were obtained when the organ of Corti was complete and flat, as in Figure 3. At least three images were obtained per location for each sample. Cell density was estimated from the counting in each location per 100 µm, in each row of OHCs.
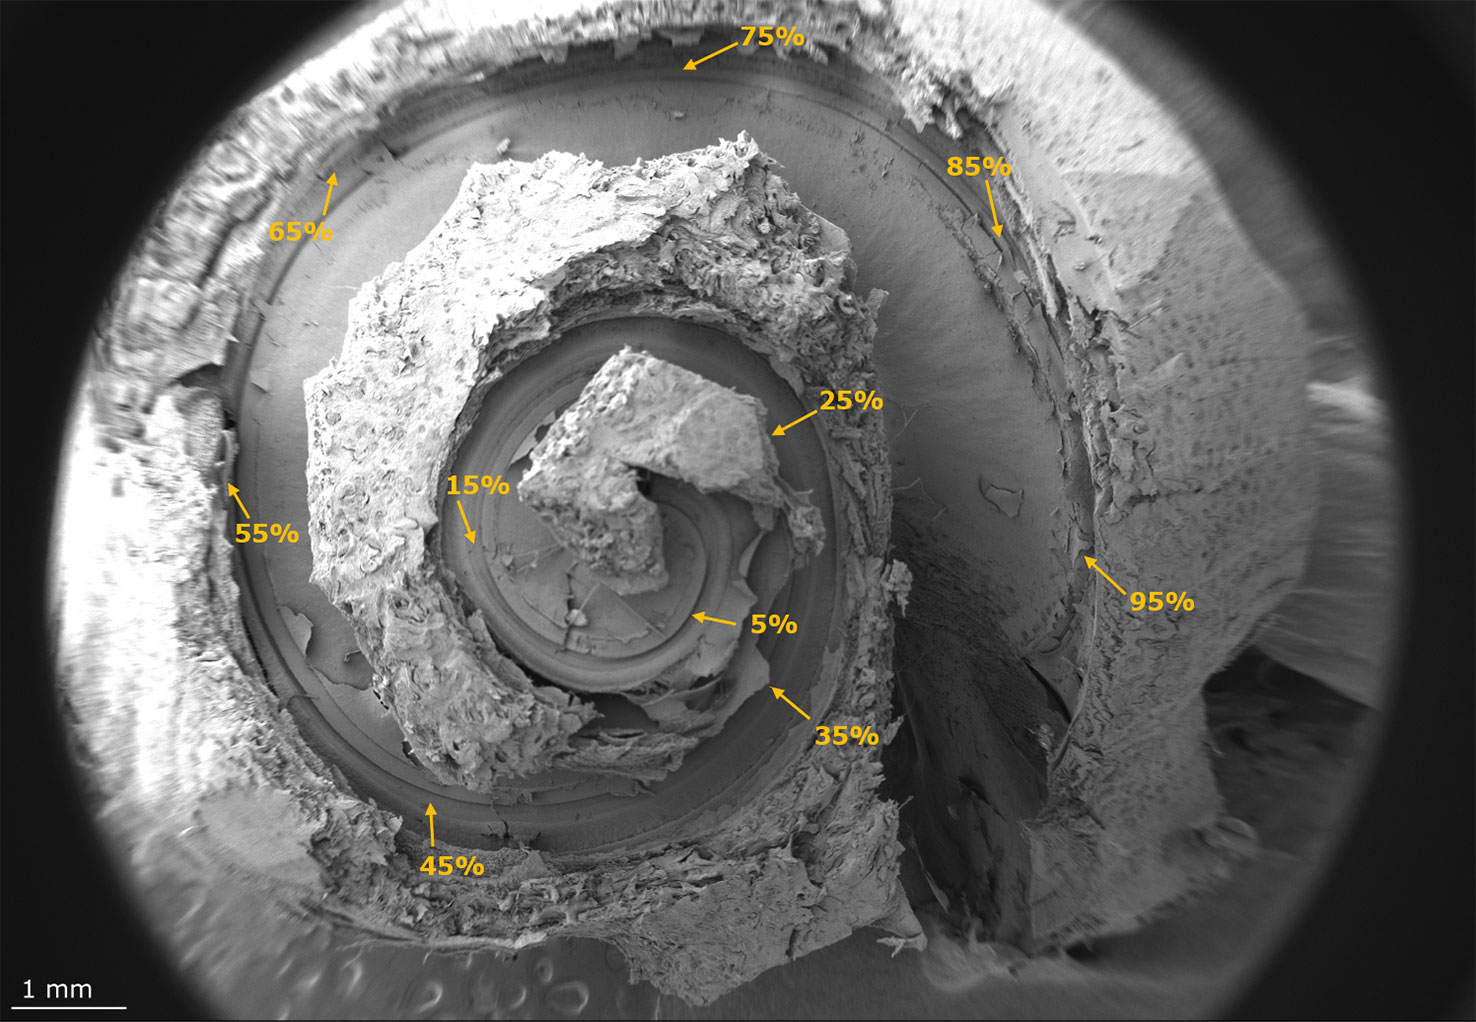
Figure 2 Scanning electron micrograph of the cochlear spiral in the harbor seal. The ten focal positions from the apex to the base of the cochlear spiral considered for the analysis are noted in yellow.
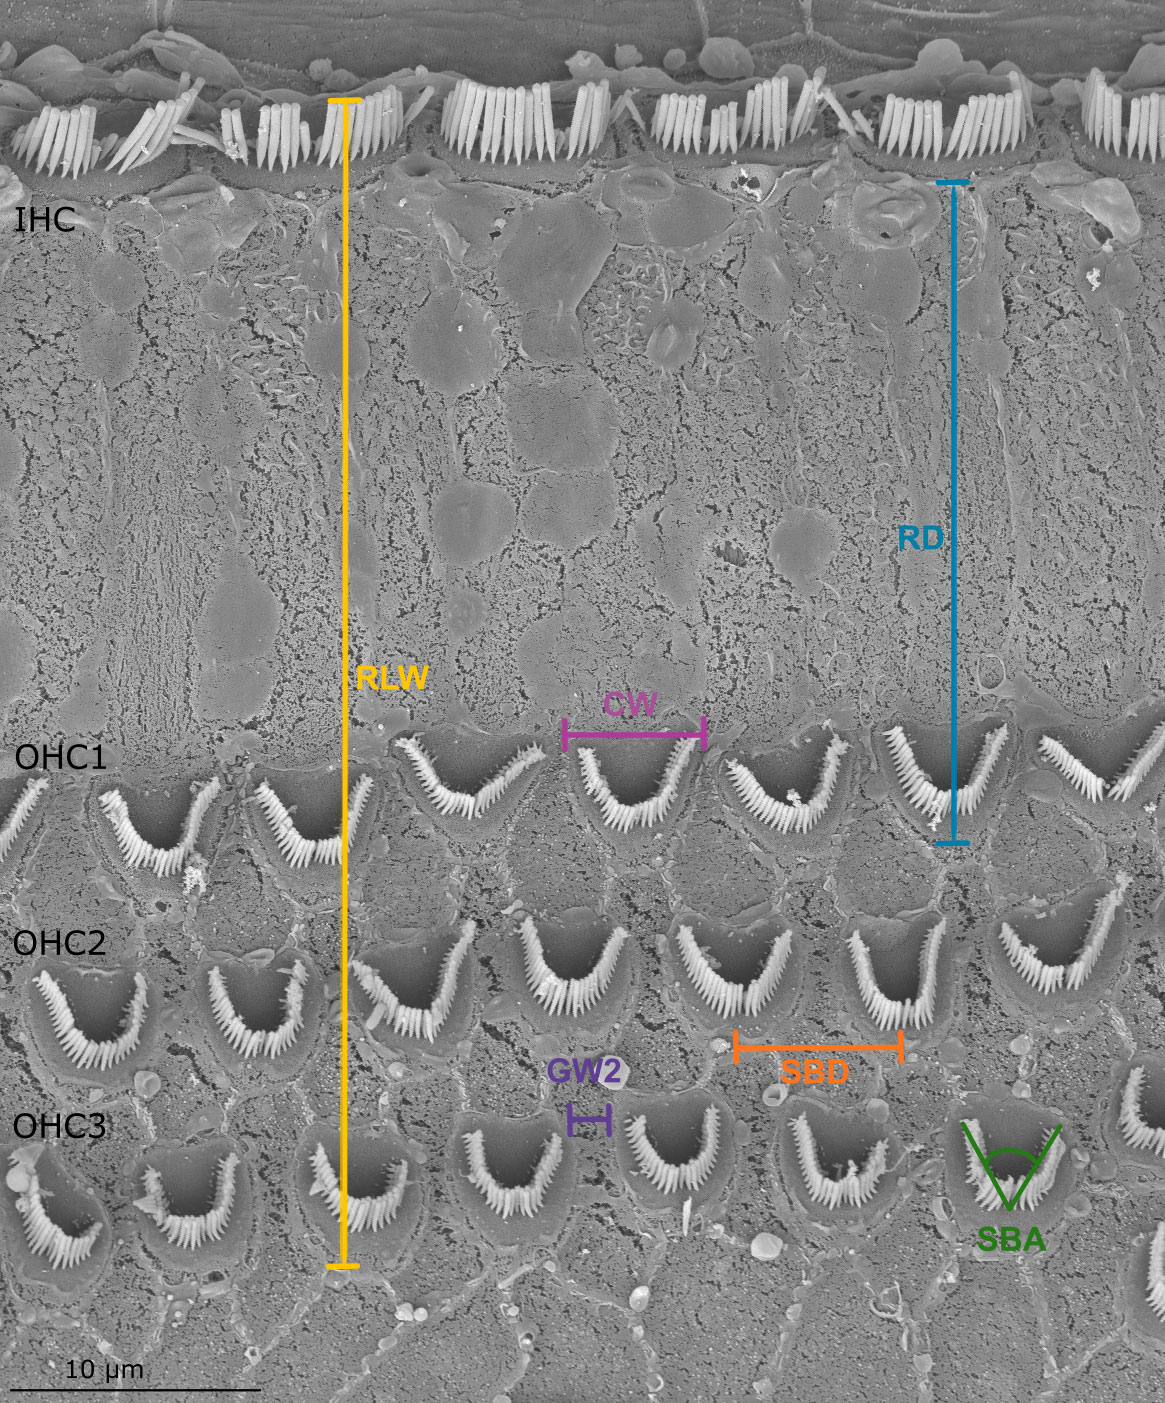
Figure 3 Scanning electron microscopy image of the organ of Corti in the harbor seal (sample Ind7B). The parameters of the measurements listed in Table 2 are shown.
2.4 Linear morphometric analysis
Established methods used for linear morphometry (LM) analysis (Yarin et al., 2014; Girdlestone et al., 2020) were followed. At each position, 19 measurements based on the form and spatial positions of OHCs and IHCs were obtained from image analysis (Figure 3 and Table 2). Except for the reticular lamina width (RLW, i.e., distance between IHC and OHC3), all measurements were performed on the three rows of OHCs and were grouped according to the measurement parameter. For example, OHC width (CW) was grouped according to each row of OHCs (CW1, CW2 and CW3).
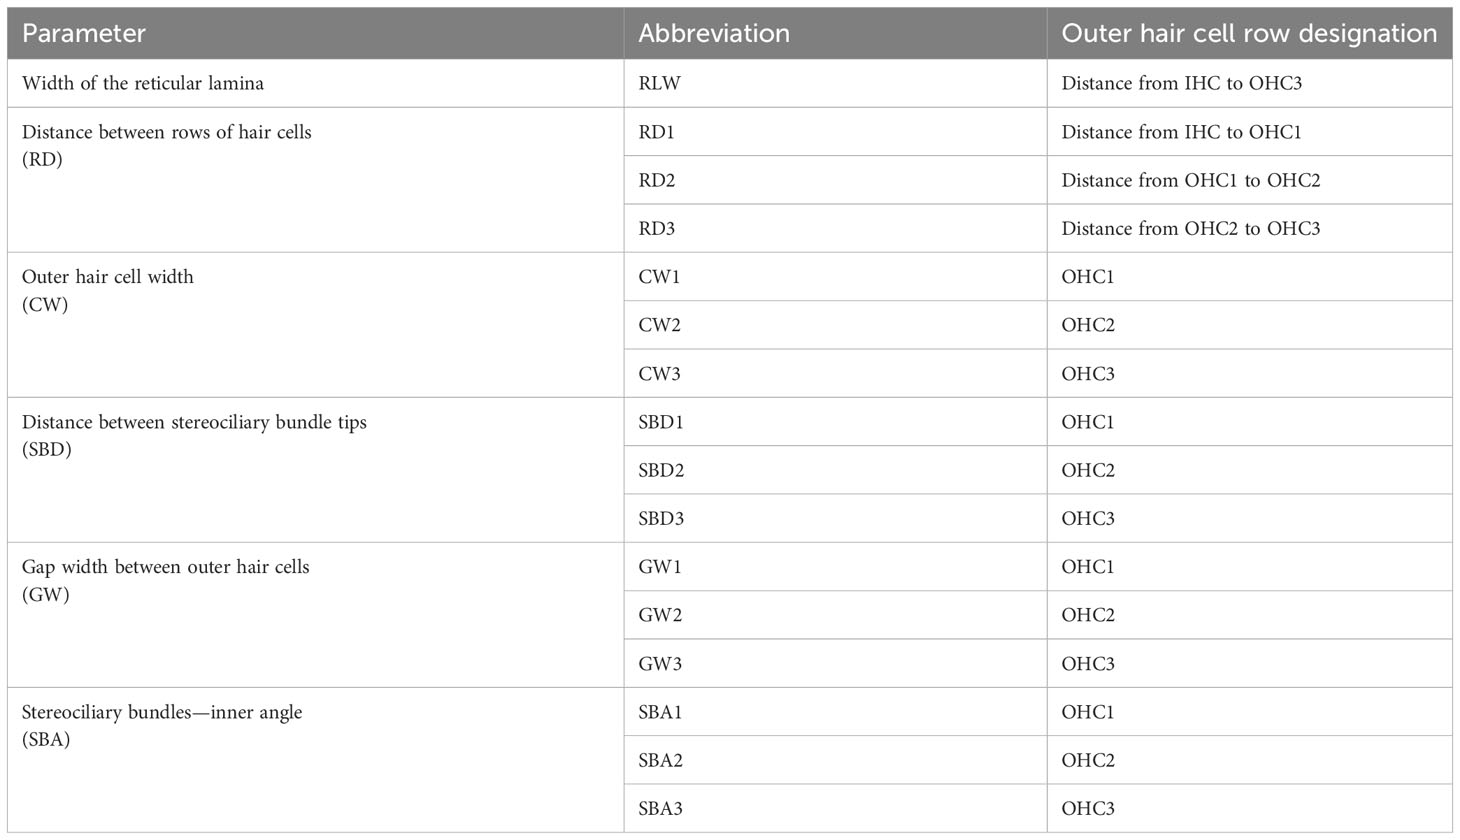
Table 2 Parameters of the sensory epithelium measured using linear morphometrics, showing the designated OHC row where each measurement was taken.
Due to the variability in age (4 neonate samples and one adult sample) analyses were also conducted to identify significant differences associated with the life stage of the seals.
Therefore, 16 measurements were made at each position according to the six established parameters, using ImageJ© software (Figure 3).
The data were evaluated for normality and homoscedasticity using Kolmogorov-Smirnov and Levene tests, respectively. To determine significant differences between measurements and their location the Kruskal-Wallis test was used. Finally, to identify significant locations within each measure using pairwise comparisons a Mann-Whitney-Wilcoxon post hoc test with the Holm stepwise method was performed. Analyses for each measure and parameter were done using the software R 4.1.0. (R Core Team, 2020).
2.5 Geometric morphometric (GM) analysis
Geometric morphometry considers the shape of biological structures by means of Cartesian geometric coordinates of their anatomical landmarks. These landmarks are homologous between individuals and allow the shape of each individual to be quantified (Rohlf and Marcus, 1993; Adams et al., 2004; Adams et al., 2013). This approach has been used to analyze ear shape and identify patterns of variation in different species (Billet et al., 2015; Ekdale, 2016; Stoessel et al., 2016; Schnitzler et al., 2017).
To illustrate the shape of the sensory cells and evaluate their changes along the cochlear spiral, 57 landmarks were selected for measurements within blocks of 12 cells (3 IHCs and 9 OHCs). This cell block is the “organism of reference” for this study (Figure 4). At each 10% measurement location three to five cell blocks were obtained. Digitization of the landmarks was performed for images at each position using tpsUtil© ver. 1.82 2022 (Rohlf, 2022) and tpsDig2© ver. 2.32 2021 (Rohlf, 2021) software. In contrast to linear morphometry, geometric morphometry analyses allowed the identification of changes in the complete shape of the sensory cells.
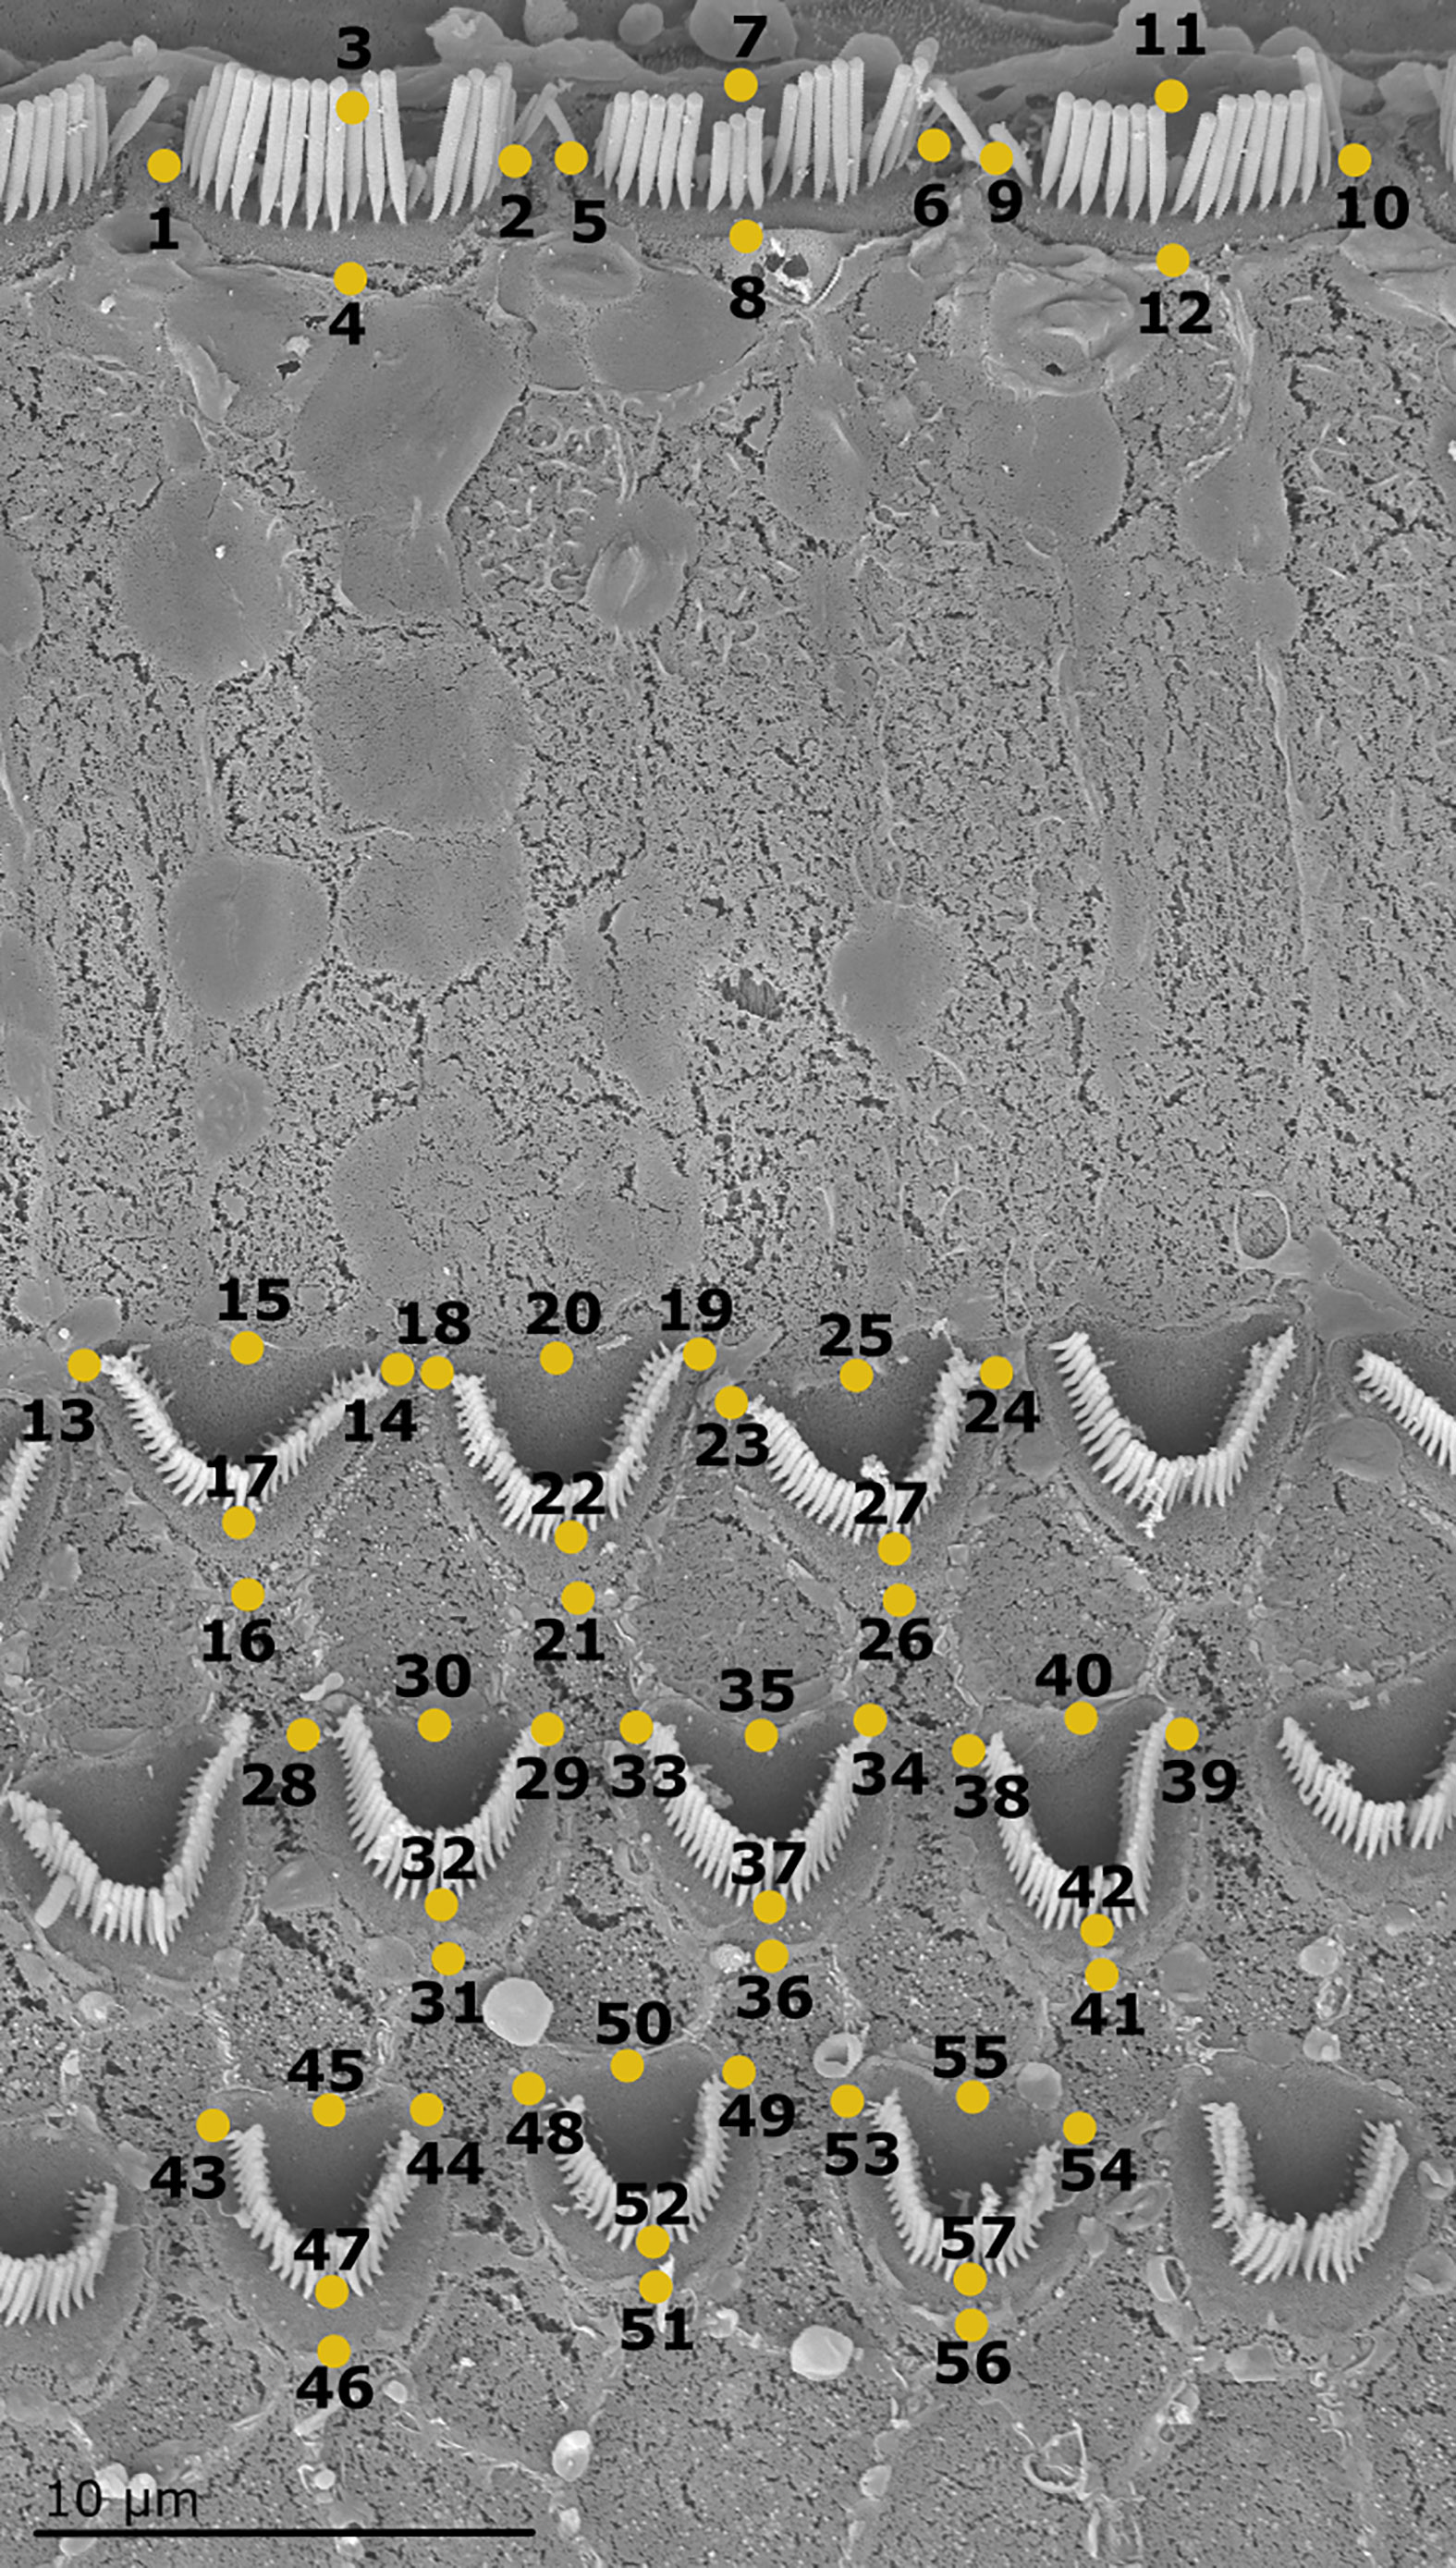
Figure 4 Scanning electron micrograph of one cell block (including 3 IHCs, 9 OHCs) at the 25% position of the organ of Corti of the harbor seal (sample Ind4B). The 57 landmarks define the shape of each cell block (Adams and Otárola-Castillo, 2013).
Procrustes fit (reduction of the effect of size, orientation, and alignment) of the geometric data was performed for standardization (Rohlf and Slice, 1990). From the standardized data, all the statistical analyses were performed.
A simple regression analysis with 1000 permutations was conducted to determine whether the centroid size influenced the observed shape variation (allometric component). Principal component analysis (PCA) was performed to visualize the existence of clustering patterns according to cell shape change. To identify these clusters in the data, the K-medoids clustering method using the first five principal components. The number of medoids (k) was determined using the Partition Around Medoids (PAM) algorithm (Maechler et al., 2019). These two studies were performed following the protocol of Theska et al. (2020). A permutational MANOVA (Procrustes ANOVA in geometric morphometrics) was also conducted to assess whether there was an association between shape change and the location of the sensory cells within the cochlear spiral, a clustering factor of research interest. Finally, the cell block configuration (57 landmarks) was divided into two modules: IHCs and OHCs (landmarks 1 to 12 and 13 to 57, respectively; Figure 4). The existence of a difference in the shape between the two cell types was assessed using the modularity hypothesis and the two-block partial least square regression analysis (2BPLS).
The packages Geomorph, Morpho, Cluster, and FactoExtra (Adams et al., 2013; Kassambara and Mundt, 2020, Schlager et al., 2021), of the R software were used for analyses.
3 Results
3.1 Cochlear length and cell density
The cochlear spiral of every harbor seal sample contained two and a half turns. The mean length of the spiral was 27.7 mm, with a range of 26.4 to 30 mm (n=5). The cochlear length for Ind16 was estimated in the basal part due to the absence of this region (Table 3).
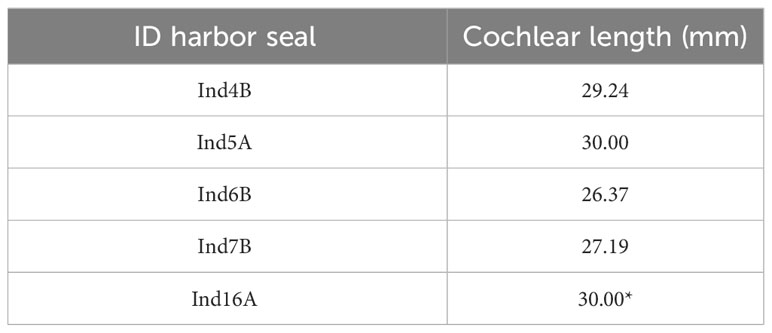
Table 3 Cochlear length in each harbor seal.
The estimated OHC density for each seal ranged from 12,400 to 12,900 cells, with a mean of 12,628 OHCs. Mean OHC density ranged from 10.0 to 17.5 cells/100 µm. Despite the absence of OHC counts at some locations due to artefact of processing, a decrease in cell density was observed in the cochlear spiral (from apex to base, Table 4). The apex region (positions 5-25%) of the cochlear spiral had the highest cell density (Table 4).
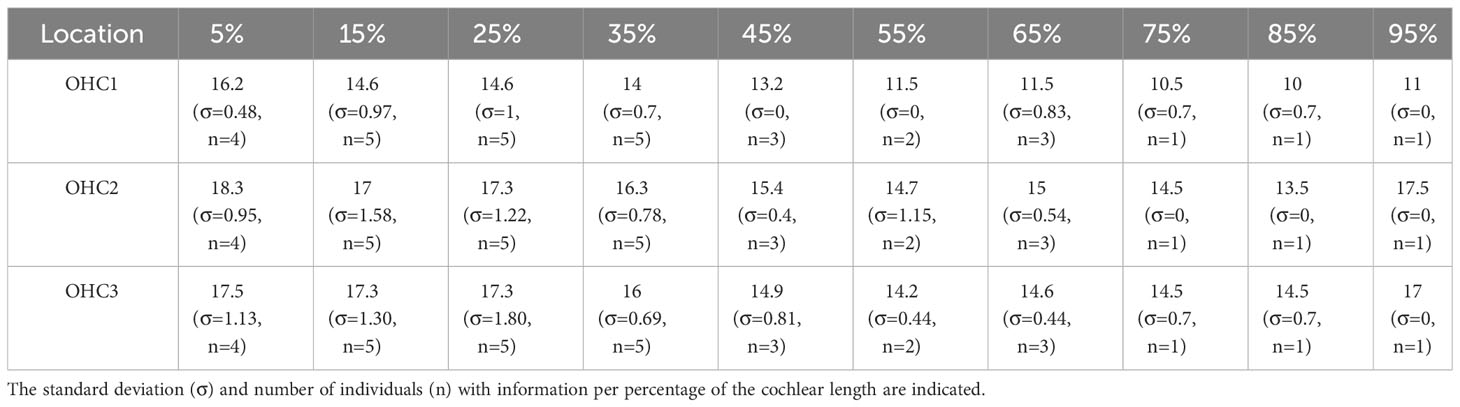
Table 4 Average of the density estimation of OHCs per 100 µm in each row.
3.2 Linear morphometrics (LM)
Over 12,300 measurements were made from the 19 linear morphometric measures in the ears of the five seals analyzed. The number of measurements performed per individual ranged from over 1,500 to over 3,000. This variability was due to the absence of optimal locations for analysis in some samples due to artefacts in the tissue preparation process. Since Ind5A had 99% of the cochlear spiral preserved, the 98% location was included in the analyses to account for the high variability in the base region. Thus, locations were described from 5% to 98% of the cochlear spiral for this seal. In addition, the 10% location in Ind16 was considered, as no information was available for the 5% location. Morphometric measurements were analyzed individually and as a parameter when they included all three rows of OHCs. For example, the width of the hair cells in each row of outer hair cells (CW1, CW2, CW3) and their mean (CW).
Two patterns were identified in the linear morphometric measurements. On one hand, a significant decreasing trend was observed as the cochlear spiral advanced from apex to base. This trend was identified for 1) the width of the reticular lamina RLW (H= 353.92, p<.0001) with mean measurements at the apex of 58.3 µm narrowing to 14.4 µm at the base of the cochlear spiral (Figure 5A); 2) the distance between outer hair cell rows RD (H=494.87, p<.0001) with maximum values at the apex (38.5 µm) and minima at the base (2.4 µm) (Figure 5C1).
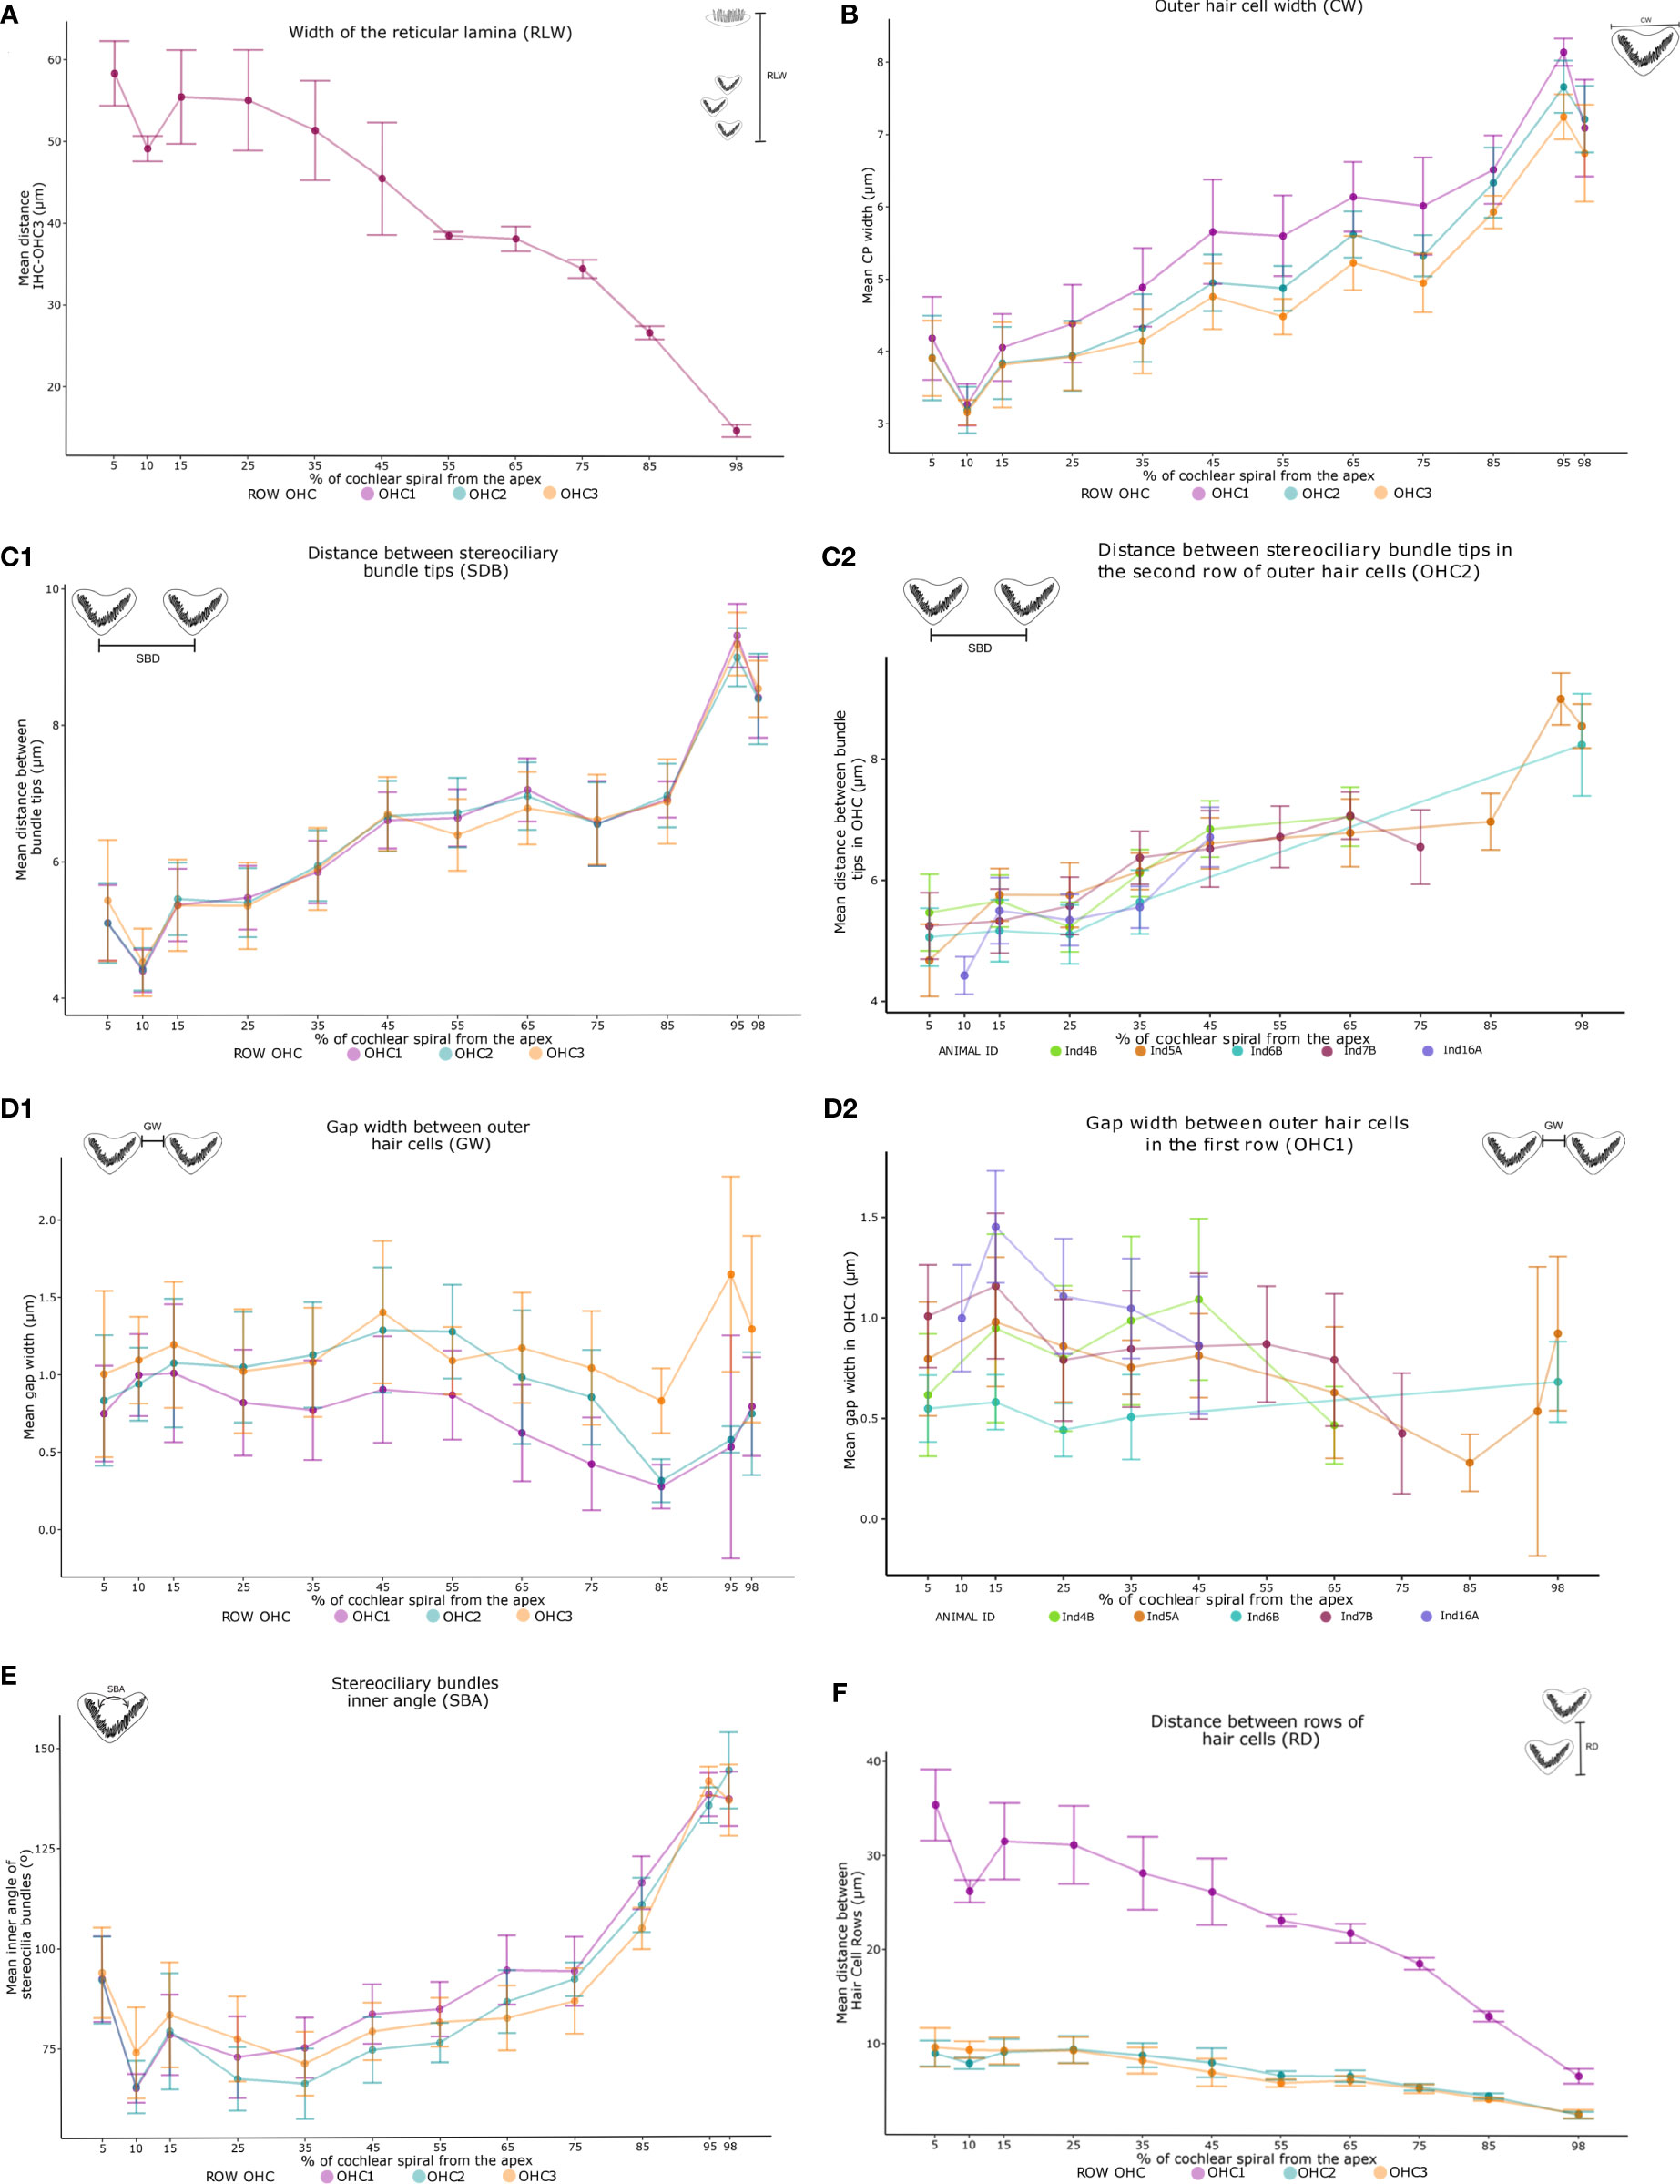
Figure 5 Variation trends in averages of the 16 measurements of sensory cells (Table 2) along the cochlear spiral by linear morphometry of the five harbor seals. From apex to base, increasing patterns were observed in the width, the opening angle of the outer hair cells (OHCs) and their distance between the stereociliary bundles tips (B, C1, E). In contrast, the distance between the rows of sensory cells and the width of the organ of Corti (A, F) showed a decreasing trend. The width of the distance between OHCs did not show a trending pattern (D1). The measurements in each individual is also shown (C2, D2), which demonstrate similar results between the neonate and adult individuals. The legend represents the colors of the outer hair cell rows: lilac OHC1, light blue OHC2 and salmon OHC3 (A, B, C1, D1, E, F). In addition, individuals can be identified in two figures shown (C2, D2), green Ind4B, orange Ind5A, blue Ind6B, magenta Ind7B and purple Ind16A.
On the other hand, a significant increase from apex to base was observed in CW and SBD parameters. The width of the OHCs (CW) showed a significant increase (H=209.7, p<.0001) with values from 3.2 µm at 5% of the apex to 8.1 µm at 98% (Figure 5B). Likewise, a significant increasing pattern (H=1048.2, p<.0001) was found in the distance between stereociliary bundle tips (SBD) (Figure 5C1). The CW, RD, SBD, SBA, measurements showed similar trends relative to position, independent of the outer hair cell row (OHC1, OHC2, OHC3) in which they were found (Figures 5B, C1, E, F). In addition, significant differences were recorded in 95% of the total pairwise comparisons performed in the post hoc test, including the single RLW measure (Figure 6).
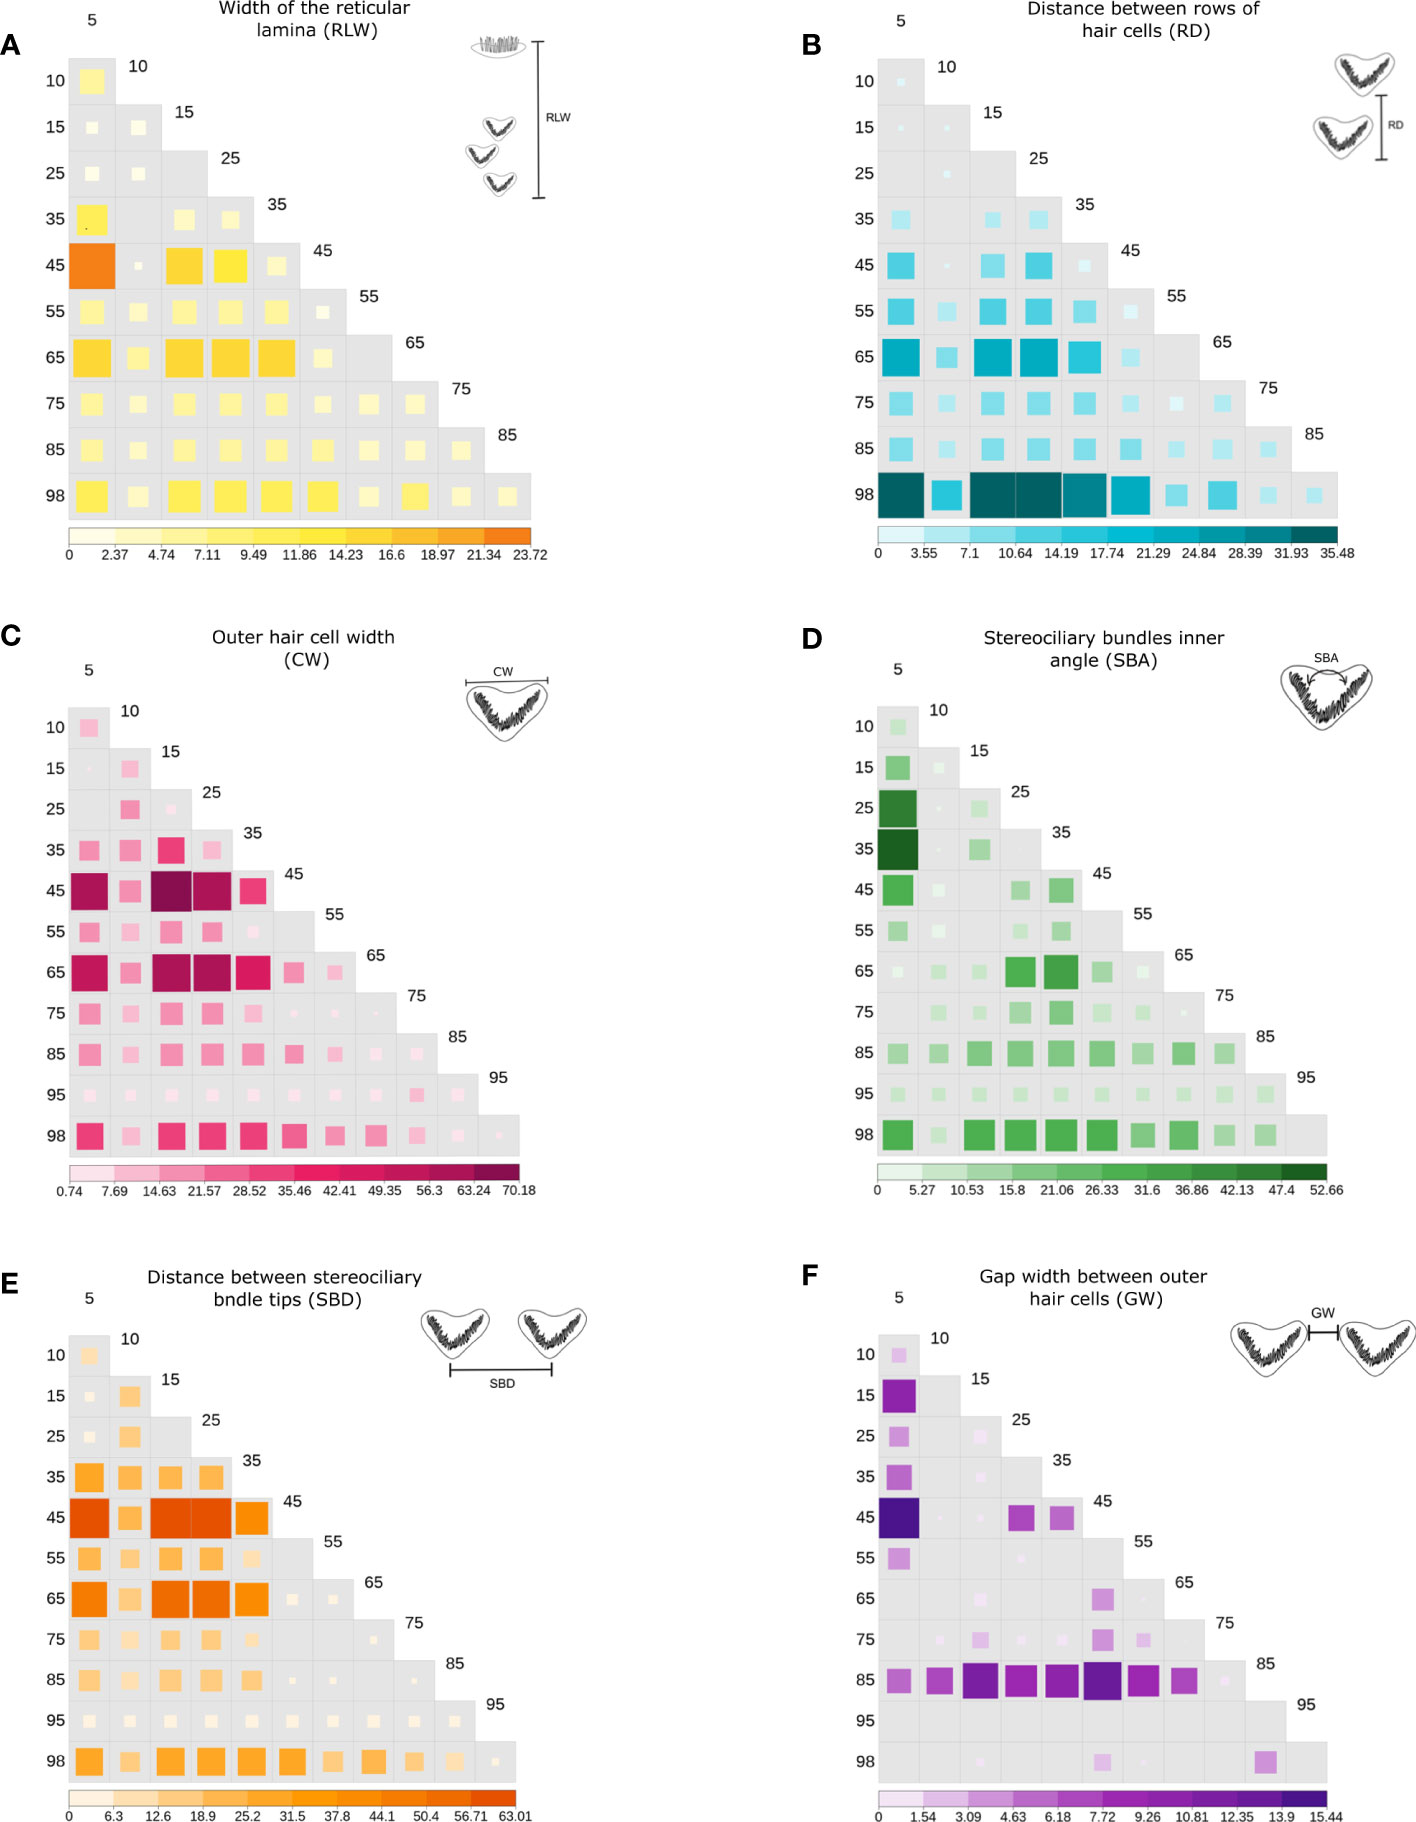
Figure 6 Significance value heatmap for linear morphometrics (p, negative log- transformed) of the Wilcoxon post-hoc test with Holm’s pairwise method, between pairwise comparisons of the outer hair cell (OHC) locations identified in each parameter performed (A–F). The negative log-transformed allows us to identify in the figure the most significant comparisons between locations, as larger values correspond to the most significant p-value and missing values indicate a p >0.05 (no significance). The parameters are defined in Table 2; Figure 3.
The stereociliary bundles (SBA) decreased in inner angles from the apex to the 25% location (95°-75°) and increased in inner angles from 25% to the region of the base of the cochlear spiral (75°-145°). The angular measurements showed significant differences between all cochlear spiral locations (H=746.15, p<.0001) (Figure 5D).
The gap width between outer hair cells (GW) was the only morphometric parameter that showed fluctuations along the cochlear spiral. Further, measures of GW varied between each OHC row. Although no clear trend in GW was observed, these differences were significant along their location in the cochlear spiral (H=209.7, p<.0001) (Figure 5E). Pairwise comparisons in the post hoc test reflected this significance only at non-subsequent locations (Figure 6F).
The mean distances of the measurements made did not show a trend between the life stages of the seals. Neonate and adult individuals showed the same trends and similar results in the mean of each measurement (Figures 5C1, 2, D1, 2).
Changes in the shape of the sensory cells were associated with their location along the cochlear spiral. The cells increased in width, opening angle and distance from each other from the apex to the base. Similarly, the distance between each row of cells decreased, as did the width of the organ of Corti.
3.3 Geometric morphometrics (GM)
The cell block configuration (57 landmarks within a block of 3 IHCs and 9 OHCs) was used to identify differences in the shape of the sensory cells along the cochlear spiral (Figure 7).

Figure 7 Representative scanning electron micrographs of the organ of Corti in the harbor seal (sample Ind7B) at 5%, 55% and 95% locations along the cochlear spiral (upper images). Changes in the configuration of sensory cells (lower wireframe plots) were seen as the cochlear spiral advanced. The spaces between the rows of sensory cells decreased from the apex to the base, and the cell configuration widened and transitioned from a strong V-shape to a more flattened shape. These geometric morphological changes were most visible in the OHCs. The grey wireframe plots represent the average and the colored plots the shape of the sensory cells of the organ of Corti in the referenced location.
The effect of centroid size on shape variation (Procrustes coordinates) was 1.39% and was not significant (p-value = 0.0794), indicating that the variability of the shape of the configuration was not strongly affected by the absolute size of the organ of Corti.
The principal component analysis showed that the first 2 PCs explaining 86.7% of the variation of the shape. PC1 was responsible for 71.7% of the variation (eigenvalue 2.851380e-02) while PC2 explained 15% of the shape variation (eigenvalue 5.956779e-03). The analysis shows that the variation in cell shape within the first component is given by the position of both types of sensory cells while the second component only involves OHCs. A clear pattern of overlapping data was observed at the apex locations (5%-45%) (Figure 8), which was associated with the change in cell shape concerning its location in the cochlear spiral. The contribution of each landmark to the first two principal components was also examined. For PC1, 36.5% of landmarks were found to belong to IHCs and the remaining 35.2% to OHCs. In contrast, for PC2 the participation only includes landmarks belonging to OHCs (Table 5).
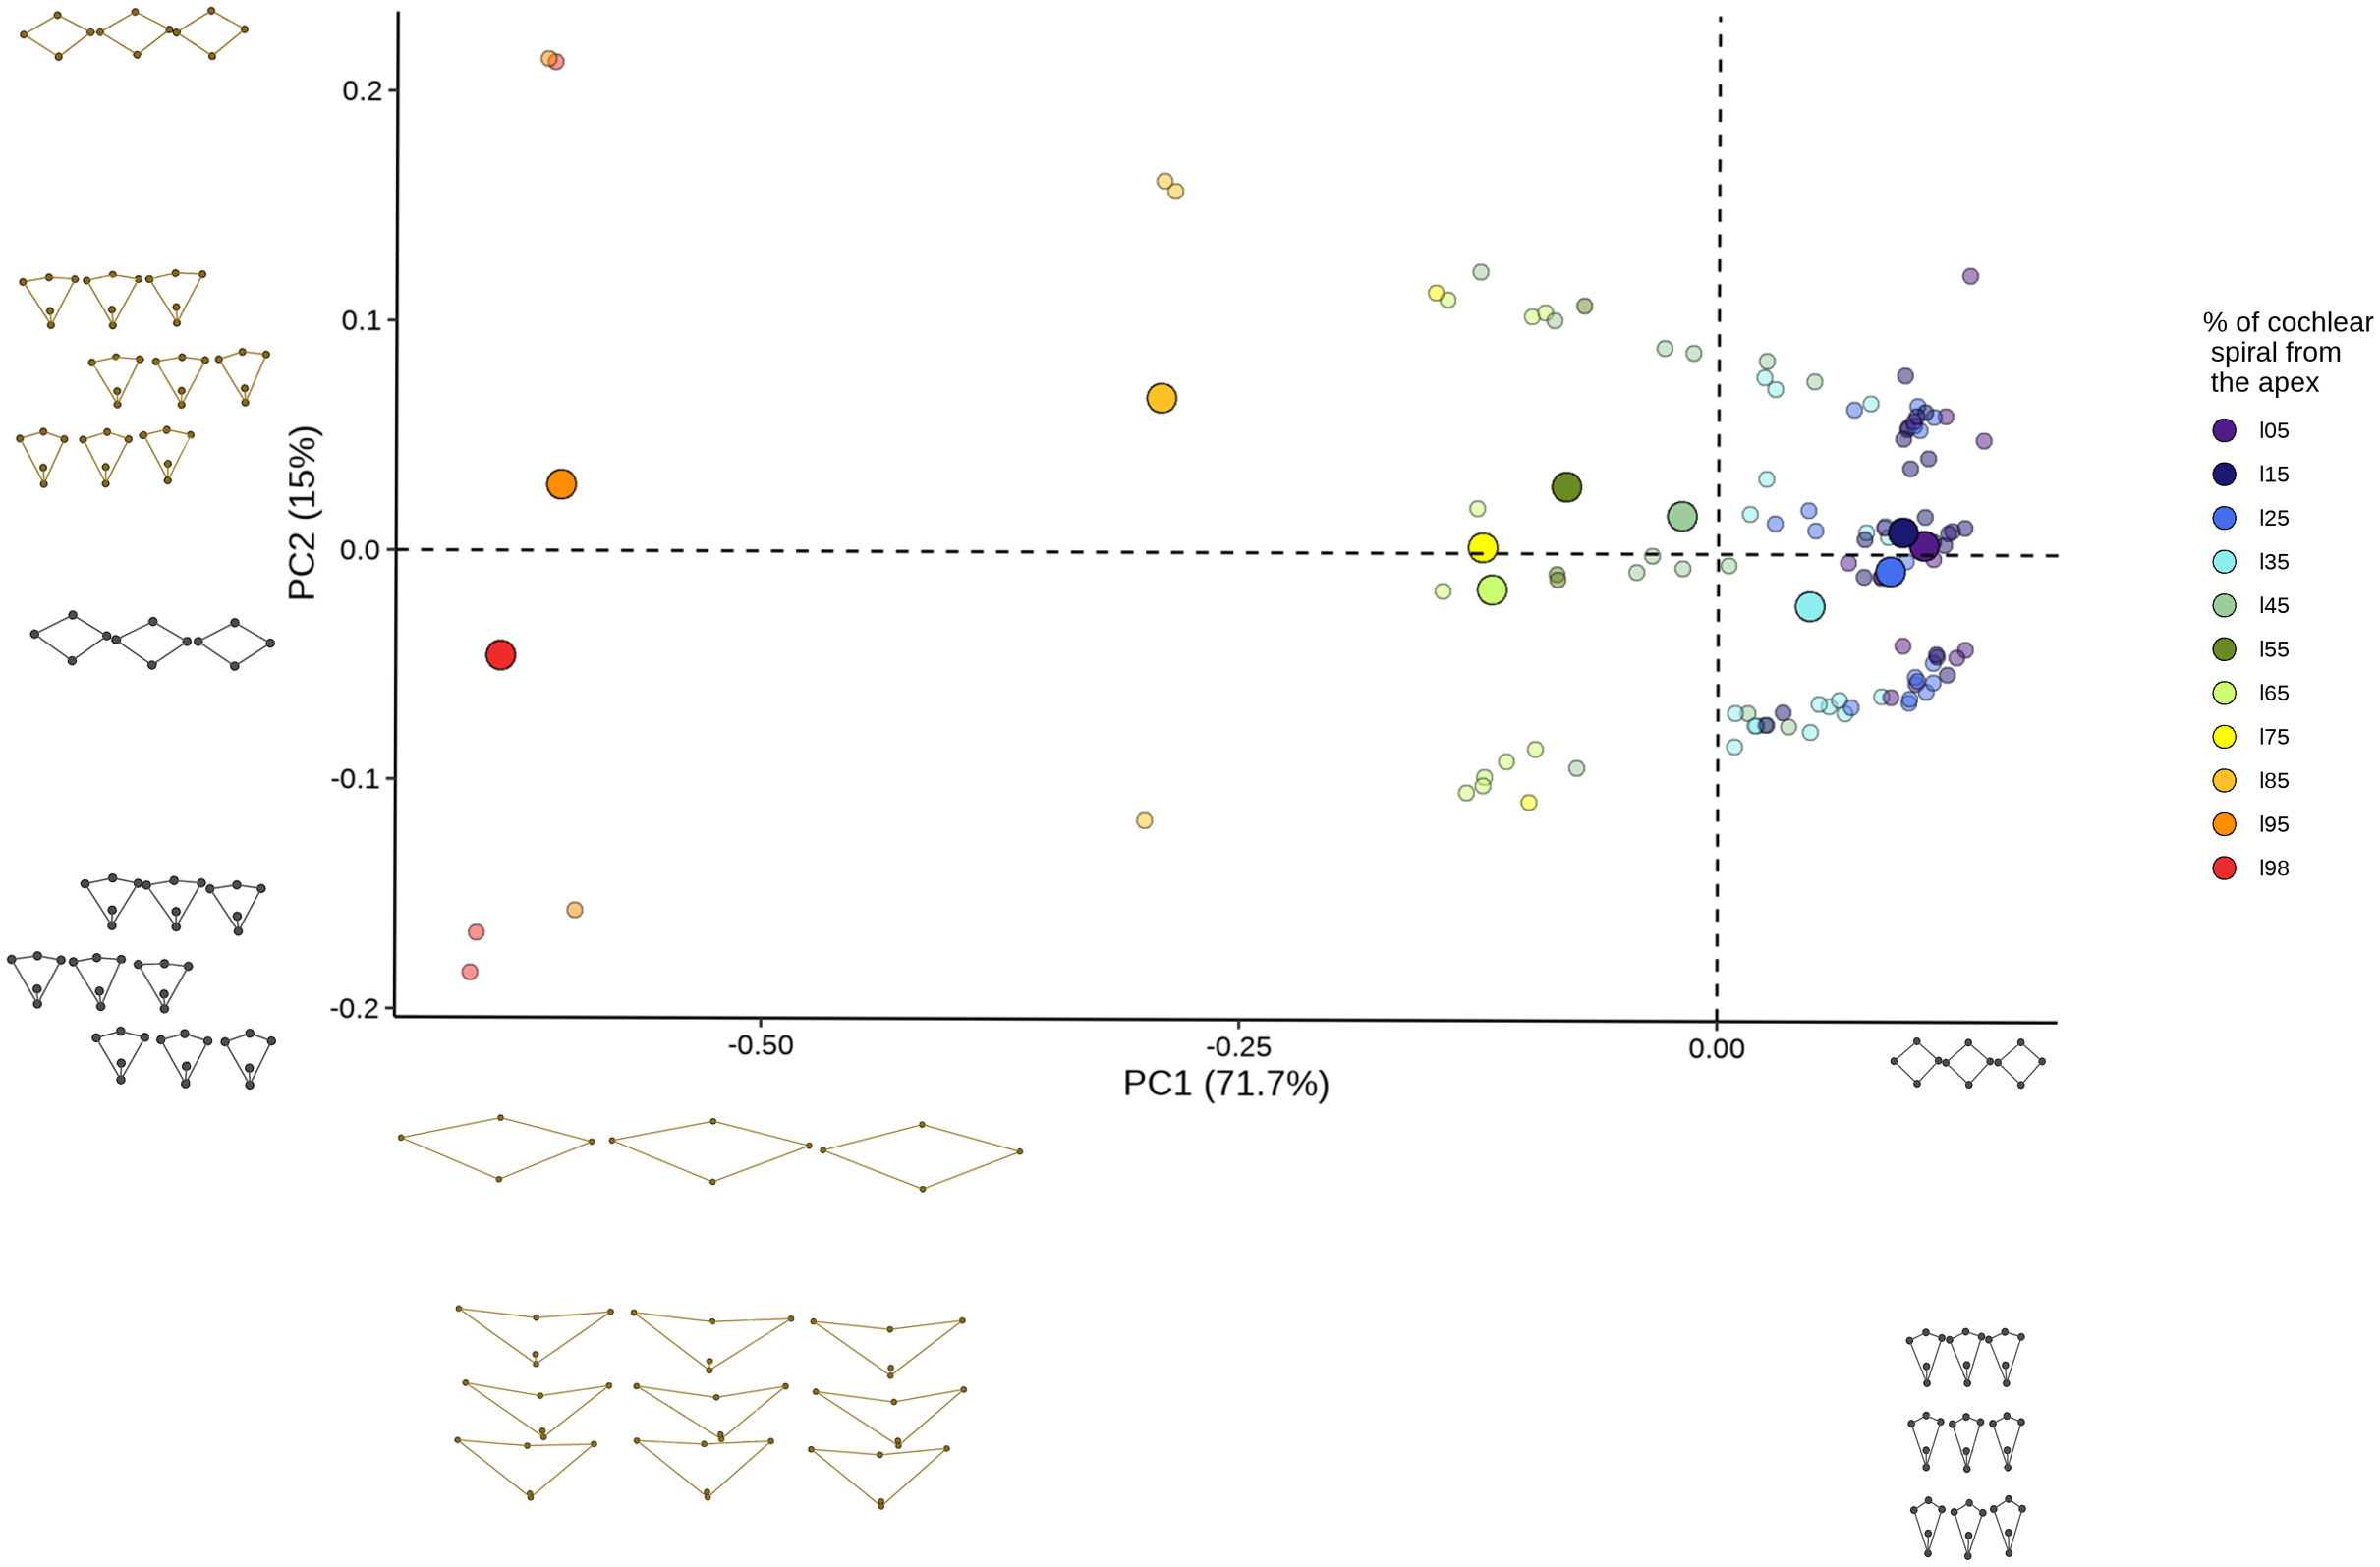
Figure 8 Principal component analysis explaining cell block shape variation. Scatter patterns are shown according to their position in the cochlear spiral. The plots of the minimum (black) and maximum (brown) values of principal component 1 (x axis) and principal component 2 (y axis) are shown with the axes.
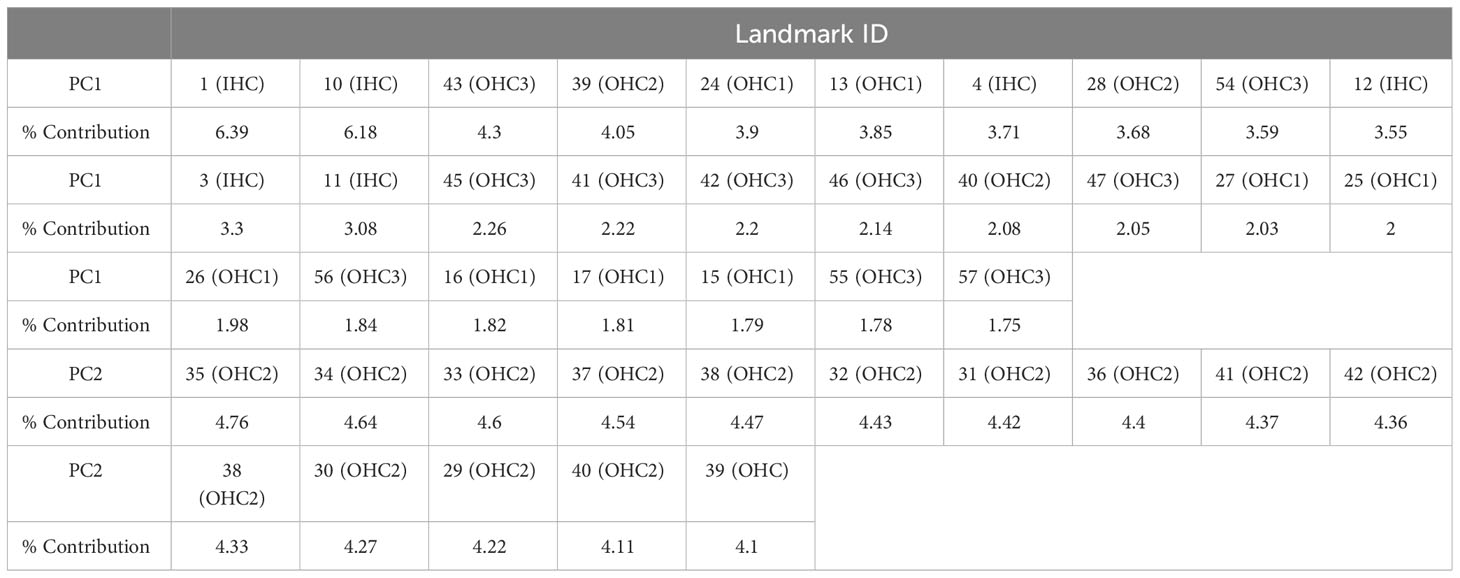
Table 5 Contribution percentage from each landmark of principal components 1 and 2.
The k-medoid clustering analysis of the first five PCs revealed six clusters (Figure 9A). These clusters were associated with their location in the cochlear spiral, as they contained closed locations. Clusters 1 and 2 showed an overlap of data where the locations included the apex region and up to 45% of the cochlear spiral location (Figure 9B).
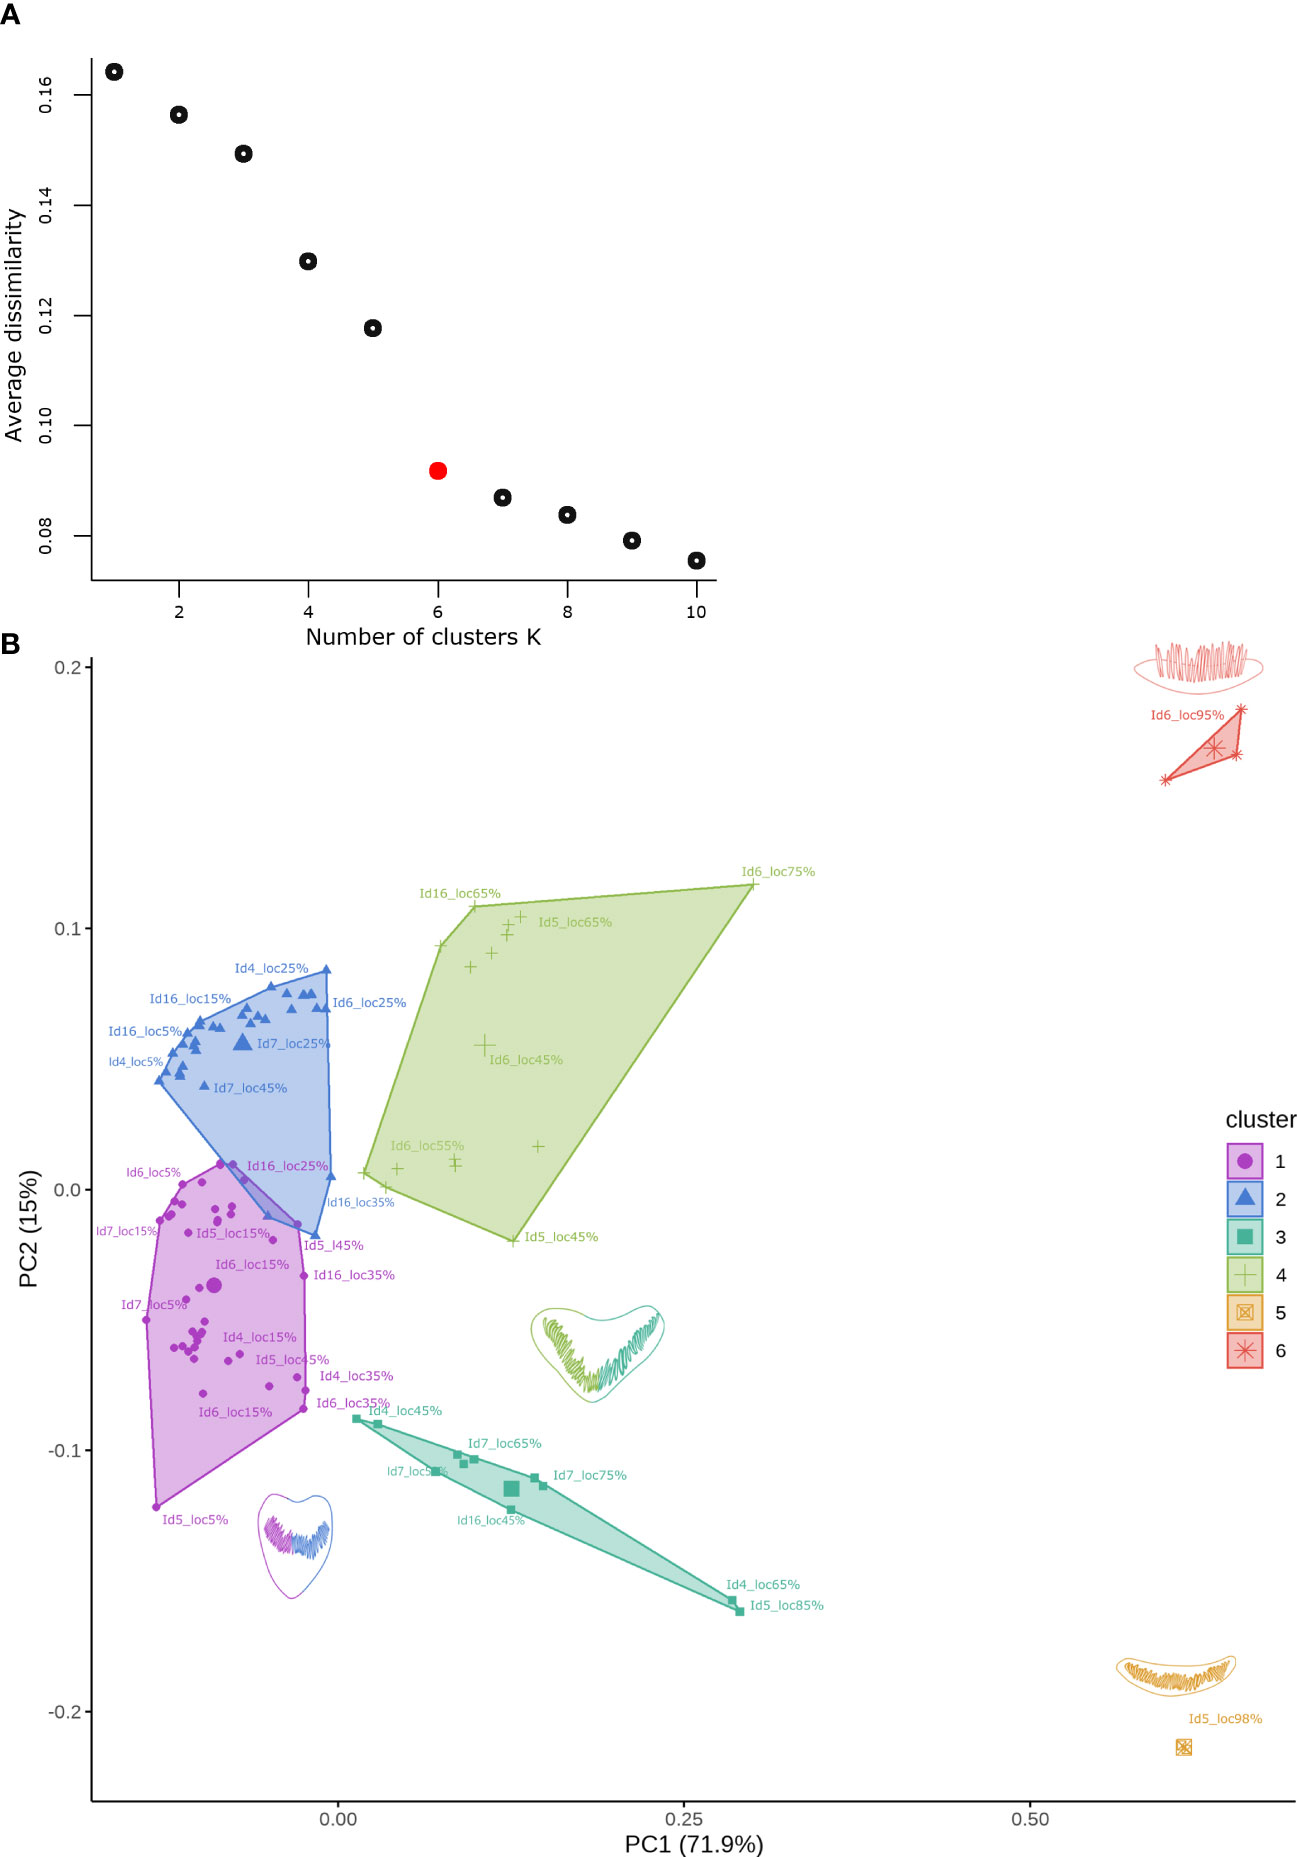
Figure 9 (A) Saturation plot showing the change in mean dissimilarity within each group concerning the number of clusters (k) for the data set obtained from the first 5 PCs. The red point indicates the best number of medoids for k-medoids clustering. (B) Cluster analysis by k-medoids identified for the data set from the first 5 PCs. The shape of the cells is associated with a particular color for each cluster, cells represented by two colors show similar changes in shape for later locations from apex to base in the cochlear spiral.
The clustering patterns associated with the observed cochlear spiral location were analyzed with a Procrustes ANOVA. This analysis showed significant differences in shape change relative to cochlear spiral location (F= 25.936, p= 1e-05).
Finally, a comparison of the two-block configuration (IHCs and OHCs) was performed to observe covariation trends between the two sensory cell types. The two-block partial least squares (2BPLS) and modularity analyses showed a trend of integration as the change is corresponding to each other. This indicates that the shape of the OHCs and IHCs changes in a similar and integrative way. In the 2BPLS analysis results, the first single value explains 99.8% of the total significant covariance between IHCs and OHCs (CR= 0.987, p= 0.001). Furthermore, the modularity hypothesis reaffirmed the integration observed in 2BPLS since a partitioning of the modules according to the shape variation in the cells was observed (CV= 0.99, p = 0.05) (Figure 10).
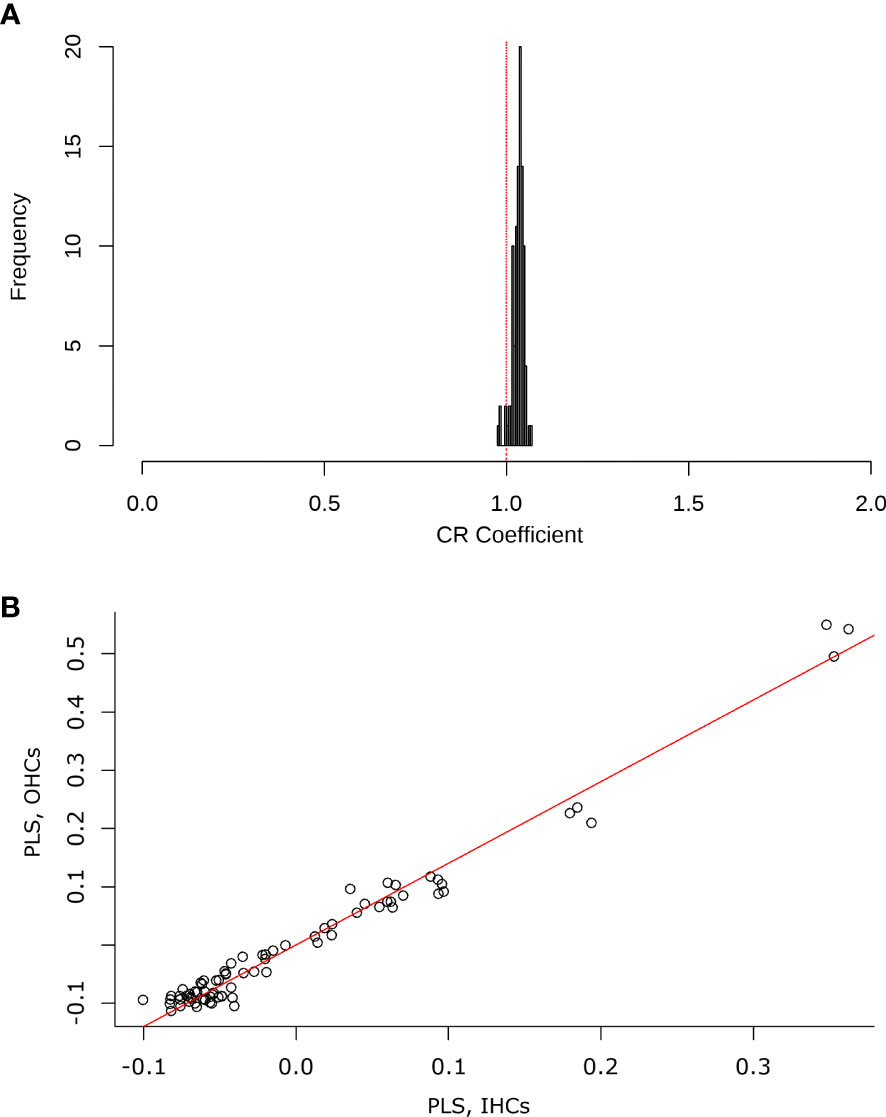
Figure 10 (A) Histogram contrasting the selected modularity hypothesis (inner hair cells, IHCs and outer hair cells) against random combinations of modules in the test configuration. The red line indicates the covariation coefficient (CR) close to 1, which explains a tendency for the OHCs and IHCs to change in the same way. (B) The graph shows the results of the 2BPLS analysis, where an integration trend is observed. There is a relationship for some shapes of the IHCs with the variation of the shape of the OHCs.
4 Discussion
4.1 Cochlear length and cell density
Cochlear length was similar in all subjects. The observed variation of 4.6 mm, relative to mean length of 27.7 mm, was not associated with the life stage of the seals (Table 3). Ontogenetic studies have demonstrated that the cells that contribute to the organ of Corti are already present and postmitotic at the embryonic stage in mammals (Ruben, 1967; McKenzie et al., 2004). There is a post-birth maturation process of the organ of Corti in some species that includes the first few days (Burda, 1985; Burda and Branis, 1988; Roth, 1992). Nevertheless, studies of harbor porpoises (Phocoena phocoena) indicate the hearing abilities of neonates are comparable to adult individuals (Wahlberg et al., 2017). However, there is no information on postnatal changes in the organ of Corti or hearing abilities in pinnipeds. Records of inter-individual variation in the same species are a phenomenon present and sometimes related to different areas of residence (Avci et al., 2014; Ekdale and Racicot, 2015; Schnitzler et al., 2017).
The number of turns estimated from our samples that preserved the cochlea in its entirety was consistent with previous studies of pinniped species (Solntseva, 2001; Manoussaki et al., 2008), where 2.5 turns are observed in the cochlear spiral.
Decreasing OHC density along the cochlear spiral was found from the apex area (19 cells/100 µm) to the 85% location (10 cells/100 µm). This decreasing trend in cell density with proximity to the spiral base is consistent with observations for other mammalian species and is associated with changes in OHC morphology depending on location in the cochlear spiral (Úlehlová et al., 1987; Burda and Branis, 1988; Vater and Kössl, 2011; Girdlestone et al., 2017). In Ind5A, a peak of increased cell number was found at the 95% location of the cochlear spiral. As this was the only sample with complete information for estimation at the very basal end, this change could be associated with either inter-individual variability or variation in the nearest region of the cochlear hook, as previously described by Thorne and Gavin (1984).
4.2 Linear morphometrics
Morphological characteristics of the sensory cells in the organ of Corti showed typical trends of increase and decrease with position. Increased variability at the 10% location is likely due to the recording of only one sample analyzed in this region. From apex to base, the width, opening angle and distance between the stereociliary bundle tips of the OHCs increase. In contrast, the distance between the rows of sensory cells and the width of the reticular lamina decrease with proximity to the base. The only parameter that did not show predictable changes along the cochlear spiral is the width of the distance between the OHCs. Previous studies of mammalian cochleae evaluated using scanning electron microscopy suggest that, despite some tissue shrinkage due to tissue preparation, the parameters considered for analysis for morphometry are accurately represented, as tissue handling effects are homogeneous throughout the spiral (Edge et al., 1998; Ciganović et al., 2017). Thus, these results are unlikely to be explained by artefacts of the methodology.
The results for width of the reticular lamina and distances between hair cell rows showed a significant decrease from apex to base (Figure 5A). This decreasing pattern and the values obtained coincide with previous studies of the organ of Corti in mammals (Lim, 1986; Roth et al., 1992; Girdlestone et al., 2017).
Cell width showed an opposite pattern, with significant values increasing from apex to base (Figure 5). As the width of the cells increased, their stereociliary bundles- inner angle and the distance between the stereociliary bundle tips increased accordingly. These changes are likely due to the change in cell morphology depending on their location in the cochlear spiral. These variations suggest an association with the tonotopic organization of the hair cells. Furthermore, it has been described that the obtained range of the angular aperture minimizes the resistance of the fluid dynamics involved (Ciganović et al., 2017).
The arrangement of the sensory cells of the organ of Corti differed more in the cells located at the apex compared to the base, as showed by the identification of significant differences found at distant locations by pairwise comparisons across all measures. These morphological changes found could be associated with the auditory perception of the cells according to their location in the spiral cochlear. Postnatal changes in the sensory cells of the organ of Corti have been identified in rodent species (Kaltenbach and Falzarano, 1994). However, in pinnipeds, there is no evidence of such changes. Furthermore, the results observed for each morphometric measure show similar mean distances and trends between neonates and adults (Figures 5C2, D2). These results could be associated with the fully developed hearing ability after birth in some marine mammal species (Nachtigall et al., 2005; Wahlberg et al., 2017).
Morphometric measurements were not apparently affected by the difference between sample processing times. This was verified by reference images taken of the Ind6B sample that was processed shortly after fixation. Measurements of all morphometric parameters of the Ind6B sample were compared between images five years apart in the same area and there were no differences. In addition, the results in the measurements of the morphometric parameters of the cochlea of Ind6B were within the ranges established by the other four samples. There was no evidence of any outliers derived from processing and analysis times of our samples.
4.3 Geometric morphometrics
The measured parameters for individual sensory cells showed changes associated with their location in the cochlear spiral. The information generated from linear analysis was complemented with geometric morphometry analyses. Since GM considers changes in hair cell morphology independent of variation caused by size, rotation, and orientation of the samples (Rohlf and Marcus, 1993; Mitteroecker and Gunz, 2009).
The results observed after Procrustes fit of the geometric data reveal obvious variation in the shape of the cell blocks within the organ of Corti according to position in the cochlear spiral, even before performing any statistical analysis, as depicted in Figure 7. This first approximation suggests an association between the tonotopic organization of the sensory cells of the organ of Corti and their spatial configuration.
Although the Procrustes adjustment reduces the isometric effects of size on cell block shape, the allometric component is still present in these tissue samples. Allometry can manifest between individuals of the same population and age group (static allometry), during growth (ontogenetic allometry), and between species (evolutionary allometry) (Cheverud, 1982). Failure to assess size effects when analyzing cell configurations may lead to erroneous conclusions as size can explain a large percentage of this variation (Outomuro and Johansson, 2017). Given this premise, we assessed the extent to which size (centroid size) contributed to the observed variation in structure (Procrustes coordinates) observed (Adams et al., 2013). The results indicated an independency of size in our results.
Since trends in hair cell morphology were not influenced by the allometric component, a Procrustes ANOVA analysis with the clustering factor of location was performed to determine the influence of spiral placement on the results. Procrustes ANOVA generates inferences based on permutations and does not assume multivariate normality, so it can be applied to our biological data on shape in the hair cells of the organ of Corti. Also, when working with permutations the test accepts that the number of variables, in this case, Procrustes coordinates, is greater than the number of samples (Theska et al., 2020). This evaluation revealed a significant influence of location within the cochlear spiral on cell block configuration spiral, supporting the observations identified and the data obtained by linear morphometry.
An overlap of the data associated with adjacent positions on the cochlear spiral was apparent in our first visualization of the data across the principal component analyses (Figure 8). This trend supported the importance of the location variable in the cochlear spiral and further identifies that the overlapping points are associated with closed locations in the cochlear spiral. Since these variations in cell block configuration corresponded to 57.9% of the OHCs (landmarks 13-57) in both principal components, it highlights that OHCs show greater morphological variation in the cochlear spiral.
Suspected groups from the PCA (overlapping data) can be identified by clustering. The clustering approach allowed us to identify six clusters in the morphospace data from the geometric analyses. This analysis reveals the existence of clusters that share similarities in hair cell morphology related to their location in the cochlear spiral without previously assuming the location variable as a grouping factor. The hair cell morphology trend continued to show an association with their tonotopic organization, as previously described in mustached bats Pternonotus parnellii (Girdlestone et al., 2020). The clusters that were visualized in the PCA were identified using k-means clustering analysis. This method is based on the use of the actual points (not averaged as in the k-means method) for cluster generation by dissimilarity plotting (Maechler et al., 2012; Jin and Han, 2017).
The relationship found in the shape change of the two hair cell types (IHCs and OHCs) in the organ of Corti through 2BPLS analysis and testing of the modularity hypothesis reflected a trend of integration, that is, the two types of sensory cells had similar characteristics in their morphological variation. Here, a trend of partitive change (modularity) between the segments (OHCs and IHCs) of the configuration was expected, due to the functional variability realized by the two cell types. Although hair cells show morphological changes in their structures related to the function they perform (Lim, 1986), these results indicate the sensory cell types possess similar variations in their morphology. This trend could be associated with two factors. First, although the IHCs and OHCs have different functions, they are both involved in the process of hearing and share morphological characteristics. They are specialized structures with stereocilia on their surface, a complex internal structure, and basal ends that are in contact with afferent and efferent nerve fiber terminals (Engström and Engström, 1972). Furthermore, IHCs and OHCs are derived from the same embryonic progenitors, demonstrating a common origin (Wu and Kelley, 2012). On the other hand, our findings indicating integration in the shape of IHCs and OHCs in harbor seals may be influenced by the small number of individuals examined (Klingenberg and Marugán-Lobón, 2013). This is the first description of cell shape covariation is made, not only through measurement inferences, but also in linear morphometry in the two sensitive cell types of the organ of Corti by modularity and two-block partial least squares analysis. Increasing sample sizes and species for which similar data are available would reinforce this conclusion about the trend towards integration.
In summary, morphometric analysis makes it possible to associate the change in the specific measurements and the general morphology of the cell with its location in the cochlear spiral. It was observed that, from apex to base, the rows of cells were closer together. In addition, their opening angle and the distance between the OHCs increased, i.e. the overall shape of the cells widened, resembling more of a V-shape at the apex to a parabola shape at the base.
This first ultrastructural description of the organ of Corti in harbor seals will support the eventual development of an accurate frequency place map (i.e., distribution of frequencies along the cochlear spiral) for this species. From an applied perspective, if the distribution of audible frequencies along the cochlear spiral is known and a lesion is found, it may be possible to identify the portion of hearing range that is impaired. In addition, in case of noise-induced hearing loss, it should be possible to extrapolate the frequency characteristics of the source from the placement damage in the sensory epithelium. Such tools, based on knowledge of inner ear structures, will improve our understanding of the potential effects of underwater anthropogenic noise on hearing on species such as harbor seals. This insight may ultimately guide exploration of the hearing sense in species for which no hearing measurements are available.
5 Conclusion
The linear and geometric morphometric descriptions of the sensory cells of the inner ear of harbor seals presented in this study show predictable trends from apex to base, with significant influence of placement within the cochlear spiral on cell shape and configuration. This morphological description provides baseline information and an initial step towards correlating morphometrics with sound frequency coding along the spiral of the inner ear in marine mammal species.
Data availability statement
The raw data supporting the conclusions of this article will be made available by the authors, without undue reservation.
Ethics statement
Ethical approval was not required for the study involving animals in accordance with the local legislation and institutional requirements because the animals were not sacrificed for this study. The harbor seals were humanely euthanized by certified veterinarians for medical reasons.
Author contributions
LR did the measurements and statistical analysis. MM performed the majority of ear collections, conducted inner ear dissection, and performed all imaging. MH, CR provided the samples for this study. BB supervised the scanning electron imaging. LR, MH, CR, JS, BB, AL, OR, US, and MM helped with writing and editing the manuscript. AL, OR, US and MM supervised the work and its publication. US and LR acquired the funding. All authors contributed to the article and approved the submitted version.
Funding
This study was funded by CONACYT Nacional Scholarship postgraduate No. 759650, and was part of the SATURN project, which has received funding from the European Union’s Horizon 2020 research and innovation programme under grant agreement No 101006443. This Open Access publication was funded by the Deutsche Forschungsgemeinschaft (DFG, German Research Foundation) - 491094227 “Open Access Publication Funding” and the University of Veterinary Medicine Hannover, Foundation.
Acknowledgments
We thank Imke Fiedler (University Medical Center Hamburg-Eppendorf) for technical assistance, Dr. Jillian Sills from the University of California Santa Cruz who arranged for transfer of materials, Dr. Marcia Ramirez Rodriguez from the National Autonomous University of Mexico for the helpful comments with geometric morphometrics, Dr. Pádraig Duignan from The Marine Mammal Center who carefully extracted and prepared the ears of seal 16 and Dr. Stephen Raverty from the Animal Health Center for performing the full post-mortem examinations of seals 4-7 and providing the heads for ear removal and fixation.
Conflict of interest
The authors declare that the research was conducted in the absence of any commercial or financial relationships that could be construed as a potential conflict of interest.
Publisher’s note
All claims expressed in this article are solely those of the authors and do not necessarily represent those of their affiliated organizations, or those of the publisher, the editors and the reviewers. Any product that may be evaluated in this article, or claim that may be made by its manufacturer, is not guaranteed or endorsed by the publisher.
References
Adams D. C., Otárola-Castillo E. (2013). Geomorph: an R package for the collection and analysis of geometric morphometric shape data. Methods Ecol. Evol. 4 (4), 393–399. doi: 10.1111/2041-210X.12035
Adams D. C., Rohlf F. J., Slice D. E. (2004). Geometric morphometrics: ten years of progress following the “revolution”. Ital. J. Zool. 71, 5–16. doi: 10.1080/11250000409356545
Adams D. C., Rohlf F. J., Slice D. E. (2013). A field comes of age: geometric morphometrics in the 21st century. Hystrix 24 (1), 7.
Avci E., Nauwelaers T., Lenarz T., Hamacher V., Kral A. (2014). Variations in microanatomy of the human cochlea. J. Comp. Neurol. 522 (14), 3245–3261. doi: 10.1002/cne.23594
Billet G., Hautier L., Lebrun R. (2015). Morphological diversity of the bony labyrinth (inner ear) in extant xenarthrans and its relation to phylogeny. J. Mammal. 96 (4), 658–672. doi: 10.1093/jmammal/gyv074
Burda H. (1985). Qualitative assessment of postnatal maturation of the organ of Corti in two rat strains. Hear. Res. 17 (3), 201–208. doi: 10.1016/0378-5955(85)90064-4
Burda H., Branis M. (1988). Postnatal development of the organ of Corti in the wild house mouse, laboratory mouse, and their hybrid. Hear. Res. 36 (1), 97–105. doi: 10.1016/0378-5955(88)90140-2
Callis G., Sterchi D. (1998). Decalcification of bone: literature review and practical study of various decalcifying agents. Methods, and their effects on bone histology. J. Histotechnol. 21 (1), 49–58. doi: 10.1179/his.1998.21.1.49
Cheverud J. M. (1982). Relationships among ontogenetic, static, and evolutionary allometry. Am. J. Phys. Anthropol. 59, 139–149. doi: 10.1002/ajpa.1330590204
Ciganović N., Wolde-Kidan A., Reichenbach T. (2017). Hair bundles of cochlear outer hair cells are shaped to minimize their fluid-dynamic resistance. Sci. Rep. 7 (1), 1–9. doi: 10.1038/s41598-017-03773-y
Cunningham K. A., Reichmuth C. (2016). High-frequency hearing in seals and sea lions. Hear. Res. 331, 83–91. doi: 10.1016/j.heares.2015.10.002
Dallos P. (1992). The active cochlea. J. Neurosci. 12 (12), 4575–4585. doi: 10.1523/JNEUROSCI.12-12-04575.1992
Edge R. M., Evans B. N., Pearce M., Richter C. P., Hu X., Dallos P. (1998). Morphology of the unfixed cochlea. Hear. Res. 124 (1-2), 1–16. doi: 10.1016/S0378-5955(98)00090-2
Ekdale E. G. (2016). Morphological variation among the inner ears of extinct and extant baleen whales (Cetacea: Mysticeti). J. Morphol. 277 (12), 1599–1615. doi: 10.1002/jmor.20610
Ekdale E. G., Racicot R. A. (2015). Anatomical evidence for low frequency sensitivity in an archaeocete whale: comparison of the inner ear of Zygorhiza kochii with that of crown Mysticeti. J. Anat. 226 (1), 22–39. doi: 10.1111/joa.12253
Engström B., Engström H. (1972). Structural and physiological features of the organ of Corti. Audiology 11 (1-2), 6–28. doi: 10.3109/00206097209072578
Girdlestone C. D., Ng J., Kössl M., Caplot A., Shadwick R. E., Morell M. (2020). Correlating cochlear morphometrics from parnell’s mustached bat (Pteronotus parnellii) with hearing. J. Assoc. Res. Otolaryngol. 21 (5), 425–444. doi: 10.1007/s10162-020-00764-1
Girdlestone C. D., Piscitelli-Doshkov M. A., Ostertag S. K., Morell M., Shadwick R. E. (2017). Description of cochlear morphology and hair cell variation in the beluga whale. Arct. Sci. 4 (3), 279–291. doi: 10.1139/AS-2017-0031
Guofu G., Kaiya Z. (1992). “Fiber analysis of the optic and cochlear nerves of small cetaceans,” in Marine mammal sensory systems (Boston, MA: Springer), 39–52. doi: 10.1007/978-1-4615-3406-8_2
Jin X., Han J. (2017). “K-medoids clustering,” in Encyclopedia of Machine Learning and Data Mining. Eds. Sammut C., Webb G. I. (Boston, MA: Springer), 697–700. doi: 10.1007/978-1-4899-7687-1_432
Kaltenbach J. A., Falzarano P. R. (1994). Postnatal development of the hamster cochlea. I. Growth of hair cells and the organ of Corti. J. Comp. Neurol. 340, 87–97. doi: 10.1002/cne.903400107
Kassambara A., Mundt F. (2020). “Factoextra: extract and visualize the results of multivariate data analyses.” in R package version 1.0.7. Available at: https://CRAN.R-project.org/package=factoextra
Kastak D., Schusterman R. J. (1998). Low-frequency amphibious hearing in pinnipeds: Methods, measurements, noise, and ecology. J. Acoust. Soc Am. 103 (4), 2216–2228. doi: 10.1121/1.421367
Kastelein R. A., Wensveen P., Hoek L., Terhune J. M. (2009). Underwater hearing sensitivity of harbor seals (Phoca vitulina) for narrow noise bands between 0.2 and 80 kHz. J. Acoust. Soc Am. 126 (1), 476–483. doi: 10.1121/1.3132522
Ketten D. R. (2012). “Marine mammal auditory system noise impacts: Evidence and incidence,” in The effects of noise on aquatic life (New York, NY: Springer), 207–212. doi: 10.1007/978-1-4419-7311-5_46
Ketten D. R., Simmons J. A., Riquimaroux H., Simmons A. M. (2021). Functional analyses of peripheral auditory system adaptations for echolocation in air vs. water. Front. Ecol. Evol. 9, 661216. doi: 10.3389/fevo.2021.661216
Klingenberg C. P., Marugán-Lobón J. (2013). Evolutionary covariation in geometric morphometric data: analyzing integration, modularity, and allometry in a phylogenetic context. Syst. Biol. 62 (4), 591–610. doi: 10.1093/sysbio/syt025
Lim D. J. (1980). Cochlear anatomy related to cochlear micromechanics. A review. J. Acoust. Soc Am. 67 (5), 1686–1695. doi: 10.1121/1.384295
Lim D. J. (1986). Functional structure of the organ of Corti: A review. Hear. Res. 22 (1-3), 117–146. doi: 10.1016/0378-5955(86)90089-4
Maechler M., Rousseeuw P., Struyf A., Hubert M., Hornik K. (2012). “Cluster: cluster analysis basics and extensions,” in R package version, vol. 1. , 56.
Maechler M., Struyf A., Hubert M., Hornik K., Studer M., Roudier P. (2019). Finding groups in data: Cluster analysis extended Rousseeuw et al. R package version 20 (0), 242–248.
Manoussaki D., Chadwick R. S., Ketten D. R., Arruda J., Dimitriadis E. K., O'Malley J. T., et al. (2008). The influence of cochlear shape on low-frequency hearing. Proc. Natl. Acad. Sci. U.S.A. 105 (16), 6162–6166. doi: 10.1073/pnas.0710037105
Martins M. C. I., Park T., Racicot R., Cooper N. (2020). Intraspecific variation in the cochleae of harbour porpoises (Phocoena phocoena) and its implications for comparative studies across odontocetes. PeerJ 8, e8916. doi: 10.7717/peerj.8916
McKenzie E., Krupin A., Kelley M. W. (2004). Cellular growth and rearrangement during the development of the mamMalian organ of Corti. Dev. Dyn. 229 (4), 802–812. doi: 10.1002/dvdy.10500
Mitteroecker P., Gunz P. (2009). Advances in geometric morphometrics. Evol. Biol. 36, 235–247. doi: 10.1007/s11692-009-9055-x
Morell M., Brownlow A., McGovern B., Raverty S. A., Shadwick R. E., André M., et al. (2017). Implementation of a method to visualize noise-induced hearing loss in mass stranded cetaceans. Sci. Rep. 7 (1), 1–8. doi: 10.1038/srep41848
Morell M., Degollada E., Alonso J. M., Jauniaux T., Andre M. (2009). Decalcifying odontocete ears following a routine protocol with RDO®. J. Exp. Mar. Biol. Ecol. 376, 55–58. doi: 10.1016/j.jembe.2009.05.005
Morell M., IJsseldijk L. L., Berends A. J., Gröne A., Siebert U., Raverty S. A., et al. (2021). Evidence of hearing loss and unrelated toxoplasmosis in a free-ranging harbour porpoise (Phocoena phocoena). Animals 11 (11), 3058. doi: 10.3390/ani11113058
Morell M., IJsseldijk L. L., Piscitelli-Doshkov M., Ostertag S., Estrade V., Haulena M., et al. (2022a). Cochlear apical morphology in toothed whales: Using the pairing hair cell—Deiters' cell as a marker to detect lesions. Anatomical Rec. 305 (3), 622–642. doi: 10.1002/ar.24680
Morell M., Lenoir M., Shadwick R. E., Jauniaux T., Dabin W., Begeman L., et al. (2015). Ultrastructure of the odontocete organ of Corti: Scanning and transmission electron microscopy. J. Comp. Neurol. 523 (3), 431–448. doi: 10.1002/cne.23688
Morell M., Rojas L., Haulena M., Busse B., Siebert U., Shadwick R. E., et al. (2022b). Selective inner hair cell loss in a neonate harbor seal (Phoca vitulina). Animals 12 (2), 180. doi: 10.3390/ani12020180
Nachtigall P. E., Yuen M. M., Mooney T. A., Taylor K. A. (2005). Hearing measurements from a stranded infant Risso's dolphin, Grampus griseus. J. Exp. Biol. 208 (21), 4181–4188. doi: 10.1242/jeb.01876
Outomuro D., Johansson F. (2017). A potential pitfall in studies of biological shape: does size matter? J. Anim. Ecol. 86 (6), 1447–1457. doi: 10.1111/1365-2656.12732
Ramprashad F., Corey S., Ronald K. (1972). Anatomy of the seal’s ear (Pagophilus groenlandicus) (Erxleben 1777). Funct. Anat. Mar. mammals 1, 264–305. doi: 10.1139/z77-025
Raphael Y., Altschuler R. A. (2003). Structure and innervation of the cochlea. Brain Res. Bull. 60 (5-6), 397–422. doi: 10.1016/S0361-9230(03)00047-9
Rasband W. S. (1997-2018). ImageJ, (Bethesda, Maryland, USA: U. S. National Institutes of Health). Available at: https://imagej.nih.gov/ij/.
R Core Team (2020). R: A language and environment for statistical computing (Vienna, Austria: R Foundation for Statistical Computing). Available at: https://www.R-project.org/.
Reichmuth C., Holt M. M., Mulsow J., Sills J. M., Southall B. L. (2013). Comparative assessment of amphibious hearing in pinnipeds. J. Comp. Physiol. A 199 (6), 491–507. doi: 10.1007/s00359-013-0813-y
Rohlf F. J. (2021). “TpsDig Version: 1.40,” in Ecology and Evolution, SUNY at Stony Brook. Ed. Rohlf F. J. (State University of New York at Stony Brook).
Rohlf F. J. (2022). “Tps Utility program Version: 1.29,” in Ecology and Evolution, SUNY at Stony Brook (State University of New York at Stony Brook).
Rohlf F. J., Marcus L. F. (1993). A revolution in morphometrics. Trends Ecol. Evol. 8, 129–132. doi: 10.1016/0169-5347(93)90024-J
Rohlf F. J., Slice D. E. (1990). Extensions of the Procrustes method for the optimal superimposition of landmarks. Syst. Zool. 39, 40–59. doi: 10.2307/2992207
Rohner S., Morell M., Wohlsein P., Stürznickel J., Reiter E. B., Jahnke A., et al. (2022). Fatal aspergillosis and evidence of unrelated hearing loss in a harbor porpoise (Phocoena phocoena) from the German Baltic Sea. Front. Mar. Sci. 9, 958019. doi: 10.3389/fmars.2022.958019
Roth B., Bruns V. (1992). Postnatal development of the rat organ of Corti: II. Hair cell receptors and their supporting elements. Anatomy and embryology 185, 571–581.
Ruben R. J. (1967). Development of the inner ear of the mouse: a radioautographic study of terminal mitoses. Acta Otolaryngol. (Stockh.) 220, 1–44.
Schnitzler J. G., Frédérich B., Früchtnicht S., Schaffeld T., Baltzer J., Ruser A., et al. (2017). Size and shape variations of the bony components of sperm whale cochleae. Sci. Rep. 7 (1), 1–13. doi: 10.1038/srep46734
Sensor J. D., Suydam R., George J. C., Liberman M. C., Lovano D., Rhaganti M. A., et al. (2015). The spiral ganglion and Rosenthal's canal in beluga whales. J. Morp. 276 (12), 1455–1466. doi: 10.1002/jmor.20434
Solntseva G. N. (2001). Comparative analysis of vestibular system development in various groups of mammals living under different environmental conditions. Russ. J. Dev. Biol. 32 (3), 171–174. doi: 10.1023/A:1016659521966
Southall B. L., Schusterman R. J., Kastak D., Reichmuth Kastak C. (2005). Reliability of underwater hearing thresholds in pinnipeds. Acoust. Res. Lett. Online 6 (4), 243–249. doi: 10.1121/1.1985956
Stoessel A., Gunz P., David R., Spoor F. (2016). Comparative anatomy of the middle ear ossicles of extant hominids–Introducing a geometric morphometric protocol. J. Hum. Evol. 91, 1–25. doi: 10.1016/j.jhevol.2015.10.013
Teilmann J., Galatius A. (2018). “Harbor seal: Phoca vitulina,” in Encyclopedia of marine mammals (Elsevier), 451–455. doi: 10.1016/B978-0-12-804327-1.00145-X
Terhune J. M. (1989). Can seals alter the acoustical impedance of the outer and middle ears? Proc. Annu. Meeting Can. Acoustical Assoc., 131–133.
Terhune J. M. (1991). Masked and unmasked pure-tone detection thresholds of a harbor seal listening in air. Can. J. Zool 69 (8):2059–2066. doi: 10.1139/z91-287
Theska T., Sieriebriennikov B., Wighard S. S., Werner M. S., Sommer R. J., et al. (2020). Geometric morphometrics of microscopic animals as exemplified by model nematodes. Nat. Protoc. 15 (8), 2611–2644. doi: 10.1038/s41596-020-0347-z
Thorne P. R., Gavin J. B. (1984). The accuracy of hair cell counts in determining distance and position along the organ of Corti. J. Acoust. Soc Am. 76 (2), 440–442. doi: 10.1121/1.391136
Úlehlová L., Voldřich L., Janisch R. (1987). Correlative study of sensory cell density and cochlear length in humans. Hear. Res. 28 (2-3), 149–151. doi: 10.1016/0378-5955(87)90045-1
Vater M., Kössl M. (2011). Comparative aspects of cochlear functional organization in mammals. Hear. Res. 273 (1-2), 89–99. doi: 10.1016/j.heares.2010.05.018
Von Békésy G., Wever E. G. (1960). Experiments in hearing Vol. 195 (McGraw-Hill New York: McGraw-Hill Book Company, Inc, New York).
Wahlberg M., Delgado-García L., Kristensen J. H. (2017). Precocious hearing in harbour porpoise neonates. J. Comp. Physiol. A. 203 (2), 121–132. doi: 10.1007/s00359-017-1145-0
Welsch U., Riedelsheimer B. (1997). Histophysiological observations on the external auditory meatus, middle, and inner ear of the Weddell seal (Leptonychotes weddelli). J. Morphol. 234 (1), 25–36. doi: 10.1002/(SICI)1097-4687(199710)234:1<25::AID-JMOR3>3.0.CO;2-M
Wever E. G., Mccormick J. G., Palin J., Ridgway S. H. (1971). The cochlea of the dolphin, Tursiops truncatus: Hair cells and ganglion cells. Proc. Natl. Acad. Sci. U.S.A. 68 (12), 2908–2912. doi: 10.1073/pnas.68.12.2908
Wever E. G., McCormick J. G., Palin J., Ridgway S. H. (1972). Cochlear structure in the dolphin, Lagenorhynchus obliquidens. Proc. Natl. Acad. Sci. U.S.A. 69 (3), 657–661. doi: 10.1073/pnas.69.3.657
Wolski L. F., Anderson R. C., Bowles A. E., Yochem P. K. (2003). Measuring hearing in the harbor seal (Phoca vitulina): Comparison of behavioral and auditory brainstem response techniques. J. Acoust. Soc Am. 113 (1), 629–637. doi: 10.1121/1.1527961
Wu D. K., Kelley M. W. (2012). Molecular mechanisms of inner ear development. Cold Spring Harbor Perspect. Biol. 4 (8), a008409. doi: 10.1101/cshperspect.a008409
Yarin Y. M., Lukashkin A. N., Poznyakovskiy A. A., Meißner H., Fleischer M., Baumgart J., et al. (2014). Tonotopic morphometry of the lamina reticularis of the Guinea pig cochlea with associated microstructures and related mechanical implications. J. Assoc. Res. Otolaryngol. 15 (1), 1–11. doi: 10.1007/s10162-013-0420-1
Keywords: inner ear, cochlea, hair cells, pinnipeds, geometric morphometric
Citation: Rojas L, Haulena M, Reichmuth C, Busse B, Ramos-Garduño LA, Rico-Chávez O, Siebert U and Morell M (2023) Ultrastructure of the organ of Corti in harbor seals (Phoca vitulina). Front. Mar. Sci. 10:1211556. doi: 10.3389/fmars.2023.1211556
Received: 24 April 2023; Accepted: 11 August 2023;
Published: 04 September 2023.
Edited by:
Jeremy M. Sullivan, Johns Hopkins University, United StatesReviewed by:
Salvatore Siciliano, Fundação Oswaldo Cruz (Fiocruz), BrazilRandall William Davis, Texas A&M University at Galveston, United States
Copyright © 2023 Rojas, Haulena, Reichmuth, Busse, Ramos-Garduño, Rico-Chávez, Siebert and Morell. This is an open-access article distributed under the terms of the Creative Commons Attribution License (CC BY). The use, distribution or reproduction in other forums is permitted, provided the original author(s) and the copyright owner(s) are credited and that the original publication in this journal is cited, in accordance with accepted academic practice. No use, distribution or reproduction is permitted which does not comply with these terms.
*Correspondence: Maria Morell, bWFyaWEubW9yZWxsQHRpaG8taGFubm92ZXIuZGU=