 Brian R. C. Kennedy
 Randi D. Rotjan
- 1Biology Department, Boston University, Boston, MA, United States
- 2Ocean Discovery League, Saunderstown, RI, United States
- 3Blue Nature Alliance, Arlington, VA, United States
The oceans contain 1,335 million km3 of water covering 361.9 million km2 of seafloor across 71% of the planet. In the past few decades, there has been substantial effort put into mapping and exploring the ocean fueled by the advent of new technologies that more easily enable deepwater access. However, we are still far from achieving our shared goals of a well characterized and documented ocean. In 2010, Webb et al. documented the paucity of deep-sea data in general, with a specific focus on the lack of pelagic records in the Ocean Biogeographic Information System OBIS, which is the largest of the ocean biodiversity archives. While significant exploration progress has been made, the rate of change in the ocean is outstripping the rate of characterization and research. Given the limited resources available, future work needs to be prioritized to focus on areas of greatest need. Here, we investigated several lines of inquiry to determine priority areas for future exploration. We accumulated the largest database of global deep submergence dive records ever compiled and used it, plus OBIS biodiversity records, to assess the level of exploration in different ocean regions. Then, we compared these measures of exploration effort with different biogeographic province schemas and estimates of climate change velocity projections to identify the largest remaining gaps in exploration and research sampling. Given that marine science has only explored between 5 and 20% of the ocean (depending on estimates) in the last hundred and fifty years, future exploration needs to be more targeted to attempt to keep pace with the rate and impact of environmental and biodiversity change in the ocean.
Introduction
We are facing a global crisis of biodiversity (Ceballos et al., 2015; Boyce et al., 2022). More than a million species are known to be at risk for extinction globally (IPBES, 2022), the majority of which reside in marine environments (Mora et al., 2011). Because the ocean is still so underexplored, the need to value and conserve taxa and habitats that we know so little about has been termed a ‘paradox of marine conservation’ (Webb, 2009). A 2006 Science editorial highlighted that biodiversity research was ‘grounded’ in terrestrial environments (Hendriks et al., 2006) with only about 10% of the research published or presented at international biodiversity conferences focused on marine biodiversity, with a similar terrestrial-focus found in related disciplines including conservation biology and macroecology (Raffaelli et al., 2005; Richardson and Poloczanska, 2008). This terrestrial focus logically extends from ease of access; however, it is not representative of our planet. The ocean covers 71% of the planet’s surface and represents nearly 90% of the habitable space (over a billion km3) for multicellular life (Angel, 1993; Kunzig, 2003; Robison, 2004; Robison, 2009). Several efforts have been made to address the knowledge gap in ocean biodiversity research. In the early 2000s, the Census of Marine Life (Ausubel et al., 2010; Ramirez-Llodra et al., 2010) and other projects such as the Marine Biodiversity and Ecosystem Functioning EU Network of Excellence (Heip et al., 2009) made major strides in documenting new species in the ocean. More recently, projects such as the UN Ocean Decade (Ryabinin et al., 2019) and Challenger 150 (Baker et al., 2021) continue to cast a spotlight on gaps, with the goal of filling them. While this mismatch of effort (terrestrial) and habitable area (marine) is a well-known paradox, marine scientists still struggle to close the gap between ocean area and terrestrial research because the ocean is disproportionately large, expensive to study, and historically under characterized.
As the planet faces a rapidly shifting climate (IPBES, 2022) and a biodiversity crisis (Boyce et al., 2022), the lack of knowledge about the biodiversity of our oceans is becoming a problem that is increasingly an issue of global relevance for food security, national security, and international peacekeeping (e.g. Grabarz, 2009; Fedotova et al., 2021; Talukder et al., 2022). The ocean provides a range of globally important ecosystem services (Thurber et al., 2014) including support of fisheries, natural products for medical and industrial chemical processes, regulation of climate and ocean chemistry, providing approximately 50 percent of atmospheric oxygen (Riser and Johnson, 2008) and sequestering 37,000 Gigatonnes of carbon that includes the absorption of ~25% of the carbon aggregately released from the sum total of human activities (Canadell et al., 2007; Sabine and Feely, 2007; Gruber et al., 2019). The biological mechanisms that regulate these processes come from a diversity of organisms, many of which are as-of-yet undescribed or unknown (Mora et al., 2011). These new taxa are not just cryptic invertebrates, but also include large megafauna such as whales and sharks (Weigmann et al., 2020; Rosel et al., 2021).
The ocean is not a monolith. It hosts a wide variety of ecosystems and different habitats that are governed by a range of abiotic and biotic factors such as light input, ocean currents, depth, upwelling, migrations, etc. (Tittensor et al., 2010), all of which contribute to biodiversity. To account for the complexity, numerous attempts have been made to understand the structure of biodiversity of the ocean by defining eco-regions or biogeographic provinces, which continues to be an area of active research (Longhurst, 1985; Longhurst, 2006; Watling et al., 2013; Sutton et al., 2017). The ocean community has not yet reached consensus on a single geodescriptive system, because each has different strengths in characterizing biodiversity patterns by specific depth range or taxa (Longhurst, 1985; Longhurst, 2006; Watling et al., 2013; Costello et al., 2017; Sutton et al., 2017). As such, it remains challenging to point to a specific ecoregion or biogeographic province and infer associated biodiversity estimates, which hinders ocean practitioners from being able to manage, conserve, restore, or predict biodiversity loss/gain at scale.
Webb et al. (2010) quantified the gaps in biodiversity information in the ocean broadly, with a specific focus on pelagic waters using the Ocean Biodiversity System (OBIS) and found significant gaps in biodiversity records across distance from shore, and across depths. Here, we build upon that to document progress (e.g., the change in distribution of OBIS records) in the last decade and to identify remaining areas of priority exploration needs. To accomplish this, we have integrated biogeographic provinces of the ocean with OBIS data to identify the least-characterized areas. Additionally, we compiled a global dataset of deep submergence dive records to build upon the OBIS records to identify the areas of the world’s oceans that are least explored by deep submergence vehicles. Finally, we integrated this information with climate change projections to determine the areas of greatest expected change with lowest number of biodiversity records.
Methods
As a proxy for ocean exploration effort, deep submergence dive locations and depths were collected from 12 institutions globally including: The National Oceanic and Atmospheric Administration’s Office of Ocean Exploration (NOAA-OE), the Hawaii Undersea Research Laboratory (HURL), Ocean Exploration Trust (OET), Harbor Branch Oceanographic Institute (HBOI), Monterey Bay Aquarium Research Institute (MBARI), National Deep-Submergence Facility (NDSF) and the Schmidt Ocean Institute (SOI) from the United States. Outside the United States, records were collected from the Japan Agency for Marine-Earth Science and Technology (JAMSTEC), the French National Institute for Ocean Science (IFREMER), the United Kingdom’s Natural Environment Research Council (NERC), Russian Academy of Sciences, and GEOMAR Helmholtz Centre for Ocean Research Kiel. Attempts to gather additional records from other institutions were made but the authors were unable to obtain them. Records for human-occupied submersibles, remotely operated vehicles, autonomous underwater vehicles, and towed cameras were included in the dataset. Dive locations were accessed through publicly available data portals when possible (NOAA-OE, HURL, OET, NDSF, NERC) or though data requests made to the institutions (MBARI, HBOI, SOI, GEOMAR, IFREMER, JAMSTEC). Records without position data were eliminated from the dataset and records for sites that are not publicly available were rounded to the nearest 0.01 of a degree to protect sensitive site locations.
Biogeographic provinces for different depths were overlaid from the literature as follows: Longhurst provinces were used to describe the surface waters (Longhurst, 2006), accessed from https://www.marineregions.org/ (Flanders Marine Institute, 2019); Sutton et al. (2017) proposed biogeographic provinces for the mesopelagic was accessed via the supplementary information; and Watling et al. (2013) proposal for the lower bathyal and abyssal seafloor was accessed through personal communications with the authors. Ocean biodiversity records were downloaded from the Ocean Biodiversity Information System (OBIS.org database up to date as of 2022-10-22). Detailed definitions of the zones we used can be found in Table 1. It is important to note that we took an inclusive definition of the provinces proposed by Watling et al., 2013 to include the pelagic waters of the same depth ranges because there is so little work on biogeography of the pelagic communities at depth. Additionally, we also combined the Abyssal and Hadal zone for this analysis because of a lack to hadal records/OBIS records that were flagged as terrestrial and those without depth information were excluded from the data set. The total number of OBIS records is 107,390,009. Reduced by nonsensical geographic positioning and negative depths left us with 94,053,712 records. We then removed all records with no depth information, which left us with a total of 58,442,819 records that were used in this study. OBIS records, as well as all four of the biogeographic province schemes noted above, were spatially joined with a global 100 x 100 km grid (Equal Earth Projection) for surface waters (0-200 m), mesopelagic (200-1,000), Bathypelagic (1,000-4,000m), Abyssopelagic (>4,000) using the R package ‘sf’ (Pebesma, 2018). OBIS records for each grid or province were tallied for total number of records, and the number of unique families, genera, and species found in each area. A quartile rank for the number of records was assigned for each 100 km x 100 km grid.
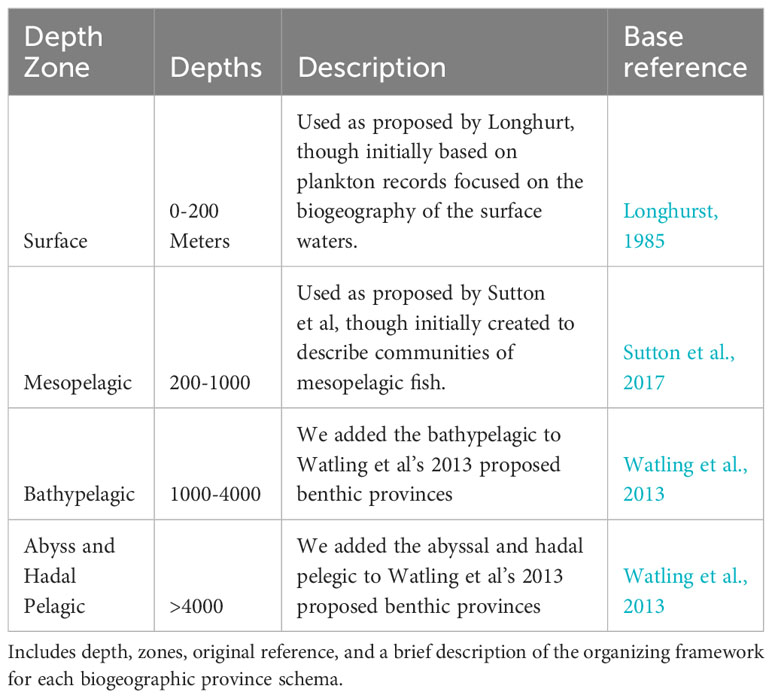
Table 1 Table of Global Marine Biogeographic Provinces used in this study.
Following the methods outlined in (Webb et al., 2010), we used the ETOPO2 30 arcs-second relief model (NOAA National Centers for Environmental Information, 2022) to get ocean depths for each occurrence record. Together, sample depth and bottom depth describe the position in the water column of each record. Prior to analysis, we removed any record with a negative depth. For any record with unreconciled depths (e.g., where the sample depth was greater than the reported depth from ETOPO2), we assumed the record was a benthic one, and thus replaced the bathymetry maximum depth with the sample depth assuming the sample depth is more accurate for that location. We then used global seafloor bathymetry to determine the proportional area of the oceans occurring in each zone, represented by cells (Figure 1). We corrected the number of OBIS records based on the proportional volume of ocean meeting the appropriate criteria for sample depth and ocean depth. A more detailed description of this method can be found in (Webb et al., 2010).
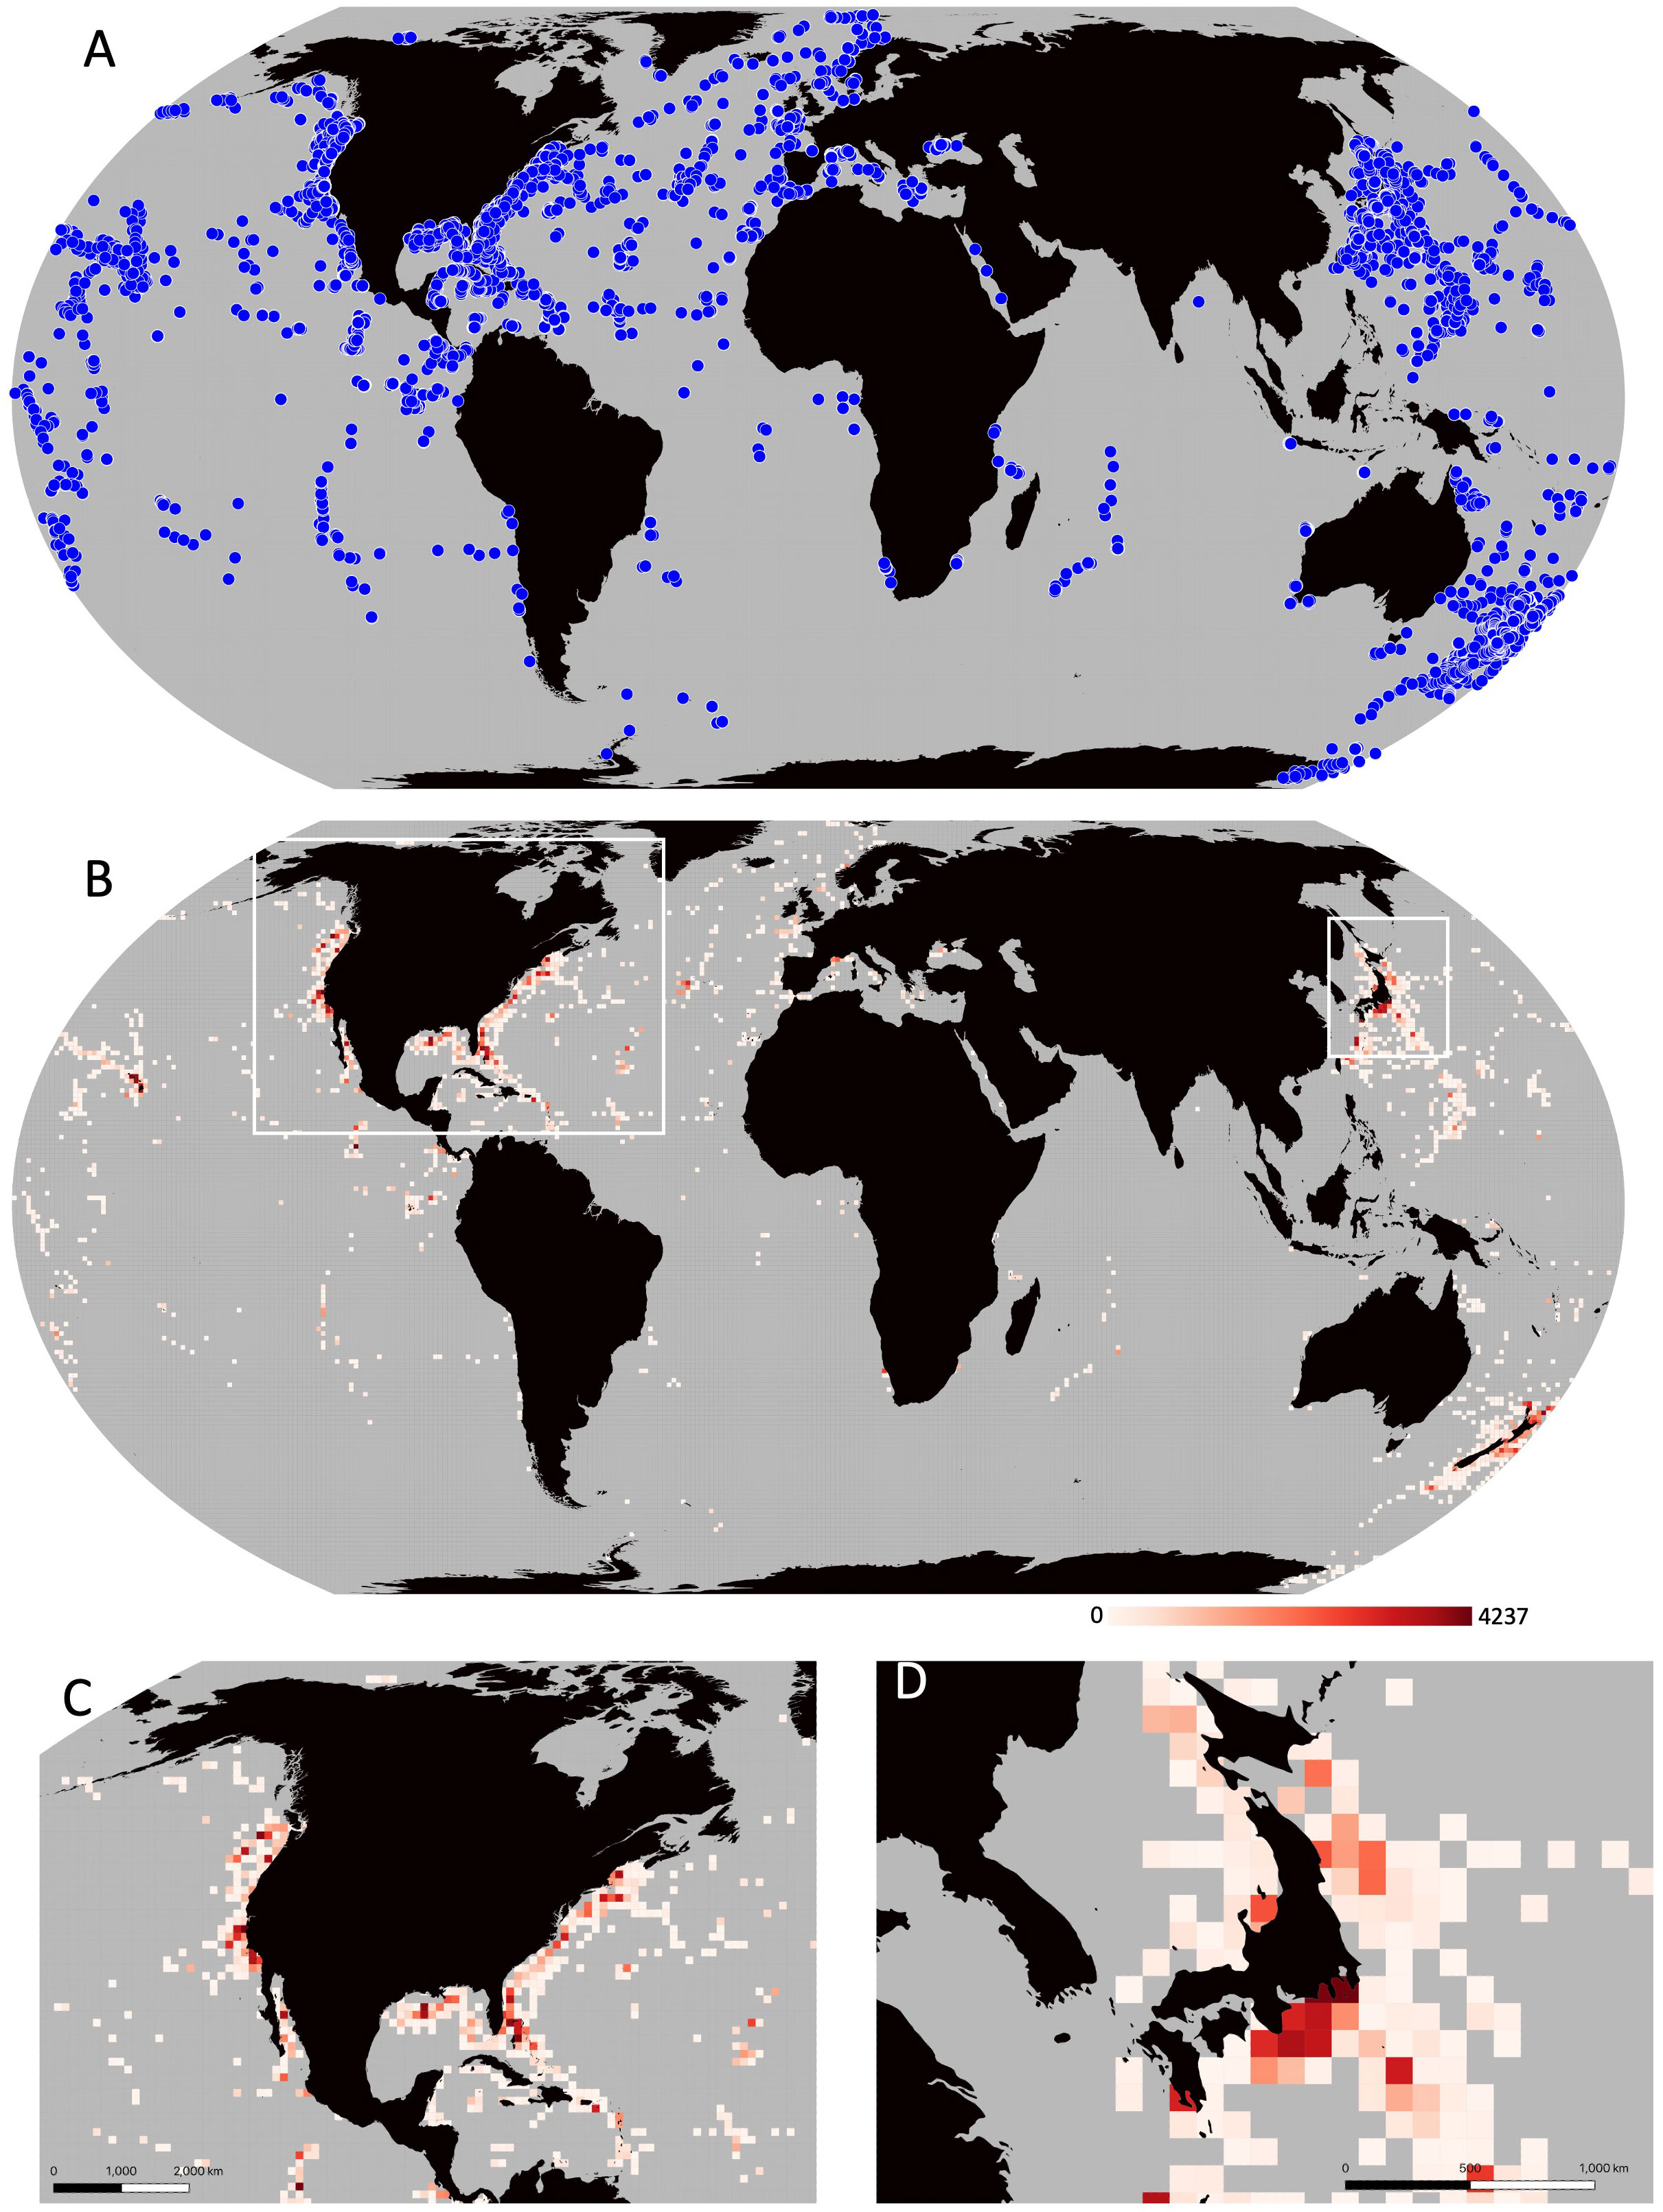
Figure 1 (A) All 35,346 deployment records collected including HOV, ROV, AUV, and towed imaging vehicle deployments from SOI, MBARI, NOAA, HURL, OET, SOI, GEOMAR, JAMSTEC, HBOI, IFREMER, and cruise locations from the Russian Academy of Sciences MIR 1 and 2 expeditions. (B) Number of dives per 100x100 km grid, Grey cells denote areas with no dive records. (C, D) Zoomed in subset highlighting the high number of dives around North America and Japan respectively.
Climate change velocity estimates were harvested from the supplementary information of Brito-Morales et al. (2020). They used data from Coupled Model Intercomparison Project Phase 5 (CMIP5) climate models averaged annually with a one degree resolution to estimated climate velocity for different depths of the ocean based on three scenarios published by the Intergovernmental Panel on Climate Change (IPCC). Climate change velocity illustrate the distance north an organism would have to move north to find the same temperature conditions based on different warming scenarios. We took the average value of Brito-Morales et al. change velocity estimates contained within each of the same 100 kmx100 km grid cells populated with OBIS data. We then assigned a rank-ordered value for the mean change velocity across all of the grid cells. To determine the areas of highest priority for exploration, we multiplied the climate change velocity rank (indicative of the likelihood of species movement under various IPCC scenarios) by the inverse OBIS rank (indicative of the areas with the fewest records available). This data manipulation yielded cells, translating to spatial coordinates, demonstrating areas with the lowest number of biodiversity records and the highest value for climate change velocity. Data for the IPCC RCP 8.5 “very high baseline emission scenario”, which representing the 90th percentile of the policy baseline scenario from the IPCC are presented here; visualizations using IPCC RCP 2.6 and 4.5 are located in the Supplementary Information.
Results
In total, we were able to collect location information for 30,733 dives made by deep-submergence platforms (Figure 1B). While the majority of the ocean has no dives, there are three grid cells that dominate the dive records (Figures 1B, C): Monterey Canyon, California where MBARI focuses most of its work with 4237 dives, and offshore of Yokohama, Japan with two cells containing 1,715 dives combined where JAMSTEC has conducted much of their work (Figures 1B, D). These three cells alone account for 16.8% of the dives recorded in this dataset, even though they only account for ~0.001% of the surface area of the ocean. Notably, 82.8% of the dives were conducted in the Northern Hemisphere, with only 6,172 dives (17.2%) conducted in the Southern Hemisphere.
The number of OBIS biodiversity records per cell varies by seven orders of magnitude across the globe (Figure 2). With highest numbers of records per cell topping out at 2,813,641 records, corresponding with 1,985 species, however the vast majority of cells have a significantly lower number of records. The median number of records per cell ranged between 5 in the abyss to 55 in the surface waters. All the depth zones examined had more cells without any OBIS records than cells with OBIS records. In surface waters, 49% of cells had at least one record, and in the abyss only 5% did.
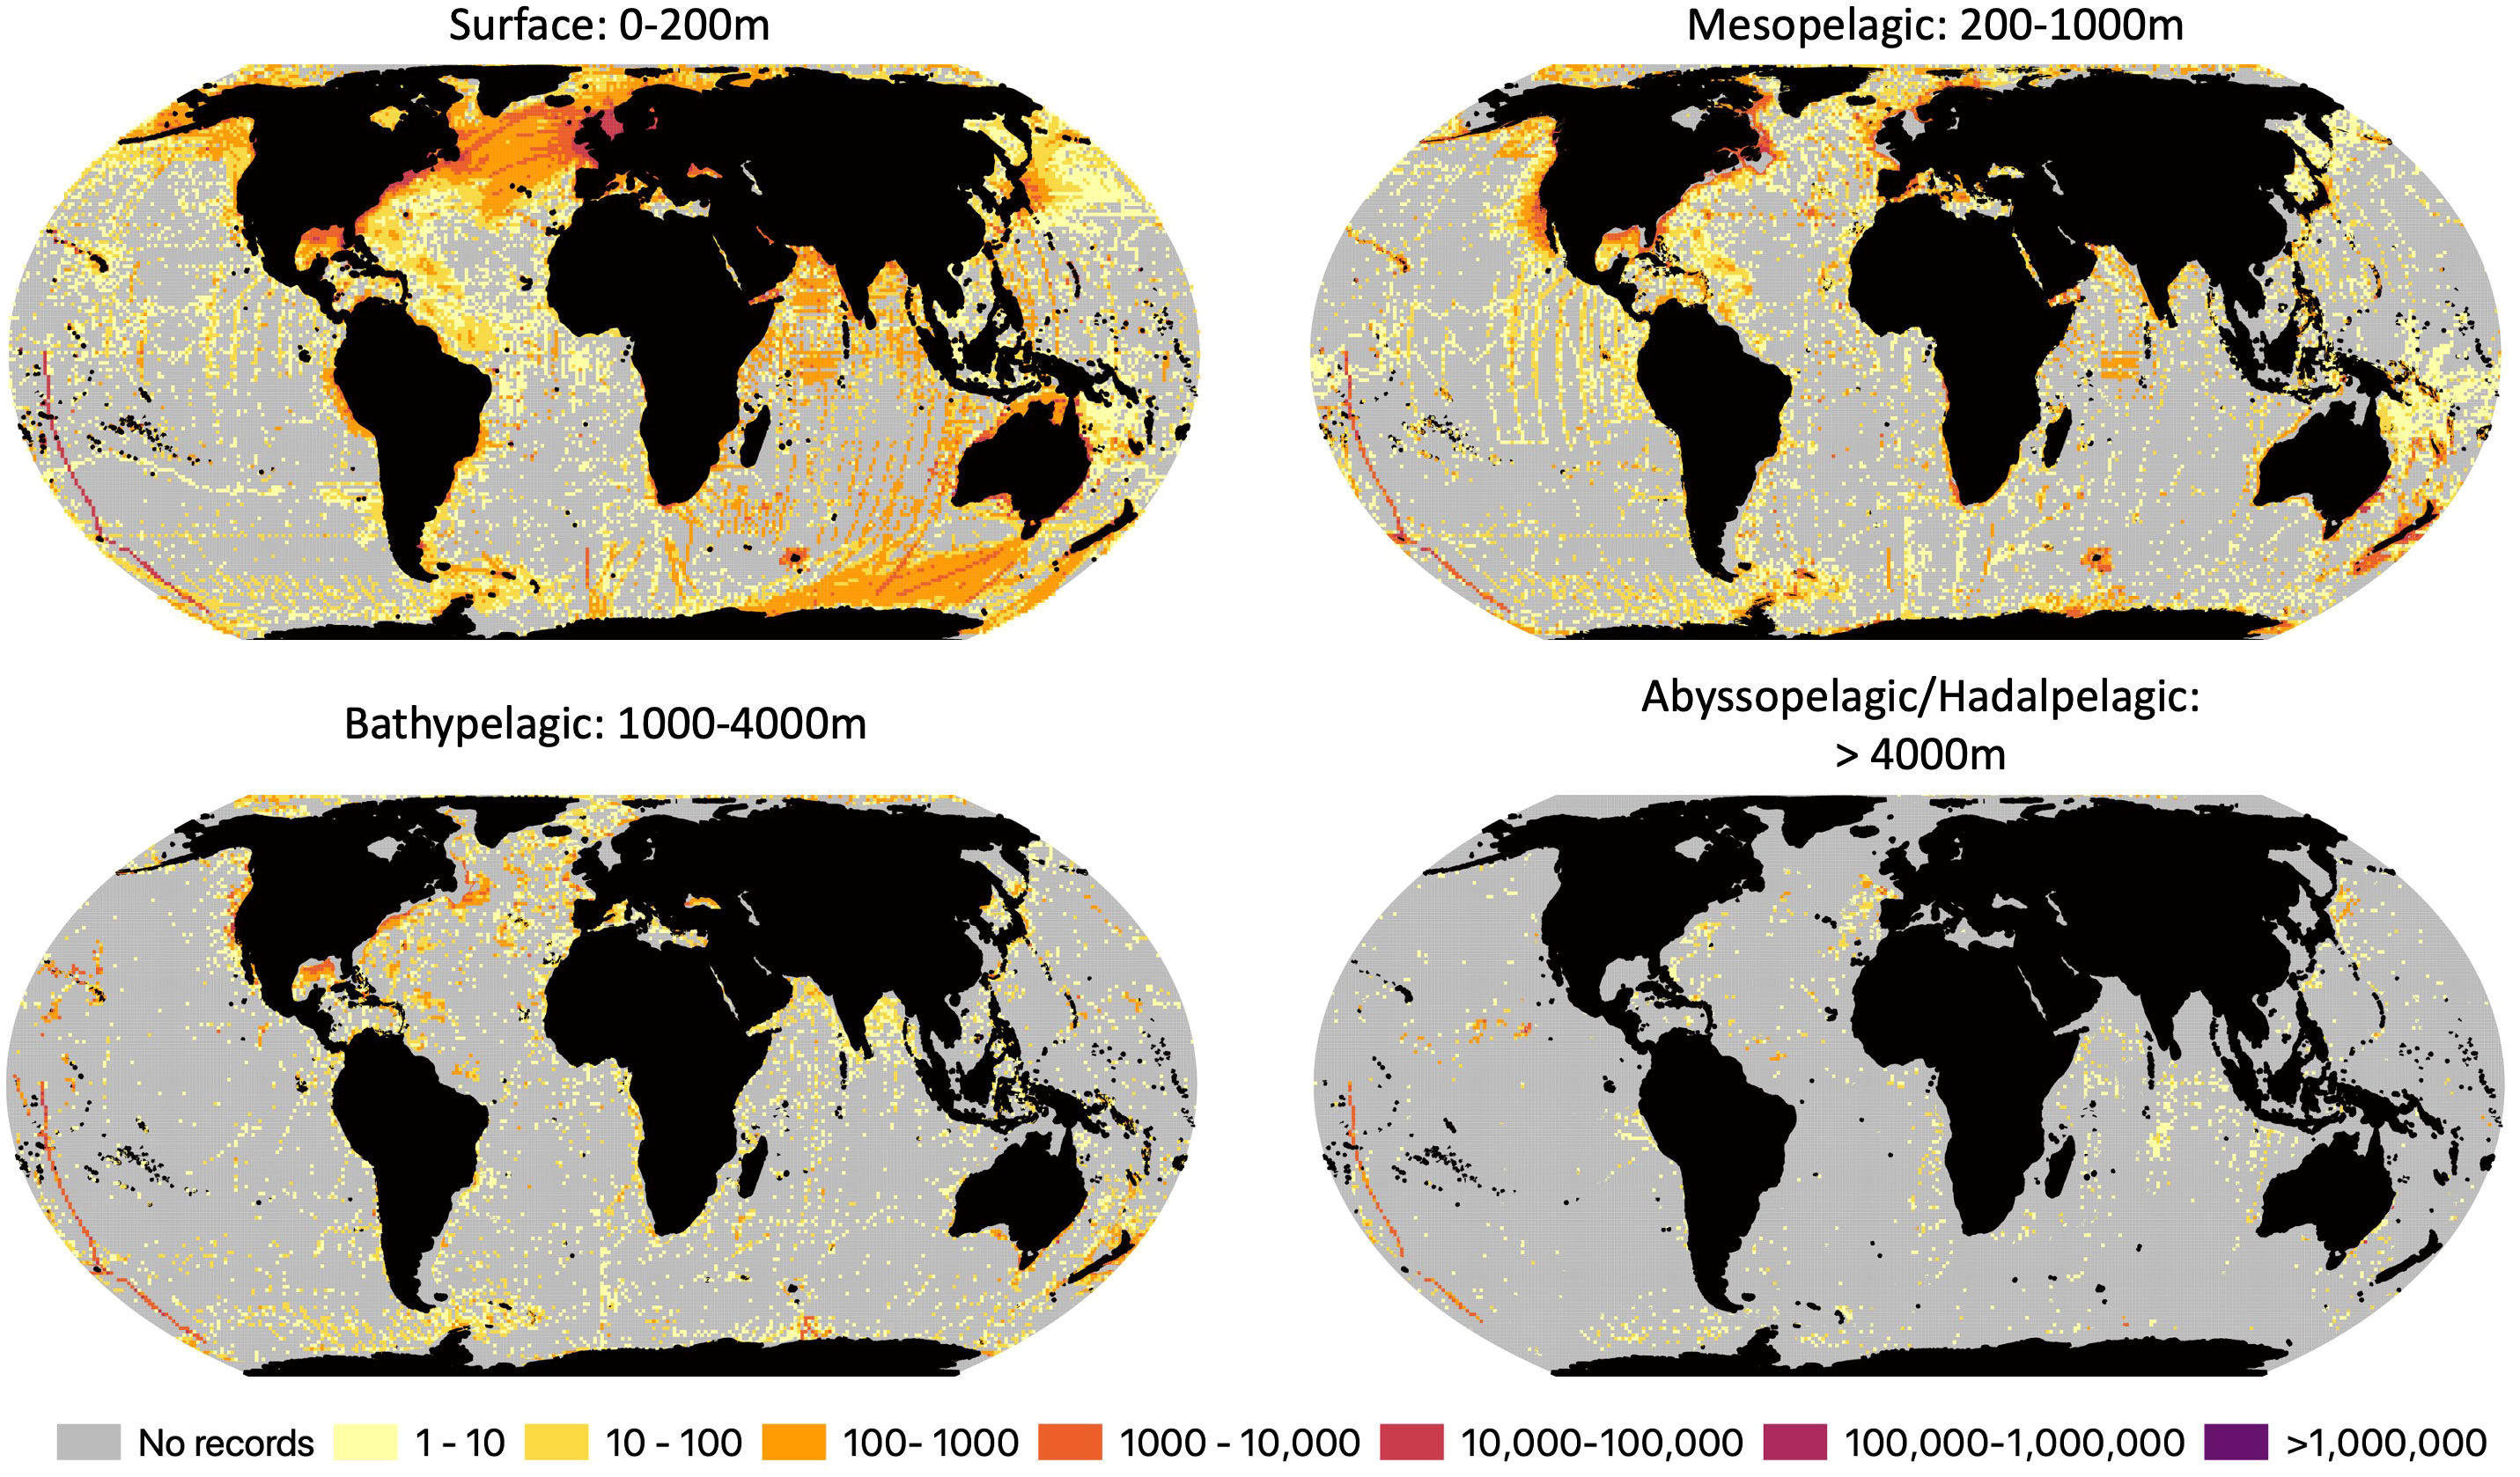
Figure 2 Number of OBIS records with depth information per 100 x 100 km grid for surface (0-200m), mesopelagic (200-1,000), bathypelagic (1,000-4,000m) and abyssopelagic/hadalpelagic (>4,000m) waters. Grey cells denote areas with no OBIS records.
The global distribution through the water column of recorded marine biodiversity is shown in Figure 3. Even on the logarithmic scale of number of records, the dominance of shallower and coastal waters within the OBIS database is clear. The deep pelagic ocean in particular reflects the paucity of records from this habitat with less than one OBIS record per 3,500,000 km3. When we consider that each cell of 200m depth over the abyssal plain and hadal depths represents a volume of c. 3.5 million km3 and that the color scale of Figure 3 exceeds 7 orders of magnitude, the global mean number of OBIS records per cell is only 585 and the median is 11 records per 3.5 million km3 of ocean; in other words, over half the ocean has less than 11 records total.
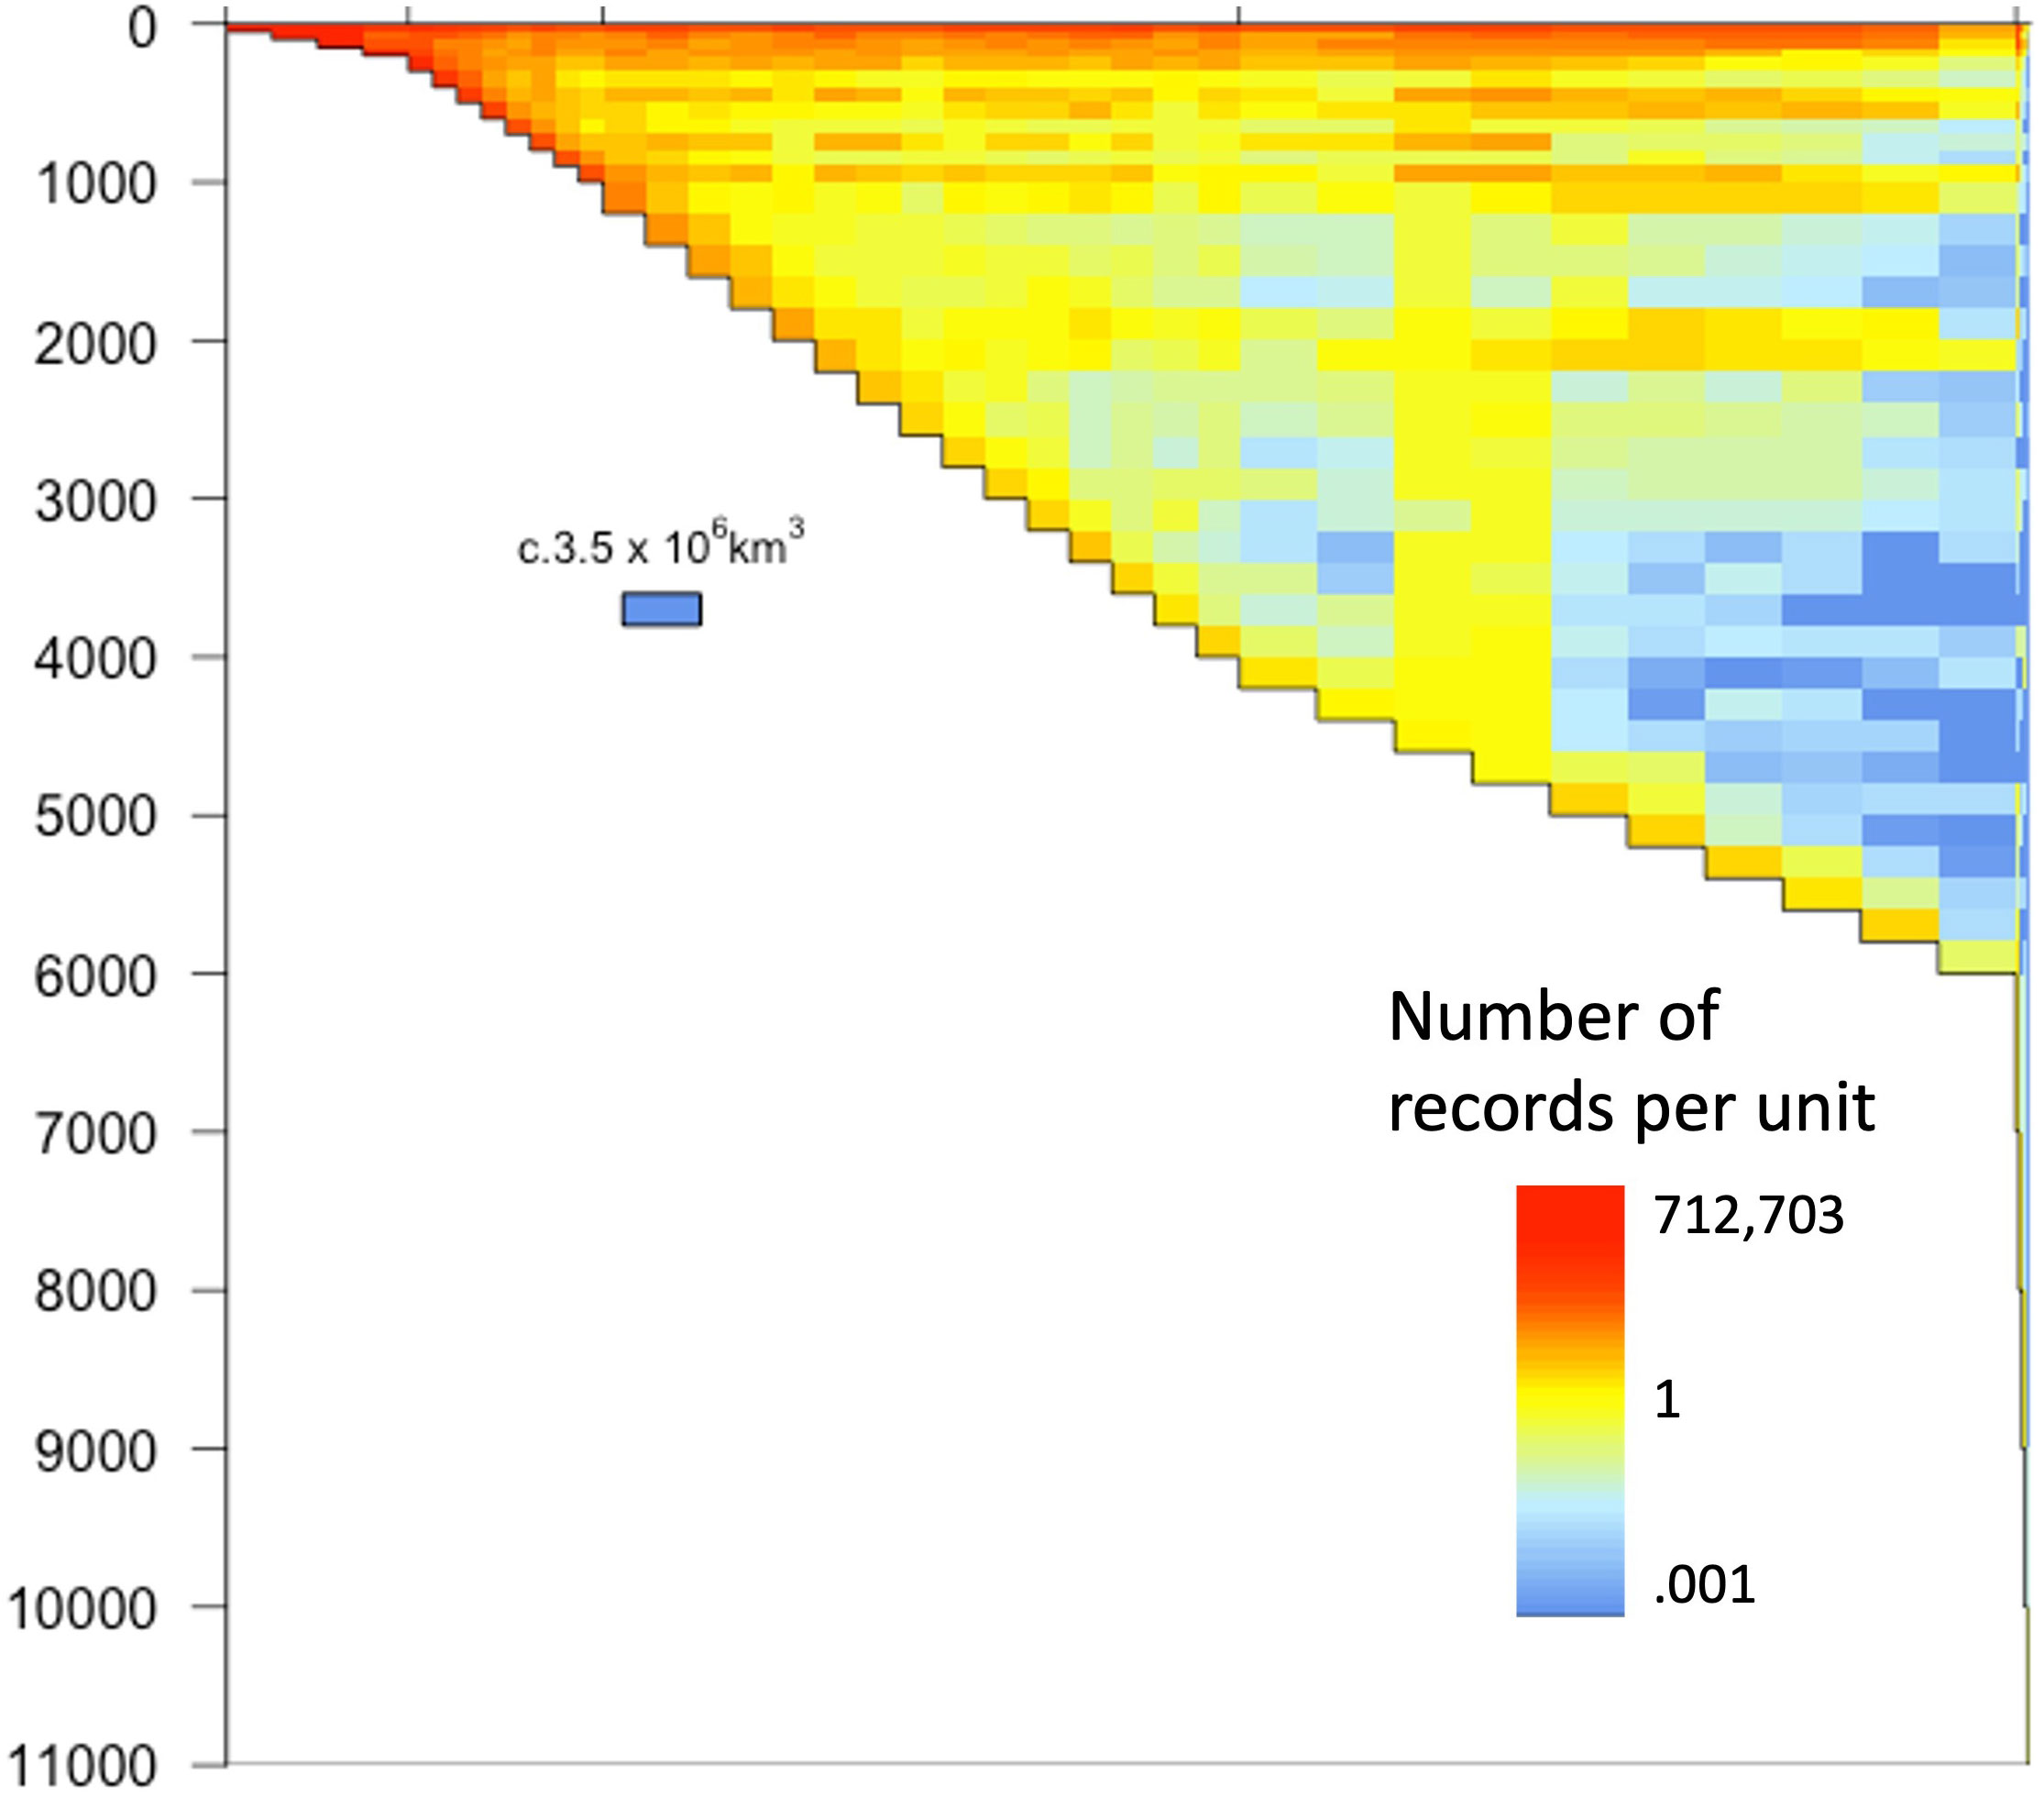
Figure 3 Global distribution within the water column of recorded marine biodiversity. The horizontal axis is nondimensional but show the ocean grouped as water column over a specific seafloor depth range. The vertical axis is ocean depth, on a linear scale. This means that the area on the graph is proportional to the volume of the ocean. For instance, in the deep sea, each cell of 200 m depth represents c. 3.5M km3. The number of records in each cell is standardized to the volume of water represented by that cell, and then log10-transformed.
Ocean biodiversity records for different proposed geodescriptive schema were examined for total number of records as well as number of unique species, genera and families. For surface waters, we used the Longhurst (1985) proposed provinces (Figure 4), which include 53 provinces across 4 ‘biomes’. The number of records per square kilometer of each zone varied widely. For example, there were 12.5 records/km2 in the Coastal - NE Atlantic shelves province, compared to only 0.009 records/km2 in the Trades - South Atlantic Gyral Province (Supplementary Table 1). Across the Longhurst provinces, there was substantial variation in the proportion of records that were identified to the species level. The Guinea Current Coastal Province had over 95% of its records contain a species level identification, while the Subtropical Convergence province had less than 18% of records identified to the species level. The Sutton et al. (2017) provinces represented the mesopelagic, with 33 provinces for this depth range. The biodiversity records for this schema were much sparser than the surface waters, with the most records in the Tasman Sea (0.8 records/km2; Figure 5; Supplementary Table 2). The highest species level identification for the mesophotic provinces was 86%, which is lower than surface waters. Watling et al. (2013) provinces for the lower bathyal and abyssal/hadal depth were likewise assessed Figure 6 (Supplementary Tables 3, 4): the South East Pacific Ridges province had the lowest number of records (0.0004 records per km2). Consistent with global trends, abyssal/hadal depths displayed the fewest records (0.00000204 records/km2, only 14 total records) which were found in the Brazil Basin province. The Brazil Basin from Watling et al.’s abyssal/hadal province (>4000m) only had 6 different species recorded, while in the surface waters, the Longhurst Trades - Archipelagic Deep Basins province had 23,357 unique species records in surface waters (0-200m). In the abyssal South Pacific province, 34.7% of records contained a family level identification, but only 3.6% at the species level.
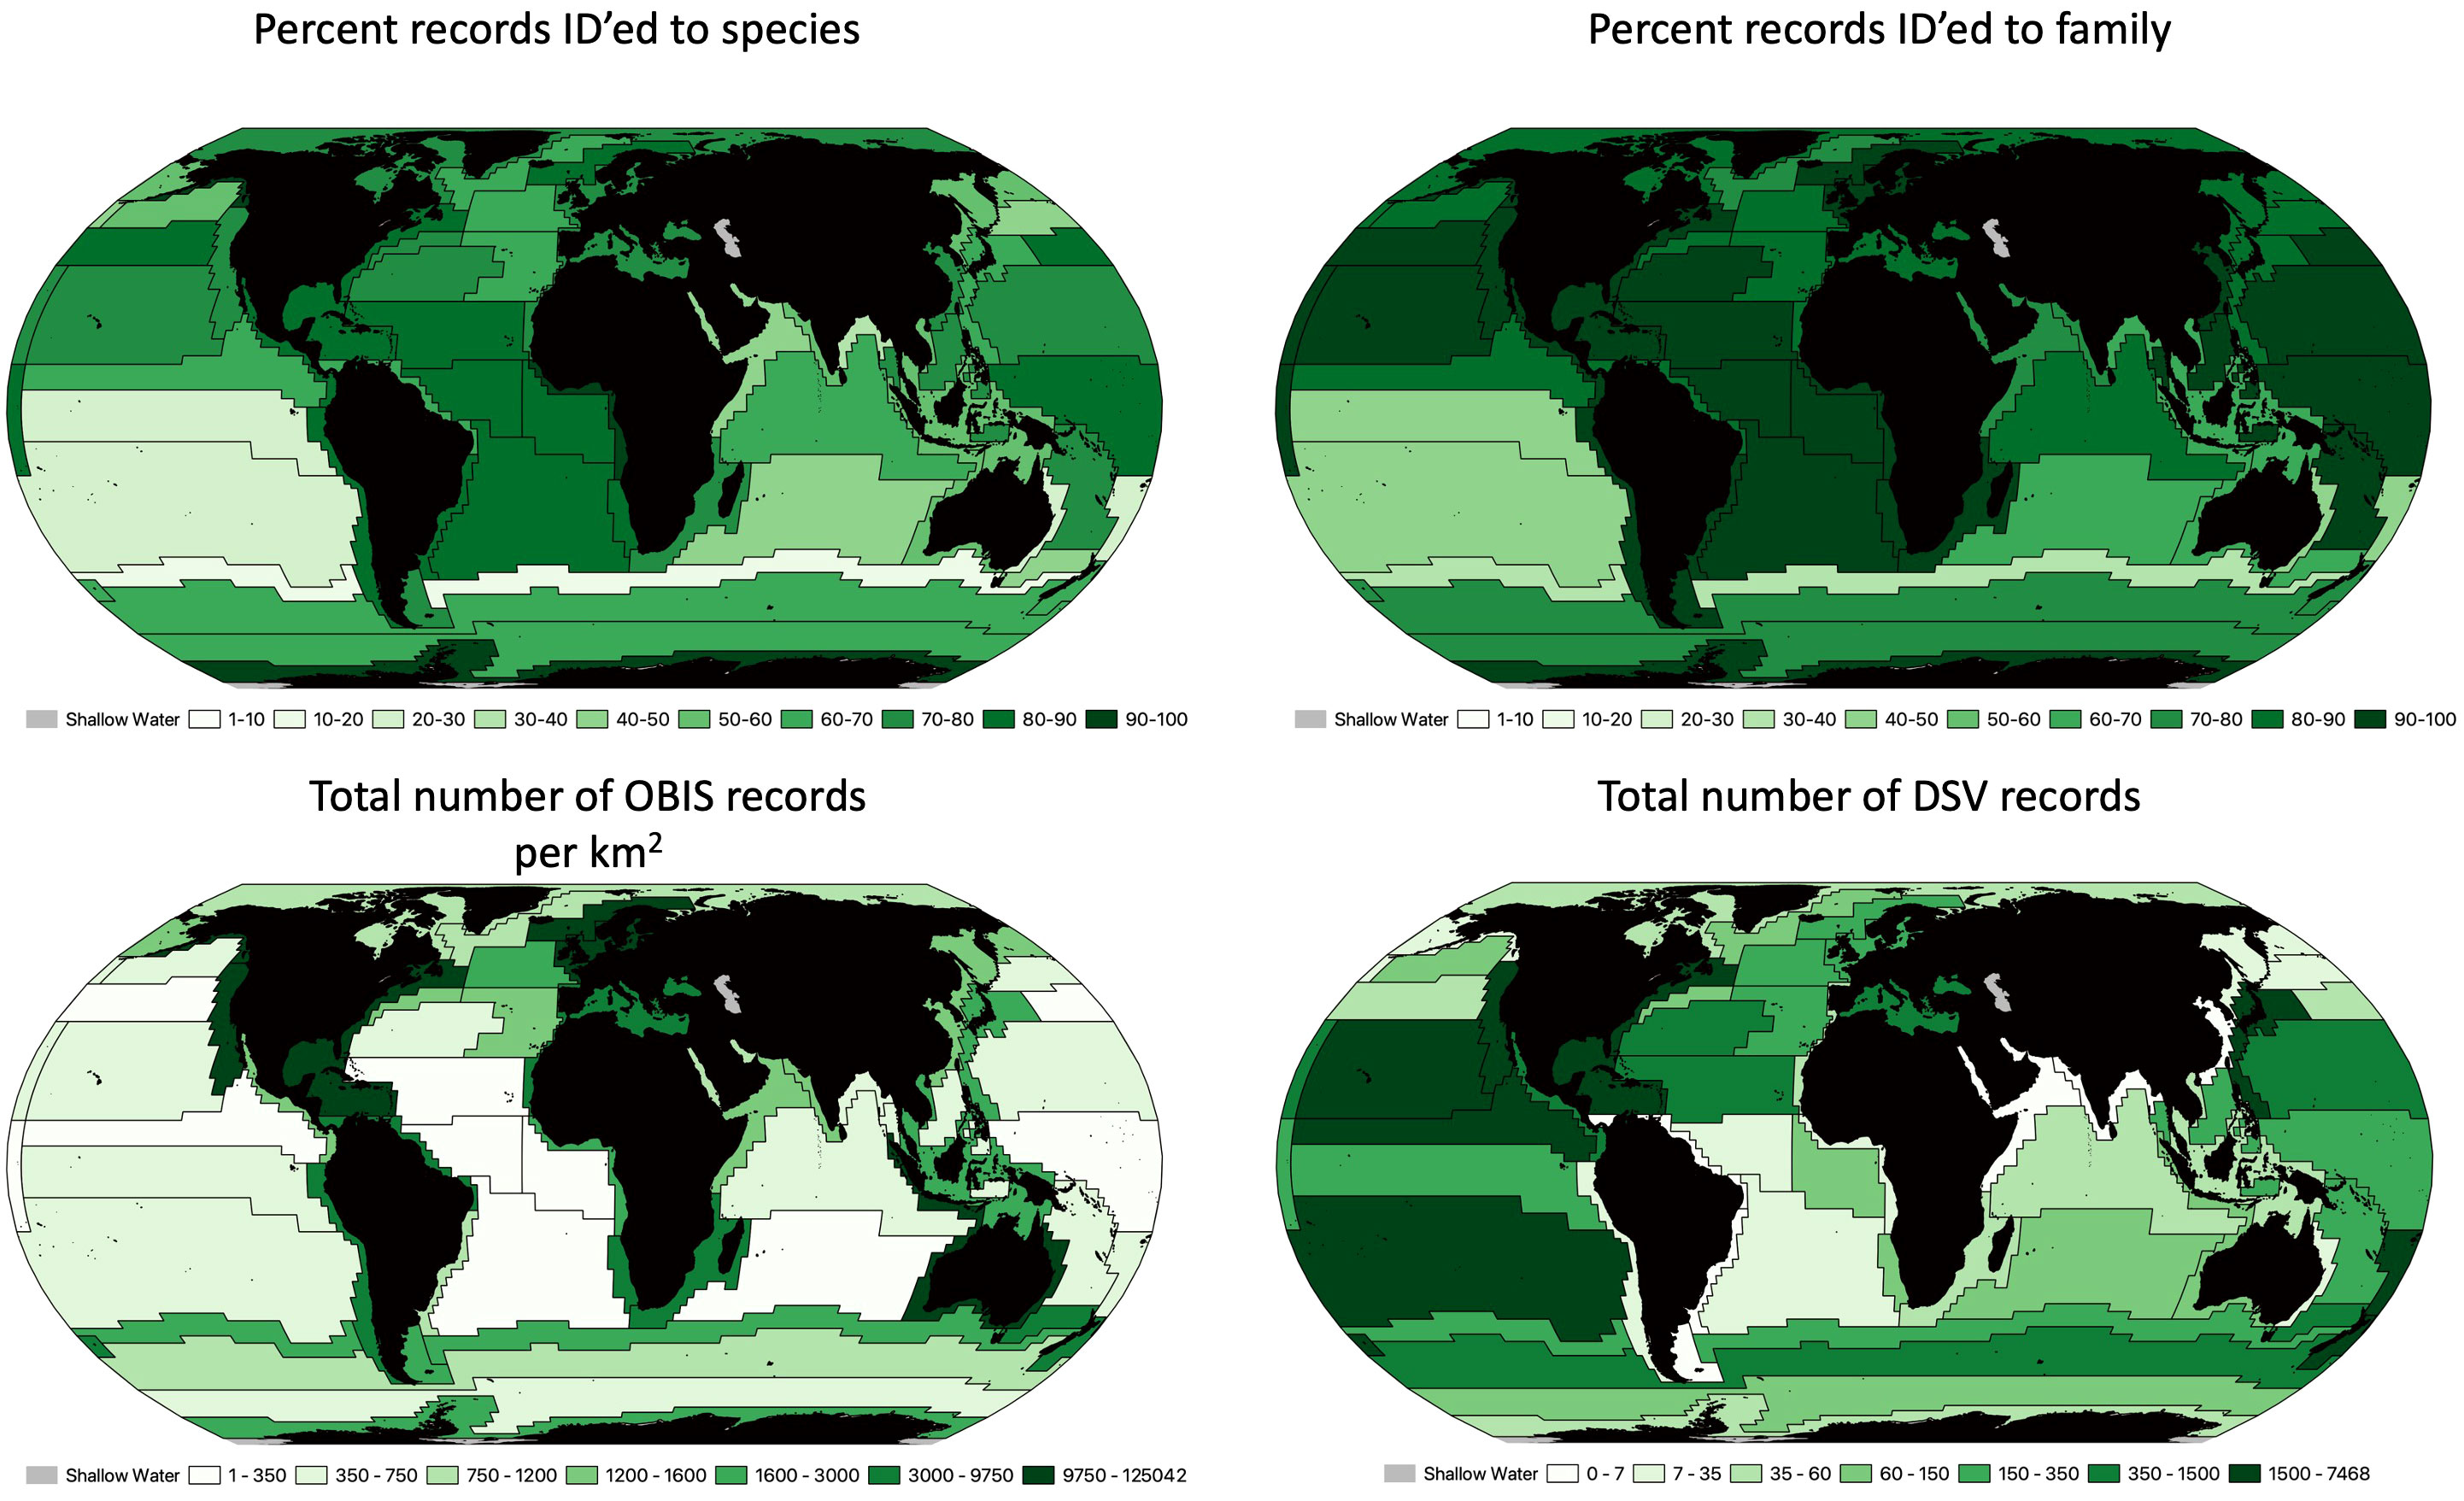
Figure 4 Longhurst (2006) proposed biogeographic provinces for surface waters. Top left is the percentage of records that were identified to the species level. Top right is the percentage of records that were identified to the family level. bottom left represents the total number of OBIS records per km2 for each proposed province (range of records goes from 0.009 to 12.5). Bottom right is the is the total number of deep submergence dive records for each province.
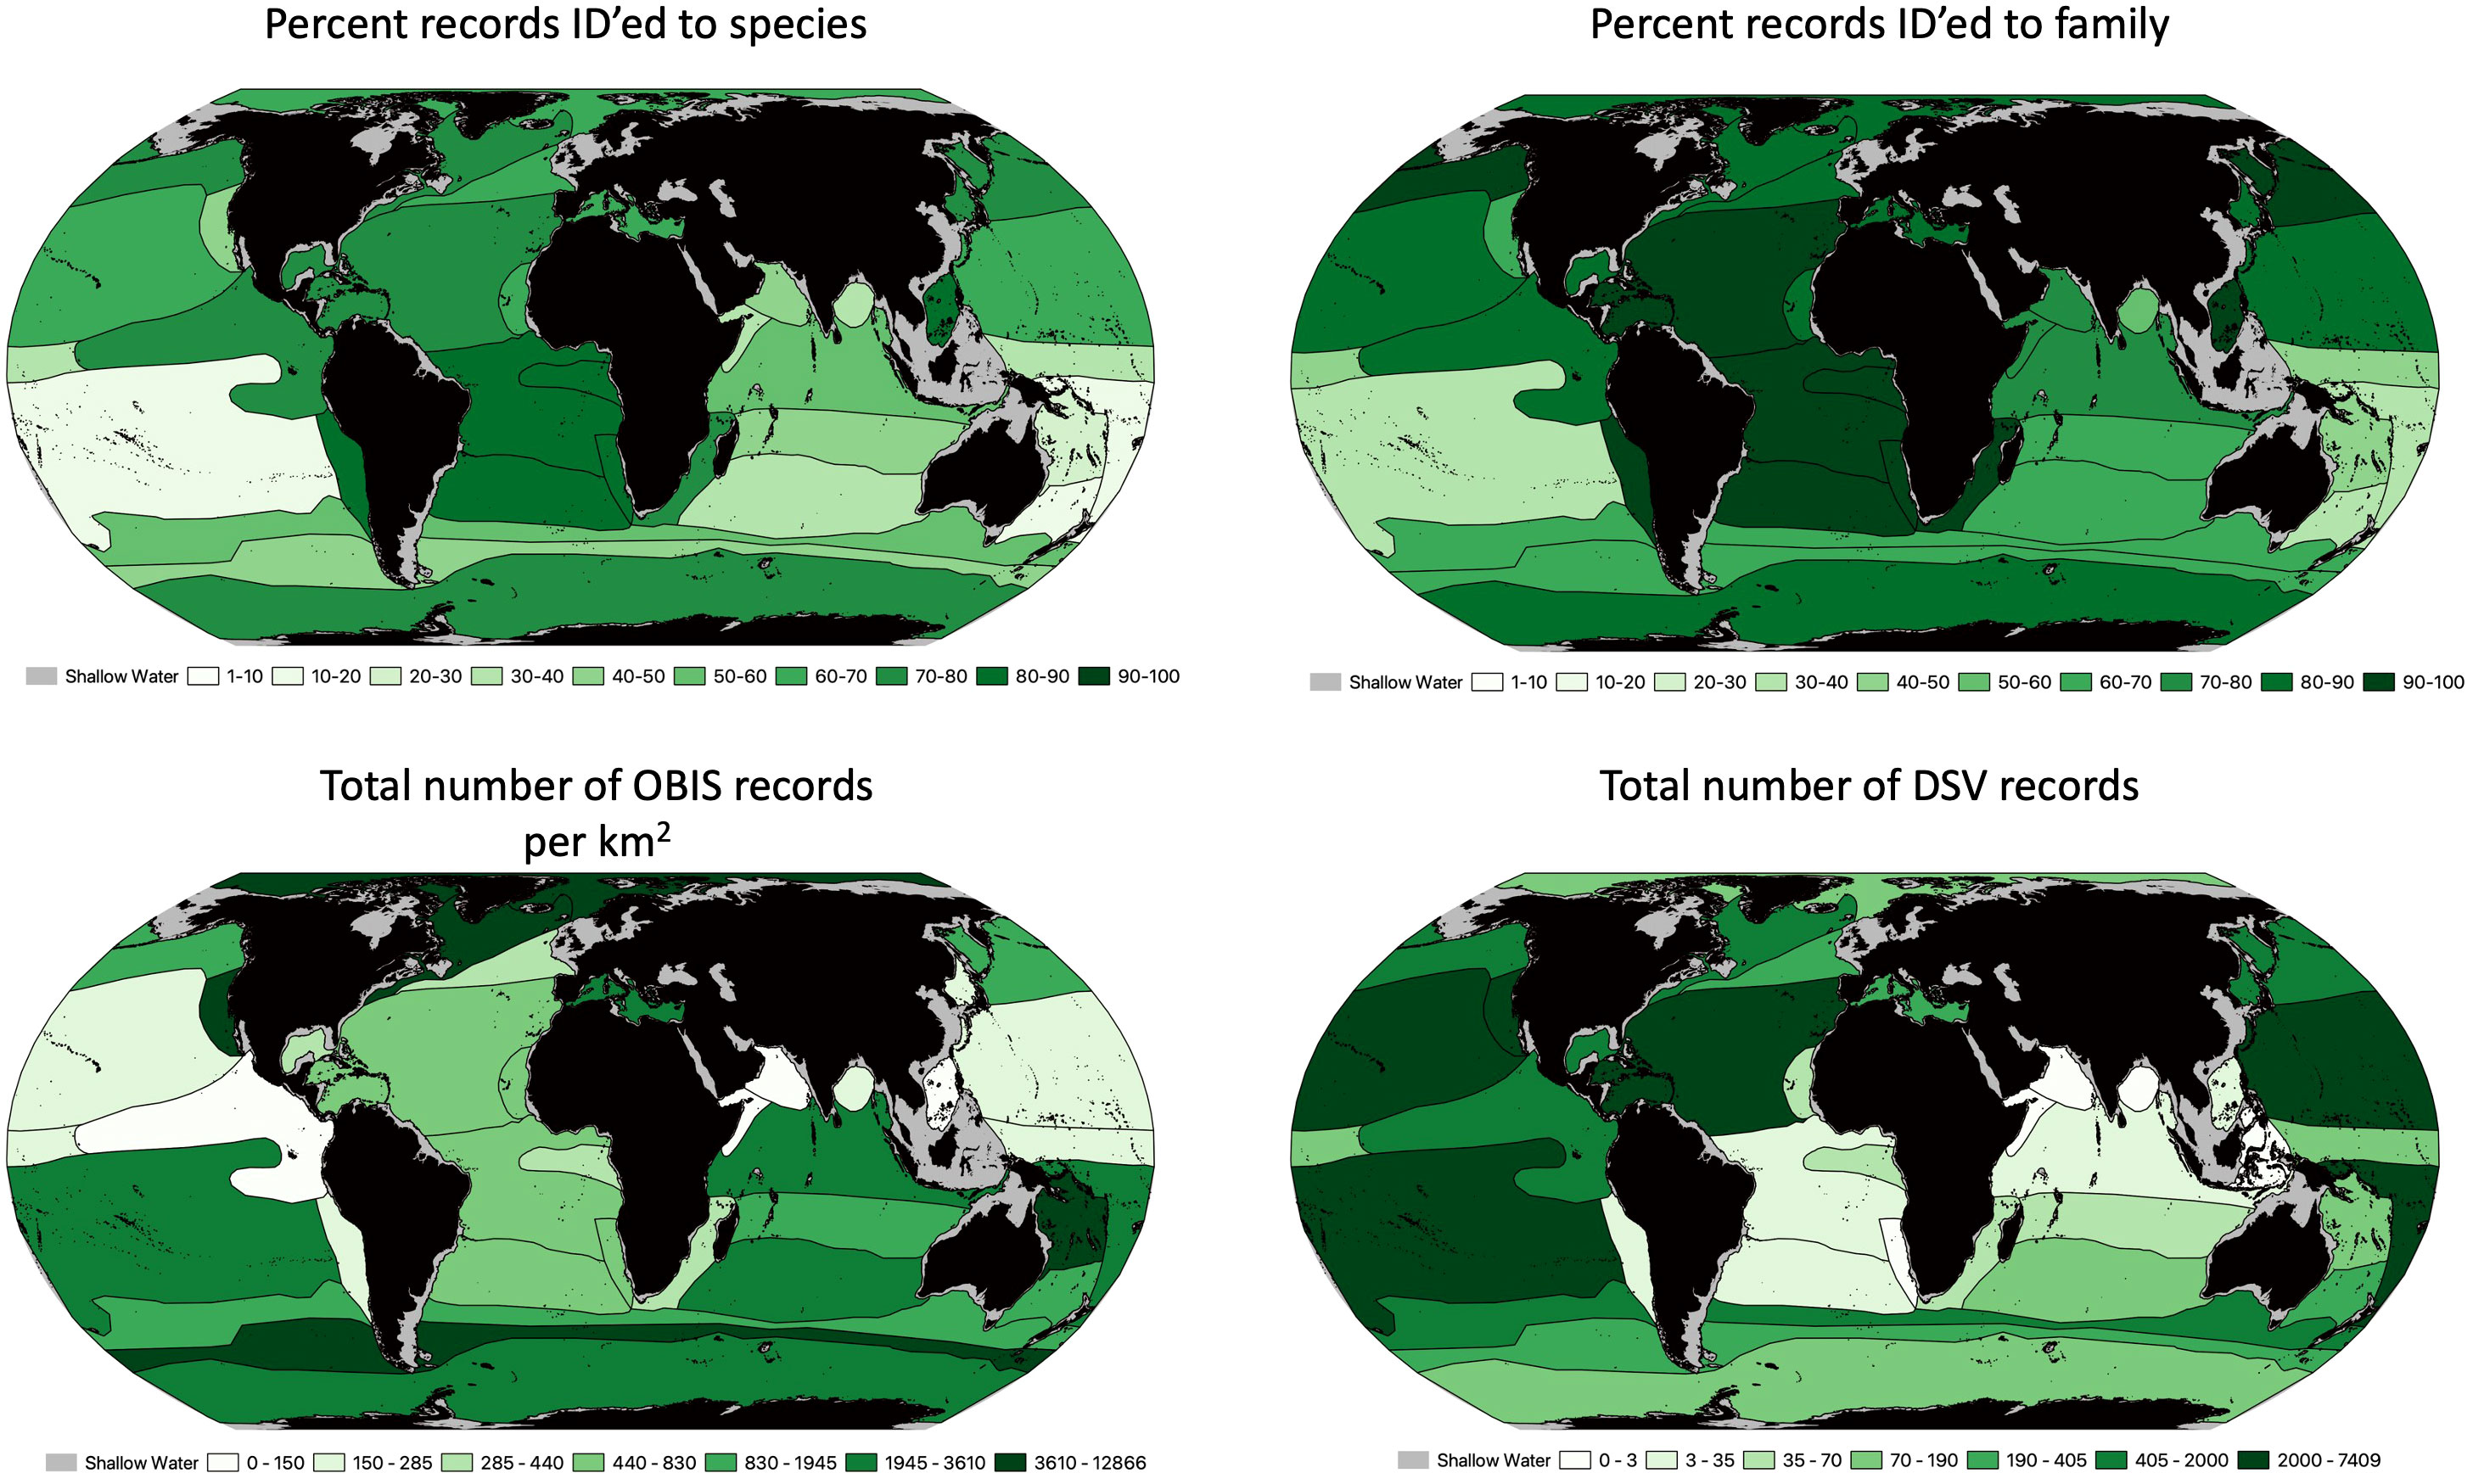
Figure 5 Sutton et al. (2017) proposed biogeographic provinces for mesopelagic waters (200-1,000 m). Top left is the percentage of records that were identified to the species level. Top right is the percentage of records that were identified to the family level. Bottom left represents the total number of OBIS records per km2 for each proposed province (range of records goes from 0.006 to 1.287). Bottom right is the is the total number of deep submergence dive records for each province.
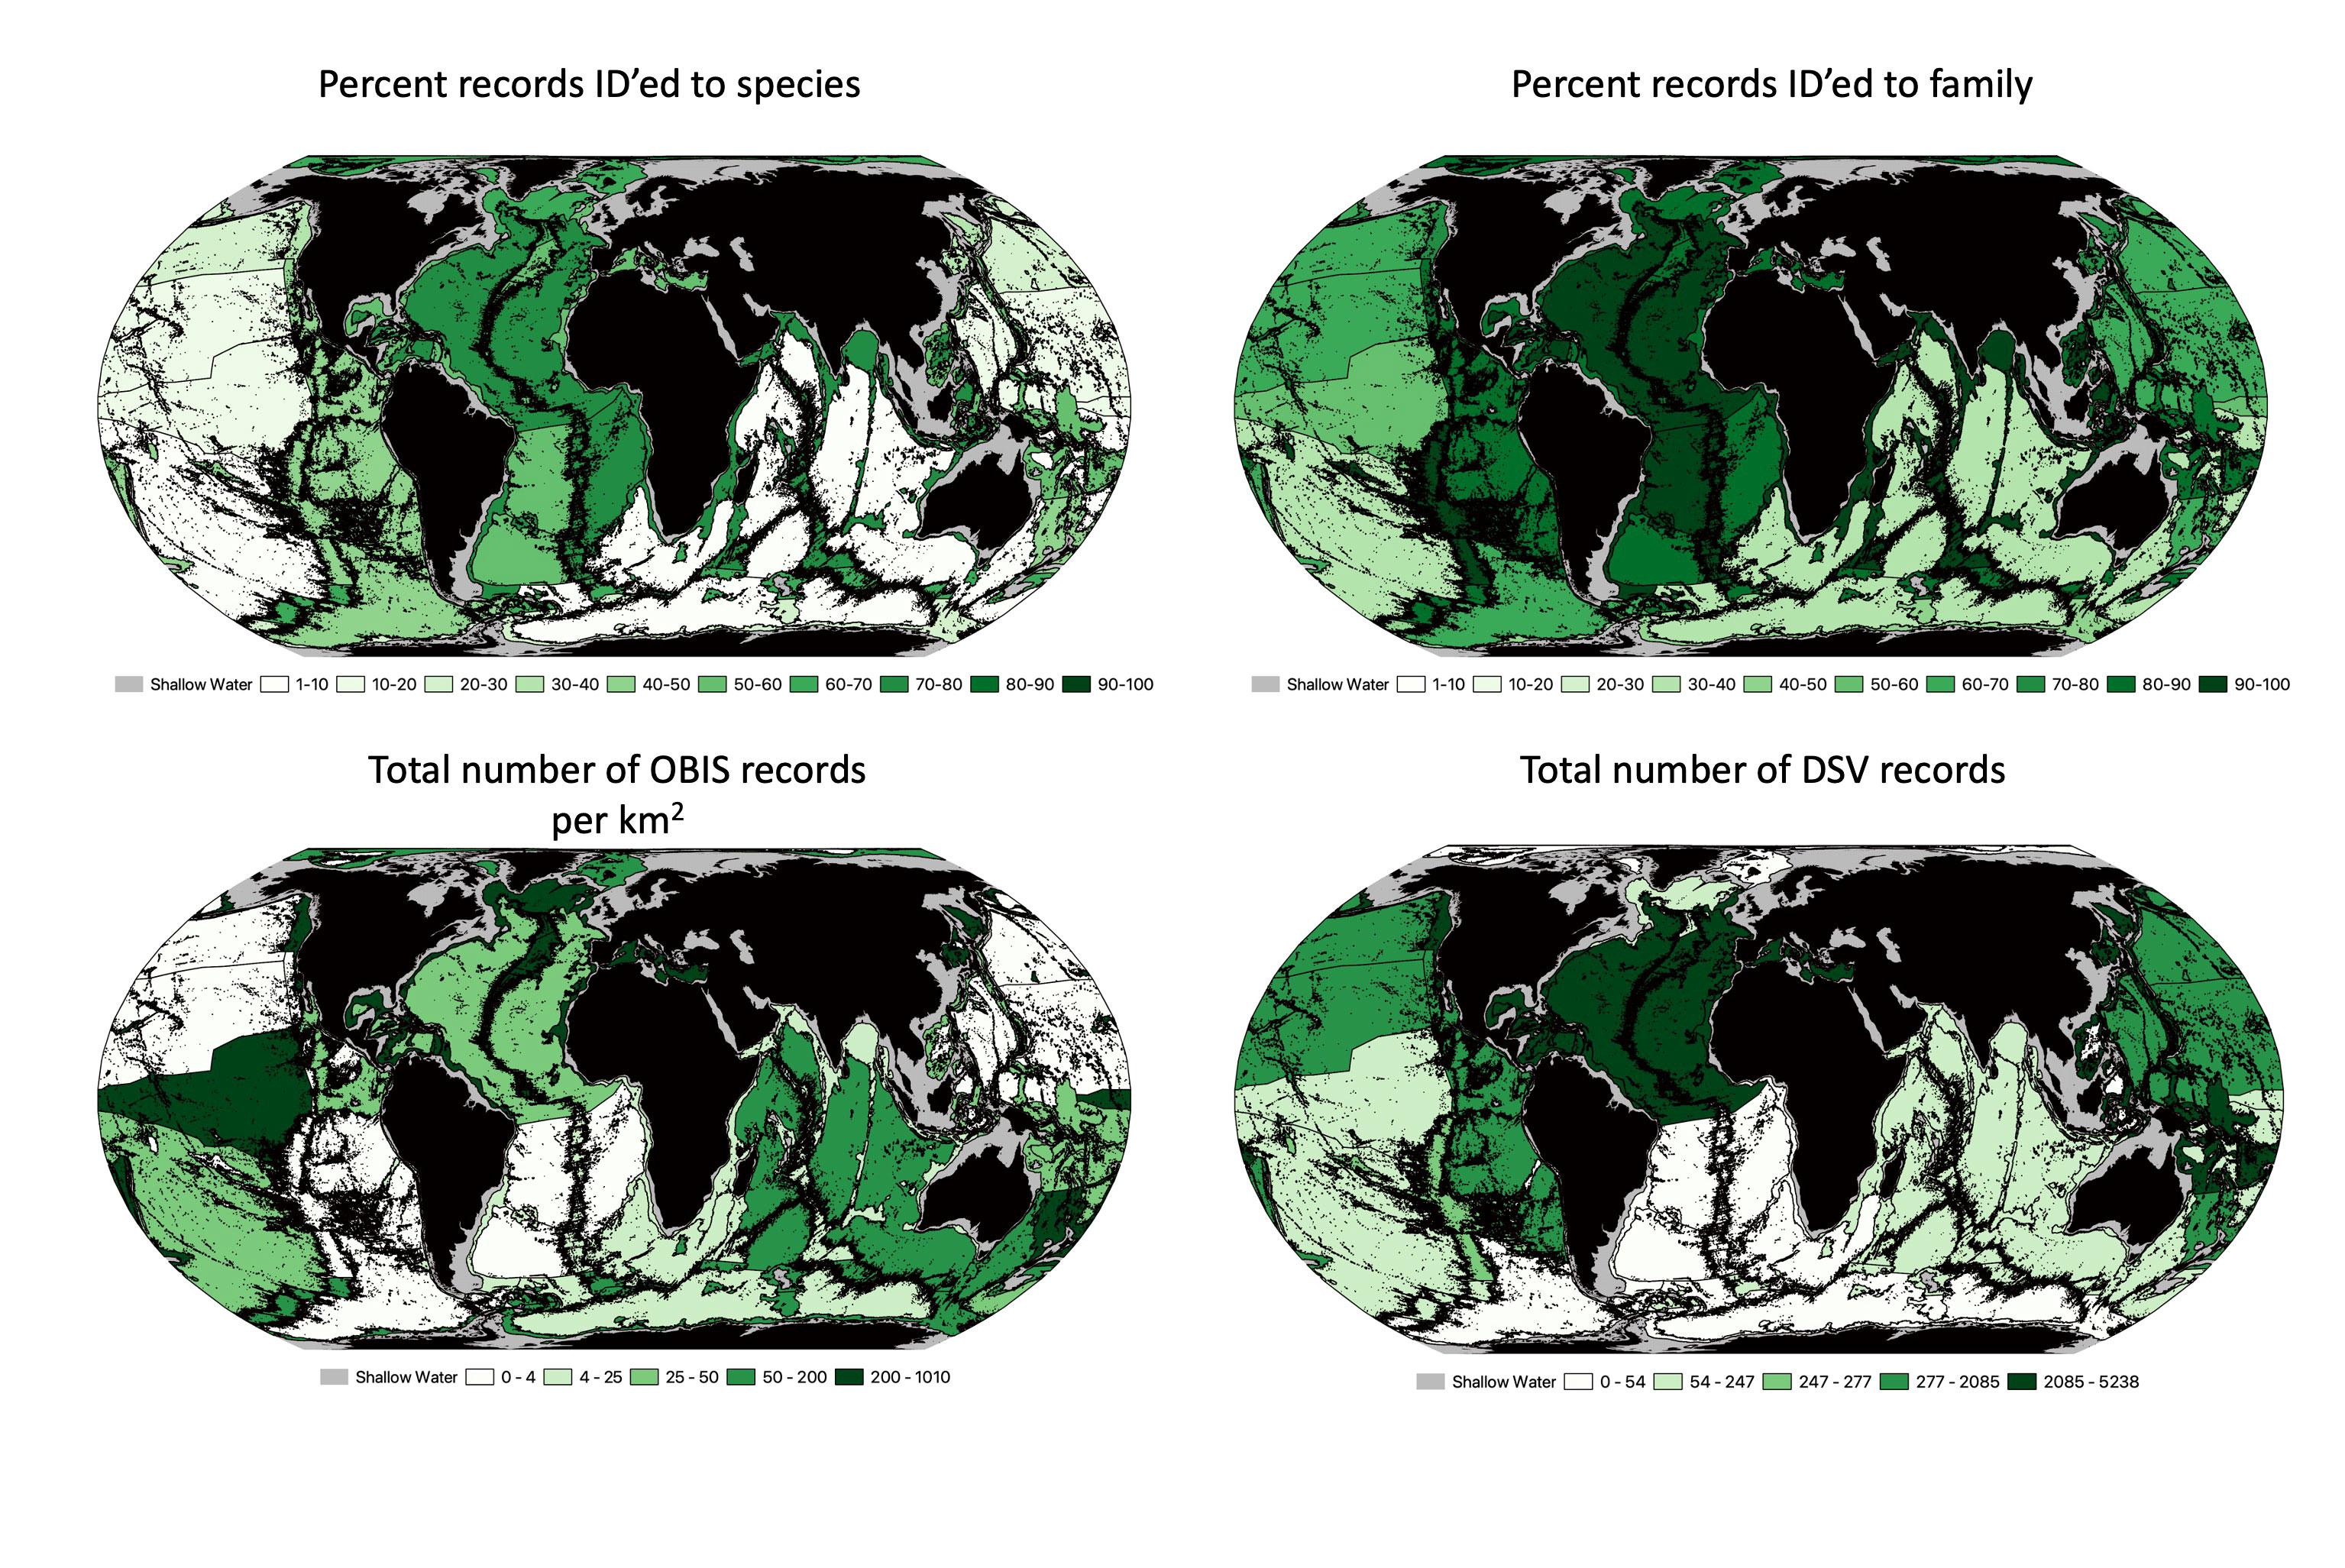
Figure 6 Watling et al. (2013) proposed biogeographic provinces for the lower bathyal and abyssal seafloor (in this project hadal depths are also included). Top left is the percentage of records that were identified to the species level. Top right is the percentage of records that were identified to the family level. Bottom left represents the total number of OBIS records per km2 for each proposed province (range of records goes from 0.00001 to.0458). Bottom right is the names of each province. Bottom right is the is the total number of deep submergence dive records for each province.
To help prioritize future research and exploration, we coupled climate change velocity estimates with OBIS biodiversity records to find the ocean areas with the fewest biological records coupled with the highest intensity climate change projections at the end of the century (2050-2100; Figure 7). In surface waters, the equatorial east Pacific was the largest tract of highest priority area for future exploration. There were also high priority bands located in the South Atlantic and central Indian Ocean. In mesopelagic waters, there were two high priority bands flanking the Equator. Additionally, mesopelagic waters near the Maldives, the Bay of Bengal, and the Coral Triangle all had some of the highest values. In the Bathypelagic, the highest priority waters are found in both the Atlantic and Indian oceans, flanking the mid-ocean ridges. In the abyssopelagic, there are so few OBIS records that the priority ranks are nearly completely driven by the climate velocity projections, and it is clear that there is a need for increased exploration at these depths on the whole.
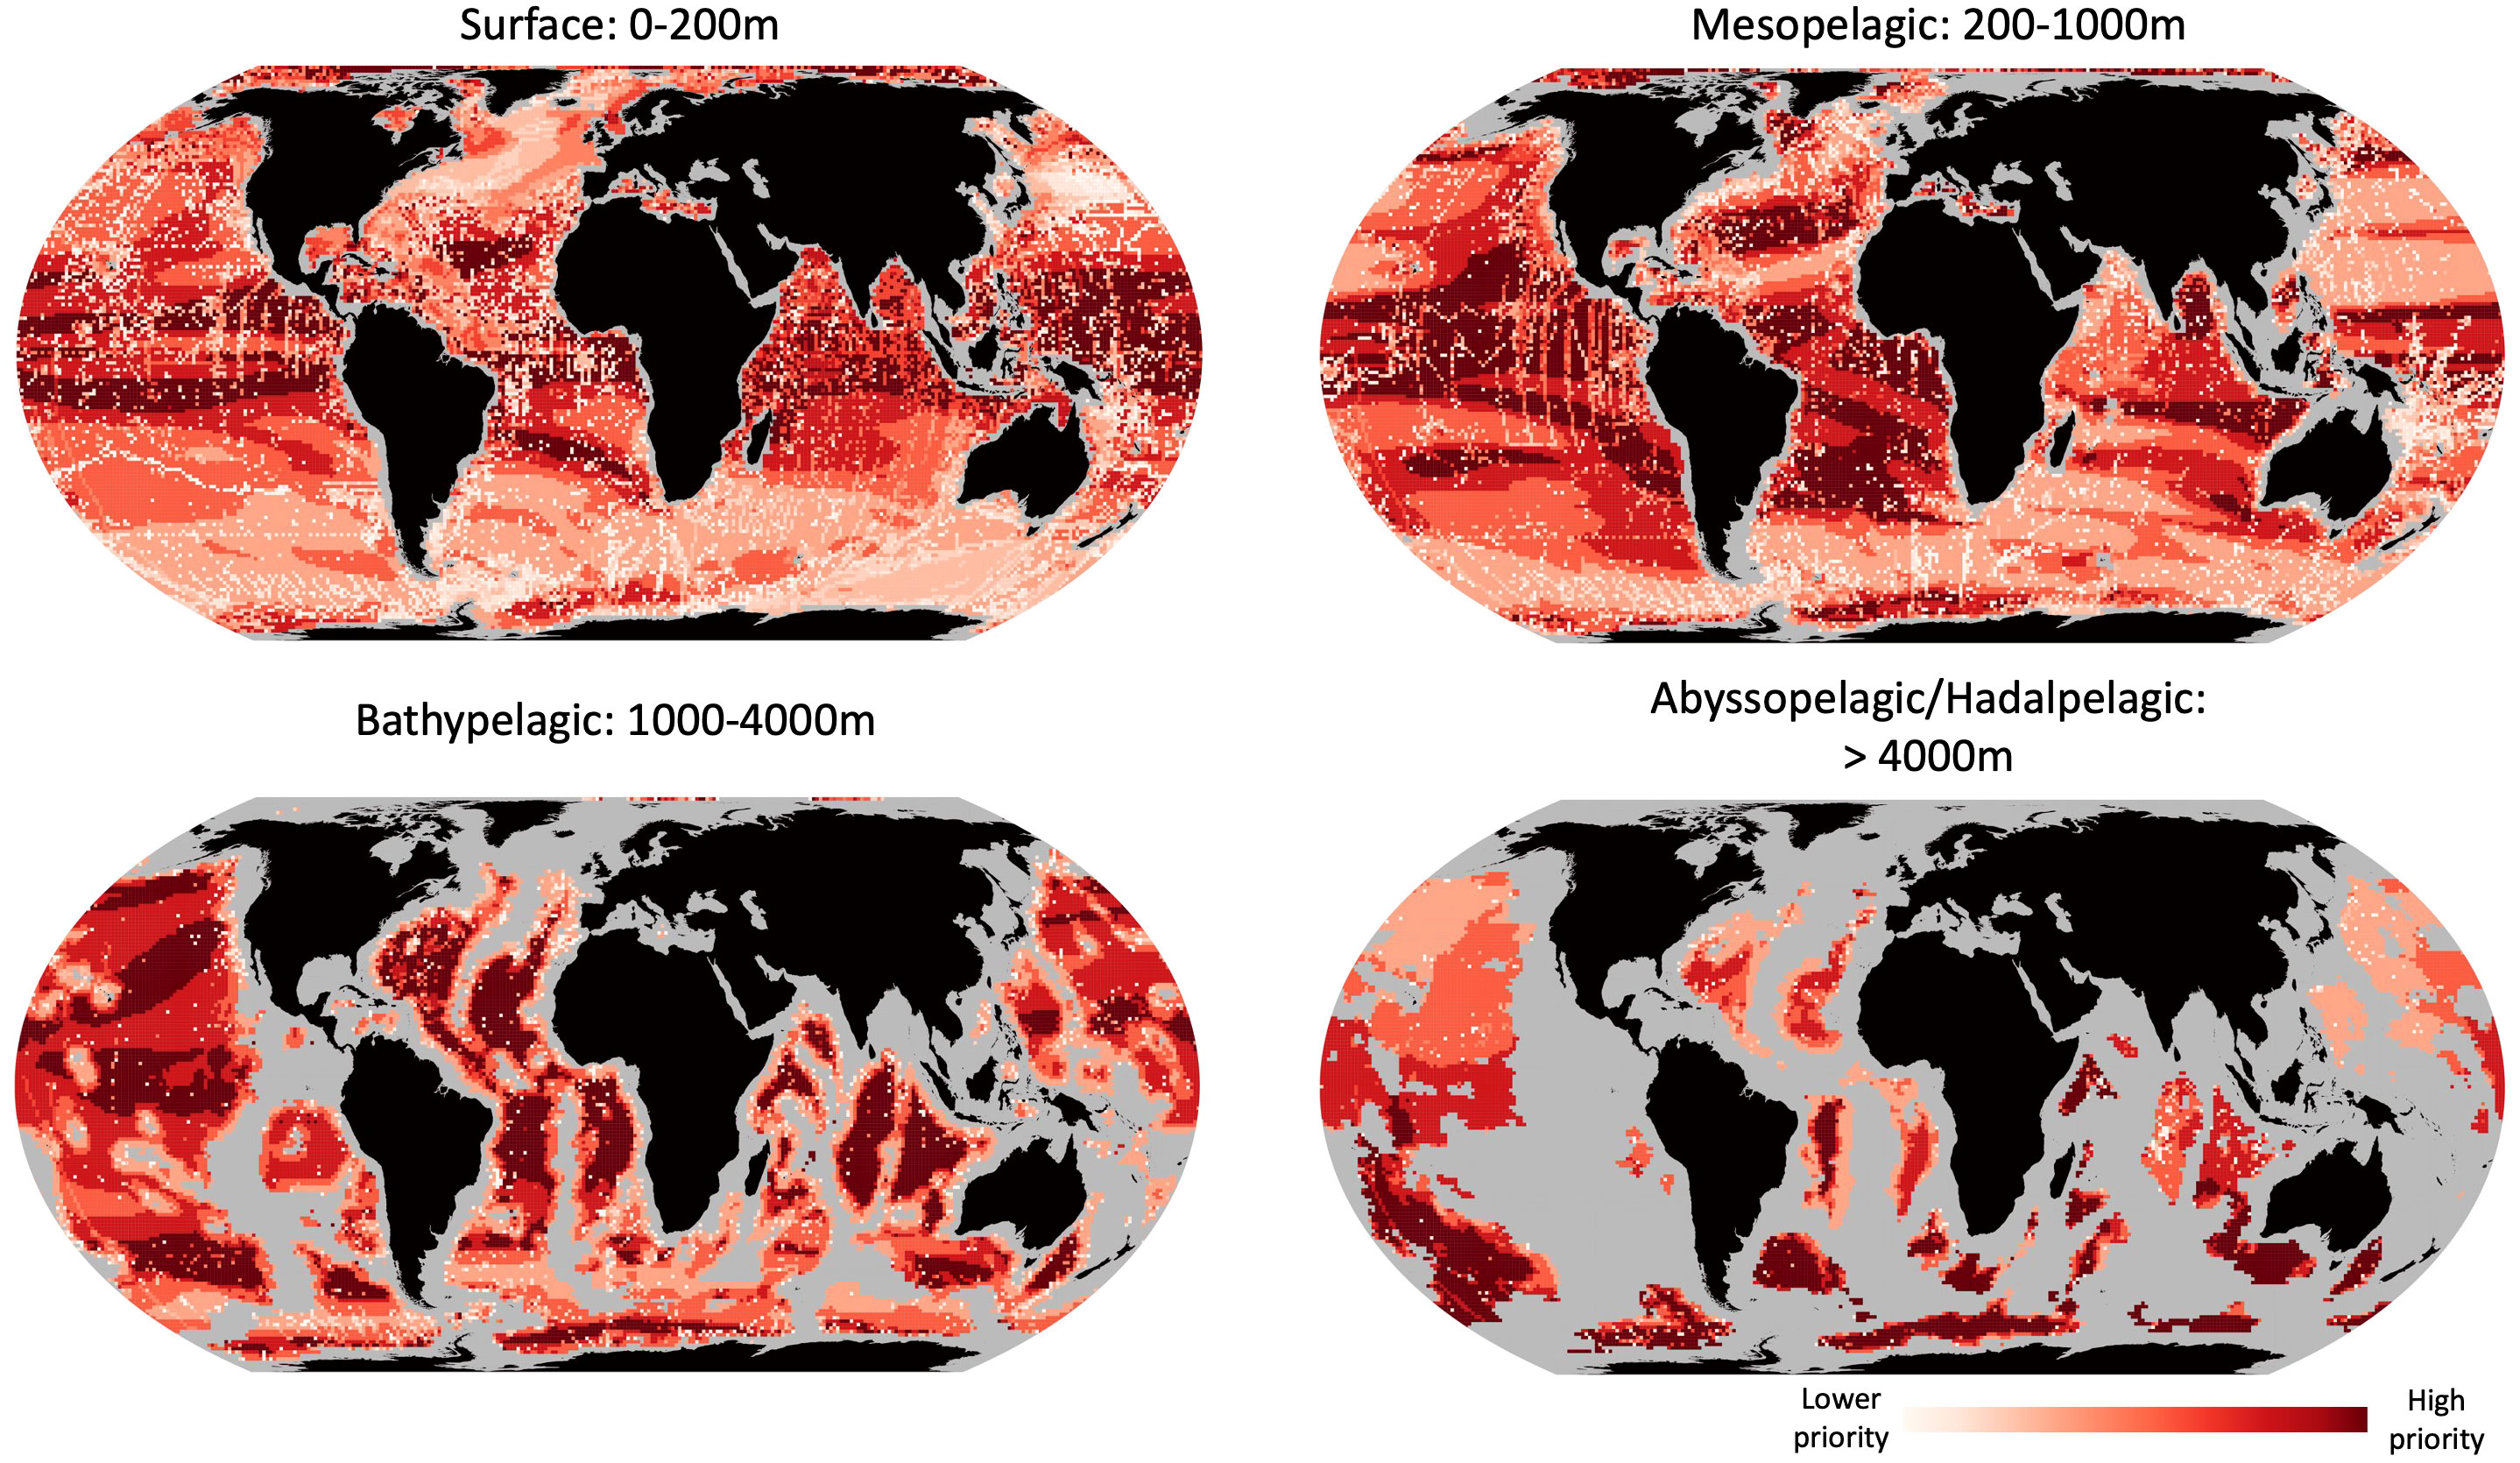
Figure 7 Areas of highest priority for exploration in an era of global change. Combining climate velocity estimates from Brito-Morales et al. (2020) 8.5 degree scenario with the lowest number of OBIS records for surface (0-200m), mesopelagic (200-1,000), bathypelagic (1,000-4,000m) and abyssopelagic/hadalpelagic (>4,000m) waters. Redder colors denote areas of lower number of biodiversity records and higher estimated climate change velocities.
Discussion
The ocean is chronically underexplored compared to terrestrial environments, especially corrected for the ocean’s size and depth (Rowden et al., 2010; Webb et al., 2010; Kennedy et al., 2019). Though previous attempts have been made to assess the distribution of OBIS records globally (Kot et al., 2010; Webb et al., 2010), gaps still remain, creating the opportunity for the ocean exploration community to strategically assess these remaining gaps and prioritize targeted exploration efforts. There is a global need for accurate and comprehensive biodiversity data, given the increasing emphasis on ocean protection targets and exploitation limits that use biodiversity as their key indicator (Hughes et al., 2021). However, the current disparity of biodiversity data spans from no data available to areas with over 1M records. One of the key contributions of this paper is a comprehensive visualization of existing biodiversity data parsed by biogeographic provinces by depth, generating a biology-centered approach to prioritizing effort for the future.
There are areas in the ocean that are notably well-explored with repeated effort, and these areas provide some of the best insights into biodiversity dynamics. However, sites with high data density are extremely rare, and only target a small geographic area. We found that the three areas with the highest density of dives were in close proximity to some of the largest deep submergence research institutions (MBARI and JAMSTEC). Of all the deep submergence dives that we compiled globally, 19% of them were located in less than ~0.03% of the surface area of the ocean (Figures 1B–D). We also found a strong exploration effort in the Northern Hemisphere (94.6% of deep submergence dives), with only 5.4% of dives (1,644 deep submergence dives) in the Southern Hemisphere. This finding is consistent with a recent Global Capacity Survey that showed that the majority of deep submergence platforms are based in North America and Europe (Bell et al., 2023). Similarly, a recent study by Amon et al. (2022) showed a strong bias toward the Northern Hemisphere in terms of the capacity to conduct deep-sea science and exploration. This northern bias in terms of research and effort is exacerbated in terms of understanding global patterns of biodiversity by the fact that the majority (81%) of oceanic waters are contained in the southern hemisphere (Webb, 2021). These spatial biases are likely driven by the practical constraints of fuel and time costs, but they must be considered when researchers use this spatially biased data in OBIS to extrapolate larger spatial scale patterns.
Disproportionate exploration effort, as noted above, is one of the contributors to uneven distribution of biodiversity data across the globe (Hughes et al., 2021). Even OBIS, which is a comprehensive, community driven, user-input marine biodiversity database (Klein et al., 2019) cannot adequately catalog or index every taxon on the planet because there is uneven distribution of records, many taxa are extremely difficult to identify even by experts, and there is continued interest in database improvement (Klein et al., 2019). The uneven distribution of OBIS records makes the description of marine biogeographic provinces difficult, and prohibits comprehensive biodiversity hypothesis-testing in different regions. For example, in abyssal waters, Watling et al.2013’s Brazil Basin province is described using only 14 total records (0.00000204 records km-2) in OBIS representing only six species, while in contrast, Longhursts 1996’s Coastal - Alaska Downwelling Coastal Province is represented by 2,175,924 records (3.32 records/km2). This issue is further exacerbated by the level of taxonomic identification provided within the OBIS records; while higher classification is typical, family, genus, and/or species classifications are not guaranteed. For example, in the abyssal South Pacific province, 34.7% of records contained a family level identification, but only 3.6% at the species level. Indeed, when examining across the entirety of OBIS records with depth information, only 53.8% are identified to species level (31,448,375 out of 58,442,819 records), and even at the family level, only 69.9% (40,872,702 records). Because biogeographic research most typically requires genus or species level identification (Costello and Chaudhary, 2017), OBIS records with only order or higher level identifications are of limited utility.
In addition to geographic disparities in data density, we also found data density to be strongly influenced by depth, as evidenced by examining records by biogeographic province (surface, mesophotic, and deepwater). We found that - in places with records with known depths - there was a spread of records ranging from 0.00116 to 172,702 per 3.5M km3, with the fewest records per cell below 4,000 m (Figure 5). It should be noted that this disparity is not fully due to lack of deep submergence dives: even in places where deep submergence dives have been done, not all ROV image data gets annotated or incorporated into OBIS records. Annotating visual data from ROV video is particularly time intensive to process and has a large volume of observations, which makes it challenging to ingest into OBIS (Tippett et al., 2022). Several efforts have been launched to help streamline this process from improving annotation software (Gomes-Pereira et al., 2016) through metadata standardization (Tippett et al., 2022), but there is still significant work to be done in this regard.
Though deep-sea records in OBIS are sparse compared to surface records, there is additional bias within deepwater records towards benthically-associated species. We found that at all ocean depths, there are increased OBIS occurrence records near the seafloor when compared to the water column below 200 meters. This finding is consistent with other works pointing out that the water column is particularly undersampled (Netburn et al., 2018; Drazen et al., 2020). However, the data paucity at depth and in certain regions provides a clear directive and justification to prioritize future exploration efforts in service of global marine biodiversity records. Such baseline records are urgently needed, especially in the Anthropocene where species migrations and other climate change impacts are expected to have dramatic impacts on biodiversity, globally (Burrows et al., 2011).
As the planet experiences an unprecedented rate of change (Pörtner et al., 2022), the oceans are changing faster than the pace of exploration (Halpern et al., 2019). To determine the priority areas for future exploration in different climate change scenarios, we determined the regions with the lowest data densities that were simultaneously the most likely to be impacted by climate change. In the mesopelagic, one of the priority areas includes the Coral Triangle, which is well known to be the center of marine biodiversity on the planet (Veron et al., 2009), suggesting that even well-studied areas require additional effort at certain depths in preparation for inevitable climate change consequences. The bathypelagic unsurprisingly has a need for additional data throughout, but one of the priority regions we identified are the areas flanking mid-ocean ridges, which should help to set targets for future exploration in a post-high seas treaty era (Gjerde et al., 2021). However, on the whole, predicting climate velocities is an area of active research and therefore these priorities should all be re-visited and updated as new IPCC projections are released in future years.
Future efforts for exploration need to be thoughtfully targeted given limited resources (Bell et al., 2022). Future prioritization will focus new fieldwork efforts and new data collection in areas with the fewest records and effort to-date, although this is not the only path to addressing existing data gaps. Large quantities of biodiversity data remain hidden and unpublished within institutions, or linger behind when only subsets of the data (e.g., for specific taxa) get published (Chavan and Ingwersen, 2009). These non-public or underutilized data can be rescued to help fill some of these gaps comparatively inexpensively and on an accelerated timeline because no field work is required. Although these types of rescue efforts are labor intensive and require new injection of funding into old projects, they are a valuable source of baseline data and insight into the past. In short, data gaps can be filled via a) new effort, and/or via b) rescue efforts of hidden or forgotten raw data that can be revived, mined, or utilized for a new purpose. However, at the same time, existing data quality in explored regions is still sufficient to start enabling ocean protection, management, and insight into biological processes even though these data sets are incomplete. Given this caveat, inference and the precautionary principle can be used in order to make progress. Achieving truly comprehensive data and a fully explored ocean is unattainable in a short time frame, but focused and prioritized efforts can make disproportionately large contributions to our understanding of the ocean if we take into account data scarcity and data need.
Data availability statement
Several publicly available datasets were analyzed in this study. The biodiversity datasets analyzed for this study can be found in at OBIS.org. The climate velocity analysis data is hosted on Zenodo by the original authors https://doi.org/10.5281/Zenodo.3596584. Previous dive locations are available on Zenodo https://zenodo.org/records/10038353.
Author contributions
BK and RR jointly conceived of the project. BK did the primary analysis. Both authors contributed to the drafting and editing of the manuscript. All authors contributed to the article and approved the submitted version.
Funding
This work was made possible with funding from NOAA’s Office of Ocean Exploration through a partnership with the University Corporation for Atmospheric Research through grant numbers SUBAWD002610 and SUBAWD00248.
Acknowledgments
The authors would like to thank the OBIS team for the tireless work to integrate disparate datasets keep OBIS up and running. We would also like to acknowledge all the individual researchers who have gone the extra mile to share their data with the rest of us. We also like to thank the following individuals for their assistance in collecting metadata for the deep submergence asset deployments; Corinne Bassin and Allison Miller (SOI), Bruce Robinson (MBARI), Olivier Soubigou (IFREMER), Malcom Clark, David Bowden and Kevin Mackay (NIWA), Dhugal Lindsay and Yamakita Takehisa (JAMSTEC), Kerry Howell (NERC) and Karen HIssmann and Inken Suck (GEOMAR).
Conflict of interest
The authors declare that the research was conducted in the absence of any commercial or financial relationships that could be construed as a potential conflict of interest.
Publisher’s note
All claims expressed in this article are solely those of the authors and do not necessarily represent those of their affiliated organizations, or those of the publisher, the editors and the reviewers. Any product that may be evaluated in this article, or claim that may be made by its manufacturer, is not guaranteed or endorsed by the publisher.
Supplementary material
The Supplementary Material for this article can be found online at: https://www.frontiersin.org/articles/10.3389/fmars.2023.1219799/full#supplementary-material
References
Amon D. J., Rotjan R. D., Kennedy B. R., Alleng G., Anta R., Aram E., et al. (2022). My Deep Sea, My Backyard: a pilot study to build capacity for global deep-ocean exploration and research. Philos. Trans. R. Soc. B 377, 20210121. doi: 10.1098/rstb.2021.0121
Angel M. V. (1993). Biodiversity of the pelagic ocean. Conserv. Biol. 7, 760–772. doi: 10.1046/j.1523-1739.1993.740760.x
Ausubel J. H., Trew Crist D., Waggoner P. E. (2010). First Census of Marine Life 2010: Highlights of a decade of discovery. Census Mar. Life Int. Secretariat.
Baker M., Hilario A., Sharman H., Howell K. (2021). Challenger 150-a decade to study deep-sea life. Environ. Coast. Offshore, 116–119. Available at: http://digital.ecomagazine.com/publication/frame.php?i=707374&p=&pn=&ver=html5&view=articleBrowser&article_id=4031952/
Bell K. L. C., Quinzin M. C., Amon D., Poulton S., Hope A., Sarti O., et al. (2023). Exposing inequities in deep-sea exploration and research: results of the 2022 Global Deep-Sea Capacity Assessment. Frontiers in Marine Science. Available at: https://www.frontiersin.org/articles/10.3389/fmars.2023.1217227/full.
Boyce D. G., Tittensor D. P., Garilao C., Henson S., Kaschner K., Kesner-Reyes K., et al. (2022). A climate risk index for marine life. Nat. Climate Change 12, 854–862. doi: 10.1038/s41558-022-01437-y
Brito-Morales I., Schoeman D. S., Molinos J. G., Burrows M. T., Klein C. J., Arafeh-Dalmau N., et al. (2020). Climate velocity reveals increasing exposure of deep-ocean biodiversity to future warming. Nat. Climate Change 10, 576–581. doi: 10.1038/s41558-020-0773-5
Burrows M. T., Schoeman D. S., Buckley L. B., Moore P., Poloczanska E. S., Brander K. M., et al. (2011). The pace of shifting climate in marine and terrestrial ecosystems. Science 334, 652–655. doi: 10.1126/science.1210288
Canadell J. G., Le Quéré C., Raupach M. R., Field C. B., Buitenhuis E. T., Ciais P., et al. (2007). Contributions to accelerating atmospheric CO2 growth from economic activity, carbon intensity, and efficiency of natural sinks. Proc. Natl. Acad. Sci. 104, 18866–18870. doi: 10.1073/pnas.0702737104
Ceballos G., Ehrlich P. R., Barnosky A. D., García A., Pringle R. M., Palmer T. M. (2015). Accelerated modern human–induced species losses: Entering the sixth mass extinction. Sci. Adv. 1 (5), e1400253. doi: 10.1126/sciadv.1400253
Chavan V. S., Ingwersen P. (2009). Towards a data publishing framework for primary biodiversity data: challenges and potentials for the biodiversity informatics community. BMC Bioinf. 10, 1–11. doi: 10.1186/1471-2105-10-S14-S2
Costello M. J., Chaudhary C. (2017). Marine biodiversity, biogeography, deep-sea gradients, and conservation. Curr. Biol. 27, R511–R527. doi: 10.1016/j.cub.2017.06.015
Costello M. J., Tsai P., Wong P. S., Cheung A. K. L., Basher Z., Chaudhary C. (20171057). Marine biogeographic realms and species endemicity. Nat. Commun. 8. doi: 10.1038/s41467-017-01121-2
Drazen J. C., Smith C. R., Gjerde K. M., Haddock S. H., Carter G. S., Choy C. A., et al. (2020). Midwater ecosystems must be considered when evaluating environmental risks of deep-sea mining. Proc. Natl. Acad. Sci. 117, 17455–17460. doi: 10.1073/pnas.2011914117
Fedotova G., Sotnikova L., Orlova E., Baranova A., Goncharova A. (2021). “Global problems of biodiversity and food security,” in IOP Conference Series: Earth and Environmental Science. 032010 (IOP Publishing). Available at: https://iopscience.iop.org/article/10.1088/1755-1315/677/3/032010.
Flanders Marine Institute (2019). Maritime boundaries geodatabase: maritime boundaries and exclusive economic zones (200NM), version 11. Available online at https://www.marineregions.org/.
Gjerde K. M., Wright G., Durussel C., Gjerde K. M., Wright G. (2021). Strengthening high seas governance through enhanced environmental assessment processes: A case study of mesopelagic fisheries and options for a future BBNJ treaty. STRONG High Seas Project. doi: 10.48440/iass.2021.001
Gomes-Pereira J. N., Auger V., Beisiegel K., Benjamin R., Bergmann M., Bowden D., et al. (2016). Current and future trends in marine image annotation software. Prog. Oceanography 149, 106–120. doi: 10.1016/j.pocean.2016.07.005
Grabarz T. L. (2009). Biodiversity, factor endowments and national security: the next great game? NAVAL WAR Coll. NEWPORT RI. Available at: https://apps.dtic.mil/sti/citations/ADA602910
Gruber N., Clement D., Carter B. R., Feely R. A., Van Heuven S., Hoppema M., et al. (2019). The oceanic sink for anthropogenic CO2 from 1994 to 2007. Science 363, 1193–1199. doi: 10.1126/science.aau5153
Halpern B. S., Frazier M., Afflerbach J., Lowndes J. S., Micheli F., O’hara C., et al. (2019). Recent pace of change in human impact on the world’s ocean. Sci. Rep. 9, 11609. doi: 10.1038/s41598-019-47201-9
Heip C., Hummel H., Van Avesaath P., Appeltans W., Arvanitidis C., Aspden R., et al. (2009). Marine Biodiversity and Ecosystem Functioning. (Dublin, Ireland: Printbase)
Hendriks I. E., Duarte C. M., Heip C. H. (2006). Biodiversity research still grounded. Science. 312 (5781), 1715–1715. doi: 10.1126/science.1128548
Hughes A. C., Orr M. C., Ma K., Costello M. J., Waller J., Provoost P., et al. (2021). Sampling biases shape our view of the natural world. Ecography 44, 1259–1269. doi: 10.1111/ecog.05926
IPBES (2022). Thematic Assessment Report on the Sustainable Use of Wild Species of the Intergovernmental Science-Policy Platform on Biodiversity and Ecosystem Services. Fromentin J. M., Emery M. R., Donaldson J., Danner M. C., Hallosserie A., Kieling D. (eds.). (Bonn, Germany: IPBES secretariat). Available at: https://doi.org/10.5281/zenodo.6448567.
Kennedy B. R. C., Cantwell K., Malik M., Kelley C., Potter J., Elliott K., et al. (2019). The unknown and the unexplored: insights into the pacific deep-sea following NOAA CAPSTONE expeditions. Front. Mar. Sci. 6. doi: 10.3389/fmars.2019.00480
Klein E., Appeltans W., Provoost P., Saeedi H., Benson A., Bajona L., et al. (2019). OBIS infrastructure, lessons learned, and vision for the future. Front. Mar. Sci. 6, 588. doi: 10.3389/fmars.2019.00588
Kot C. Y., Fujioka E., Hazen L. J., Best B. D., Read A. J., Halpin P. N. (2010). Spatio-temporal gap analysis of OBIS-SEAMAP project data: assessment and way forward. PloS One 5, e12990. doi: 10.1371/journal.pone.0012990
Kunzig R. (2003). Deep-sea biology: living with the endless frontier. Science 302, 991–991. doi: 10.1126/science.1090808
Longhurst A. R. (1985). The structure and evolution of plankton communities. Prog. Oceanography 15, 1–35. doi: 10.1016/0079-6611(85)90036-9
Longhurst A. R. (2006). Ecological Geography of the Sea. 2nd Edition. (San Diego: Academic Press), 560p.
Mora C., Tittensor D. P., Adl S., Simpson A. G., Worm B. (2011). How many species are there on Earth and in the ocean? PloS Biol. 9, e1001127.
Netburn A. N., Ford M., Lindsay D. (2018). 2017 midwater exploration on Okeanos explorer (ROCKVILLE, MD USA: OCEANOGRAPHY SOC PO BOX 1931).
NOAA National Centers for Environmental Information. (2022). ETOPO 2022 15 Arc-Second Global Relief Model. NOAA National Centers for Environmental Information. doi: 10.25921/fd45-gt74.
Pebesma E. J. (2018). Simple features for R: standardized support for spatial vector data. R J. 10, 439. doi: 10.32614/RJ-2018-009
Pörtner H.-O., Roberts D. C., Poloczanska E., Mintenbeck K., Tignor M., Alegría A., et al. (2022). IPCC, 2022: Summary for policymakers. Available at: https://edoc.unibas.ch/91322/.
Raffaelli D., Solan M., Webb T. J. (2005). Do marine and terrestrial ecologists do it differently? Mar. Ecol. Prog. Ser. 304, 283–289.
Ramirez-Llodra E., Brandt A., Danovaro R., De Mol B., Escobar E., German C. R., et al. (2010). Deep, diverse and definitely different: unique attributes of the world's largest ecosystem. Biogeosciences 7, 2851–2899. doi: 10.5194/bg-7-2851-2010
Richardson A. J., Poloczanska E. S. (2008). Under-resourced, under threat. Am. Assoc. Advancement Sci. 320 (5881), 1294–1295. doi: 10.1126/science.1156129
Riser S. C., Johnson K. S. (2008). Net production of oxygen in the subtropical ocean. Nature 451, 323–325. doi: 10.1038/nature06441
Robison B. H. (2004). Deep pelagic biology. J. Exp. Mar. Biol. Ecol. 300, 253–272. doi: 10.1016/j.jembe.2004.01.012
Robison B. H. (2009). Conservation of deep pelagic biodiversity. Conserv. Biol. 23, 847–858. doi: 10.1111/j.1523-1739.2009.01219.x
Rosel P. E., Wilcox L. A., Yamada T. K., Mullin K. D. (2021). A new species of baleen whale (Balaenoptera) from the Gulf of Mexico, with a review of its geographic distribution. Mar. Mammal Sci. 37, 577–610. doi: 10.1111/mms.12776
Rowden A. A., Schlacher T. A., Williams A., Clark M. R., Stewart R., Althaus F., et al. (2010). A test of the seamount oasis hypothesis: seamounts support higher epibenthic megafaunal biomass than adjacent slopes. Mar. Ecol. 31, 95–106. doi: 10.1111/j.1439-0485.2010.00369.x
Ryabinin V., Barbière J., Haugan P., Kullenberg G., Smith N., Mclean C., et al. (2019). The UN decade of ocean science for sustainable development. Front. Mar. Sci. 6, 470. doi: 10.3389/fmars.2019.00470
Sabine C. L., Feely R. A. (2007). The oceanic sink for carbon dioxide. In: Reay D., Hewitt N., Grace J., Smith K., editors. Greenhouse Gas Sinks. (Oxfordshire, UK: CABI Publishing), pp. 31–49.
Sutton T. T., Clark M. R., Dunn D. C., Halpin P. N., Rogers A. D., Guinotte J., et al. (2017). A global biogeographic classification of the mesopelagic zone. Deep Sea Res. Part I: Oceanographic Res. Papers 126, 85–102.
Talukder B., Ganguli N., Matthew R., Hipel K. W., Orbinski J. (2022). Climate change-accelerated ocean biodiversity loss & associated planetary health impacts. J. Climate Change Health 6, 100114. doi: 10.1016/j.joclim.2022.100114
Thurber A. R., Sweetman A. K., Narayanaswamy B. E., Jones D. O. B., Ingels J., Hansman R. L. (2014). Ecosystem function and services provided by the deep sea. Biogeosciences 11, 3941–3963. doi: 10.5194/bg-11-3941-2014
Tippett S., Jenkyns R., Macarthur M., Button M., Wei T. (2022). “Remote operating vehicle observation data contributions to the ocean biodiversity information system,” in OCEANS 2022 (Hampton Roads: IEEE), 1–7.
Tittensor D. P., Mora C., Jetz W., Lotze H. K., Ricard D., Berghe E. V., et al. (2010). Global patterns and predictors of marine biodiversity across taxa. Nature 466, 1098–1101. doi: 10.1038/nature09329
Veron J. E., Devantier L. M., Turak E., Green A. L., Kininmonth S., Stafford-Smith M., et al. (2009). Delineating the coral triangle. Galaxea J. Coral Reef Stud. 11, 91–100. doi: 10.3755/galaxea.11.91
Watling L., Guinotte J., Clark M. R., Smith C. R. (2013). A proposed biogeography of the deep ocean floor. Prog. Oceanography 111, 91–112. doi: 10.1016/j.pocean.2012.11.003
Webb T. J. (2009). Biodiversity research sets sail: showcasing the diversity of marine life. Biol. Lett., 5145–147.
Webb T. J., Vanden Berghe E., O'dor R. (2010). Biodiversity's big wet secret: the global distribution of marine biological records reveals chronic under-exploration of the deep pelagic ocean. PloS One 5, e10223. doi: 10.1371/journal.pone.0010223
Weigmann S., Gon O., Leeney R. H., Barrowclift E., Berggren P., Jiddawi N., et al. (2020). Revision of the sixgill sawsharks, genus Pliotrema (Chondrichthyes, Pristiophoriformes), with descriptions of two new species and a redescription of P. warreni Regan. PloS One 15, e022879. doi: 10.1371/journal.pone.0228791
Keywords: ocean exploration, biodiversity, biogeography, deep-sea, global change
Citation: Kennedy BRC and Rotjan RD (2023) Mind the gap: comparing exploration effort with global biodiversity patterns and climate projections to determine ocean areas with greatest exploration needs. Front. Mar. Sci. 10:1219799. doi: 10.3389/fmars.2023.1219799
Received: 09 May 2023; Accepted: 16 October 2023;
Published: 23 November 2023.
Edited by:
Leila J. Hamdan, University of Southern Mississippi, United StatesReviewed by:
Michael Vecchione, National Oceanic and Atmospheric Administration (NOAA), United StatesCarolyn J. Lundquist, National Institute of Water and Atmospheric Research (NIWA), New Zealand
Copyright © 2023 Kennedy and Rotjan. This is an open-access article distributed under the terms of the Creative Commons Attribution License (CC BY). The use, distribution or reproduction in other forums is permitted, provided the original author(s) and the copyright owner(s) are credited and that the original publication in this journal is cited, in accordance with accepted academic practice. No use, distribution or reproduction is permitted which does not comply with these terms.
*Correspondence: Brian R. C. Kennedy, S2VubmVkeUJAYnUuZWR1