 María Esther Leyva Ollivier
 Alice Newton
 Heath Kelsey
- 1Murray Foundation, c/o Brabners LLP, Liverpool, United Kingdom
- 2CIMA - ARNET, Centre for Marine and Environmental Research, University of Algarve, Faro, Portugal
- 3University of Maryland Center for Environmental Science, Cambridge, MA, United States
This study is a social-ecological analysis of eutrophication in the Chesapeake Bay, United States of America (USA). It uses an expanded DPSIR framework (Drivers/Pressures/State/ Impacts/Responses) methodology to analyze the issue. In addition, a typology of the social actors and stakeholders in the socio-economic part of the system is identified. These stakeholders include residents, agriculturists, fishers, real estate developers, tourism operators, scientific researchers, and state and federal regulators. The framework results found that the Drivers are food security, housing, economic development, recreation pursuits, a sense of belonging, and population growth. These result in human Activities such as land and coastal change for development, coastline changes for fisheries, urban or suburban development, burning fossil fuels, and agricultural fertilization. The activities exert Pressures such as wastewater discharge, runoff from cleared land, atmospheric deposition (NOx), nutrient input, decreased tidal vegetation, and overfishing of filter feeders. These alterations change the State of the environment and its resilience by increasing the duration and areal extent of hypoxia, turbidity, and change in nutrient ratios. This also causes ecosystem changes, such as a decrease in wildlife diversity, and affects ecosystem services, such as decreasing nutrient buffering. The health of Chesapeake Bay benefits all stakeholders and wildlife, so the reduction of ecosystem services results in Impacts on society’s welfare and well-being, the economy, and environmental justice. Examples are decreased fishery yields and poorer water quality, affecting aesthetics, tourism, and ultimately human health. The governance Response to the degradation of the Chesapeake Bay and main management Measures has been the formation of the Chesapeake Bay Program, which has developed several agreements to improve water quality. The Chesapeake Bay Foundation, Chesapeake Progress, and Report Cards are accountability tools to observe and communicate the management project results or enforce state laws. The current management shows promising results, but further efforts are required to improve the water quality. Using various management options may bridge this gap to benefit all stakeholders. The main conclusion is that, although eutrophication is a complex problem, there is a scientific knowledge-base and a range of management options to restore the Chesapeake Bay.
1 Introduction
Cultural eutrophication is excessive plant growth resulting from nutrient enrichment by human activity and is one of the primary problems facing most surface waters today (Glibert et al., 2005). The widespread development of coastal eutrophication is primarily driven by increased fluxes of nitrogen (N) and phosphorus (P) from the land to the coasts (Paerl et al., 2014). One of the results of this process is hypoxia, which occurs when dissolved oxygen is depleted to a certain low level and an aquatic organism, especially benthic fauna, becomes stressed or dies due to the lack of oxygen (Du et al., 2018). Vaquer-Sunyer and Duarte (2008) analyze the threshold of dissolved oxygen at which a system is considered hypoxic and found it to be approximately 2 milligrams of oxygen per liter of water. By the early to mid-1970s, nutrient-induced increases in algal production and biomass were being reported for several coastal marine ecosystems (Kemp et al., 2005; Bricker et al., 2008), including the Chesapeake Bay.
The Chesapeake Bay is the largest estuary in the USA and one of the most studied in the world (Arnold et al., 2021). The estuary is a unique ecosystem covering 6,100 km2, fed by more than 100 rivers and thousands of tributary streams (Goetz et al., 2004). The Bay is naturally a highly productive estuary that receives a large flux of nutrients from its Watershed that covers an area of approximately 167,000 km2 within six states in the USA: Delaware, Maryland, New York, Pennsylvania, Virginia, and West Virginia, as well as the Federal District of Columbia (Boesch et al., 2001; Testa et al., 2017; Frankel et al., 2022; McLaughlin et al., 2022).
The natural ecosystem started to change in the mid-1800s, when the basin was continuously deforested, resulting in more nutrients beginning to wash down into the Bay (Kemp et al., 2005; McLeod and Leslie, 2012). After World War II, industrialization increased pollution, overexploited filter feeder species, and replaced fallow farming with fertilizers (Kemp et al., 2005; Boesch, 2006; Frankel et al., 2022). However, the ecosystem degradation went unnoticed until the later part of the twentieth century, when large portions of the Chesapeake Bay experienced extensive, seasonal hypoxia (Kemp et al., 2005; Boesch, 2006; Arnold et al., 2021; Frankel et al., 2022).
In response to the visible ecosystem decline, management efforts to restore ecosystem health began in 1976 (Frankel et al., 2022). Since then, several written agreements have guided the government’s efforts to reduce pollution and restore the ecosystem. These are led by the Chesapeake Bay Program (CBP) (Hood et al., 2021; CBP-Accomplishments, 2023; CBP-Who, 2023). In 2010, a total maximum daily load (TMDL) was put in place to reduce nutrient pollution from point and nonpoint sources (Frankel et al., 2022).
Frankel et al. (2022) demonstrated that nutrient reduction has improved the ecosystem and reduced pollution. However, hypoxia is still one of the main issues in the water quality of Chesapeake Bay (Boesch, 2006; Phillips and McGee, 2016; Frankel et al., 2022). In addition, there is a very public debate concerning the amount of nutrient reduction and the lack of expected results, which can also be linked to climate change (Boesch, 2006; Du et al., 2018; Frankel et al., 2022).
Therefore, the management of the Chesapeake Bay has become complex due to the socio-ecological interactions that have occurred over the years. This study uses a holistic approach, considering the environmental, economic, and social impacts of eutrophication in the Watershed and Chesapeake Bay regions. The main objective is to better understand the source, causes, and consequences of eutrophication for managers, decision-makers, and policymakers to support and modify management measures to improve the ecosystem health and wealth of the Chesapeake Bay.
2 Methods
2.1 Study area
The Chesapeake Bay Watershed is located in the USA’s mid-Atlantic coastal region (Figure 1) (Goetz et al., 2004). The Bay is approximately 35 km long on an axis from north and south. Meanwhile, the width varies from 20 km in its mouth to 45 km in the middle and a few in the upper (Garzon et al., 2018). Five major rivers cover the Watershed: Susquehanna, Potomac, Rappahannock, York, and James (Du and Shen, 2017).
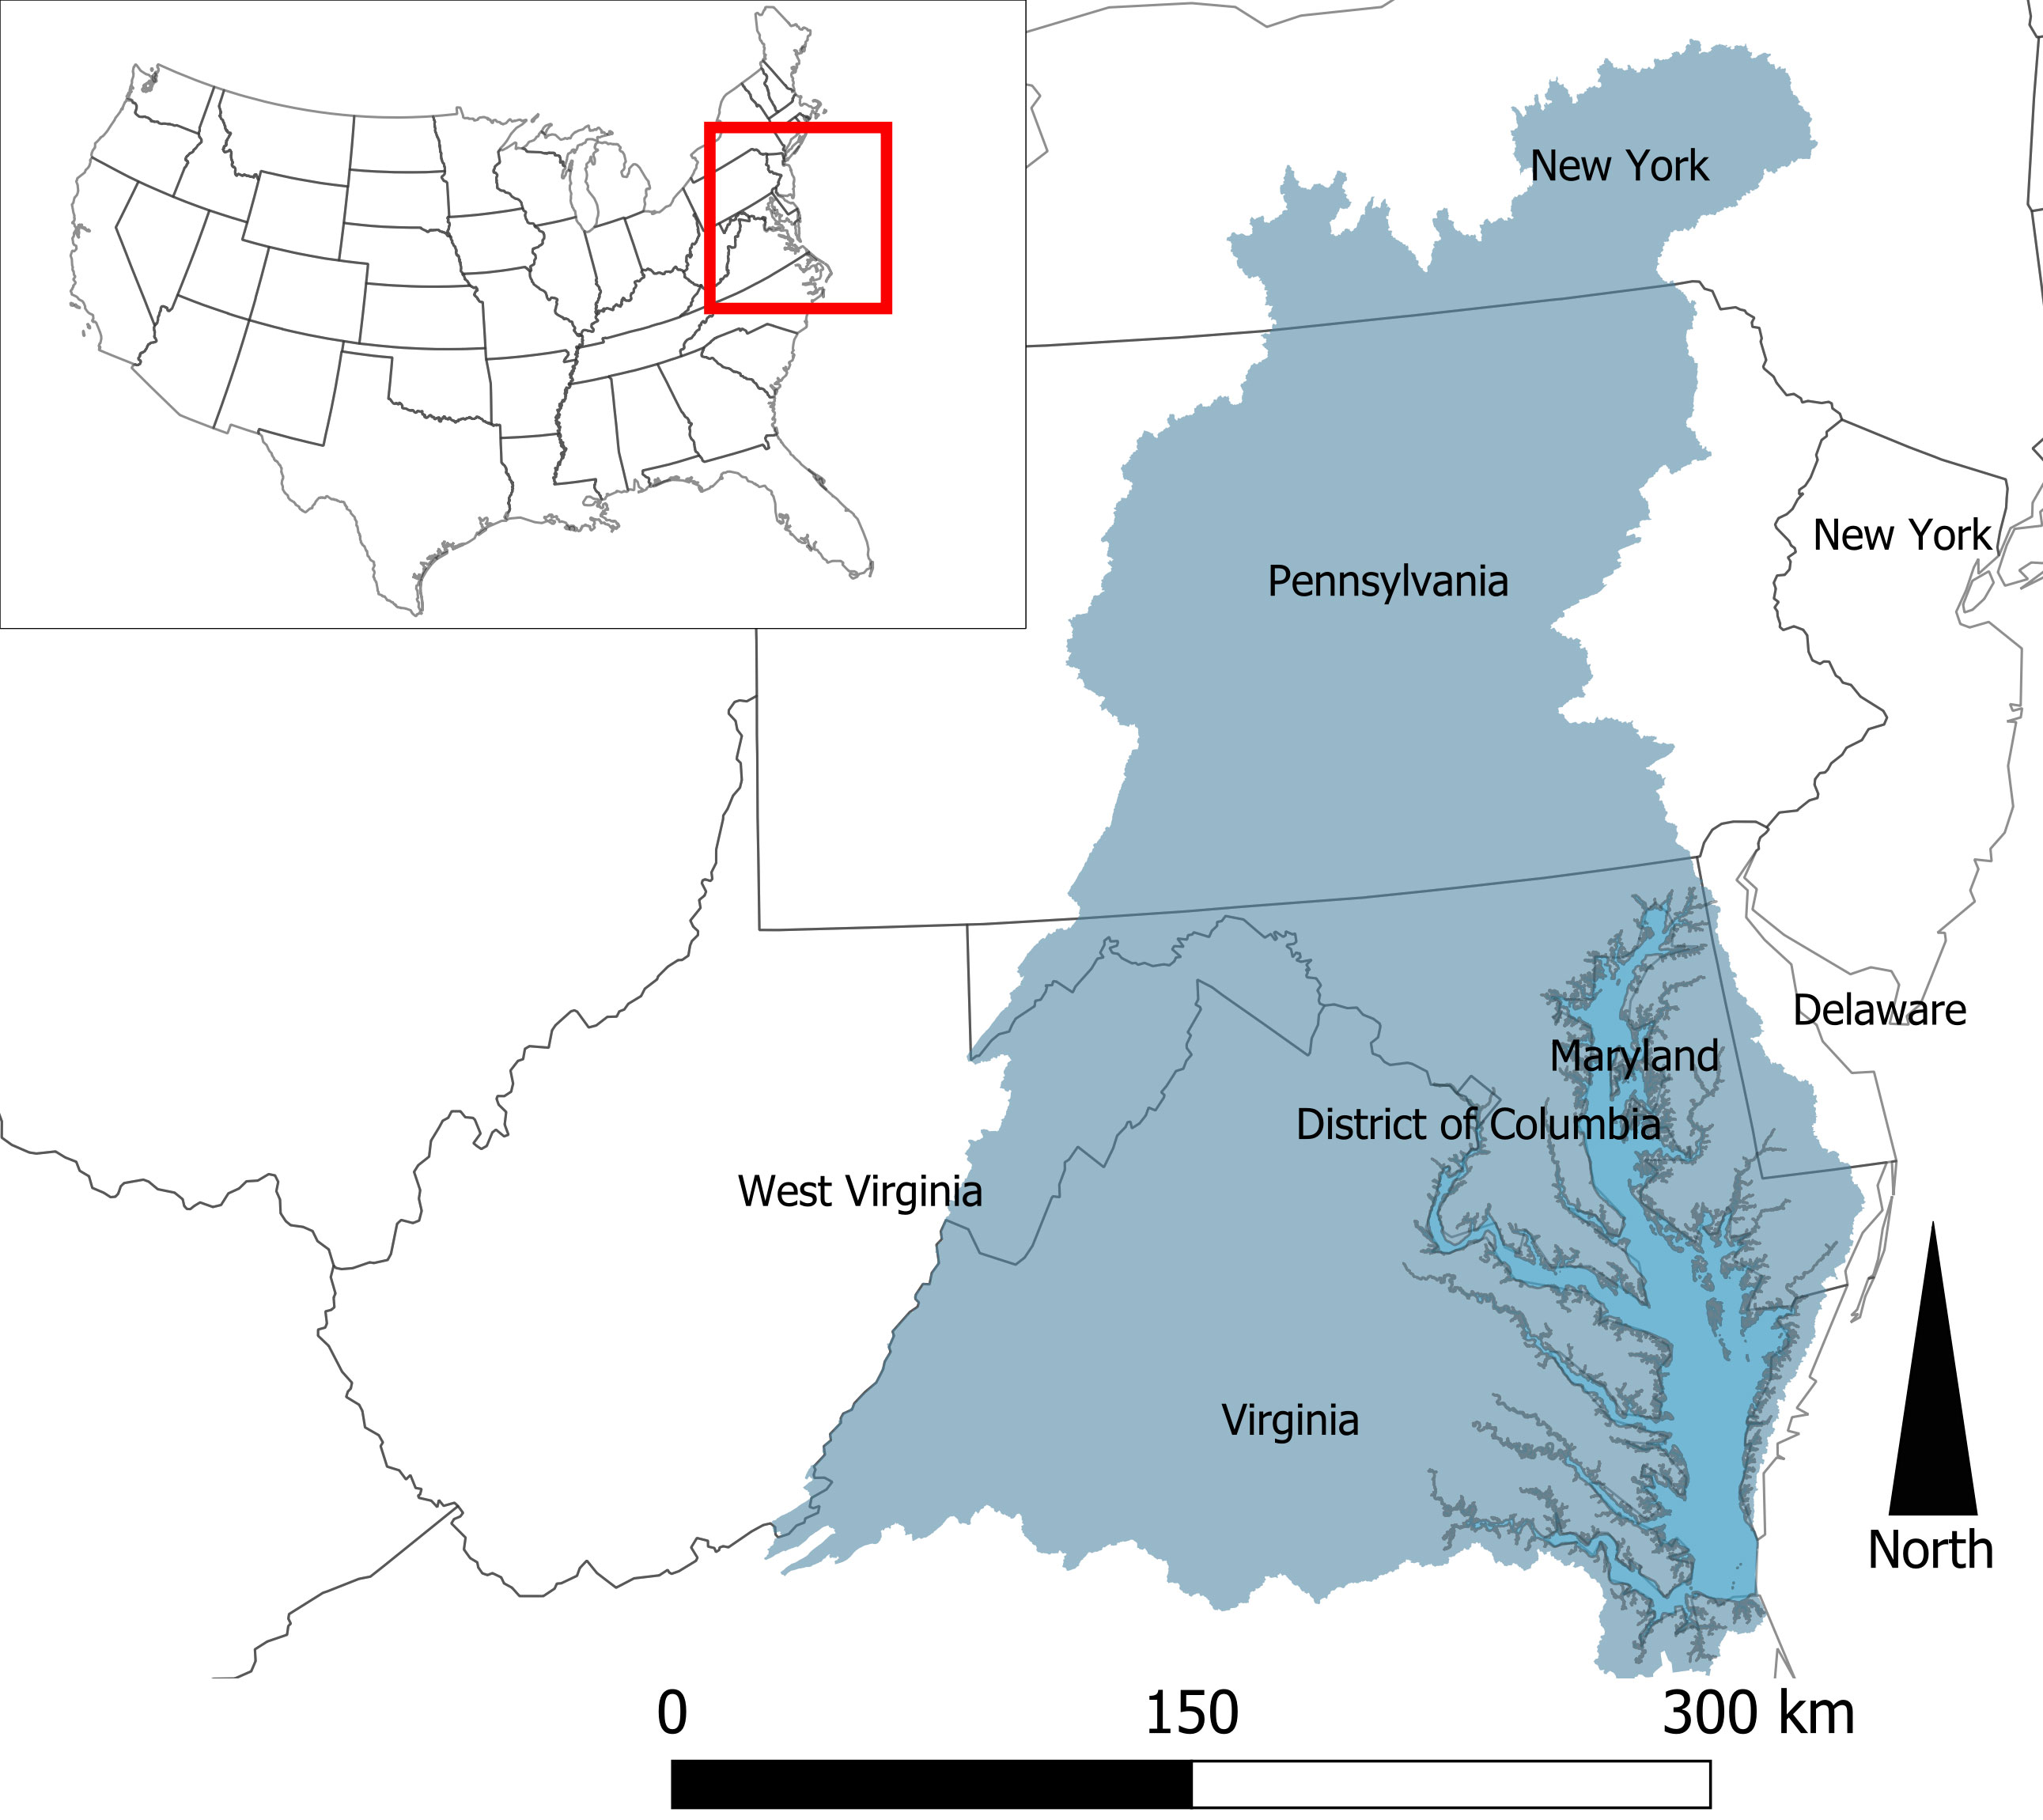
Figure 1 Chesapeake Bay Watershed boundaries and location in the USA.
The socio-economic region is defined by six states and the District of Columbia. The Watershed extends into New York State in the north and contains half of Pennsylvania, most of Virginia and Maryland, parts of Delaware and West Virginia, and the whole District of Columbia (Arnold et al., 2021). The land use within the Watershed is diverse. Industrial and high-density urban development is on the west side of the Bay. Meanwhile, commercial agriculture dominates the eastern shore (DeLuca et al., 2004). Population growth is occurring near the coast and in the two bigger rivers, the Susquehanna and the Potomac (CBF-Population, 2023).
The water input from the rivers and the Atlantic Ocean set up a strong stratification, which creates long resident times for fresh water and nutrients (Kemp et al., 2005). An average of 2,300 m3/s of freshwater flows from the Watershed into its 74.4 km3 water volume, with the Susquehanna providing ~50% of the flow. The Susquehanna significantly affects the stratification, sedimentation, nutrient levels, dissolved oxygen, and pollution of the Bay (Kemp et al., 2005; Du and Shen, 2017). The high stratification, long resident time, and geometry of the Bay make this a productive system, with efficient nutrient use and a tendency for depletion of oxygen (Kemp et al., 2005).
2.2 Socio-ecological assessment framework
One of the tools to identify the management of a socio-ecological system like the Chesapeake Bay Watershed eutrophication is the driver–pressure–state–impact–response (DPSIR). The framework reports and analyzes environmental problems to identify barriers and develop holistic management responses (Carr et al., 2007; Elliott et al., 2017). Elliott (2014) and Smyth et al. (2015) modified the framework to address perceived issues (Gari et al., 2015), expanding the structure to become DAPSI(W)R(M) (Elliott et al., 2017) which stands for drivers–activities–pressures–state of change–impact (on human welfare)–responses (as measures).
Elliott et al. (2017) defined the drivers as “the basic human needs” based on the early work of Maslow (1943). Maslow (1943) proposed a pyramid with the human needs of an individual as a five-tier hierarchical structure. The first two hierarchies are related to survival and safety (e.g., food, air, water, and protection from nature or predators). The third and fourth hierarchies are related to physiological needs (e.g., love, sense of belonging, and self-esteem). These first four levels are referred to as “deficiency needs” because the individual will be motivated to satisfy them. The fifth and last hierarchy is self-fulfillment, which relates more to the need for self-actualization (Maslow, 1943; Elliott et al., 2017).
The drivers lead to human activities to satisfy human necessities. The activities used in the framework are related to actions that introduce pressures on the natural ecosystem. These pressures change the state’s natural system, leading to impacts on human welfare. Finally, the impact requires responses (as measures) (Elliott et al., 2017). The expanded framework has been applied in a variety of coastal issues and environments, as well as the river mouth system such as the “Magdalena delta” (Gallo-Vélez et al., 2022).
2.3 Stakeholders’ typology
The social actors and stakeholders of the socio-ecological system were defined according to the Newton and Elliott (2016) typology, which classifies the actors according to their roles in the system. The typology includes six types of stakeholders. “Inputters” create pressures, such as contaminants or fertilizers. “Extractors” develop activities like fishing or water extraction. “Beneficiaries” receive the benefits for their needs; the drivers, the extractors, and inputters. “Affectees” suffer an impact on human welfare because of the degradation of the system. “Regulators” are administrative bodies with legislative competency that implement the management responses as measures. “Influencers,” are the stakeholders concern about the state of natural systems that can influence change, such as scientists, researchers, teachers, nongovernmental organizations (NGOs), and the media (Newton and Elliott, 2016).
2.4 Information sources
The Chesapeake Bay is a complex socio-ecological system with a background of extensive research and management, resulting in a vast body of complex, interrelated information. A comprehensive literature review with all the current quantitative and qualitative information on eutrophication was developed. Table 1 summarizes the quantitative sources. The qualitative sources are shown in the Results section.
Table 1 Quantitative indicators to assess the eutrophication.
Most of the quantitative information was taken directly from the sources and adapted for visual representation in this article. One of the primary sources of information is the Chesapeake Progress webpage (https://www.chesapeakeprogress.com/). The Chesapeake Progress’s main goal is to have accurate, up-to-date, and accessible information. Therefore, the datasets for nutrients, annual flow, and water quality were taken from this source.
2.4.1 Oyster turnover time
According to Kemp et al. (2005), before the nineteenth century, during the summer months, oysters filtered the water column of the Maryland Portion of the Chesapeake Bay in approximately 3.6 days. In the same study, the calculations of the years 1988 and 2003 turnover time were also made within 228 and 700 days, respectively. The calculation for these numbers was developed using Newell’s (1988) methodology.
For this article, we used the same methodology as Kemp et al. (2005) and Newell (1988), which has the following equation:
TWV represents the total water volume, which according to Newell (1988) is 71.5 × 10¹² L. ΣTo is the sum of the total oyster landing or biomass (million kg of dry tissue) between Maryland and Virginia shores. This value was obtained using sources from oyster in Table 1. Sf is the average summer filtration rate, which according to Newell (1988) is 0.115 L/(kg) (day).
2.4.2 Nutrients
The source of the nitrogen, phosphorus, and suspended sediments has two datasets. Both datasets calculate nutrient loads using river input monitoring (RIM) and numerical models (CP-WIPs, 2023; CP-WQ, 2023). The difference between datasets is the information calculated by the Watershed model Chesapeake Assessment Scenario Tool (CAST). One dataset has general information mainly from the RIM, which considers the wastewater and nonpoint downstream. The numerical model calculates the unmonitored areas and the atmospheric deposition to tidal waters for the nitrogen.
For these data, three different management levels were used to identify the current system state. Shenk and Linker (2013) show different scenarios according to the management level. The no-action scenario estimates nutrient and sediment loads using the 2010 data with no management actions. The TMDL is the current management goal scenario. Finally, the E3 scenario refers to an estimate of the management actions if they could be applied to the fullest without considering cost and physical implementation.
The other dataset also uses monitoring information but calculates the source of nutrient loads. The source sectors for the nitrogen, phosphorus, and suspended sediments are agriculture, development, wastewater, and natural, respectively. Natural refers to the forest, shoreline, stream bed, and wetlands. The septic is also calculated for nitrogen and phosphorus. The atmospheric deposition to the Watershed and to tidal water is also calculated for nitrogen. These data are only available for the years 1985, 2009, 2020, and 2021.
2.4.3 Water quality
The water quality attainment and monitoring is an indicator from the Chesapeake Bay Program (CP-WQ, 2023). The parameters the indicator uses to determine the results are salinity (unitless), water temperature (°C), dissolved oxygen (mg O2/L), secchi depth (m), submerged aquatic vegetation (acreage), in vivo fluorescence, and chlorophyll a measurement (µg/L).
3 Results and discussion
3.1 DAPSI(W)R(M) framework
The application of the DAPSI(W)R(M) framework facilitates the process of identifying current links, structures, and dynamics of the socio-ecological system eutrophication. Table 2 summarizes the representation of the literature review analysis. Table 2 has three divisions: on the right, there is the DAPSI(W)R(M) framework; each row represents a component of the framework; and in parenthesis, there is a small description of the same. The second column is the Chesapeake Bay coastal system management issues linked with eutrophication. The number on the left, in brackets, is a way of representing the link between each row component. Finally, the last columns are the sources where each piece of data was collected.
Table 2 Application of DAPSI(W)R(M) in Chesapeake Bay Watershed eutrophication.
3.1.1 Drivers
Human population growth in the coastal Watershed is a major factor contributing to increased nutrient loading to estuaries worldwide (Smith, 2003; Kemp et al., 2005). The human population in the Chesapeake Bay Watershed is projected to increase by 12% from 2010 to 2025 (Hood et al., 2021). The population is growing close to tidal water and major rivers, with almost two-thirds of the region’s residents living nearly 2 km from the water (Walsh et al., 2019; CBF-Population, 2023). More people mean more food, fertilizers, pesticides, cars, constructions, detergents, and industrial and household waste (Ruark, 2010). The government has not regulated overpopulation because it is seen as a necessity for the economic model (Ruark, 2010). Therefore, the growth will continue, and the increase in other physiological needs will lead to unsustainable degradation and the loss of natural resources and economic benefits.
Physiological needs are not the only human necessities. According to Maslow (1943), there are also psychological and self-fulfillment needs. These particular needs are not associated with the eutrophication issue, but they could be a solution. Involvement in conservation projects could achieve a sense of belongingness, esteem needs, and self-actualization. Public access and outdoor nature are associated with mental well-being, and there is evidence of a link between nature access and mental health with a sense of belonging (Wood et al., 2017).
3.1.2 Activities
The main activities related to human needs in the Chesapeake Bay are land and coastline change for industrial agriculture, fisheries, and development (Figures 2, 3). The need for food security increases the use of fertilization and pesticides; the urban/suburban development has increased the burning of fossil fuels and wastewater around the region; and the fishing industry has depleted the region of key filter species and habitats.
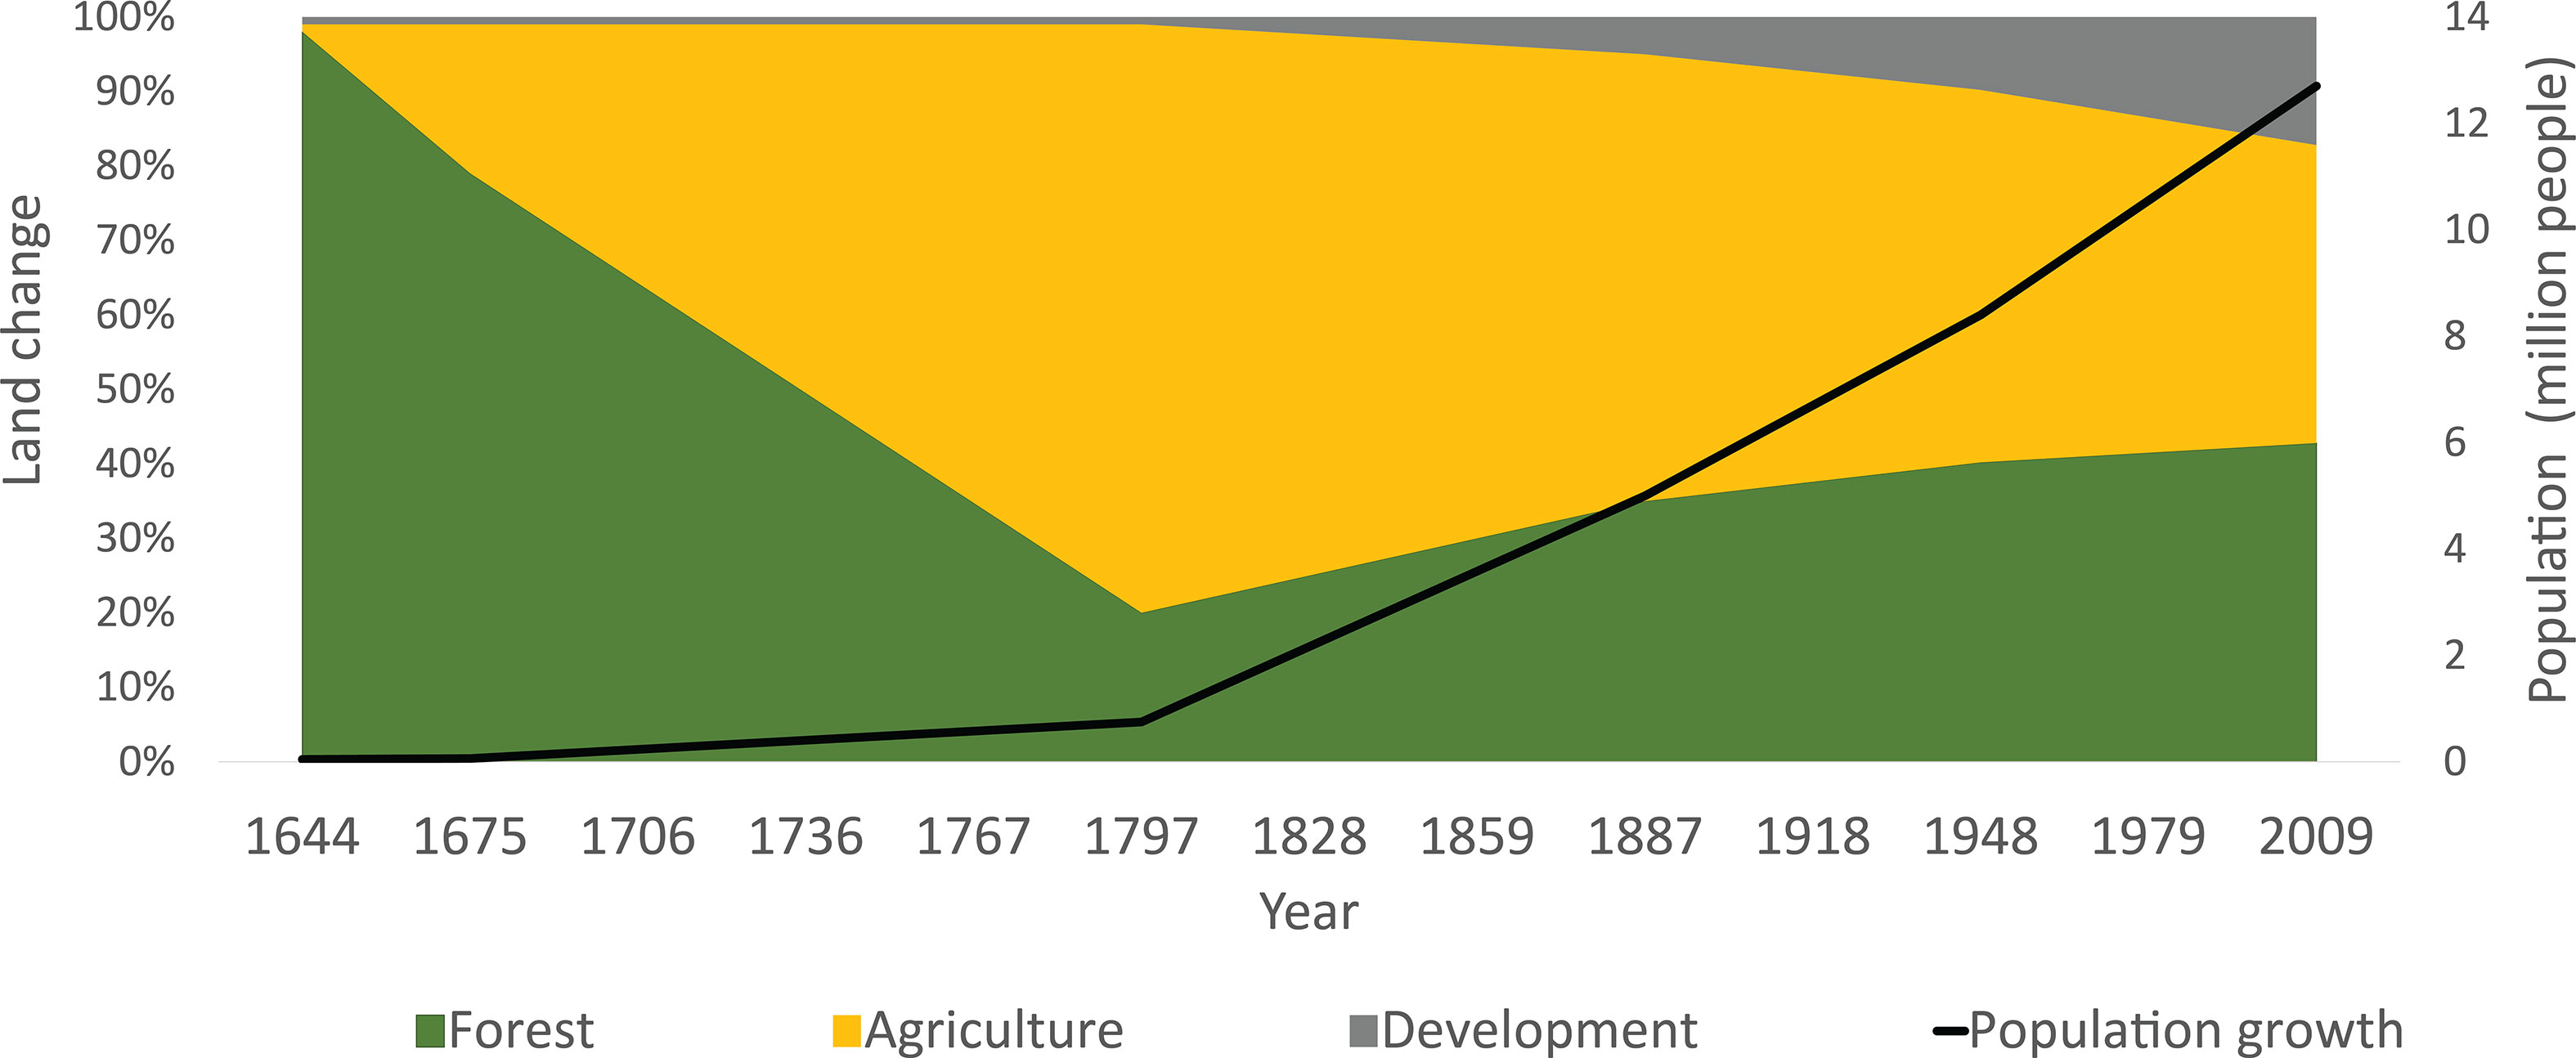
Figure 2 Land-change activities and human population growth over time in Chesapeake Bay Watershed.
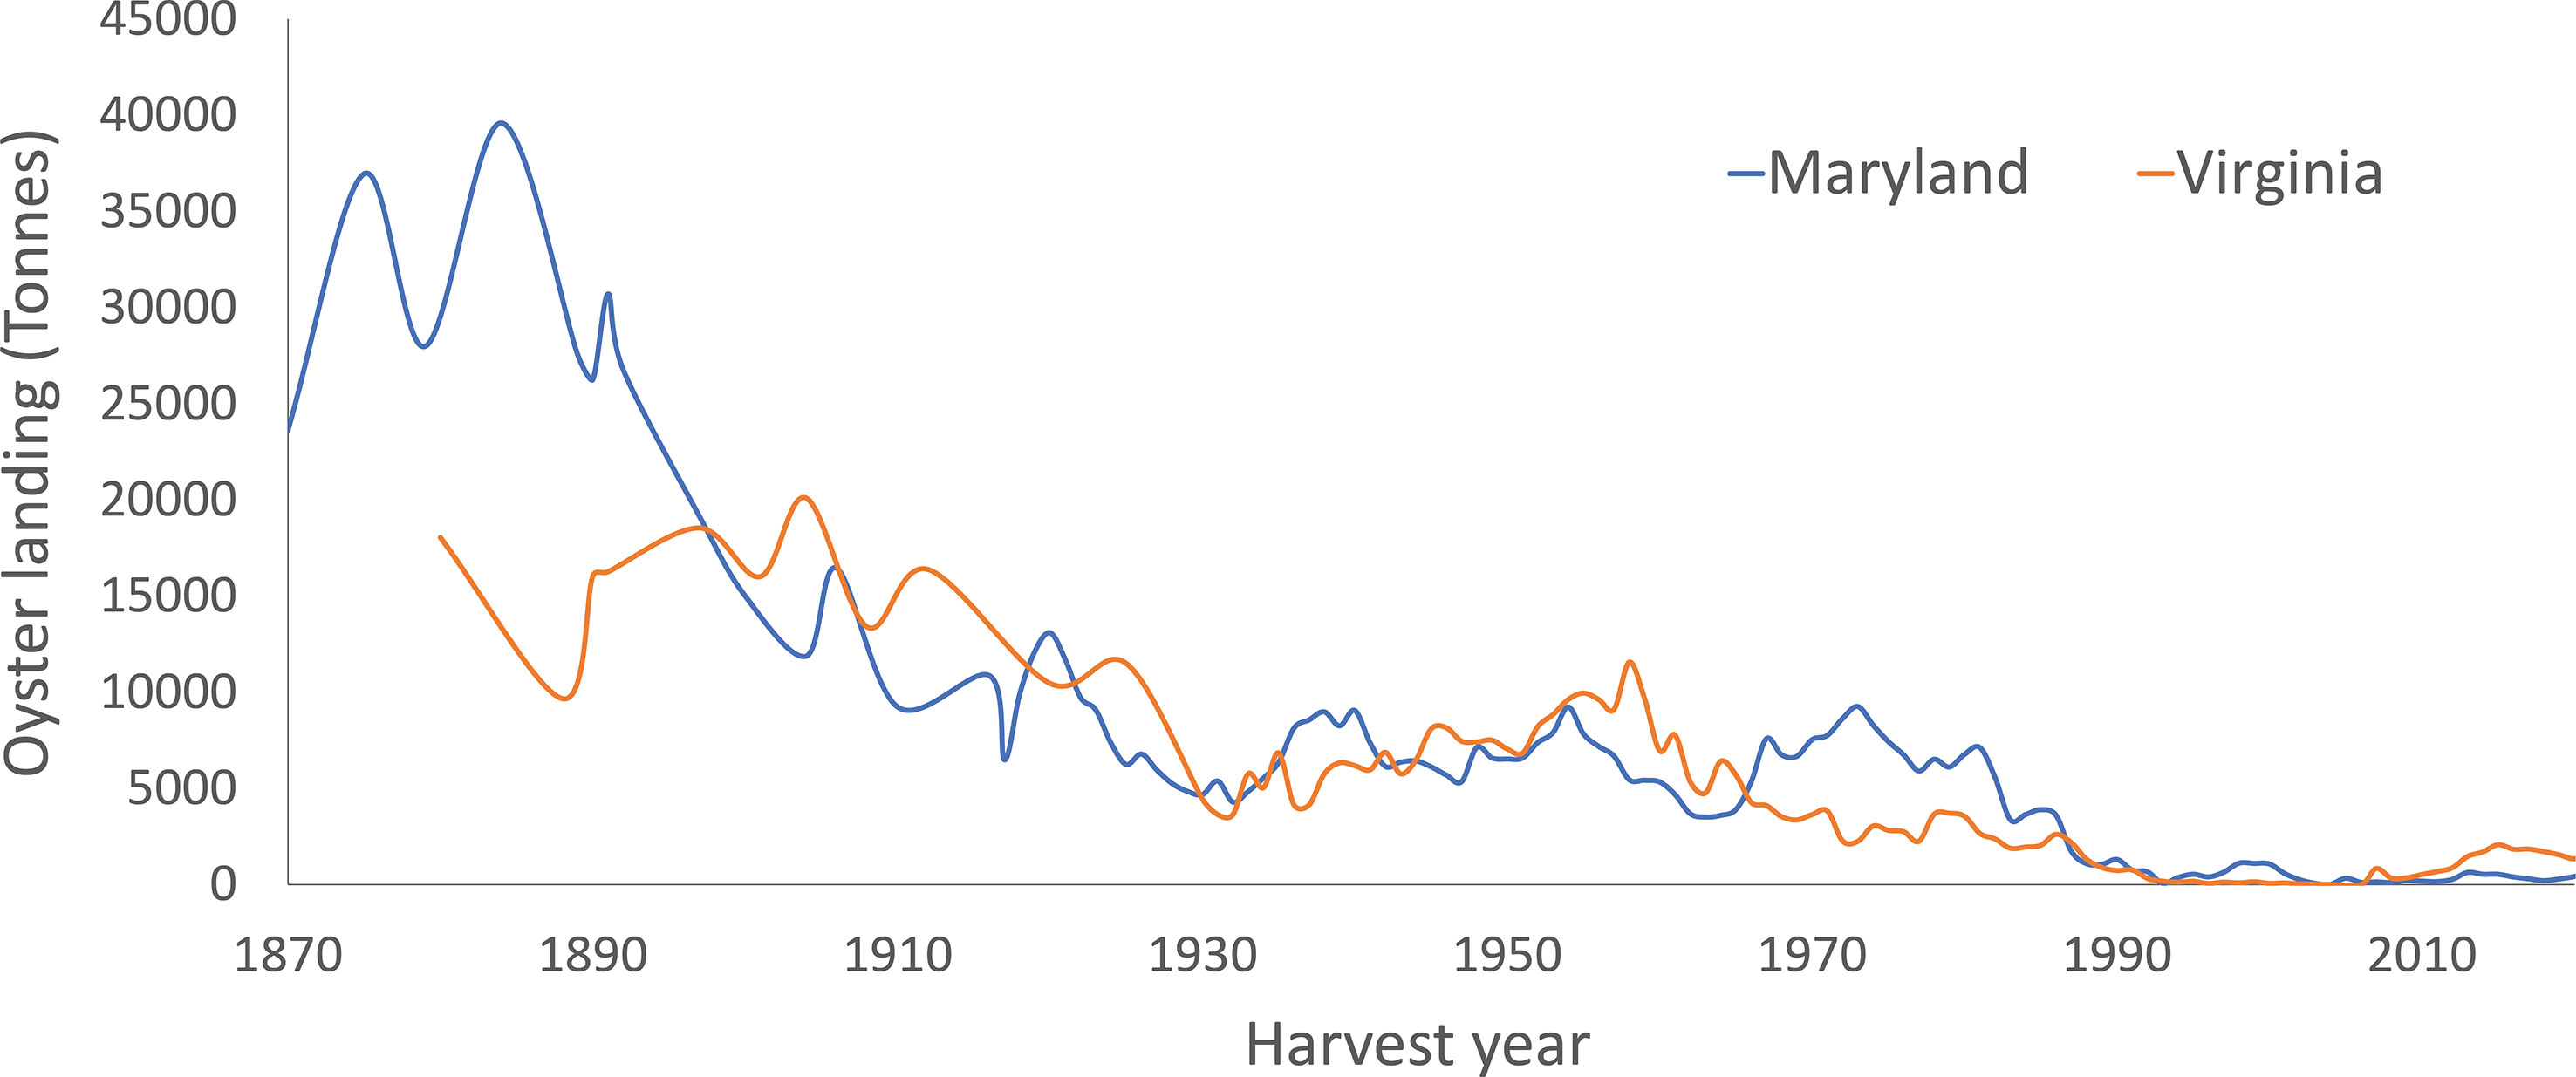
Figure 3 Oyster (Crassostrea virginica) landings over time from Maryland and Virginia states.
Before human-built roads, homes, and farm fields, most nutrients were trapped and absorbed by forest and wetland plants (Kemp et al., 2005). When these habitats were altered to accommodate a growing population, the Bay’s nutrient pollution increased (Kemp et al., 2005; CBP-Issues, 2023). Fertilizers reduced the need for further agricultural land clearing. However, this increased agrochemical contamination with increased inputs of pesticides, industrially produced fertilizers, and organic matter from the waste of animal farms (Kemp et al., 2005; McLeod and Leslie, 2012).
Moreover, population growth has increased urban and suburban developmental activities. Residents in the region are moving to houses outside the city, causing urban sprawl, unconnected, spread-out, and low-density residential subdivisions, and commercial areas outside cities and town centers (CBP-Dev, 2023). Figure 2 shows the drastic increase in development in the last century. The sprawl increases the pollution around the Bay’s green areas because it requires road infrastructure to move around the Watershed (Ruark, 2010). The roads make up at least two-thirds of all paved impervious surfaces in the USA; this and the low availability of public transport make the car the choice for the vast majority of travel (Garrett and Taylor, 1999; CBP-Highway, 2009). The main sources of air pollution in the Watershed are due to cars, trucks, and power plants, which increase the atmospheric deposition of NOx (Figure 4) (CBP-AirPollution, 2023).
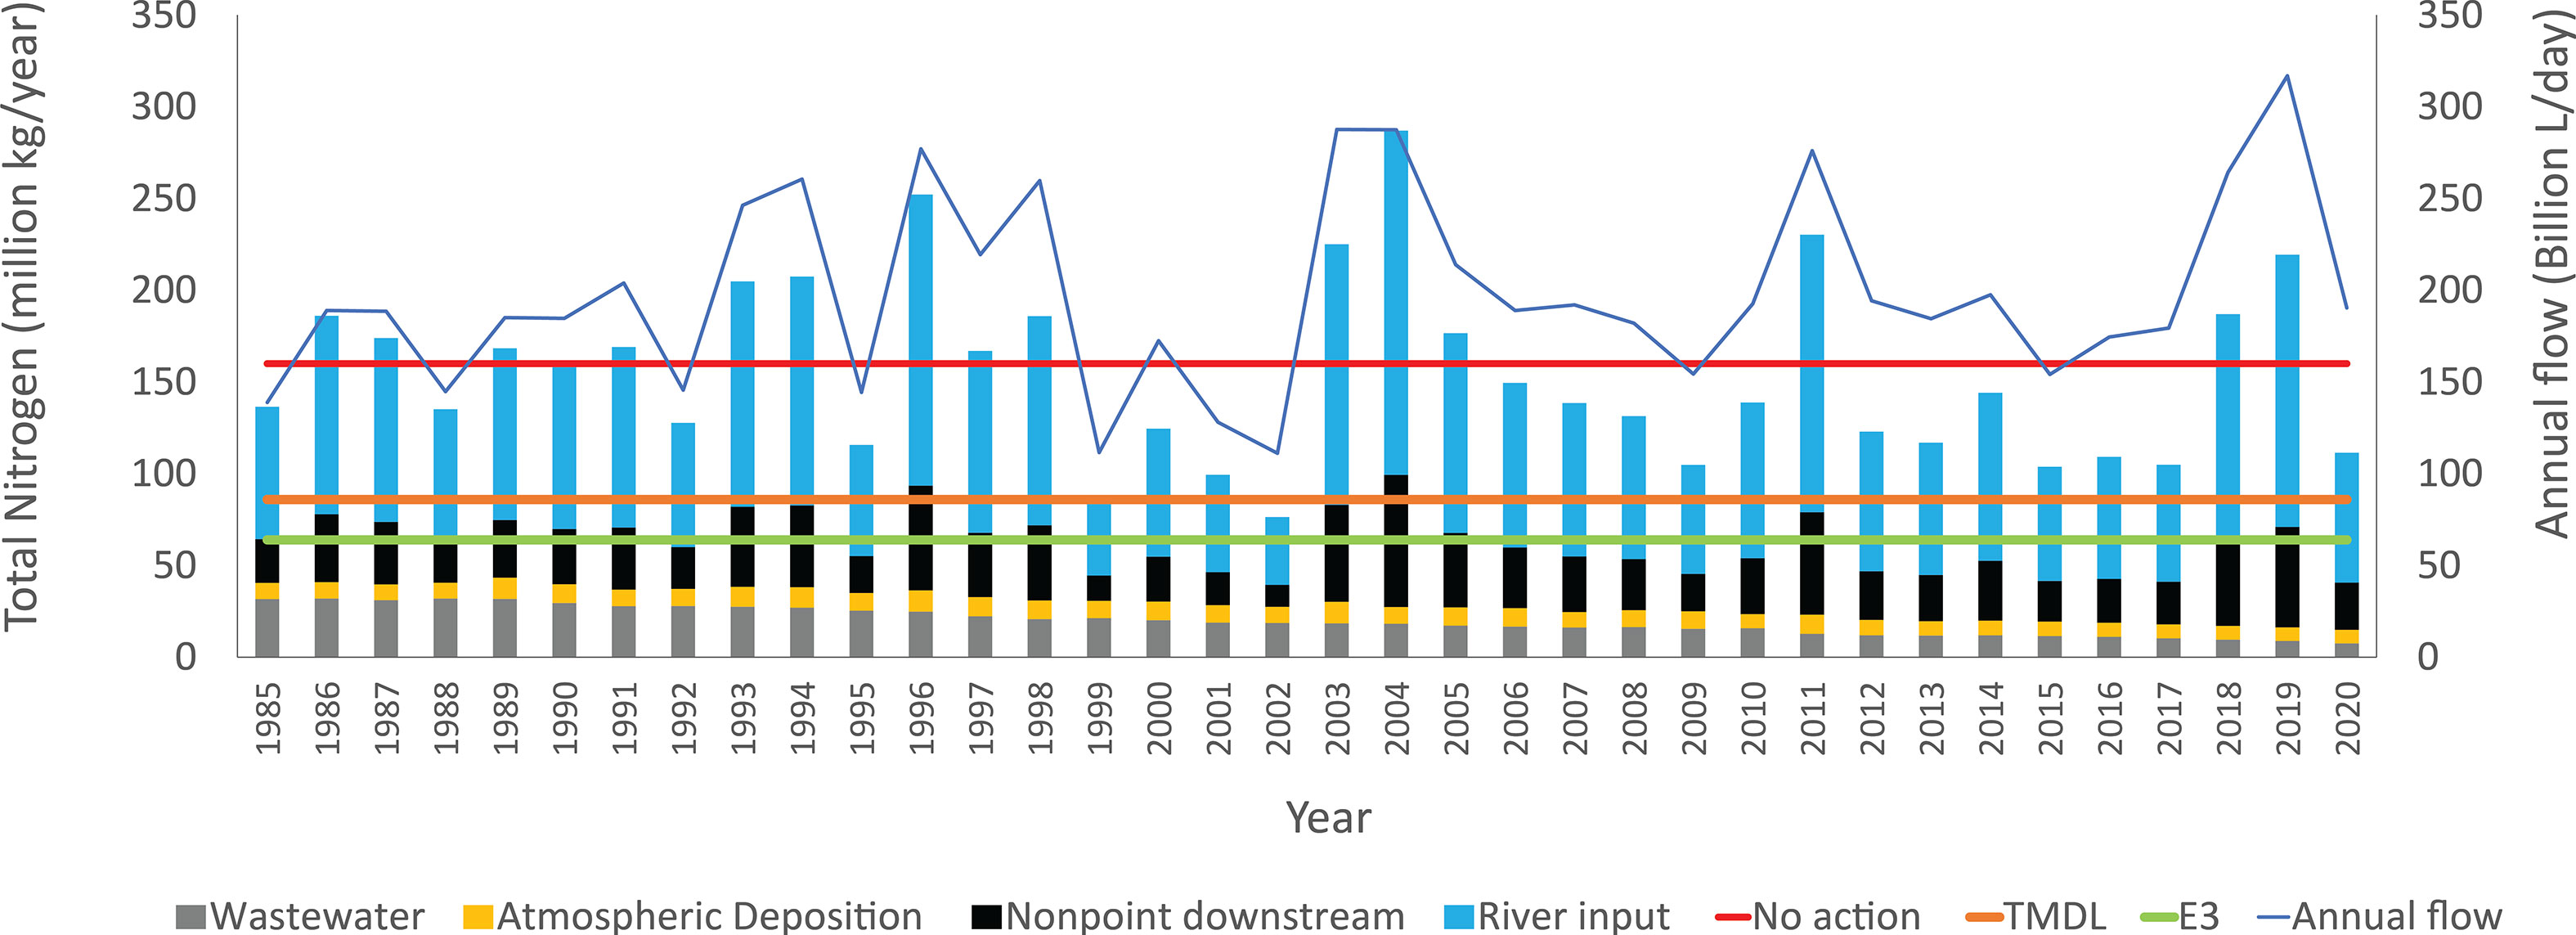
Figure 4 Total nitrogen load in the Chesapeake Bay over time. The lines represent the levels of management and annual flow. (Red line) No actions refer to no management action, (Orange line) TMDL is the current management goal, and (Green line) E3 is an estimate of applying management actions to the fullest possible extent (Shenk and Linker, 2013). Adaptation from Chesapeake Progress (CP-WQ, 2023).
Another activity that has been highly active is land protection, with 22% of the total land in the region protected (CP-ProtectedLand, 2023). The forest buffers, wetlands, and submerged aquatic vegetation (SAV) are also part of the projects to restore, enhance, and protect vital habitats (CP-VitalHabitats, 2023). Unfortunately, this has not decreased the land change for human development. Goetz et al. (2004) estimated that 80% of the development will occur from 2000 to 2030, consuming 5% of wetland, 14% of forest, and 23% of agricultural land, primarily through exurban sprawl. Moreover, in the rural area, there is also an increase in development with tourism, second homes, and resort communities. There is a lack of accountability and development limits for housing due to the growth in tributaries and shorelines.
Extensive fishing has been part of the commercial and recreational activities on the Bay (CBF-Fisheries, 2023). The fishing industry has contributed to the region’s economy, but its overexploitation has depleted the stocks and set the stage for decline (Rothschild et al., 1994; Orth et al., 2010). In addition, industrial methods, such as the mechanical harvest of oysters with dredges, have destroyed the coastline habitats and reduced the oyster reefs, which were once prominent along the shoreline (Figure 3) (Jackson et al., 2001). Around the Bay, there is an increase in hard armor to stabilize the shoreline from erosion, decreasing the SAV’s natural habitats and ecosystem functions (Davis et al., 2006). Currently, 50% of the coastline is armored due to the high development (Patrick et al., 2016). According to Patrick et al. (2016), armoring will probably increase in the coming century because of population growth and as a response to sea-level rise. Therefore, the loss of vital habitats, like SAV, could decrease the water quality and wildlife on the shorelines (CP-VitalHabitats, 2023).
3.1.3 Pressures
The main pressures are from the nutrient inputs derived primarily from watershed point sources, such as federally regulated wastewater discharge facilities, stormwater, and confined animal feeding operation discharges. There are also nonpoint sources, which are nonfederally regulated runoff from agricultural, developed, and forest lands (Figures 4–6) (Kemp et al., 2005; Tango and Batiuk, 2013).
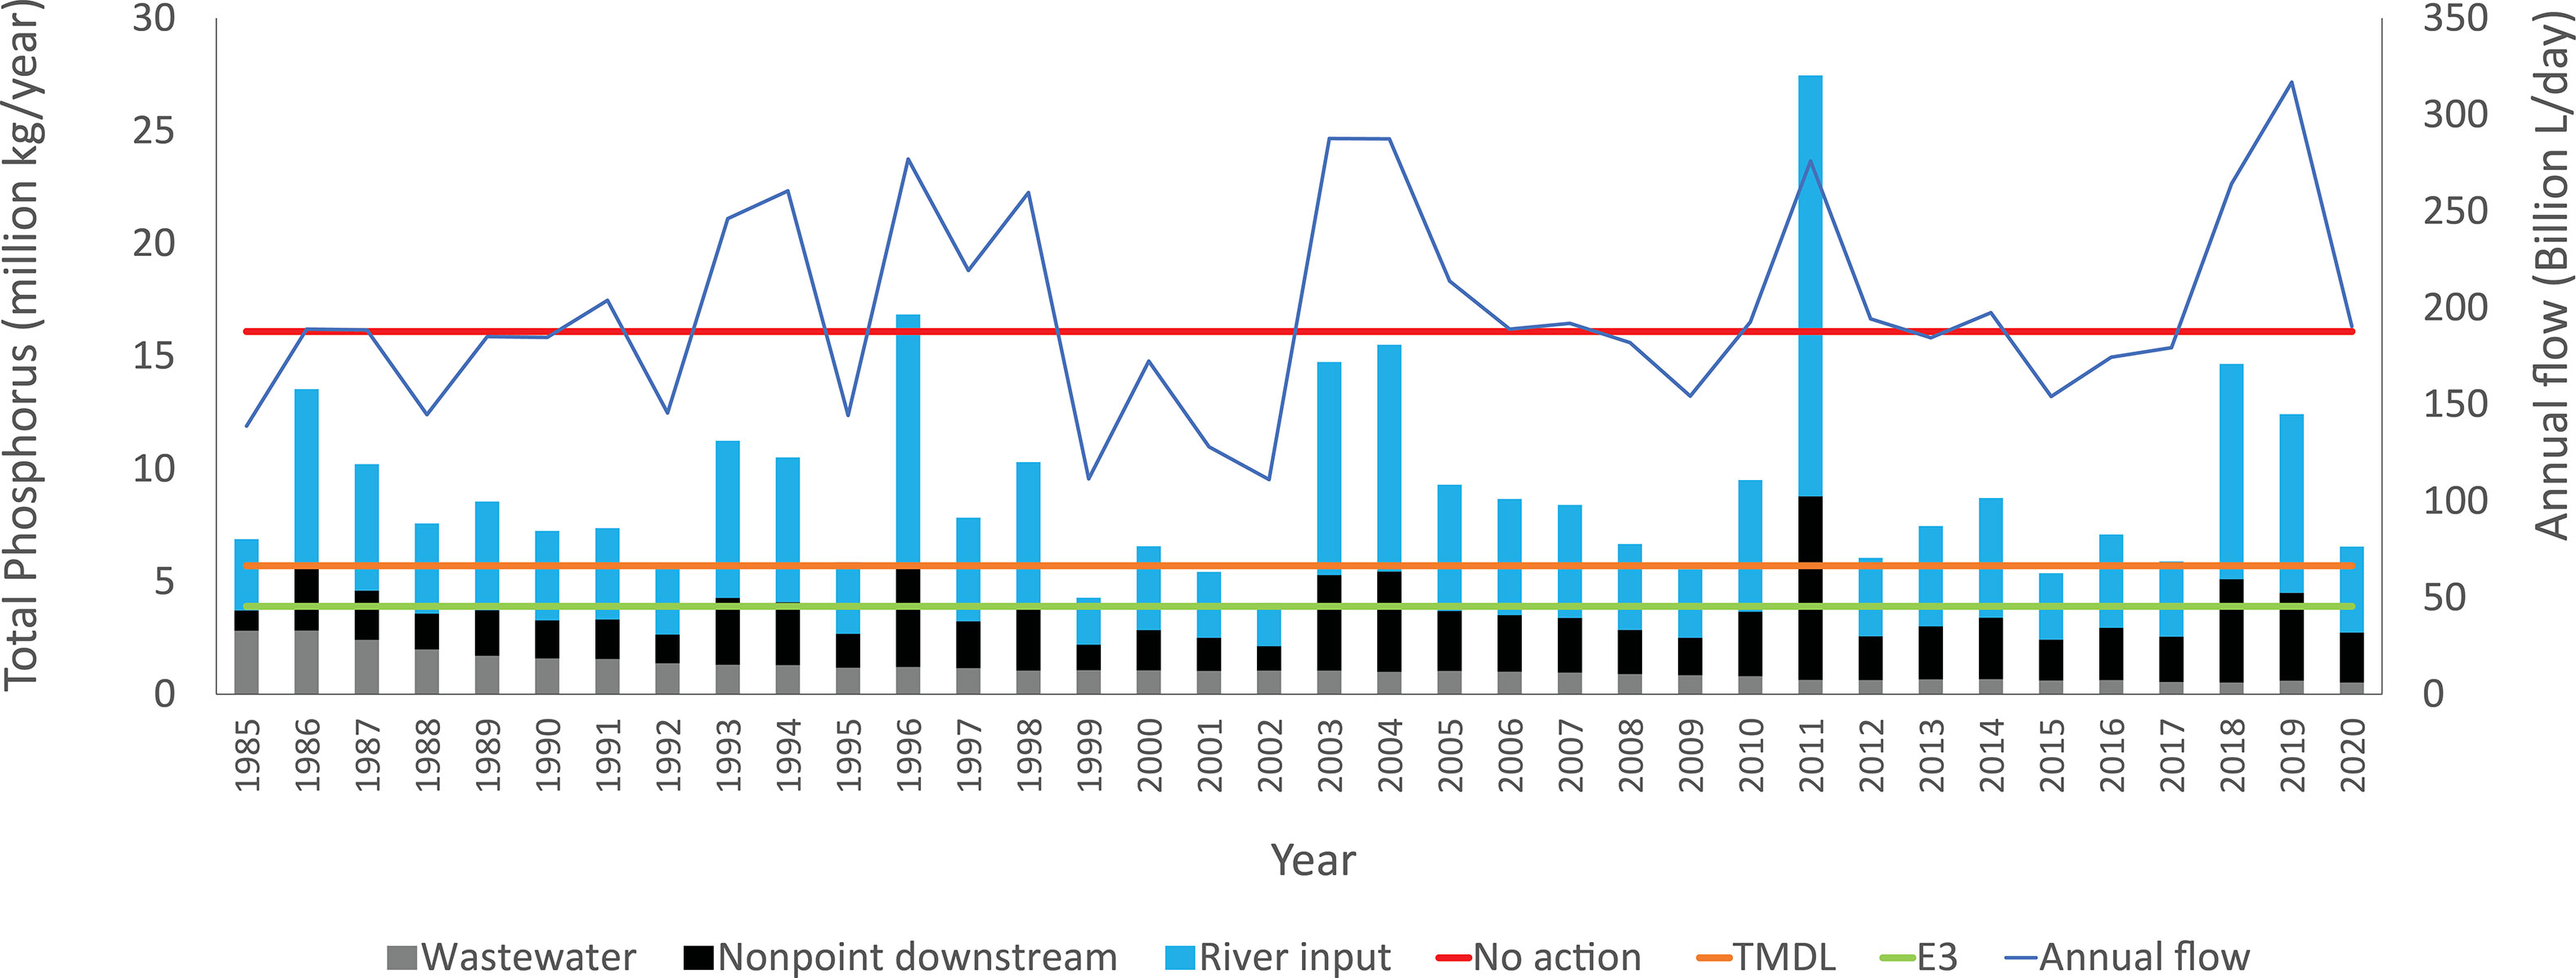
Figure 5 Total phosphorus load in the Chesapeake Bay over time. The lines represent the levels of management and annual flow. (Red line) No actions refer to no management action; (orange line) TMDL is the current management goal, and (green line) E3 is an estimate of applying management actions to the fullest possible extent (Shenk and Linker, 2013). Adaptation from Chesapeake Progress (CP-WQ, 2023).
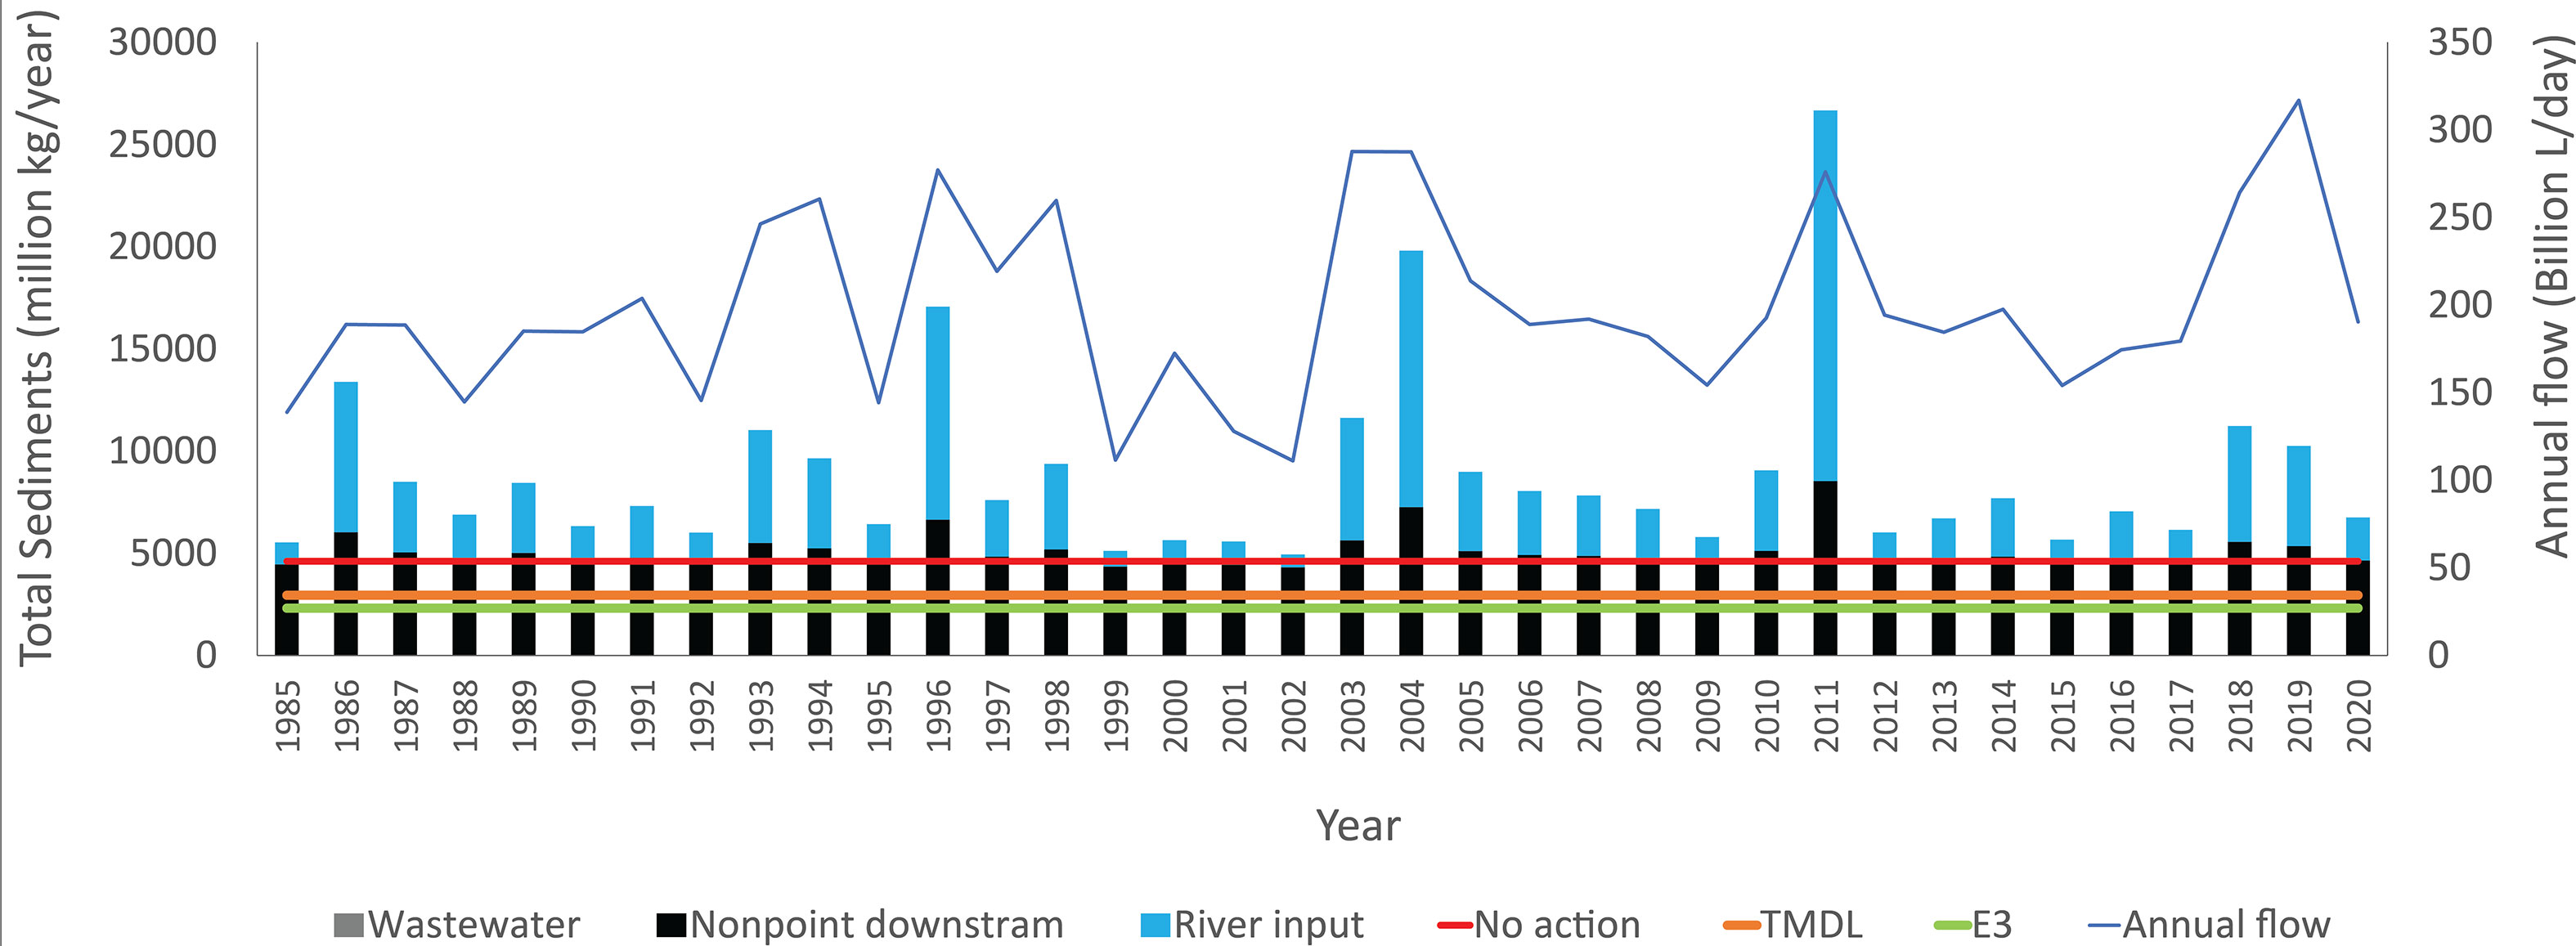
Figure 6 Total suspended sediment load in the Chesapeake Bay over time. The lines represent the levels of management and annual flow. (Red line) No actions refer to no management action; (orange line) TMDL is the current management goal; and (green line) E3 is an estimate of applying management actions to the fullest possible extent (Shenk and Linker, 2013). Adaptation from Chesapeake Progress (CP-WQ, 2023).
The main sources of nutrients (~60%) are runoff from agricultural land and atmospheric deposition (~20%–32%) (Figures 7–9) (Sheeder et al., 2002; Da et al., 2018; CBP-AirPollution, 2023). Da et al. (2018) estimated that nearly half of the atmospheric deposition stems from emission sources outside the Bay’s Watershed, from the “direct” component falling on the water and the “indirect” component falling on land and being washed into the Bay. The sources of atmospheric nutrients are machines or processes that are powered by gas, coal, oil, and livestock or poultry operations (CBP-AirPollution, 2023).
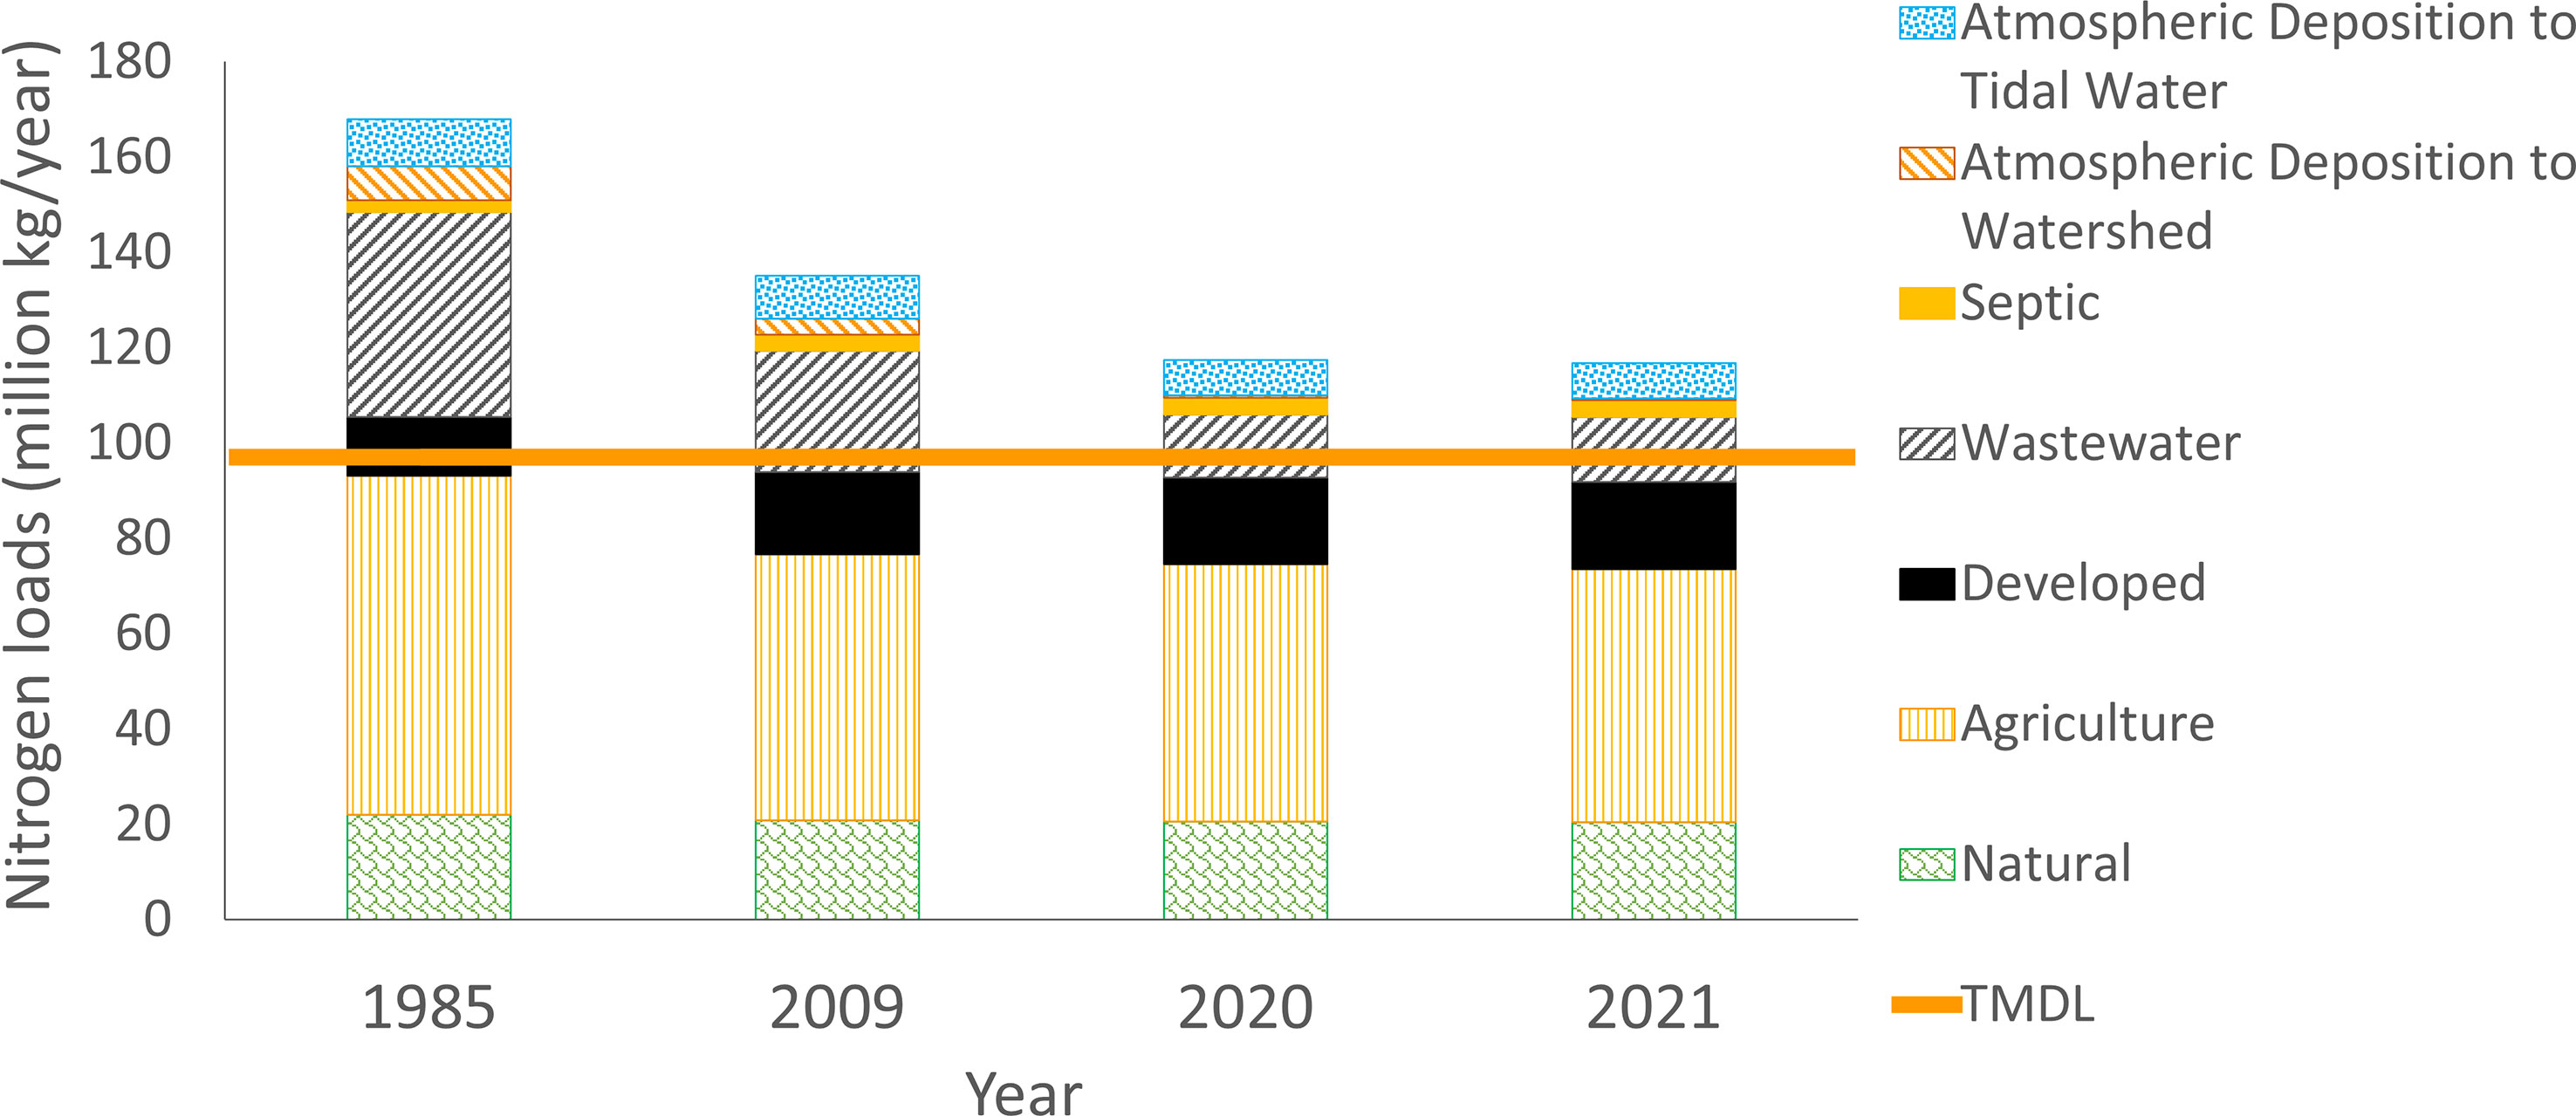
Figure 7 Estimated sources of nitrogen loads inthe Chesapeake Bay. Adaptation from Chesapeake Progress (CP-WQ, 2023).
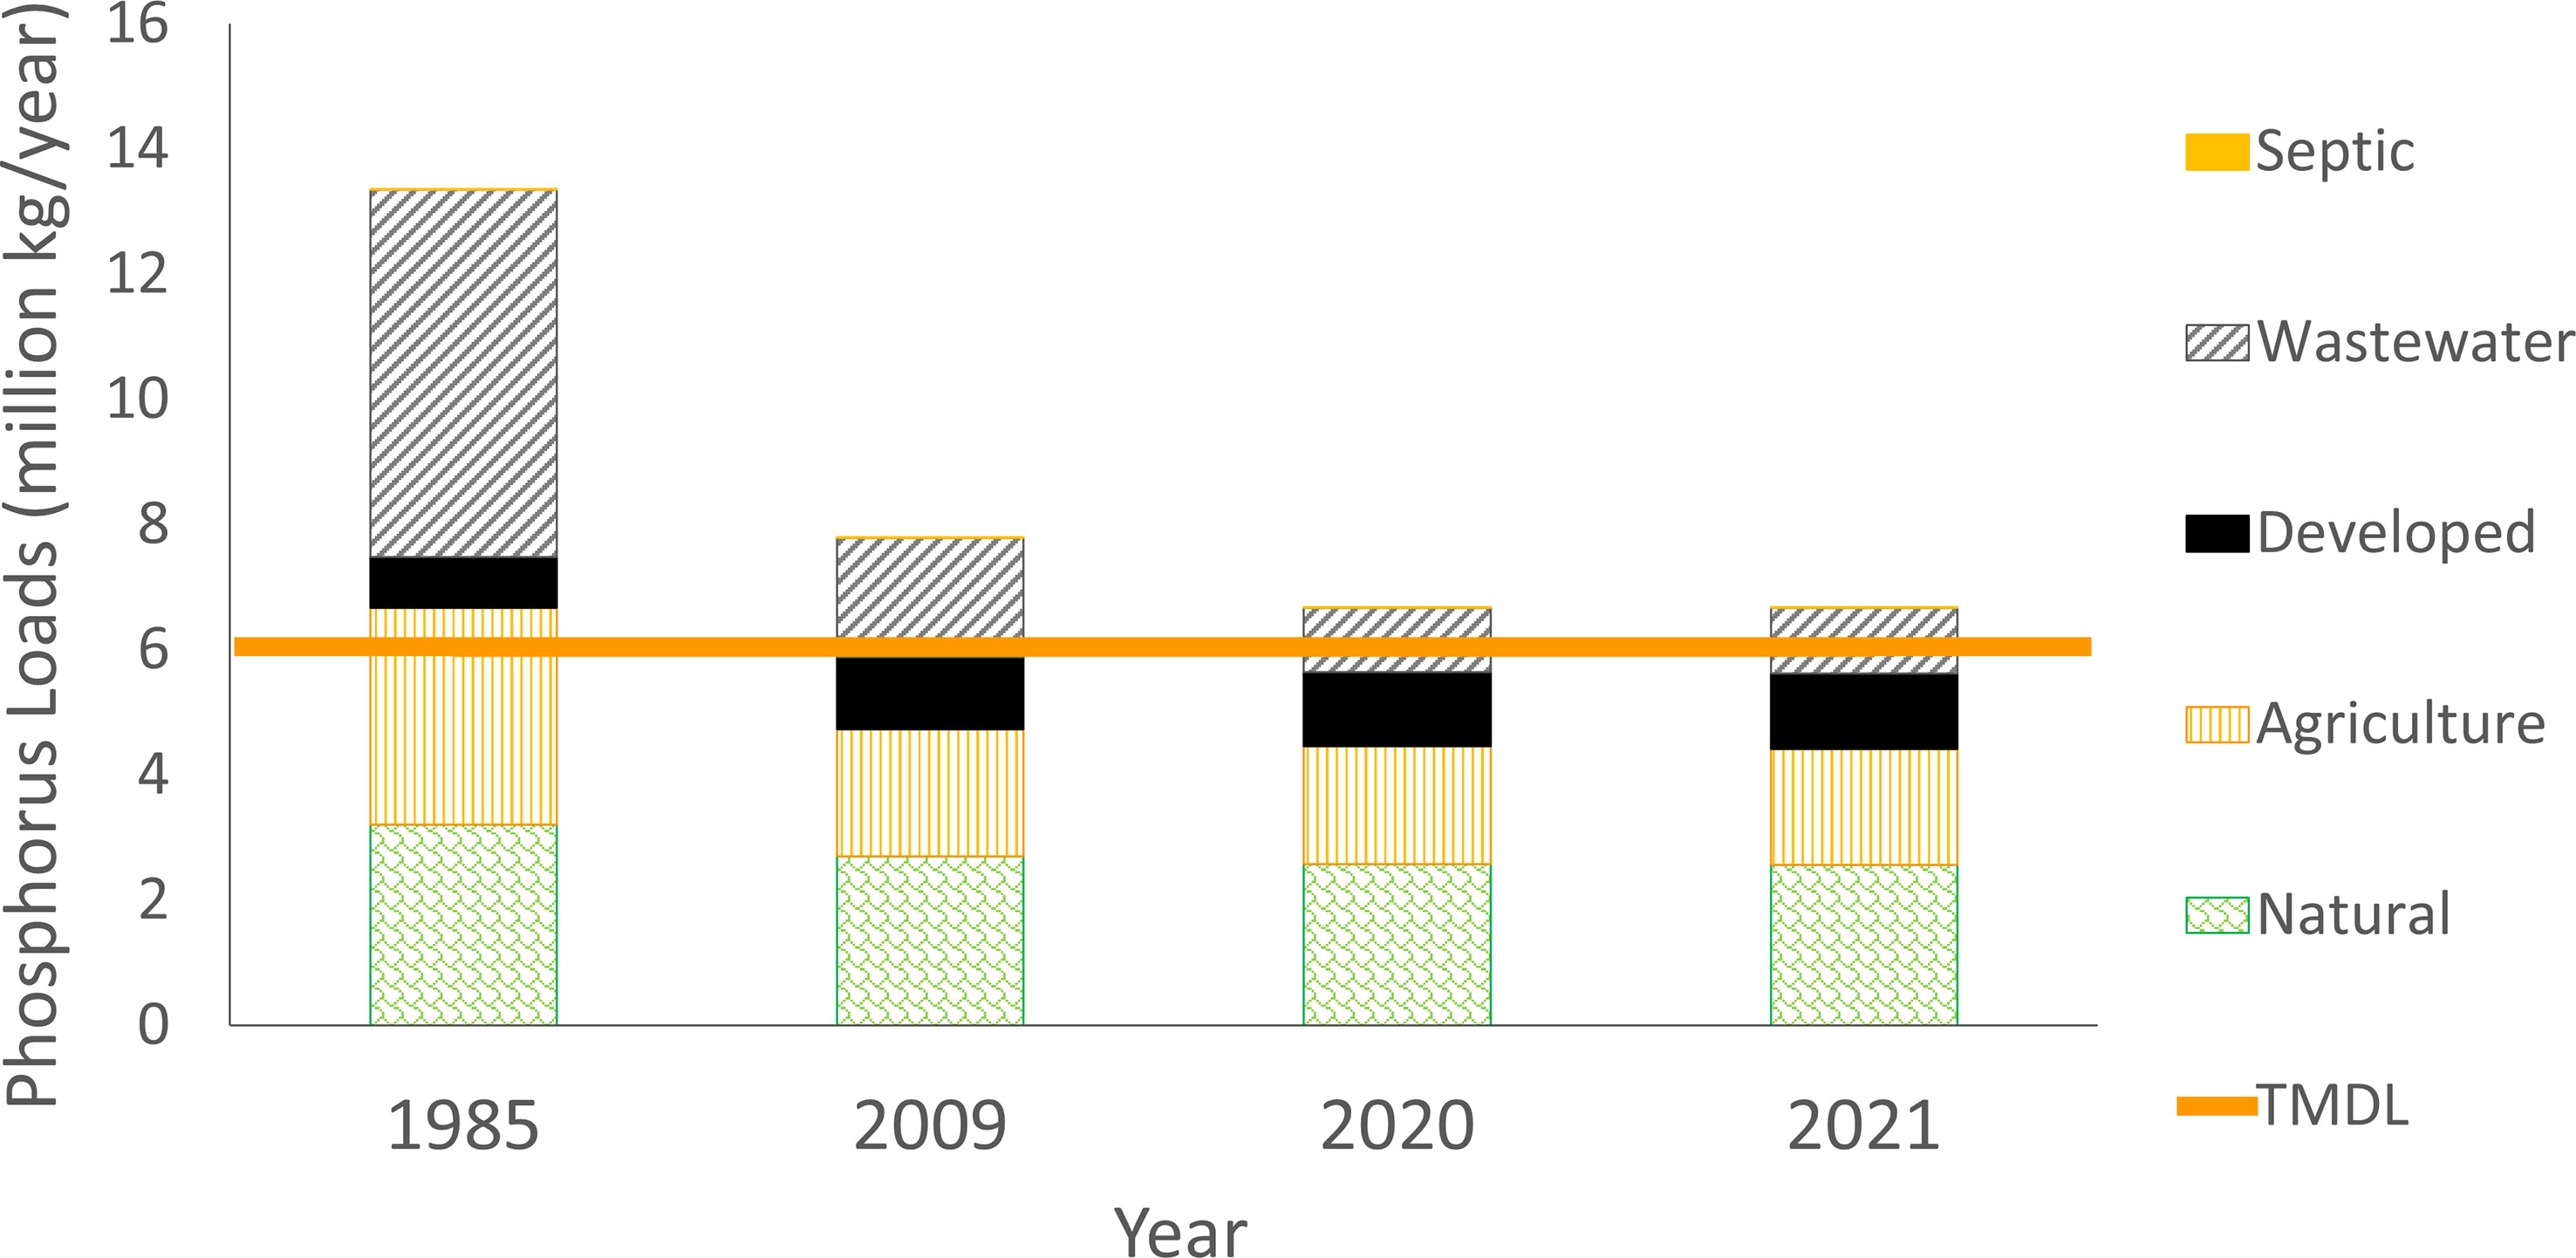
Figure 8 Estimated sources of phosphorus loads in the Chesapeake Bay. Adaptation from Chesapeake Progress (CP-WQ, 2023).
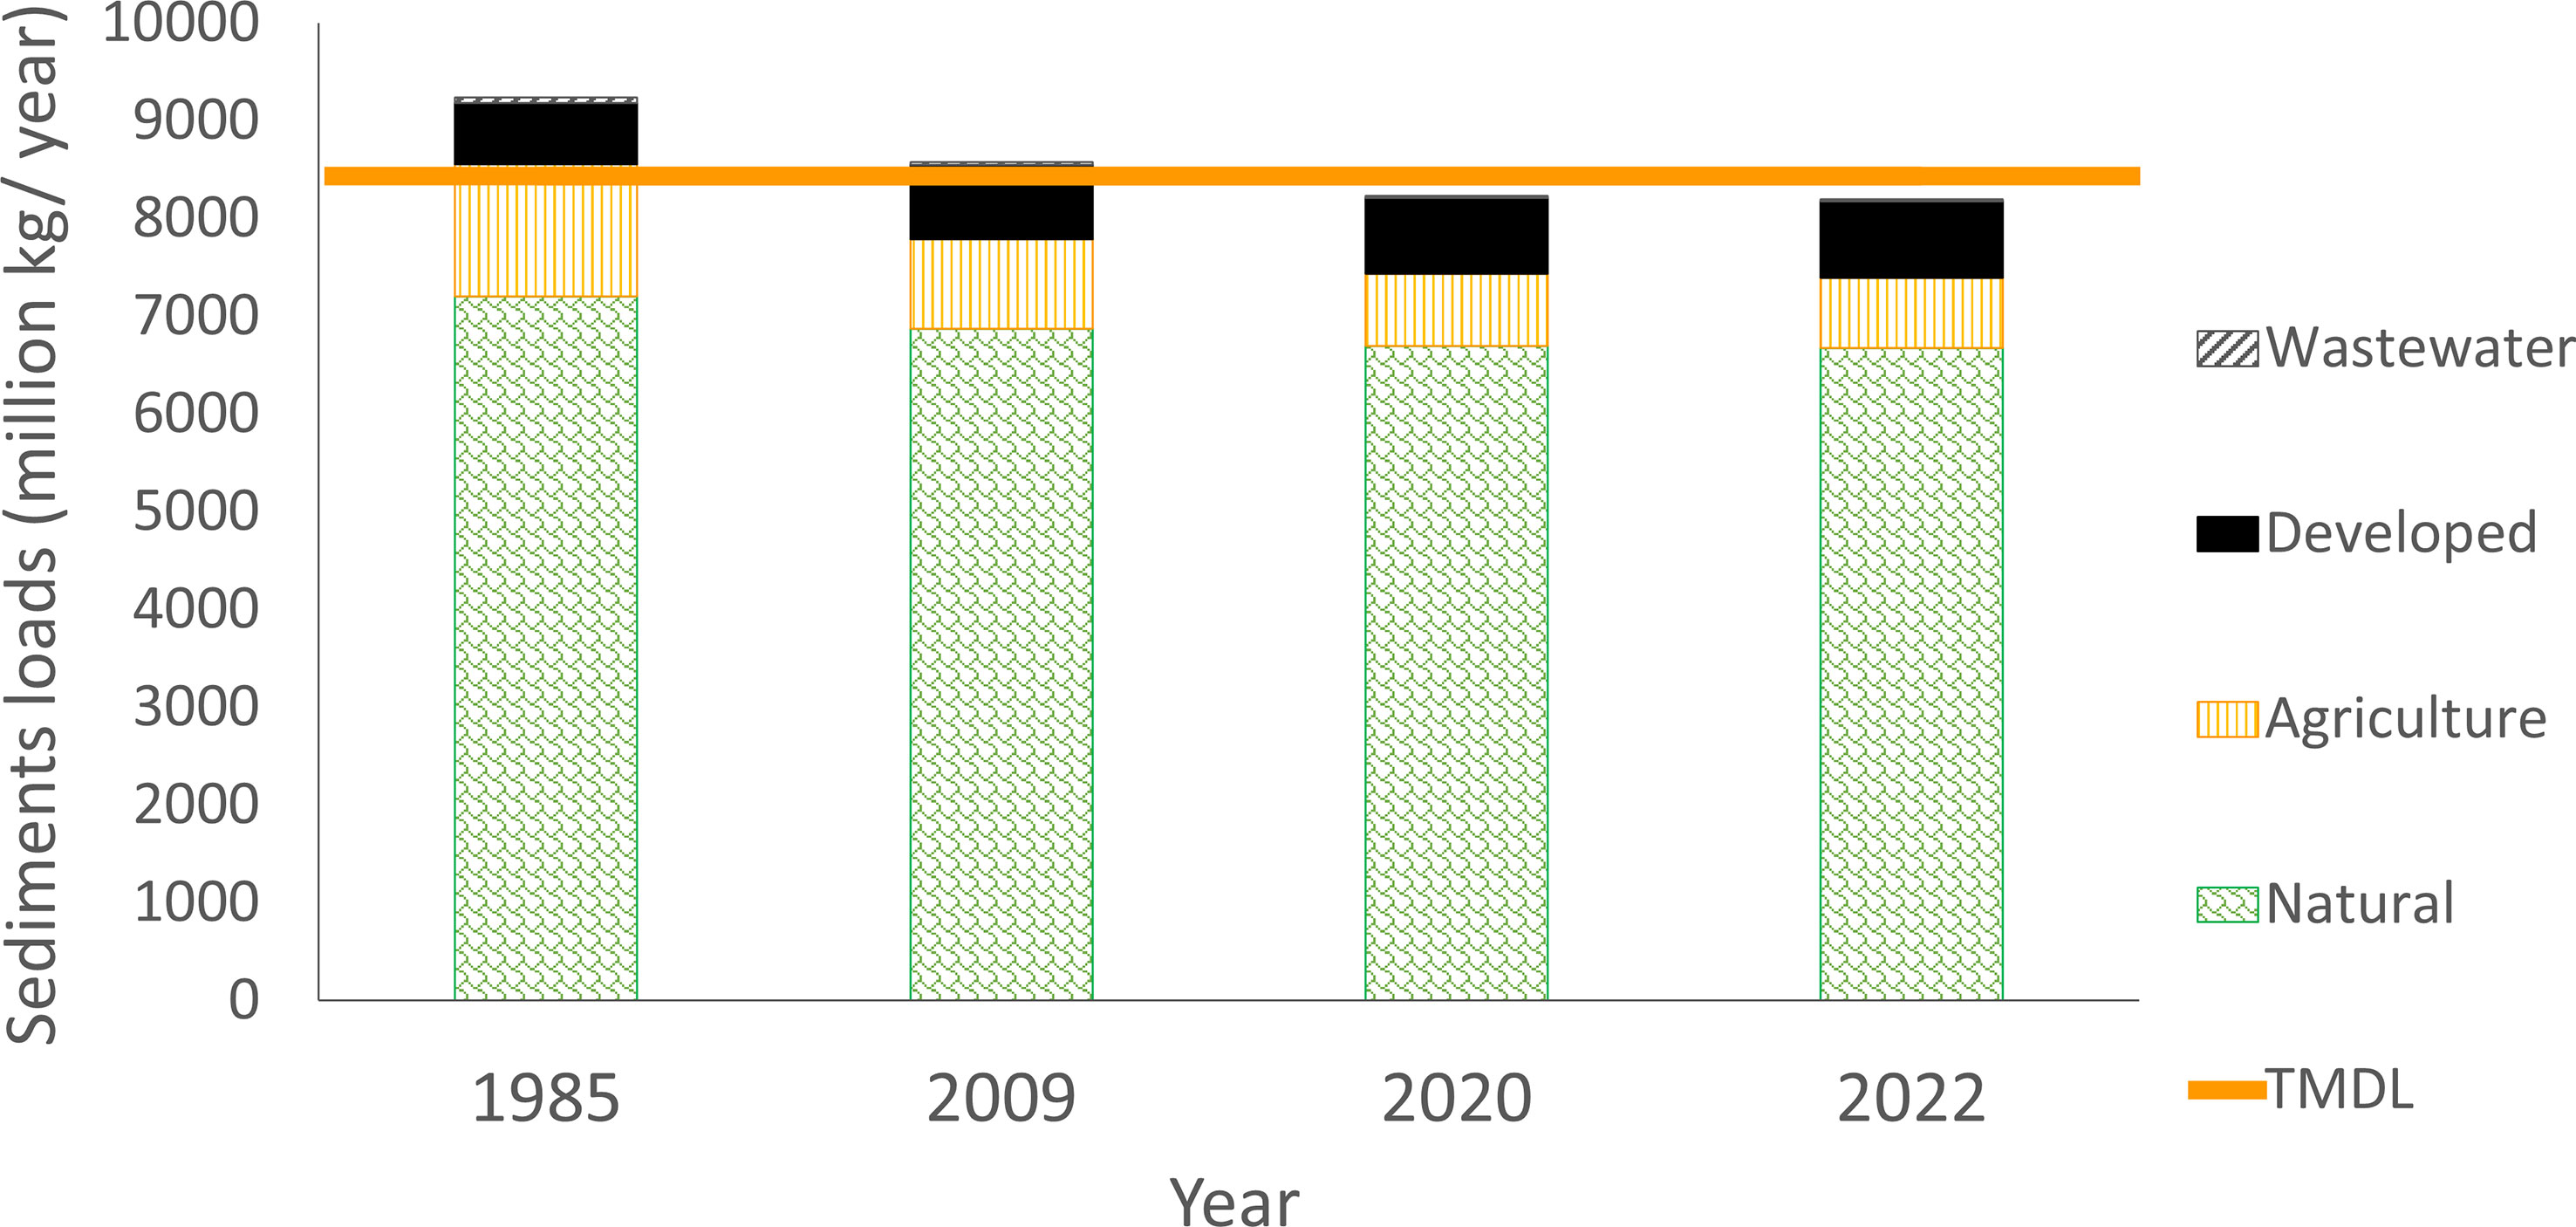
Figure 9 Estimated sources of suspended sediment loads in the Chesapeake Bay. Adaptation from Chesapeake Progress (CP-WQ, 2023).
Another pressure is overextraction, mainly of the eastern oyster Crassostrea virginia (Figure 3) (CBF-Fisheries, 2023). The decline in oyster abundance has resulted in a reduced capacity to filter the water column, making the eutrophication worse (Figure 10) (Rothschild et al., 1994). Although some species, like oysters, do not influence eutrophication, they can be affected by it. Richards and Rago (1999) found that the reproductive success of the remaining spawners of other species has been compromised by the low water quality reducing the survival of early life stages.
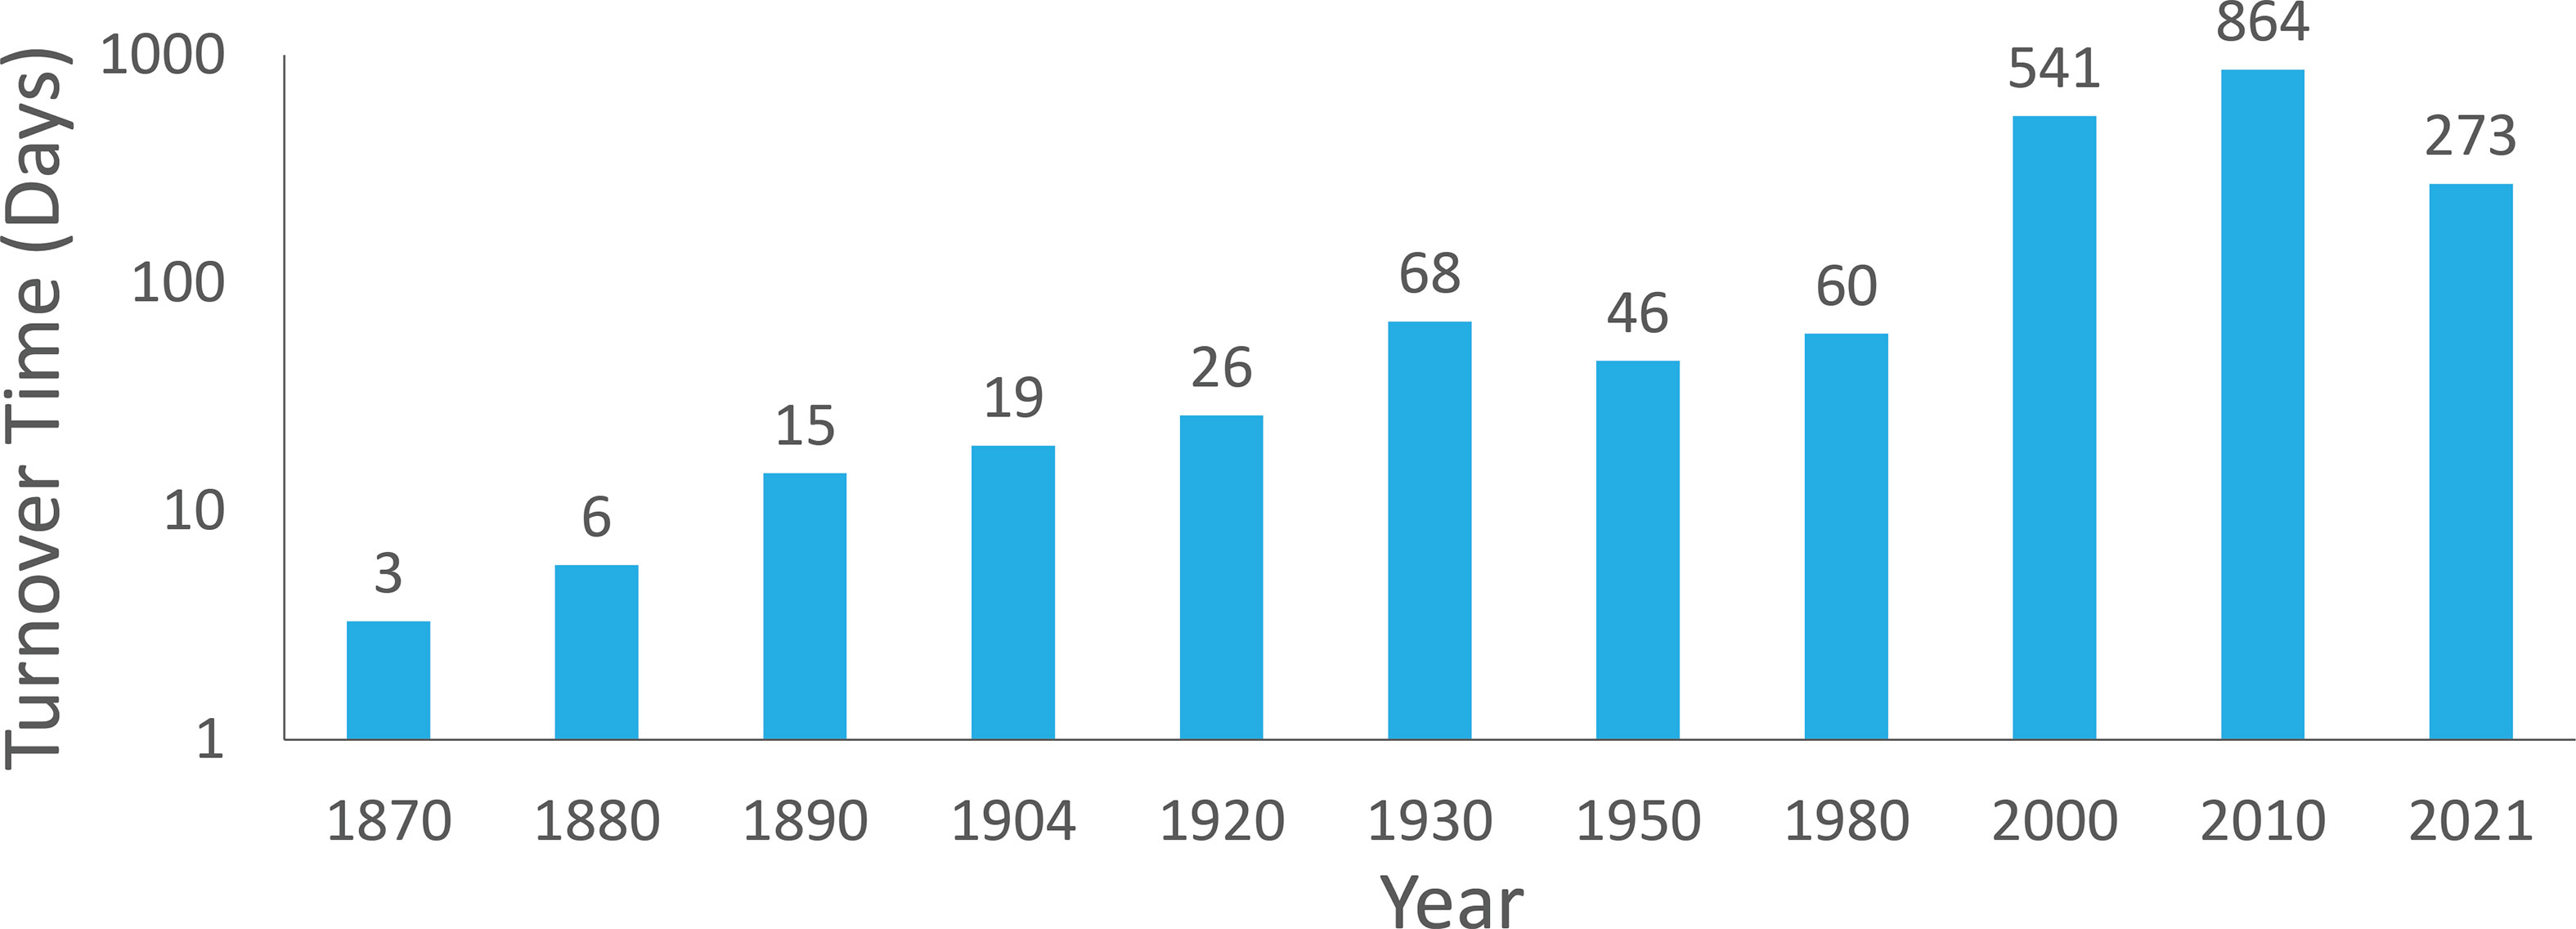
Figure 10 Calculated turnover time for the oyster population to filter the entire water volume of Chesapeake Bay based on the oyster biomass over time.
Additionally, the degradation of the environment’s water quality (Figure 11) has contributed to the decline of benthic fauna and tidal vegetation (Kemp et al., 2005; Orth et al., 2010). The loss of these habitats puts pressure on ecosystem services. The definition of ecosystem services in this paper is that of natural habitats that sequester nutrients and sediments, provide nursery and refuge for diverse wildlife, and, in some cases, provide shoreline protection (Kemp et al., 2005; Najjar et al., 2010; Orth et al., 2010; CP-SAV, 2023).
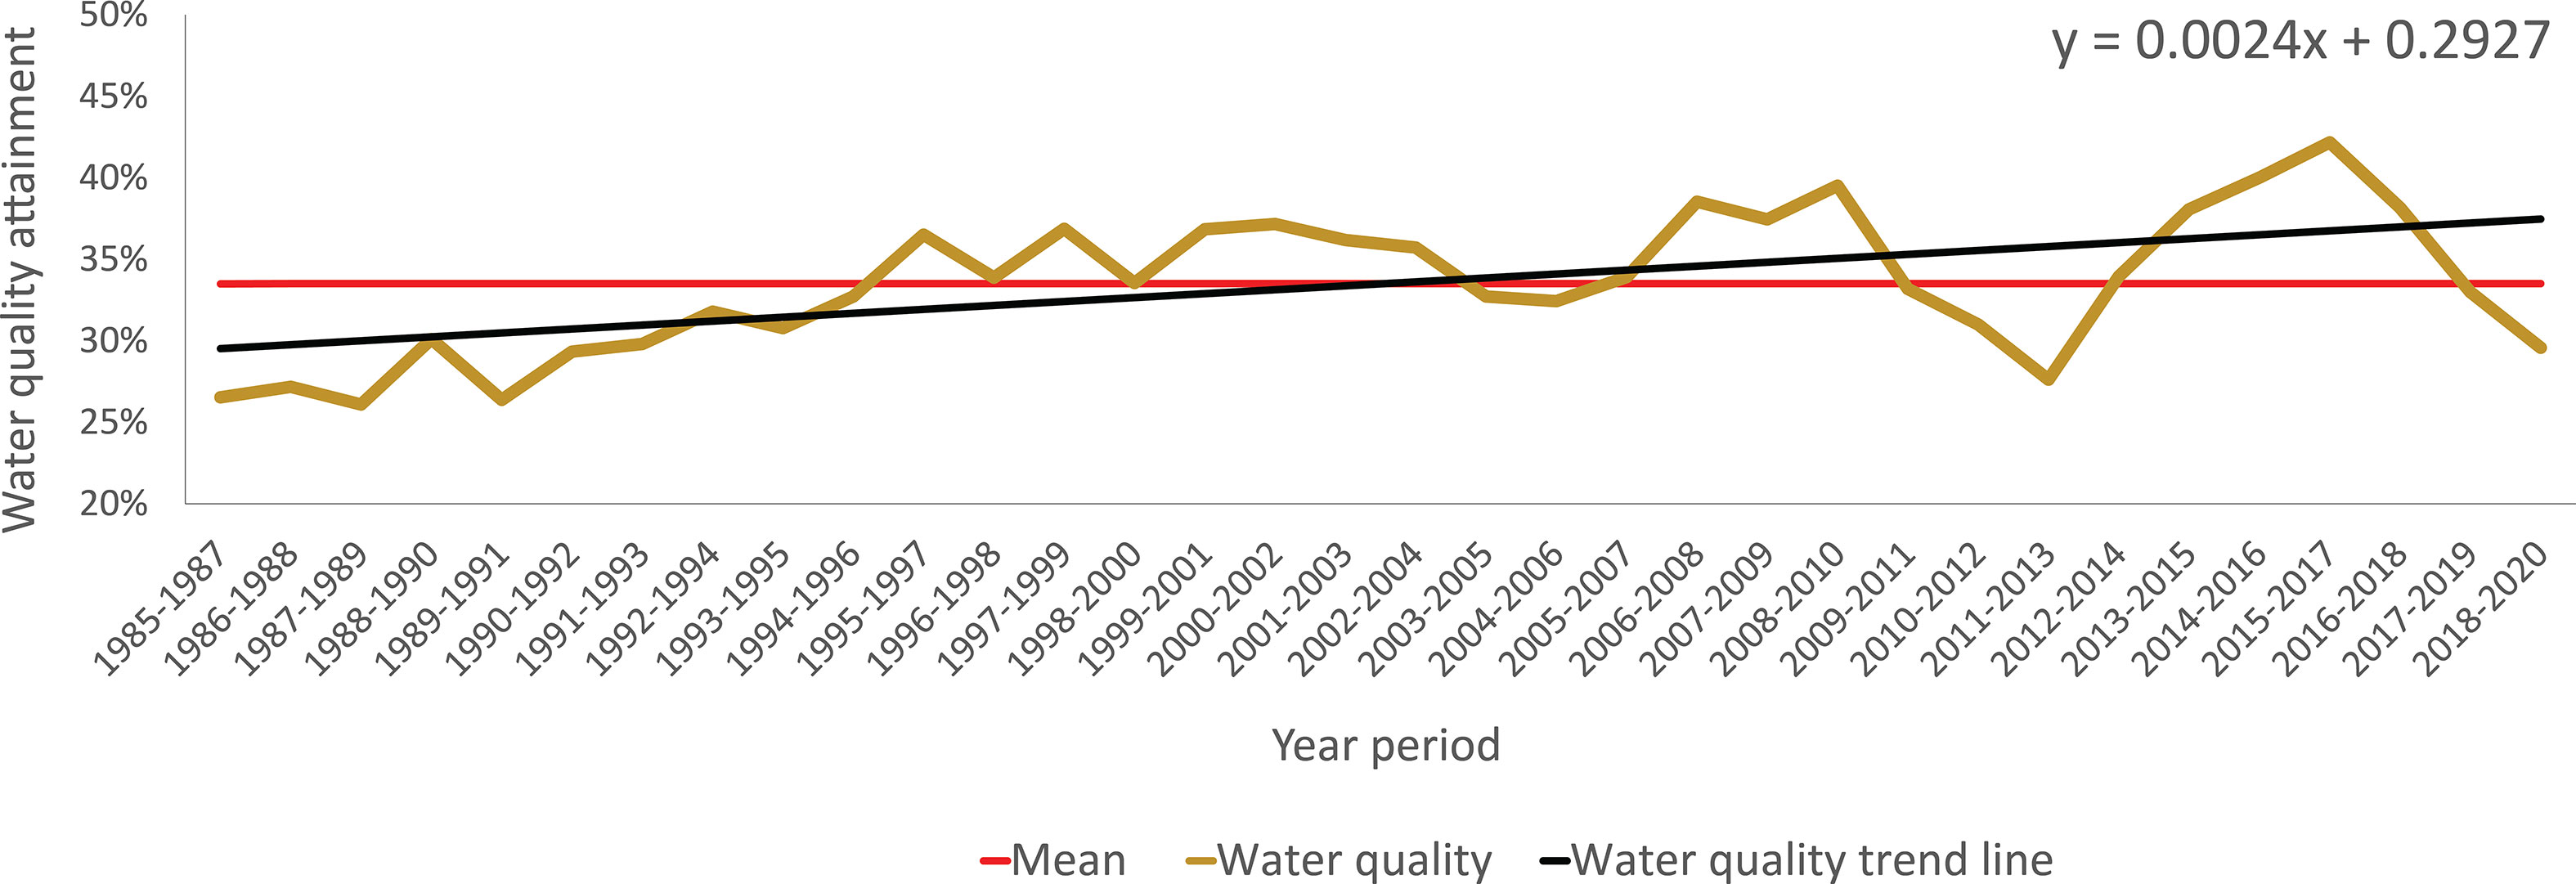
Figure 11 Water standards attainment (yellow line). The red line represents the water standards attainment mean, and the black line is the trend line. Adapted from Chesapeake Progress (CP-WQ, 2023).
There is also a concern about the impact of climate change. The projected climate change in the region is an increase in temperature, accelerated sea-level rise (SLR), and altered precipitation (Du et al., 2018). The warming of the Bay can change the dissolved oxygen concentration, impacting the oxygen flux in the estuary (Figure 12) (Irby et al., 2018). The rising sea level will increase coastal flooding, affect natural tidal nutrient buffers, and change the stratification in the water column (Kemp et al., 2005; Najjar et al., 2010). The changes in precipitation are projected to deliver higher winter and spring freshwater flows, which increase nutrient and sediment input (Irby et al., 2018). Figures 4–6 show a correlation between the increase in nutrients and sediment loads and annual flow. Therefore, the climate change projections can be a critical pressure in the system in the present and future of the region.
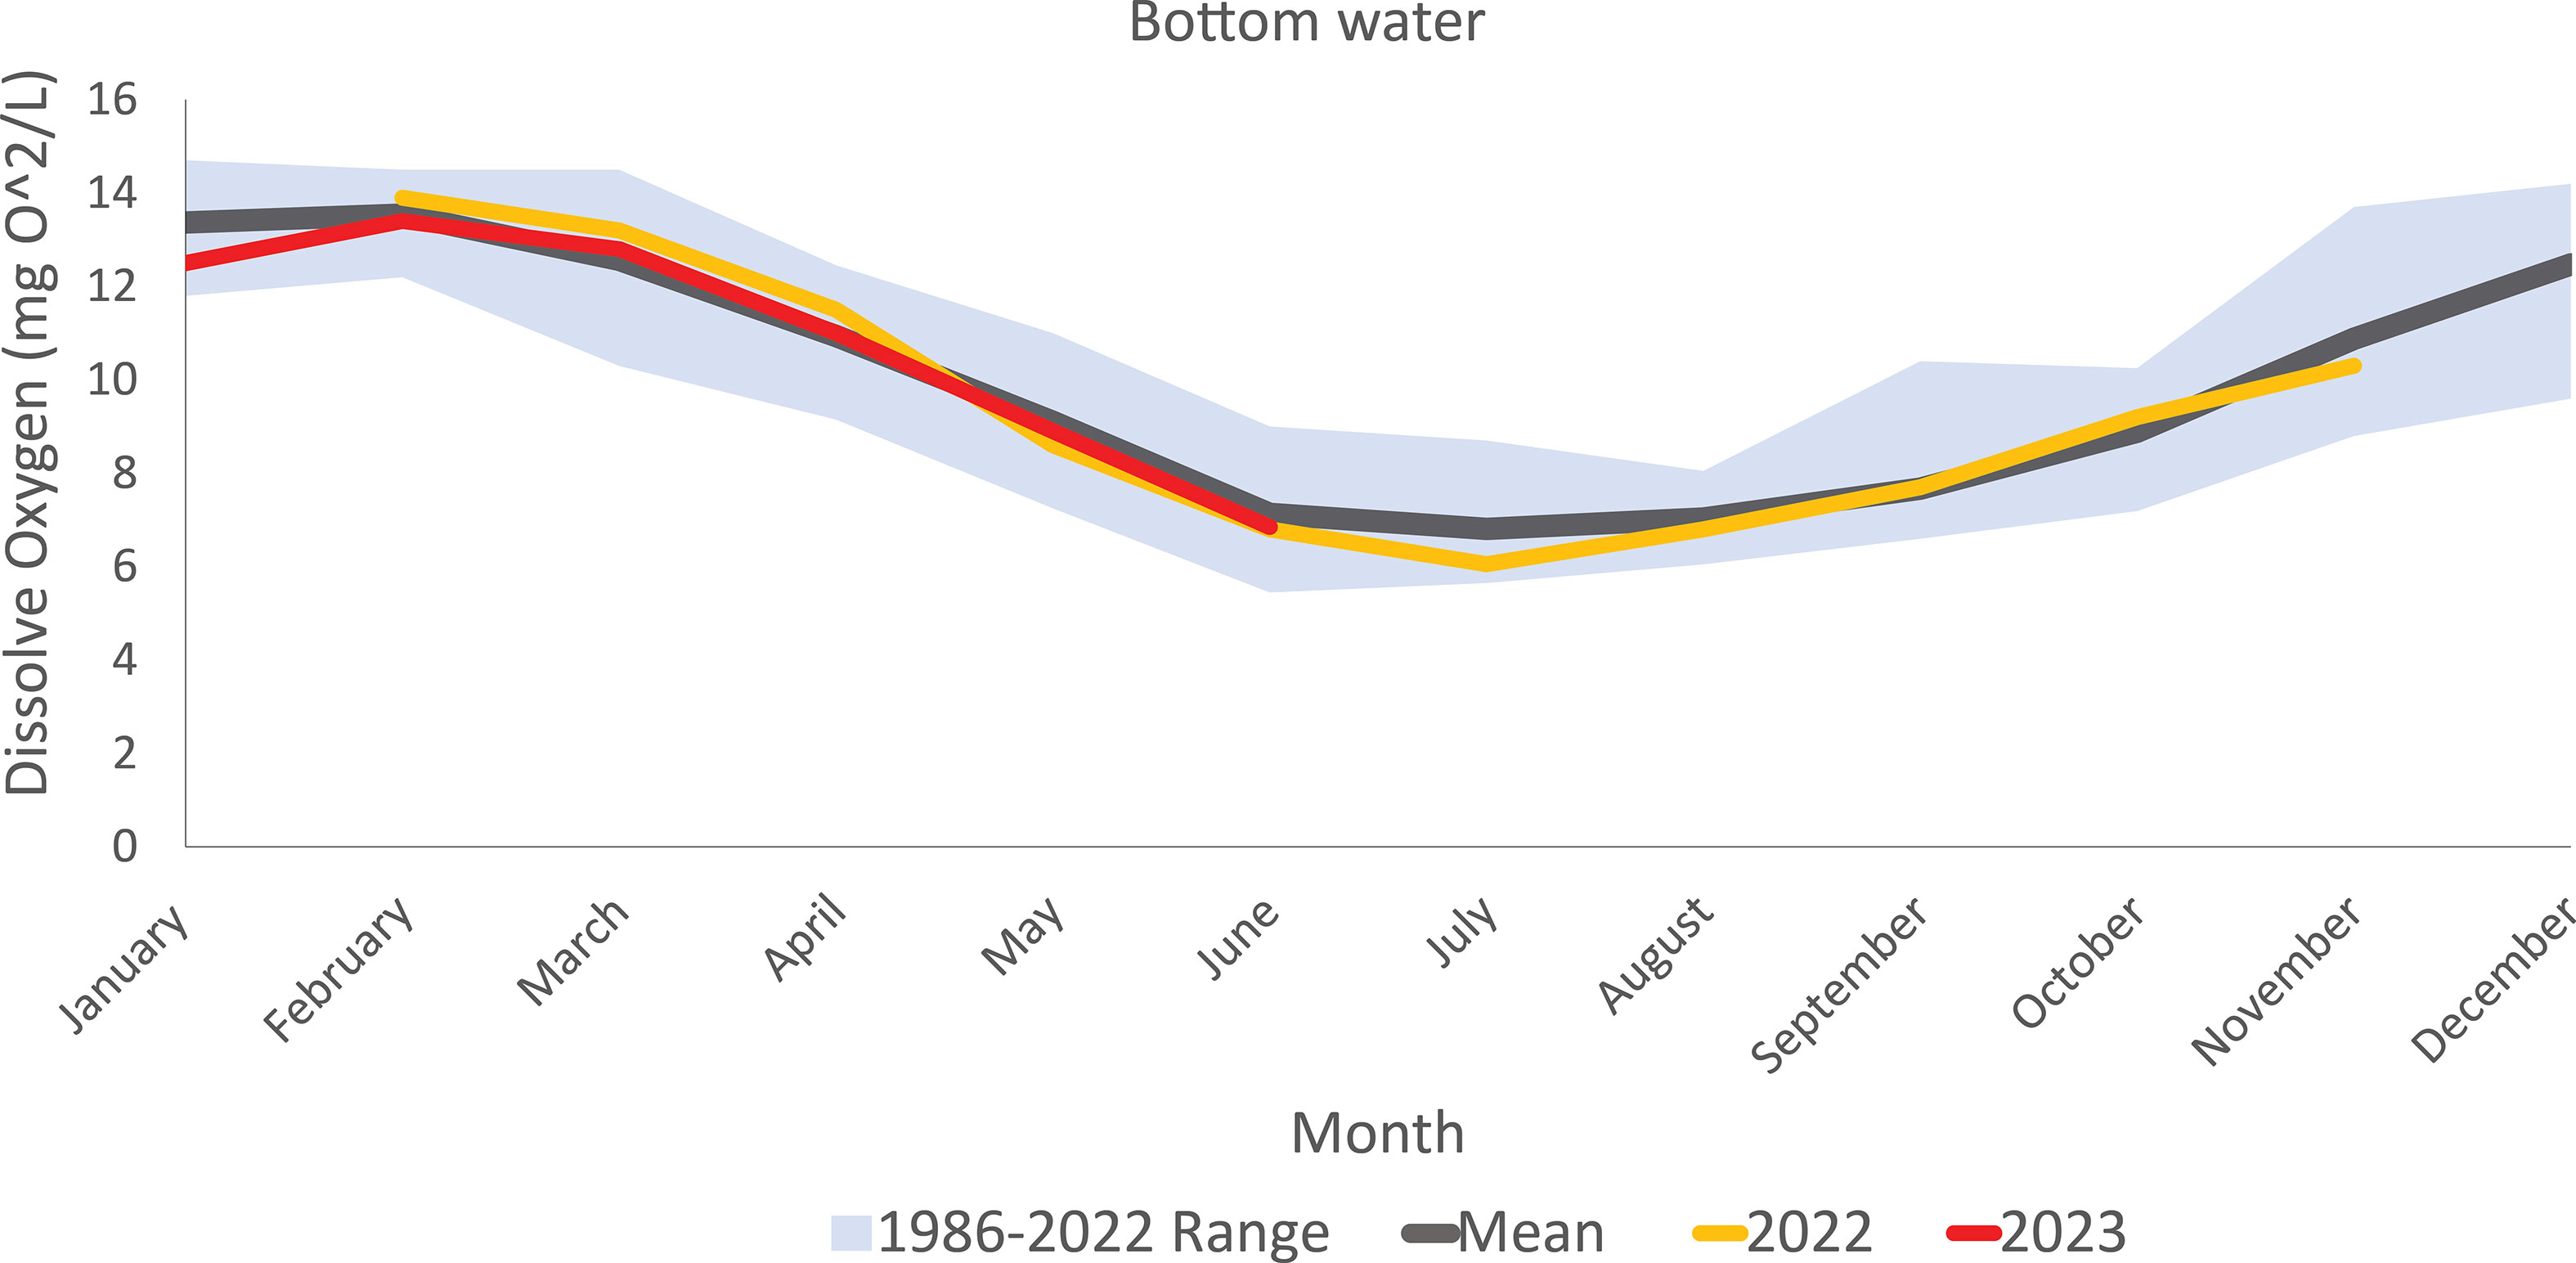
Figure 12 Monthly mean of bottom water dissolved oxygen ().
3.1.4 State changes
Before colonial times, the landscape of Chesapeake Bay was almost completely covered with temperate forest, bordered by wetland and oyster shorelines. The natural circulation of freshwater and saltwater set up a stratification and long residence times in the water column. The natural circulation of the system and geometry made this a productive system with efficient nutrient use and a tendency for oxygen depletion (Kemp et al., 2005). The land change started since the European settlement, with agriculture and human development in the Watershed, tributaries, and shoreline (Figure 2) (Hardaway and Byrnes, 1999; Kemp et al., 2005; McLeod and Leslie, 2012). As a result, the state of the Chesapeake Bay Watershed changed, more nutrients began to wash down, and the natural nutrient buffer mechanisms were compromised (Kemp et al., 2005; McLeod and Leslie, 2012).
After the mid-1900s, industrialization marked the increasing pollution and degradation of the Bay (Kemp et al., 2005; McLeod and Leslie, 2012). Using petrochemicals, pesticides, and industrially produced fertilizers increased nutrient pollution input (Boesch, 2006). Since then, the population has kept growing, and the natural buffer areas have decreased to roads, homes, and farm fields, which increased runoff (CBP-Issues, 2023). In addition, air pollution increases with fossil fuel combustion, mainly by power plants and automobiles. Nitrogen pollutes the air and, when it falls to the earth’s surface, the water (Figure 4) (Russell et al., 1998; CBP-AirPollution, 2023). Finally, the industrialization of oyster harvest effectively strip-mines the extensive reefs, decreasing the filtration time of more polluted water (Figure 10) (Kemp et al., 2005; Boesch, 2006).
The cumulative human-induced changes set a state change for eutrophication and hypoxia, increasing periods and the cover area around the Bay (Zhang and Blomquist, 2018; Arnold et al., 2021). As a result, the Chesapeake Bay has water quality degradation (Figure 11), which includes excessive algae growth, poor water clarity, decreased SAV acreage, and low dissolved oxygen or hypoxia (Zhang and Blomquist, 2018).
3.1.5 Impacts (on societal welfare)
Natural capital is the basis of the Chesapeake Bay Watershed region’s economy and quality of life (Phillips and McGee, 2016). Therefore, the degradation of the system is having an impact on the economic goods and services the Bay provides (Birch et al., 2011; Phillips and McGee, 2016). Overall, the main impacts are on water quality, fisheries, aesthetics, environmental resilience, and human health (Kemp et al., 2005; Birch et al., 2011; Compton et al., 2011; Steinzor et al., 2012; Phillips and McGee, 2016; George, 2019; Miller Hesed et al., 2020; Kenney and Gerst, 2021).
Kemp et al. (2005) provided an integrated synthesis with timelines and evaluation of ecological responses to eutrophication in the Chesapeake Bay. The recurring hypoxia and loss of diverse fauna buffers in the Watershed and shoreline have contributed to the decline in the Bay wildlife. In addition, the decrease in water quality and clarity has affected the organisms with intense mortality associated with disease, which has decreased important economic fisheries (Jackson et al., 2001; Orth et al., 2010).
The natural system’s rich history and astounding beauty promote recreation, tourism, and higher property values (Phillips and McGee, 2016). The main activities around the Watershed for locals and tourists are fishing, boating, wildlife viewing, and scenic vistas (Walsh et al., 2017). The degradation of the Watershed has hindered aesthetics and fisheries (Birch et al., 2011; Phillips and McGee, 2016). Tourism is highly influenced by water quality, fishing quality, and other environmental factors (Phillips and McGee, 2016).
Moreover, Birch et al. (2011) examined the effect of nutrients, mainly nitrogen, on the region using economic evaluation. The paper showed that environmental degradation has an impact on human health, elevating mortality and hospitalization. The effect on human health can also be linked to environmental justice, which addresses the environmental disamenities and burdens of minority communities in the region. The injustice can include health disparities, housing near hazardous zones, the impact of climate change, and low accessibility to clean water (IAN-EnvJus, 2023).
3.1.6 Responses (measures)
The system was the first estuary in the nation targeted by Congress after tropical storm “Agnes” in the 1970s exacerbated the degradation. In 1970, research and studies were sponsored to document and analyze the rapid loss of wildlife and aquatic life (Arnold et al., 2021; CBP-Who, 2023). The study lasted 5 years and identified excess nutrient pollution as the main source of the Bay’s degradation. These initial findings led to the formation of the Chesapeake Bay Program as a means to restore the Bay (CBP-Who, 2023). By 1983, an Agreement between all states in the Watershed was developed. The agreement recognized that a Cooperative approach was necessary to address the Bay’s pollution problems (CBP-Who, 2023). Since then, several agreements have been renewed and expanded to include commitments to the restoration of the Bay (Morgan and Owens, 2001; CBP-Who, 2023).
During 1987–2000, the “Clean Water Act” was implemented as an instrument to manage nutrient pollution through regulation and policies. Additionally, it was found that air pollution is a different problem adding pollution to the Bay (Morgan and Owens, 2001). Therefore, the “Clean Air Act” was created to regulate it, which includes fossil-fuel combustion by power plants and automobiles and biomass burning (Russell et al., 1998; Morgan and Owens, 2001).
In 2009, the CBP drafted the “Chesapeake Bay Watershed Agreement” (CBWA), a new agreement that aligns federal directives with state and local goals. Additionally, the initiative incorporated, consulted, and led new stakeholders to participate in the management (CBP-Who, 2023). The result was the TMDL, a federal “pollution diet” that set limits on the amount of nutrients and sediment that could enter without compromising the water quality, as mandated by the Clean Water Act (Hood et al., 2021; CBP-TMDL, 2023). The targets of the TMDL are shown in Figures 4–9. To implement the TMDL, each watershed jurisdiction created the “Watershed Implementation Plans”, often called WIPs (CBP-WIP, 2023). The WIPs is a document that includes details and specific steps each jurisdiction will take to meet the goals of the TMDL by 2025. Additionally, the document has a plan on how to partner with a local government for the federal project (CBP-WIP, 2023).
The TMDL specifies reductions of nitrogen, phosphorus, and sediment across the Watershed from point and nonpoint sources (Figures 4–6) (Tango and Batiuk, 2013; Kaufman et al., 2021). This was implemented in 2010 by establishing pollutant load locations (Frankel et al., 2022). Load locations generally can be enforced for point source emitters, mainly with wastewater treatment plants, stormwater systems, and largely confined animal feeding operations. However, nonpoint sources are harder to regulate and limit their emissions. The main management tool to reduce these nutrient nonpoint sources is the Best Management Practices (BMPs) (Fox et al., 2021). BMPs are conservation and technological practices that reduce the amounts of nutrients that enter local water and the tidal Chesapeake Bay through agriculture (CBP-BMP, 2018; CBP-BMPs, 2023).
On the other hand, oysters, SAV, wetlands, and forests have provided effective nutrient buffers along the Bay margins (Kemp et al., 2005). The decrease in these organisms or habitats has been part of the degradation of water quality (Jackson et al., 2001; Kemp et al., 2005). Currently, oysters, SAV, wetlands, and forest buffers have restoration projects (CP-VitalHabitats, 2023). According to the Chesapeake Progress, three of 10 selected tributaries have restored oyster reefs; the wetlands around the Bay have arrived at 10% of the target; and the forest buffers have gone through 55% of the restoration (CP-Forest, 2023; CP-Oysters, 2023; CP-Wetlands, 2023). The SAV has a 309 km2 abundance, which is far away from the 2025 target of 523 km2. However, SAV is very sensitive to nutrient change and, therefore, a good indicator of water quality (Boesch et al., 2001).
Overall, the study of Frankel et al. (2022) has demonstrated that the nutrient reductions from 1985 to 2019 have made the Chesapeake Bay more resilient to warming atmospheric temperatures and high discharge years by preventing additional hypoxia from developing. The same study developed a realistic numerical model hindcast, which was used to estimate the impact of the watershed nitrogen reduction on hypoxia. The results indicate that if nutrient reductions did not occur, 50–90 days of additional hypoxia would have occurred at specific locations in the oligohaline and southern mesohaline portions of the Chesapeake Bay for the threshold of O2< 3 mg O2/L and O2< 1 mg O2/L. This also increases habitat availability for the benthic organisms and fish (Seitz et al., 2009; Buchheister et al., 2013). Irby et al. (2018) show that the potential impact of climate change will be significantly smaller if the nutrient reduction response keeps improving.
Because Chesapeake Bay management has been extensive, several organizations have provided accountability tools to evaluate the region’s management. The CBP has a multimeric indicators assessment over time and among jurisdictions (USEPA, 2017). The information is available on the Chesapeake Progress Website (https://www.chesapeakeprogress.com/), which includes more than two dozen indicators of environmental health, restoration, and stewardship. The data and information are drawn from diverse sources, including government agencies, academic institutions, nongovernmental organizations, and direct demographics and behavior surveys.
Additionally, the Chesapeake Foundation is an organization that serves as a nongovernmental accountability instrument for the restoration plans (CBF-Restore, 2023). The Foundation protects natural resources by advocating strong and effective laws and regulations, holding those who pollute accountable for their actions, and inspiring citizen participation (Russo et al., 2008). Another tool is the Chesapeake Bay Watershed Report Cards, which are used to assess and communicate the system’s condition by providing synthesized information (Vargas-Nguyen, 2020; RC-Publications, 2023). The report card used environmental and socio-economic indicators to communicate the system’s overall health (RC-Publications, 2023).
3.2 Stakeholders
Using the methodology of Newton and Elliott (2016), the conceptual map of Figure 13 was created for the stakeholders that participate in or are involved in the eutrophication of the Chesapeake Bay system.
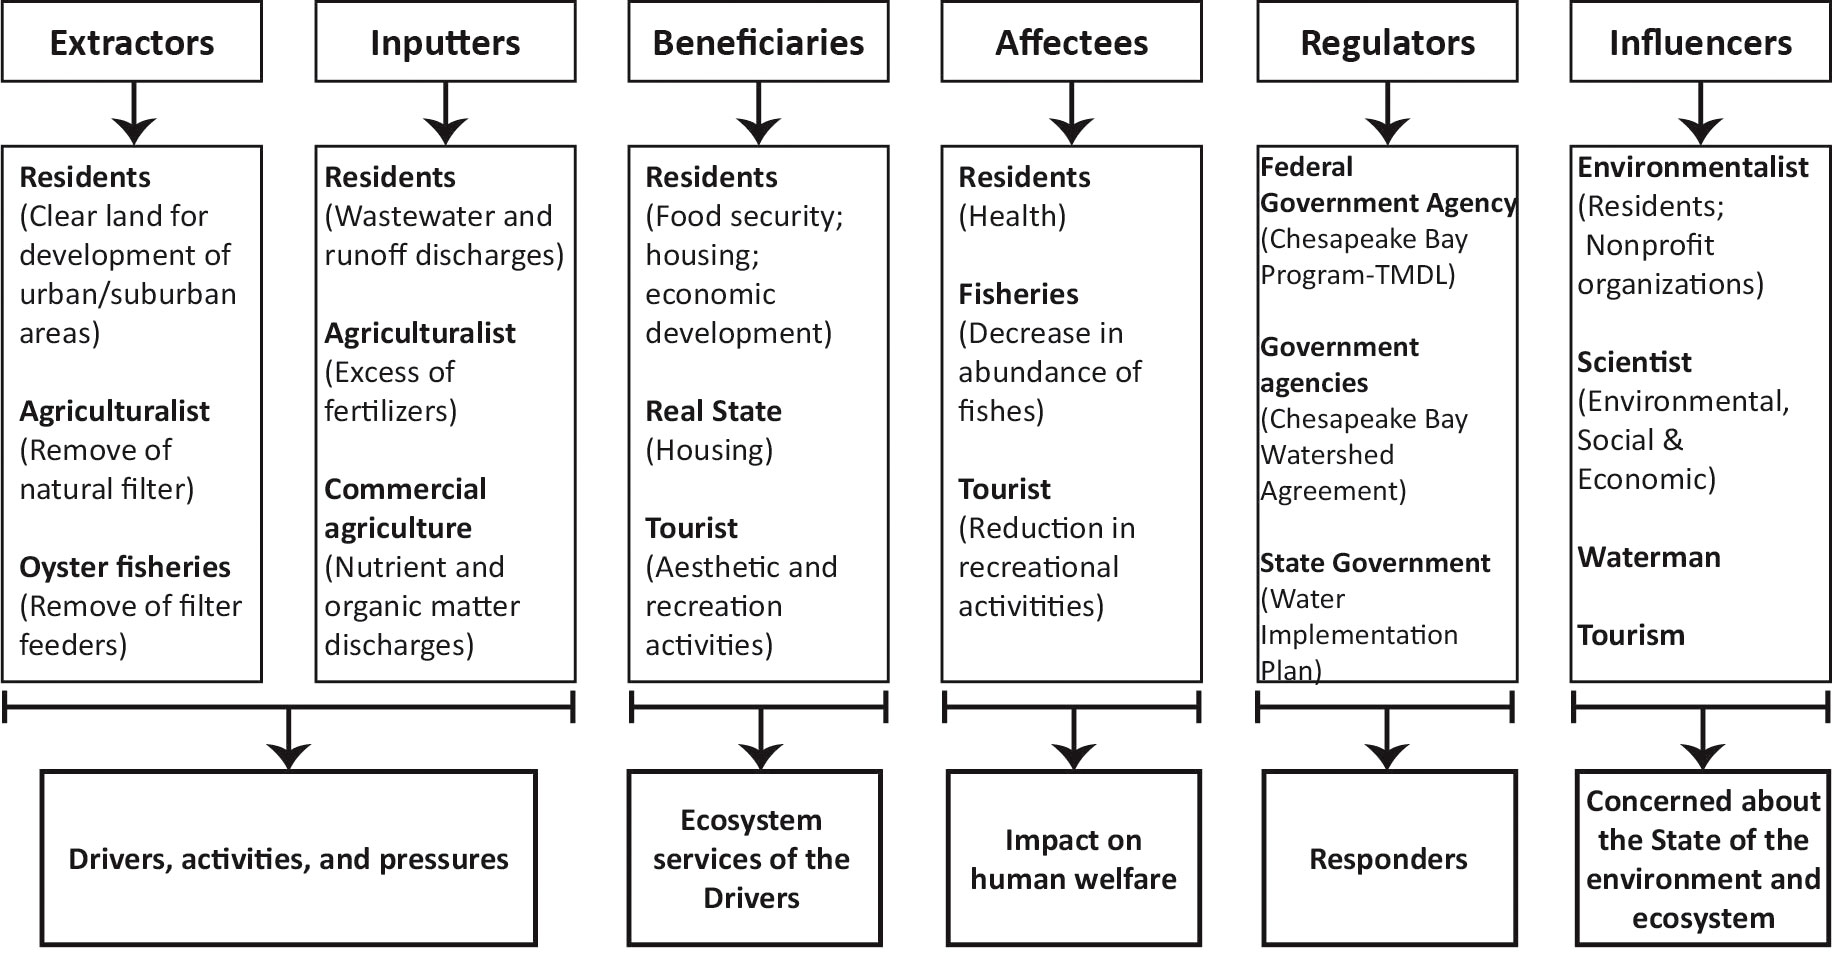
Figure 13 Conceptual map of the participatory stakeholders of the Chesapeake Bay Watershed based on the typology used in Newton and Elliott (2016).
In Figure 13, the stakeholders in almost all the categories are the residents of the Chesapeake Bay Watershed. In extractors, they represent the urban/suburban development that has cleared the land for roads, homes, and businesses (Kemp et al., 2005; CBP-Dev, 2023). As inputters, the residents load nutrients from wastewater and urban/suburban discharges (CBP-Nutrients, 2023). Their benefits are food security due to the extensive agriculture and food industry, aesthetics and housing, and job security, which has high economic importance in the USA (Kemp et al., 2005; Walsh et al., 2017; Bilkovic et al., 2019). The people living in the Chesapeake Bay Watershed can also be influencers, participating in management or directly contributing to the Bay’s health (CBF, 2023; CBP-Nutrients, 2023). However, because the Watershed is very diverse, people feel more connected by the political boundaries, as there is a difference in governmental dependency on rural and urban development (McKendry, 2009).
The main activity and source of nutrients (~60%) in the Chesapeake Bay is agriculture, with 28% of cover in the Watershed (Williams et al., 2009). Agriculturalists were extractors until the mid-nineteenth century, when fertilizer use allowed the reduction of deforestation, after which they became fertilizer inputters (Kemp et al., 2005).
Living near the Bay provides a range of recreational and aesthetic activities. Real estate markets have provided this unique service and have become one of the beneficiary’s stakeholders (Walsh et al., 2017). The same activities that benefit this group also benefit tourism, which, in turn, benefits the residents. In 2009, tourists spent $58 billion in Maryland, Pennsylvania, Virginia, and Washington DC, supporting 600,000 jobs, contributing $14.9 billion in labor income, and paying $9.4 billion in taxes (Phillips and McGee, 2016). The Chesapeake Bay provides countless valuable and quantifiable economic goods and services. These include food availability, such as fish, crabs, clams, and oysters. Additionally, the last also contributes to the shipping and fishing industries. On the other hand, the beautiful scenery promotes recreation, tourism, and some of the country’s highest property values (Phillips and McGee, 2016).
Fisheries provide substantial jobs and tourism in the Bay; the estuary is home to 345 species of finfish and 173 species of shellfish, many of which have been fished commercially and recreationally for generations (CBF-Fisheries, 2023). In 2016, the Fisheries Economics of the USA report by the National Oceanic and Atmospheric Administration (NOAA) indicated that the commercial seafood industry in Maryland and Virginia contributed 1.4 billion in sales, almost 539 million in income, and more than 30,000 jobs to the local economy (CBF-Fisheries, 2023). The main commercial fisheries are blue crabs and oysters, although there are also striped bass, menhaden, and shad (Paolisso, 2007).
There are two fisheries stakeholders; the first is positioned in extractors and includes oyster fisheries. The other commercial fisheries are not presented, mainly because of their lack of relation to eutrophication. The over-extraction of oysters has impacted nutrient filtration time, which has increased eutrophication in the Bay (Figure 10) (Kemp et al., 2005). However, the oyster industry, including catch, sale, shucking, packing, and shipping, has contributed millions of dollars to the region’s economy, which means the oysters have an important economic role in the socio-ecological system (CBP-Oysters, 2023).
The other fisheries stakeholders are positioned as affectees. The main cause of habitat loss in the Chesapeake Bay is eutrophication. The algae blooms deplete oxygen and block sunlight and have affected the entire Bay ecosystem with consequences for fish resources (Boesch et al., 2001; Morgan and Owens, 2001; Frankel et al., 2022). Buchheister et al. (2013) found that the increase in nutrients can lead to lower habitat availability for fish. Additionally, Morgan and Owens (2001) have linked eutrophication in the Chesapeake Bay to outbreaks of Pfiesteria, a toxin that causes lesions on fish; there is also physiological stress and death to fish species and other aquatic organisms. Moreover, the combination of ecosystem degradation and excessive fishing pressure has depleted the stocks and set the stage for a decline.
The Chesapeake Bay’s governance is divided into six states in the USA, so it is important to elaborate on the regulator’s stakeholders. The system was the first estuary in the nation targeted by Congress after the rapid loss of wildlife and aquatic life. Since then, several written agreements have guided the efforts to reduce pollution and restore the ecosystem, led by the CBP. The CBP partners include federal and state agencies, local governments, nonprofit organizations, and academic institutions (CBP-Who, 2023).
In 2009, the CBP began drafting a new agreement to accelerate restoration and align federal directives with state and local goals to create a healthy Bay. The partners gathered input from citizens, stakeholders, academic institutions, local governments, and more to draft an inclusive, goal-oriented document that addresses current and emerging environmental concerns, the CBWA (CBP-Who, 2023). The initiative to incorporate, consult, and lead new stakeholders to participate in management has been rising to benefit the system’s well-being.
3.3 Management responses
Millions of dollars have been spent researching eutrophication and water quality in the Chesapeake Bay. This has yielded an enormous amount of data, information, and knowledge. Water quality improvements are evident (Frankel et al., 2022), but improvements have been slow despite numerous restoration activities (Chang et al., 2021). Solutions that will result in the improvements required to achieve restoration goals remain elusive. The DAPSI(W)R(M) analysis summarized and synthesized the extensive research, management, and governance around the Chesapeake Bay issue of eutrophication. Furthermore, the results of the stakeholder typology analysis defined their role in a participatory process.
Good water quality and a healthy watershed are vital to human welfare and well-being, which is why there is robust environmental management in the region. This has allowed social benefits such as food security for the agriculture, fishing, and food industries; housing and aesthetics; and job security (Kemp et al., 2005; Walsh et al., 2017; Bilkovic et al., 2019). The current governance structure and economy are based on growth (Hickel et al., 2022) without sufficient attention to sustainability. Under “business as usual,” the degradation of ecosystem services will continue until it has a significant IMPACT on human welfare, the economic sectors of fisheries and tourism, as well as the well-being of residents (Phillips and McGee, 2016; Hickel et al., 2022).
Overall, there is extensive ecosystem-based management with significant engagement of stakeholders, which benefits the management of water quality. There are existing laws, policies, implementation, and accountability tools based on scientific knowledge. Despite all this, the issue of eutrophication has not yet been resolved. There are several theories about this, mostly attributed to the lag time and climate change context (Meals et al., 2010; Du et al., 2018), but also societal barriers and obstacles (Boesch, 2019).
Challenges for stakeholders and regulators remain. Science and policy working together can bridge these barriers, broaden and diversify management options, and assess the implementation and effectiveness of management measures. An adaptive management tool such as DAPSI(W)R(M) can be used in a cyclical manner to periodically monitor management success.
Most of the drivers identified in the Chesapeake Bay have fundamental biological and physiological needs. The increase in pressures is mainly linked to population growth, which will keep growing beyond the carrying capacity of the ecosystem. This is mainly because many stakeholders are unaware of the valuable ecosystem services and the externalities from the multiple activities that exert pressure on the system. This is a classic case of the tragedy of the commons (Hardin, 1968). A bridge is needed that links ecosystem health to the well-being of residents. Part of the solution may be more active community-based management for governing the commons, as advocated by Ostrom (1990) and his followers. These are not new ideas; however, they continue to be difficult to put into practice in large systems with many social actors and powerful economic sectors. In this context, financial tools and mechanisms, such as economic incentives or tax reduction, may be an attractive mind-set changer and more effective than taxes and fines, which engender counter-lobbies and expensive lawsuits. Furthermore, social benefits can be added to the environmental benefits. Moore et al. (2007) found that involvement in the management of land for conservation helps mental health, social capital, feeling safer in the local community, and the development of skills. This was particularly true for the male members of the study, who had higher levels of health and better satisfaction with daily activities.
There have been extensive research, management, and governance responses to the economic sectors and activities that contribute to the eutrophication of the Chesapeake Bay. The focus has been to decrease the nutrient runoff from point/nonpoint sources through land protection in the watershed and restoration projects of vital habitats at the coast. There are BMPs for agriculture activities and management for fisheries. There is the Clean Water Act, Clean Air Act, TMDL, and WIP document to follow for management plans. Additionally, there are accountability tools to follow the management plans. The Chesapeake Bay Foundation has been highly effective in advocating for environmental protection and rehabilitation. The report cards have kept the stakeholders, manager, and public informed about the overall ecological health.
Urban sprawl from urban development sectors in the Chesapeake Bay Watershed is another activity that has limited regulation, rather than regulation for limitation and sustainability. Substantial segments of the US population continue to distrust science-based solutions (Krause et al., 2019), especially in the context of private property, so this becomes a social–political barrier to many science-policy solutions. Inadequate urban development regulations result in land-use change, urban sprawl, and more infrastructure. Limits to urban development are lacking, and there is poor accountability for the consequences of urban growth along tributaries and shorelines. This increases pressures from effluents from housing and industry and NOx emissions from transportation and industry and decreases connected forest and other nutrient buffers. Bibri et al. (2020) proposed a bridge to decrease sprawl by applying “compact city growth,” a relatively high-density, mixed-use city with efficient public transport that encourages walking and cycling, with obvious health and fitness benefits as well as an improved environment. Furthermore, compact city growth can be beneficial to decreasing car dependency, increasing connected forests, and enhancing social activities by reducing social exclusion (Saif et al., 2018).
The Chesapeake Bay Program has regulated the pressures on the ecosystem from point and nonpoint sources. However, there is a lot of uncertainty about the total nutrient input from nonpoint sources. Numerical models have reconciled nonpoint source calculations with observation (Frankel et al., 2022). The numerical model results have conveyed a sense of confidence in the implementation and effectiveness of the management (Meals et al., 2010; Boesch, 2019). However, these results have not met the stakeholders’ expectations (Meals et al., 2010; Boesch, 2019; Frankel et al., 2022). Frankel et al. (2022) attribute the lack of expected results to the increase in temperature because of climate change. A bridge proposed by Boesch (2019) is that numerical models must be as complex as necessary and be constantly compared with observations.
The bridge to manage expectations is to clearly understand the difference between models and observation results. There are BMPs and CASTs in agriculture. The latter one is a Web-based nitrogen, phosphorus, and sediment load estimator tool that helps apply the BMP in an area. This provides users with the most cost-effective practices to reduce pollutant loads. Since 2014, agriculturists have voluntarily implemented many BMPs as they feel responsible for the water quality (Fox et al., 2021). The application has generally been well received by farmers, as it shows significant cost savings (Ator et al., 2020).
Significant nutrient reduction could be achieved by improving in agricultural practices. Farmers commonly exceed fertilizer application rates with no extra crop yield (Boesch, 2019). Unpopular (Guo et al., 2021), but effective accountability tools can be applied to estimate the cost of damage this is causing and apply tariffs or fines according to the “polluter pays” principle (Ambec and Ehlers, 2016). Policies and regulations limiting farming subsidies to those using lower application rates can reduce nutrient pressure significantly. Such regulations benefit economic sectors that depend on the Chesapeake’s water quality and ecosystem health, such as fisheries, real estate, and tourism. They also save the farmers money on excessive and expensive agrochemicals.
Other mutually beneficial “win–win” options are possible. For example, livestock operation in the Watershed has increased the nutrient input from manure (Kleinman et al., 2012). This excess manure can be managed, up to a point, as natural fertilizer in crop production (Kleinman et al., 2012; Yılmaz et al., 2019). The farmers that apply manure could reduce the application of synthetic fertilizers and maintain regional food security while reducing environmental pressures. The main barrier is the lack of financial support for lower-income farms (Fox et al., 2021). Once more, financial instruments, such as progressive taxation of agrochemicals, could provide a bridge of financial support and subsidies to farms to implement the BMPs.
In this context, nutrient buffers, e.g., riparian vegetation and wetland conservation, are cost-effective management measures for nonpoint sources. Currently, the management of vital habitats is increasing, but with little improvement in the water quality (CP-VitalHabitats, 2023). Hence, clear management plans and realistic goals are needed.
There are no clear accountability responses when laws and policies are violated (Ostrom, 2011). Engaging responsible parties at the highest governance level is an important bridge to achieving the desired outcomes (Boesch, 2019). Once again, financial mechanisms, such as fines and incentives, may be useful. Menold (2021) proposed three governance solutions: improve incentives, courts to handle violations, and fines for violations. A good example of this is the over-extraction of bivalves, especially oysters, which has degraded an important ecosystem service provided by the biofiltering of oyster reefs. The collected fines could be used for research on sustainable oyster harvest methods or oyster cultivation. The incentives could support fishermen or residents from the Watershed that foster oyster reefs on their property or fishermen that have developed their own sustainable harvest methods. Oyster restoration seems to be increasing; however, the population is less than 1% of the original, and there is also a high risk of diseases and mortality due to climate change and decreased reef habitats (Boesch, 2006; Najjar et al., 2010; NOAA-Fisheries, 2023). So, the management questions remain: What extent of oysters’ reefs is needed to significantly improve the water quality? Where is the best place to locate them to ensure their natural growth? How many have died since the restoration started? How many are still alive since the restoration started?
After the implementation of ecosystem-based management, there has been an improvement in the decrease in hypoxia area extent and duration (Frankel et al., 2022). However, there has been a higher expectation of the results from the stakeholders (Meals et al., 2010; Frankel et al., 2022). The reality is that it can take years to restore an ecosystem, if at all (Duarte et al., 2009; O’Higgins et al., 2014). Even complex models do not faithfully reproduce ecosystem complexity because there are always sources of uncertainty. Nevertheless, this does not mean that the management to abate eutrophication should stop. On the contrary, there should be more decisive actions and the simultaneous application of several management measures. There are positive signals that if the current reduction from TMDL in the region is met, the health of the Bay will continue to improve, even with the potential impact of climate change (Irby et al., 2018).
Climate change can change biochemical and physical flows. In Chesapeake Progress, there is a climate change category, which shows the continuous monitoring and assessment of the impacts and the start of an organization for climate adaptation (CP-Climate Change, 2023). The current projections of climate change in the Chesapeake Bay Watershed are temperature increase, accelerated SLR, and altered precipitation. These cannot be managed, so they can only be mitigated. Maryland is the leader in coastal adaptation for climate change. The Maryland coastal adaptation report cards of 2021 (RC-CoastalAdaptation, 2023) gave a score of B− (~70/100). The categories of ecosystem and planning climate change have significant investment to achieve adaptation goals, and there is progress in flooding and socio-economic adaptations. However, there are still challenges, such as more data, updated goals, and improved access to funding (RC-CoastalAdaptation, 2023). Therefore, more work is required.
The bridge to this barrier is to develop, implement, and assess climate change adaptation projects, such as green infrastructure management options. Green infrastructure has the potential to mitigate urban flooding, attenuate indoor temperatures and heat islands, improve air quality, and muffle noise (Nieuwenhuijsen, 2021). Additionally, it improves aesthetic and environmental injustices. Green infrastructure can also increase economic well-being, reduce violence, improve health, and develop a sense of belonging (Wood et al., 2017; Nieuwenhuijsen, 2021). On the coastline, the green infrastructure could focus on the oyster reefs and a “living shoreline.” Examples of these living shorelines as natural or constructed habitats include emergent marsh grasses, riparian vegetation, and coarse woody debris (Davis et al., 2006). That could be used to decrease the degradation of coastal habitats, stabilize the shoreline from the SLR acceleration, and mitigate the input of nutrients from increased precipitation.
A long-term, cost-effective bridge can be provided by science communication. This is a useful tool to educate the public and enhance their awareness of ecosystem services and benefits. A good understanding of the cost and benefits to public well-being and welfare is fundamental to gaining public support. This can lead to a better understanding by nonscientific actors of how models work, what the lag time is, and how climate change uncertainties can change the expected results.
However, the question remains as to why the management has not been able to decrease the eutrophication more rapidly. This is mainly because changing the system has costs for some or many stakeholders. However, the impacts on the social welfare of a degraded ecosystem are also multiple. They include loss of shoreline, loss of open natural space, loss of affordable food resources, and loss of job security. The main barrier is a lack of understanding of how changes in the socio-ecological system of health impact socio-economic science and policy, which requires complex interdisciplinarity (Elofsson et al., 2003).
Once more, the main bridge is education about sustainability and growth. Understanding sustainable development (Keeble, 1988) makes the implementation of regulatory requirements and accountability more acceptable to stakeholders and stimulates engagement in participatory processes. Unfortunately, most residents of the Bay do not feel a “sense of place” related to the environment (Ardoin, 2014). Developing a sense of place would mean that residents would feel a greater responsibility for environmental health and be more active in community-based management. This could improve mental health and a sense of accomplishment (Moore et al., 2007).
Using a range of synergetic environmental management measures requires multi-stakeholder engagement and changes in the socio-economic culture. For example, “citizen science” actions to engage residents to be more involved in the management of the region relieves cost burdens on regulatory agencies for environmental monitoring (Tulloch et al., 2013).
Multiple bridges are necessary to solve the complex issue of eutrophication. The coordination of communication between stakeholders is critical. It is therefore vital for the science stakeholders to communicate science and knowledge at all levels, from schoolchildren to decision-makers, so the long-term benefits of changing “business-as-usual” practices are fully understood in the science-policy context (Tambe et al., 2023). The government also has a vital role in encouraging holistic management that considers the benefits of the ecosystem health, increases accountability and incentives, and creates new projects to develop the social benefits.
4 Conclusion
Good water quality in the Chesapeake Bay Watershed benefits all stakeholders. However, eutrophication is still one of the main issues, and there has been slow improvement in environmental health, despite robust, environmental management responses that mitigate eutrophication effects. The analysis showed that the business as usual socio-economic system includes barriers to effective management in linking science policy and environmental economics. The high economic value of ecosystem services and the cost of externalities from specific economic activities are not fully considered.
The current management shows promising results, but further efforts are required to improve the water quality. Using a range of management options may bridge this gap to the benefit of all stakeholders. These management options include nature-based solutions, compact cities to limit urban sprawl, green infrastructure, restoration of natural habitats, constructed habits, a range of financial instruments with incentives as well as penalties, and effective science communication for all audiences, from schoolchildren to decision makers.
Improved communication and coordination between stakeholders are key to improving environmental health and subsequent human wellbeing. Effective science communication can raise public awareness of concepts such as the value of ecosystem services, the cost of externalities, the context of climate change, environmental sustainability, management lag-time constraints, improved farming and fishing practices, social benefits, human well-being, and welfare. Effective engagement and stakeholder participation, as well as programs that encourage citizen involvement in monitoring and restoration, help to develop a “sense of place” and community-based management. In conclusion, although eutrophication is a complex “wicked” problem, there is both a scientific knowledge base and a range of management options to restore the magnificent Chesapeake Bay for the benefit of all stakeholders.
Data availability statement
The original contributions presented in the study are included in the article/supplementary material. Further inquiries can be directed to the corresponding author.
Author contributions
MO, AN, HK: Contributed to the conception and design of the study. MO, HK gathered the information about the socio-ecologic system. AN organized and interpreted the data to apply the holistic framework. MO developed the manuscript outline and first draft. AN, HK wrote sections of the manuscript. All authors contributed to manuscript revision, read, and approved the submitted version.
Funding
This research was supported by the Murray Foundation and the ERASMUS+ program of the European Commission, Erasmus Mundus Joint Master Degree in Water and Coastal Management (WACOMA) 2020/2022 (WACOMA; Project No. 586596-EPP-1-2017-1-IT-EPPKA1-JMD-MOB). We acknowledge the funding provided by FCT for the projects LA/P/0069/2020 awarded to the Associate Laboratory ARNET and UID/00350/2020 awarded to CIMA of the University of Algarve.
Acknowledgments
The lead author thanks ARNET-CIMA of the Universidade do Algarve, the University of Maryland Center for Environmental Science, and ARNET-CIMA of the University of Algarve. AN acknowledges Future Earth Coasts, IMBeR, and the Ocean KAN.
Conflict of interest
Author MO was employed by Murray Foundation, c/o Brabners LLP.
The remaining authors declare that the research was conducted in the absence of any commercial or financial relationships that could be construed as a potential conflict of interest.
Publisher’s note
All claims expressed in this article are solely those of the authors and do not necessarily represent those of their affiliated organizations, or those of the publisher, the editors and the reviewers. Any product that may be evaluated in this article, or claim that may be made by its manufacturer, is not guaranteed or endorsed by the publisher.
References
Ambec S., Ehlers L. (2016). Regulation via the polluter-pays principle. Economic J. 126 (593), 884–906. doi: 10.1111/ecoj.12184
Ardoin N. M. (2014). Exploring sense of place and environmental behavior at an ecoregional scale in three sites. Hum. Ecol. 42 (3), 425–441. doi: 10.1007/s10745-014-9652-x
Arnold R. R., Dennison W. C., Etgen L. A., Goodwin P., Paolisso M., Shenk G. W., et al. (2021). Chesapeake Bay: A case study in resiliency and restoration. International Association for Hydro-Environment Engineering and Research. Hydrolink, 1, 25–28.
Ator S. W., Blomquist J. D., Webber J. S., Chanat J. G. (2020). Factors driving nutrient trends in streams of the Chesapeake Bay watershed. J. Environ. Qual. 49 (4), 812–834. doi: 10.1002/jeq2.20101
Bibri S. E., Krogstie J., Kärrholm M. (2020). Compact city planning and development: Emerging practices and strategies for achieving the goals of sustainability. Developments Built Environ. 4, 100021. doi: 10.1016/j.dibe.2020.100021
Bigalbal A., Rezaie A., Garzon J., Ferreira C. (2018). Potential impacts of sea level rise and coarse scale marsh migration on storm surge hydrodynamics and waves on coastal protected areas in the Chesapeake Bay. J. Mar. Sci. Eng. 6 (3), 86. doi: 10.3390/jmse6030086
Bilkovic D. M., Mitchell M. M., Havens K. J., Hershner C. H. (2019). Chapter 15 - Chesapeake Bay. World Seas: An Environmental Evaluation (Second Edition) (Academic Press), 379–404. doi: 10.1016/B978-0-12-805068-2.00019-X
Birch M. B. L., Gramig B. M., Moomaw W. R., Doering O. C. III, Reeling C. J. (2011). Why metrics matter: evaluating policy choices for reactive nitrogen in the Chesapeake Bay watershed. Environ. Sci. Technol. 45 (1), 168–174. doi: 10.1021/es101472z
Boesch D. F. (2006). Scientific requirements for ecosystem-based management in the restoration of Chesapeake Bay and Coastal Louisiana. Ecol. Eng. 26 (1), 6–26. doi: 10.1016/j.ecoleng.2005.09.004
Boesch D. F. (2019). Barriers and bridges in abating coastal eutrophication. Front. Mar. Sci. 6. doi: 10.3389/fmars.2019.00123
Boesch D. F., Brinsfield R. B., Magnien R. E. (2001). Chesapeake Bay eutrophication: scientific understanding, ecosystem restoration, and challenges for agriculture. J. Environ. Qual. 30 (2), 303–320. doi: 10.2134/jeq2001.302303x
Bricker S. B., Longstaff B., Dennison W., Jones A., Boicourt K., Wicks C., et al. (2008). Effects of nutrient enrichment in the nation’s estuaries: A decade of change. Harmful Algae 8 (1), 21–32. doi: 10.1016/j.hal.2008.08.028
Buchheister A., Bonzek C., Gartland J., Latour R. (2013). Patterns and drivers of the demersal fish community of Chesapeake Bay. Mar. Ecol. Prog. Ser. 481, 161–180. doi: 10.3354/meps10253
Carr E. R., Wingard P. M., Yorty S. C., Thompson M. C., Jensen N. K., Roberson J. (2007). Applying DPSIR to sustainable development. Int. J. Sustain. Dev. World Ecol. 14 (6), 543–555. doi: 10.1080/13504500709469753
CBF (2023) Homepage—Chesapeake Bay Foundation. Available at: https://www.cbf.org/index.html.
CBF-Fisheries (2023) Fisheries. Available at: https://www.cbf.org/issues/fisheries/index.html.
CBF-Population (2023) Population Growth. Available at: https://www.cbf.org/about-the-bay/maps/land-use/population-growth.html.
CBF-Restore (2023) Restore—Chesapeake Bay Foundation. Available at: https://www.cbf.org/about-cbf/our-mission/restore/.
CBF-Sprawl (2023) Sprawl—Chesapeake Bay Foundation. Available at: https://www.cbf.org/issues/land-use/the-impact-of-sprawl.html.
CBP-Accomplishments (2023) Our Accomplishments. Chesapeake Bay. Available at: https://www.chesapeakebay.net/what/accomplishments.
CBP-AirPollution (2023) Air Pollution. Chesapeake Bay. Available at: https://www.chesapeakebay.net/issues/threats-to-the-bay/air-pollution.
CBP-AR (2023) Agricultural Runoff. Chesapeake Bay. Available at: https://www.chesapeakebay.net/issues/threats-to-the-bay/agricultural-runoff.
CBP-BMP (2018) Chesapeake Bay Program Quick Reference Guide for Best Management Practices (BMPs): Nonpoint Source BMPs to Reduce Nitrogen, Phosphorus and Sediment Loads to the Chesapeake Bay and its Local Waters. CBP/TRS-323-18. Available at: https://d18lev1ok5leia.cloudfront.net/chesapeakebay/documents/BMP-Guide_Full.pdf.
CBP-BMPs (2023) Best Management Practices: Protecting the Chesapeake Bay. Available at: https://d18lev1ok5leia.cloudfront.net/chesapeakebay/documents/BMP_Fact_Sheet_final.pdf.
CBP-Dev (2023) Development. Chesapeake Bay. Available at: https://www.chesapeakebay.net/issues/threats-to-the-bay/development.
CBP-Highway (2009) Chesapeake Bay states push Congress for tighter highway runoff controls. Chesapeake Bay. Available at: https://www.chesapeakebay.net/news/blog/chesapeake-bay-states-push-congress-for-tighter-highway-runoff-controls.
CBP-Issues (2023) Learn the Issues. Chesapeake Bay. Available at: https://www.chesapeakebay.net/issues.
CBP-Nutrients (2023) Nutrient Runoff. Chesapeake Bay. Available at: https://www.chesapeakebay.net/issues/threats-to-the-bay/nutrient-runoff.
CBP-Oysters (2023) Oysters. Chesapeake Bay. Available at: https://www.chesapeakebay.net/issues/whats-at-risk/oysters.
CBP-TMDL (2023) Chesapeake Bay TMDL. Chesapeake Bay. Available at: https://www.chesapeakebay.net/what/programs/total-maximum-daily-load.
CBP-Who (2023) Our History. Chesapeake Bay. Available at: https://www.chesapeakebay.net/who/bay-program-history.
CBP-WIP (2023) Watershed Implementation Plans. Chesapeake Bay. Available at: https://www.chesapeakebay.net/what/programs/watershed-implementation-plans.
CBWA (2014) Chesapeake Bay Watershed Agreement. Available at: https://d38c6ppuviqmfp.cloudfront.net/documents/ecbrief/21605/agreement_–_final_for_briefing_book_6.11.14.pdf.
Chang S. Y., Zhang Q., Byrnes D. K., Basu N. B., Van Meter K. J. (2021). Chesapeake legacies: The importance of legacy nitrogen to improving Chesapeake Bay water quality. Environ. Res. Lett. 16 (8), 085002. doi: 10.1088/1748-9326/ac0d7b
Compton J. E., Harrison J. A., Dennis R. L., Greaver T. L., Hill B. H., Jordan S. J., et al. (2011). Ecosystem services altered by human changes in the nitrogen cycle: A new perspective for US decision making: Ecosystem services and nitrogen management. Ecol. Lett. 14 (8), 804–815. doi: 10.1111/j.1461-0248.2011.01631.x
Cooper S. R. (1995). Chesapeake Bay watershed historical land use: impact on water quality and diatom communities. Ecol. Appl. 5 (3), 703–723. doi: 10.2307/1941979
CP-Climate Change (2023) Climate Change. Chesapeake Progress. Available at: https://www.chesapeakeprogress.com/climate-change.
CP-Forest (2023) Forest Buffers. Chesapeake Progress. Available at: https://www.chesapeakeprogress.com/abundant-life/forest-buffers.
CP-Oysters (2023) Oysters—Chesapeake Progress. Available at: https://www.chesapeakeprogress.com/abundant-life/oysters.
CP-ProtectedLand (2023) Protected Lands. Chesapeake Progress. Available at: https://www.chesapeakeprogress.com/conserved-lands/protected-lands.
CP-SAV (2023) Submerged Aquatic Vegetation (SAV). Chesapeake Progress. Available at: https://www.chesapeakeprogress.com/abundant-life/sav.
CP-VitalHabitats (2023) Abundant Life. Chesapeake Progress. Available at: https://www.chesapeakeprogress.com/abundant-life.
CP-Wetlands (2023) Wetlands. Chesapeake Progress. Available at: https://www.chesapeakeprogress.com/abundant-life/wetlands.
CP-WIPs (2023) 2025 Watershed Implementation Plans (WIPs). Chesapeake Progress. Available at: https://www.chesapeakeprogress.com/clean-water/watershed-implementation-plans.
CP-WQ (2023) Water Quality Standards Attainment and Monitoring. Chesapeake Progress. Available at: https://www.chesapeakeprogress.com/clean-water/water-quality.
Cuker B. E. (Ed.) (2020). Diet for a sustainable ecosystem: The science for recovering the health of the Chesapeake Bay and its people. Springer Nature Switzerland AG 2020 (Cham: Springer). doi: 10.1007/978-3-030-45481-4
Curtin P. D., Brush G. S., Fisher G. W. (Eds.). (2001). Discovering the Chesapeake: The History of an Ecosystem (Baltimore, MD: Johns Hopkins University Press).
Da F., Friedrichs M. A. M., St-Laurent P. (2018). Impacts of atmospheric nitrogen deposition and coastal nitrogen fluxes on oxygen concentrations in Chesapeake Bay. J. Geophysical Research: Oceans 123 (7), 5004–5025. doi: 10.1029/2018JC014009
Davis J. L., Takacs R. L., Schnabel R. (2006). Evaluating ecological impacts of living shorelines and shoreline habitat elements: An example from the upper western Chesapeake Bay. Erdle S. Y., Davis J. L.D., Sellner K. G. (Eds.), Management, Policy, Science, and Engineering of Nonstructural Erosion Control in the Chesapeake Bay. CRC Publ. No. 08-164, Chesapeake Bay, pp. 55–61.
D’Elia C. F., Bidjerano M., Wheeler T. B. (2019). Chapter 17 - Population growth, nutrient enrichment, and science-based policy in the Chesapeake Bay Watershed. Coasts and Estuaries (Elsevier), 293–310. doi: 10.1016/B978-0-12-814003-1.00017-4
DeLuca W. V., Studds C. E., Rockwood L. L., Marra P. P. (2004). Influence of land use on the integrity of marsh bird communities of Chesapeake Bay, USA. Wetlands 24 (4), 837–847. doi: 10.1672/0277-5212(2004)024[0837:IOLUOT]2.0.CO;2
Du J., Shen J. (2017). Transport of riverine material from multiple rivers in the chesapeake bay: important control of estuarine circulation on the material distribution: material distribution in Chesapeake Bay. J. Geophysical Research: Biogeosciences 122 (11), 2998–3013. doi: 10.1002/2016JG003707
Du J., Shen J., Park K., Wang Y. P., Yu X. (2018). Worsened physical condition due to climate change contributes to the increasing hypoxia in Chesapeake Bay. Sci. Total Environ. 630, 707–717. doi: 10.1016/j.scitotenv.2018.02.265
Duarte C. M., Conley D. J., Carstensen J., Sánchez-Camacho M. (2009). Return to Neverland: shifting baselines affect eutrophication restoration targets. Estuaries Coasts 32 (1), 29–36. doi: 10.1007/s12237-008-9111-2
Elliott M. (2014). Integrated marine science and management: Wading through the morass. Mar. pollut. Bull. 86 (1-2), 1–4. doi: 10.1016/j.marpolbul.2014.07.026
Elliott M., Burdon D., Atkins J. P., Borja A., Cormier R., De Jonge V. N., et al. (2017). “And DPSIR begat DAPSI(W)R(M)!”—A unifying framework for marine environmental management. Mar. pollut. Bull. 118 (1-2), 27–40. doi: 10.1016/j.marpolbul.2017.03.049
Elofsson K., Folmer H., Gren I.-M. (2003). Management of eutrophicated coastal ecosystems: A synopsis of the literature with emphasis on theory and methodology. Ecol. Economics 47 (1), 1–11. doi: 10.1016/j.ecolecon.2003.09.001
Fox R. J., Fisher T. R., Gustafson A. B., Koontz E. L., Lepori-Bui M., Kvalnes K. L., et al. (2021). An evaluation of the Chesapeake Bay management strategy to improve water quality in small agricultural watersheds. J. Environ. Manage. 299, 113478. doi: 10.1016/j.jenvman.2021.113478
Frankel L. T., Friedrichs M. A. M., St-Laurent P., Bever A. J., Lipcius R. N., Bhatt G., et al. (2022). Nitrogen reductions have decreased hypoxia in the Chesapeake Bay: Evidence from empirical and numerical modeling. Sci. Total Environ. 814, 152722. doi: 10.1016/j.scitotenv.2021.152722
Gallo-Vélez D., Restrepo J. C., Newton A. (2022). A socio-ecological assessment of land-based contamination and pollution: The Magdalena delta, Colombia. Front. Mar. Sci. 9. doi: 10.3389/fmars.2022.1057426
Gari S. R., Newton A., Icely J. D. (2015). A review of the application and evolution of the DPSIR framework with an emphasis on coastal social-ecological systems. Ocean Coast. Manage. 103, 63–77. doi: 10.1016/j.ocecoaman.2014.11.013
Garrett M., Taylor B. (2012). Reconsidering social equity in public transit. Berkeley Plann. J. 13 (1), 6–27. doi: 10.5070/BP313113028
Garzon J. L., Ferreira C. M., Padilla-Hernandez R. (2018). Evaluation of weather forecast systems for storm surge modeling in the Chesapeake Bay. Ocean Dynamics 68 (1), 91–107. doi: 10.1007/s10236-017-1120-x
George B. (2019) COMMUNICATING ENVIRONMENTAL JUSTICE: A CASE STUDY OF WATER AND FRACKING. Available at: https://theieca.org/sites/default/files/conference-papers/COCE%202019%20Vancouver/george_barbara-barbara_george.coce_.20192-1161857976.pdf.
Glibert P., Seitzinger S., Heil C., Burkholder J., Parrow M., Codispoti L., et al. (2005). The role of eutrophication in the global proliferation of harmful algal blooms. Oceanography 18 (2), 198–209. doi: 10.5670/oceanog.2005.54
Goetz S. J., Jantz C. A., Prince S. D., Smith A. J., Varlyguin D., Wright R. K and . (2004). Integrated analysis of ecosystem interactions with land use Change: The Chesapeake Bay watershed. R.S. DeFries G.P. Asner R.A. Houghton (Eds.) (Washington DC: Ecosystems and land use change American Geophysical Union) (2004) 153 263–275. doi: 10.1029/153GM20
Guo T., Campbell-Arvai V., Cardinale B. J. (2021). Why does the public support or oppose agricultural nutrient runoff regulations? The effects of political orientation, environmental worldview, and policy specific beliefs. J. Environ. Manage. 279, 111708. doi: 10.1016/j.jenvman.2020.111708
Hardaway C. S., Byrnes D. K. (1999). Shoreline Management In Chesapeake Bay. Special Report in Applied Marine Science and Ocean Engineering No. 356.; Virginia Sea Grant Publication no. VSG-99-11. Virginia Institute of Marine Science, William & Mary. doi: 10.21220/V5DB1X
Hardin G. (1968). The Tragedy of the Commons: The population problem has no technical solution; it requires a fundamental extension in morality. Science 162 (3859), 1243–1248. doi: 10.1126/science.162.3859.1243
Haven D. S., Hargis W. J. Jr., Kendall P. C. (1978). The oyster industry of Virginia : its status, problems, and promise : a comprehensive study of the oyster industry in Virginia. Special Papers in Marine Science; No. 4. Virginia Institute of Marine Science, William & Mary. doi: 10.21220/V5C88K
Hickel J., Kallis G., Jackson T., O’Neill D. W., Schor J. B., Steinberger J. K., et al. (2022). Degrowth can work—Here’s how science can help. Nature 612 (7940), 400–403. doi: 10.1038/d41586-022-04412-x
Hood R. R., Shenk G. W., Dixon R. L., Smith S. M. C., Ball W. P., Bash J. O., et al. (2021). The Chesapeake Bay program modeling system: Overview and recommendations for future development. Ecol. Model. 456, 109635. doi: 10.1016/j.ecolmodel.2021.109635
IAN-EnvJus (2023) Developing a framework for an Environmental Justice Index in the Chesapeake Bay Watershed. Available at: https://ian.umces.edu/site/assets/files/27035/developing-a-framework-for-an-environmental-justice-index-in-the-chesapeake-bay-watershed.pdf.
Irby I. D., Friedrichs M. A. M., Da F., Hinson K. E. (2018). The competing impacts of climate change and nutrient reductions on dissolved oxygen in Chesapeake Bay. Biogeosciences 15 (9), 2649–2668. doi: 10.5194/bg-15-2649-2018
Jackson J. B. C., Kirby M. X., Berger W. H., Bjorndal K. A., Botsford L. W., Bourque B. J., et al. (2001). Historical overfishing and the recent collapse of coastal ecosystems. Science 293 (5530), 629–637. doi: 10.1126/science.1059199
Kaufman D. E., Shenk G. W., Bhatt G., Asplen K. W., Devereux O. H., Rigelman J. R., et al. (2021). Supporting cost-effective watershed management strategies for Chesapeake Bay using a modeling and optimization framework. Environ. Model. Software 144, 105141. doi: 10.1016/j.envsoft.2021.105141
Keeble B. R. (1988). The Brundtland report: ‘Our common future’. Med. War 4 (1), 17–25. doi: 10.1080/07488008808408783
Kemp W., Boynton W., Adolf J., Boesch D., Boicourt W., Brush G., et al. (2005). Eutrophication of Chesapeake Bay: Historical trends and ecological interactions. Mar. Ecol. Prog. Ser. 303, 1–29. doi: 10.3354/meps303001
Kenney M. A., Gerst M. D. (2021). Synthesis of indicators, datasets, and frameworks available to establish resilience and adaptation indicators: case study of Chesapeake Bay region, USA. Curr. Climate Change Rep. 7 (2), 35–44. doi: 10.1007/s40641-021-00170-6
Kleinman P., Blunk K. S., Bryant R., Saporito L., Beegle D., Czymmek K., et al. (2012). Managing manure for sustainable livestock production in the Chesapeake Bay Watershed. J. Soil Water Conserv. 67 (2), 54A–61A. doi: 10.2489/jswc.67.2.54A
Krause N. M., Brossard D., Scheufele D. A., Xenos M. A., Franke K (2019). Trends—Americans’ trust in science and scientists. Public Opinion Quarterly 83 (4) 817–836. doi: 10.1093/poq/nfz041
Maryland.gov (2023). Commercial Oysters landing. (Maryland: Department of Natural Resources). Available at: https://dnr.maryland.gov/fisheries/Pages/oysters/Comm_Landings.aspx.
Maryland.gov-DO (2023) Eyes on the Bay: Long-Term Monitoring Data Chart Query. Available at: https://eyesonthebay.dnr.maryland.gov/bay_cond/bay_cond.cfm.
Maslow A. H. (1943). A theory of human motivation. psychol. Rev. 50 (4), 370–396. doi: 10.1037/h0054346
McKendry J. E. (2009). A Socio-Economic Atlas for the Chesapeake Bay Watershed. Chesapeake Bay Program Report. Available at: https://www.chesapeakebay.net/what/publications/socioeconomic-atlas-for-the-chesapeake-bay-watershed1
McLaughlin P., Alexander R., Blomquist J., Devereux O., Noe G., Smalling K., et al. (2022). Power analysis for detecting the effects of best management practices on reducing nitrogen and phosphorus fluxes to the Chesapeake Bay Watershed, USA. Ecol. Indic. 136, 108713. doi: 10.1016/j.ecolind.2022.108713
McLeod K., Leslie H. (Ed.) (2012). Ecosystem-Based Management for the Oceans (Washington DC: Island Press).
Meals D. W., Dressing S. A., Davenport T. E. (2010). Lag time in water quality response to best management practices: A review. J. Environ. Qual. 39 (1), 85–96. doi: 10.2134/jeq2009.0108
Miller Hesed C. D., Van Dolah E. R., Paolisso M. (2020). Engaging faith-based communities for rural coastal resilience: Lessons from collaborative learning on the Chesapeake Bay. Climatic Change 159 (1), 37–57. doi: 10.1007/s10584-019-02638-9
Moore M., Townsend M., Oldroyd J. (2007). Linking human and ecosystem health: the benefits of community involvement in conservation groups. EcoHealth 3 (4), 255–261. doi: 10.1007/s10393-006-0070-4
Morgan C., Owens N. (2001). Benefits of water quality policies: The Chesapeake Bay. Ecol. Economics 39 (2), 271–284. doi: 10.1016/S0921-8009(01)00212-9
Najjar R. G., Pyke C. R., Adams M. B., Breitburg D., Hershner C., Kemp M., et al. (2010). Potential climate-change impacts on the Chesapeake Bay. Estuarine Coast. Shelf Sci. 86 (1), 1–20. doi: 10.1016/j.ecss.2009.09.026
Newell R. (1988). Ecological changes in Chesapeake Bay: Are they the result of over-harvesting the Eastern oyster (Crassostrea virginica)? Understanding estuary: Adv. Chesapeake Bay Res. 129, 536–546.
Newton A., Elliott M. (2016). A typology of stakeholders and guidelines for engagement in transdisciplinary, participatory processes. Front. Mar. Sci. 3. doi: 10.3389/fmars.2016.00230
Nieuwenhuijsen M. J. (2021). Green infrastructure and health. Annu. Rev. Public Health 42 (1), 317–328. doi: 10.1146/annurev-publhealth-090419-102511
NOAA-Oyster (2023). Chesapeake Bay Partners Have Restored 1,220 Acres of Oyster Reef (NOAA Fisheries). Available at: https://www.fisheries.noaa.gov/feature-story/chesapeake-bay-partners-have-restored-1220-acres-oyster-reef.
NOAA-Fisheries. (2023). Ending Overfishing Through Annual Catch Limits. Available at: https://www.fisheries.noaa.gov/national/rules-and-regulations/ending-overfishing-through-annual-catch-limits.
NPS-CB (2022) NPS - Page In-Progress. Available at: https://www.nps.gov/chba/learn/historyculture/index.htm.
O’Higgins T., Cooper P., Roth E., Newton A., Farmer A., Goulding I. C., et al. (2014). Temporal constraints on ecosystem management: Definitions and examples from Europe’s regional seas. Ecol. Soc. 19 (4), art46. doi: 10.5751/ES-06507-190446
Orth R. J., Dennison W. C., Lefcheck J. S., Gurbisz C., Hannam M., Keisman J., et al. (2017). Submersed aquatic vegetation in Chesapeake Bay: sentinel species in a changing world. BioScience 67 (8), 698–712. doi: 10.1093/biosci/bix058
Orth R. J., Williams M. R., Marion S. R., Wilcox D. J., Carruthers T. J. B., Moore K. A., et al. (2010). Long-term trends in submersed aquatic vegetation (SAV) in Chesapeake Bay, USA, related to water quality. Estuaries Coasts 33 (5), 1144–1163. doi: 10.1007/s12237-010-9311-4
Ostrom E. (1990). Governing the Commons: The Evolution of Institutions for Collective Action (Cambridge: Cambridge University Press).
Ostrom E. (2011). Background on the institutional analysis and development framework: ostrom: institutional analysis and development framework. Policy Stud. J. 39 (1), 7–27. doi: 10.1111/j.1541-0072.2010.00394.x
Paerl H. W., Hall N. S., Peierls B. L., Rossignol K. L. (2014). Evolving paradigms and challenges in estuarine and coastal eutrophication dynamics in a culturally and climatically stressed world. Estuaries Coasts 37 (2), 243–258. doi: 10.1007/s12237-014-9773-x
Paolisso M. (2007). Cultural models and cultural consensus of Chesapeake Bay blue crab and oyster fisheries. NAPA Bull. 28 (1), 123–135. doi: 10.1525/napa.2007.28.1.123
Patrick C. J., Weller D. E., Ryder M. (2016). The relationship between shoreline armoring and adjacent submerged aquatic vegetation in Chesapeake Bay and nearby Atlantic Coastal Bays. Estuaries Coasts 39 (1), 158–170. doi: 10.1007/s12237-015-9970-2
Phillips S., McGee B. (2016). Ecosystem service benefits of a cleaner Chesapeake Bay. Coast. Manage. 44 (3), 241–258. doi: 10.1080/08920753.2016.1160205
RC-CoastalAdaptation (2023) Maryland Coastal Adaptation Report Card 2021. Available at: https://ian.umces.edu/site/assets/files/28119/2021-maryland-coastal-adaptation-report-card.pdf.
RC-Publications (2023) Publications | EcoHealth Report Cards. EcoReportCard. Available at: https://ecoreportcard.org/report-cards/chesapeake-bay/publications/.
Richards R. A., Rago P. J. (1999). A Case history of effective fishery management: Chesapeake Bay striped bass. North Am. J. Fisheries Manage. 19 (2), 356–375. doi: 10.1577/1548-8675(1999)019<0356:ACHOEF>2.0.CO;2
Roberts A. D., Prince S. D. (2010). Effects of urban and non-urban land cover on nitrogen and phosphorus runoff to Chesapeake Bay. Ecol. Indic. 10 (2), 459–474. doi: 10.1016/j.ecolind.2009.07.017
Rothschild B., Ault J., Goulletquer P., Héral M. (1994). Decline of the Chesapeake Bay oyster population: A century of habitat destruction and overfishing. Mar. Ecol. Prog. Ser. 111, 29–39. doi: 10.3354/meps111029
Ruark E. A. (2010) Immigration, Population Growth and the Chesapeake Bay. Available at: https://www.fairus.org/issue/publications-resources/immigration-population-growth-and-chesapeake-bay.
Russell K. M., Galloway J. N., Macko S. A., Moody J. L., Scudlark J. R. (1998). Sources of Nitrogen in wet deposition to the Chesapeake Bay region. Atmospheric Environ. 32 (14-15), 2453–2465. doi: 10.1016/S1352-2310(98)00044-2
Saif M. A., Zefreh M. M., Torok A. (2018). Public Transport Accessibility: A Literature Review. Periodica Polytechnica Transportation Eng. 47 (1), 36–43. doi: 10.3311/PPtr.12072
Seitz R. D., Dauer D. M., Llansó R. J., Long W. C. (2009). Broad-scale effects of hypoxia on benthic community structure in Chesapeake Bay, USA. J. Exp. Mar. Biol. Ecol. 381, S4–S12. doi: 10.1016/j.jembe.2009.07.004
Sheeder S. A., Lynch J. A., Grimm J. (2002). Modeling Atmospheric Nitrogen Deposition and Transport in the Chesapeake Bay Watershed. J. Environ. Qual. 31 (4), 1194–1206. doi: 10.2134/jeq2002.1194
Shenk G. W., Linker L. C. (2013). Development and application of the 2010 Chesapeake Bay watershed total maximum daily load model. JAWRA J. Am. Water Resour. Assoc. 49 (5), 1042–1056. doi: 10.1111/jawr.12109
Smith V. H. (2003). Eutrophication of freshwater and coastal marine ecosystems a global problem. Environ. Sci. pollut. Res. 10 (2), 126–139. doi: 10.1065/espr2002.12.142
Smyth K., Christie N., Burdon D., Atkins J. P., Barnes R., Elliott M. (2015). Renewables-to-reefs? – Decommissioning options for the offshore wind power industry. Mar. pollut. Bull. 90 (1-2), 247–258. doi: 10.1016/j.marpolbul.2014.10.045
Steinzor R. I., Verchick R. R., Vidargas N. W., Huang L. Y. (2012). Fairness in the bay: environmental justice and nutrient trading. U of Maryland Legal Studies Research Paper No. 2012-57. doi: 10.2139/ssrn.2139116
Tambe S., Ballal A., Tomar R., Wyborn C., DeFries R., Ganguly S., et al. (2023). Bridging science, policy and practice for sustainability: Towards a conceptual framework. Environ. Sci. Policy 145, 208–216. doi: 10.1016/j.envsci.2023.04.007
Tango P. J., Batiuk R. A. (2013). Deriving Chesapeake Bay water quality standards. JAWRA J. Am. Water Resour. Assoc. 49 (5), 1007–1024. doi: 10.1111/jawr.12108
Testa J. M., Clark J. B., Dennison W. C., Donovan E. C., Fisher A. W., Ni W., et al. (2017). Ecological forecasting and the science of hypoxia in Chesapeake Bay. BioScience 67 (7), 614–626. doi: 10.1093/biosci/bix048
Tulloch A. I. T., Possingham H. P., Joseph L. N., Szabo J., Martin T. G. (2013). Realising the full potential of citizen science monitoring programs. Biol. Conserv. 165, 128–138. doi: 10.1016/j.biocon.2013.05.025
UMCES-PG (2023) Growth | Chesapeake Bay Story. Available at: https://chesapeakebaystory.umces.edu/future-directions/growth/.
USEPA (2017). Ambient Water Quality Criteria for Dissolved Oxygen, Water Clarity and Chlorophyll-a for the Chesapeake Bay and Its Tidal Tributaries: 2017 Addendum. (Annapolis, Maryland: USEPA Region III Chesapeake Bay Program Office EPA 903-R-17-002).
Vaquer-Sunyer R., Duarte C. M. (2008). Thresholds of hypoxia for marine biodiversity. Proc. Natl. Acad. Sci. 105 (40), 15452–15457. doi: 10.1073/pnas.0803833105
Vargas-Nguyen V. (2020). The Role of Socio-Environmental Report Cards in Transdisciplinary Collaboration and Adaptive Governance for a Sustainable Future. Doctoral dissertation. (Maryland: University of Maryland, College Park).
Walsh P., Griffiths C., Guignet D., Klemick H. (2017). Modeling the property price impact of water quality in 14 Chesapeake Bay counties. Ecol. Economics 135, 103–113. doi: 10.1016/j.ecolecon.2016.12.014
Walsh P., Griffiths C., Guignet D., Klemick H. (2019). Adaptation, sea level rise, and property prices in the Chesapeake Bay watershed. Land Economics 95 (1), 19–34. doi: 10.3368/le.95.1.19
Wilberg M., Livings M., Barkman J., Morris B., Robinson J. (2011). Overfishing, disease, habitat loss, and potential extirpation of oysters in upper Chesapeake Bay. Mar. Ecol. Prog. Ser. 436, 131–144. doi: 10.3354/meps09161
Williams M., Longstaff B., Buchanan C., Llansó R., Dennison W. (2009). Development and evaluation of a spatially-explicit index of Chesapeake Bay health. Mar. pollut. Bull. 59 (1-3), 14–25. doi: 10.1016/j.marpolbul.2008.11.018
Wood L., Hooper P., Foster S., Bull F. (2017). Public green spaces and positive mental health – investigating the relationship between access, quantity and types of parks and mental wellbeing. Health Place 48, 63–71. doi: 10.1016/j.healthplace.2017.09.002
Yılmaz H., Lauwers L., Buysse J., Van Huylenbroeck G. (2019). Economic aspects of manure management and practices for sustainable agriculture in Turkey. Present Environ. Sustain. Dev. 13 (1), 249–263. doi: 10.2478/pesd-2019-0020
Keywords: Chesapeake Bay, eutrophication, hypoxia, stakeholder, DPSIR
Citation: Leyva Ollivier ME, Newton A and Kelsey H (2023) Socio-ecological analysis of the eutrophication in Chesapeake Bay, USA. Front. Mar. Sci. 10:1237493. doi: 10.3389/fmars.2023.1237493
Received: 09 June 2023; Accepted: 15 August 2023;
Published: 08 September 2023.
Edited by:
Bochao Xu, Ocean University of China, ChinaReviewed by:
Yan Zhang, China University of Geosciences, ChinaQianqian Wang, Southern University of Science and Technology, China
Copyright © 2023 Leyva Ollivier, Newton and Kelsey. This is an open-access article distributed under the terms of the Creative Commons Attribution License (CC BY). The use, distribution or reproduction in other forums is permitted, provided the original author(s) and the copyright owner(s) are credited and that the original publication in this journal is cited, in accordance with accepted academic practice. No use, distribution or reproduction is permitted which does not comply with these terms.
*Correspondence: María Esther Leyva Ollivier, ZXN0aGVyb2xsaXZpZXI4N0BnbWFpbC5jb20=