Abstract
Accurate mapping of mangrove forests is crucial for understanding their ecosystem function and developing effective management policies. However, the absence of an operational multi-feature fusion approach and an ensemble classification system restricts the achievement of this goal. This study aims to develop an object-oriented multi-feature ensemble classification scheme (OMEC). First, an enhanced mangrove spectral index (EMSI) is established by analyzing the spectral reflectance differences between mangrove forests and other land cover types. Sentinel-2 images are segmented into objects using the multi-resolution segmentation method. Then, spectral, textural, and geometric features are extracted, and these features (including EMSI) are inputted into the nearest neighbor classifier to implement mangrove classification. The experiment was conducted in three typical mangrove areas in China using Sentinle-2 images. The results demonstrate that EMSI exhibits good spectral separability for mangroves and performs well in the ensemble classification scheme. The overall accuracy of mangrove classification exceeds 90%, with a Kappa coefficient greater than 0.88. The object-oriented multi-feature ensemble classification scheme significantly improves accuracy and exhibits excellent performance. The method enhances the accuracy of mangrove classification, enriches the approach to mangrove remote sensing interpretation, and offers data support and scientific references for the restoration, management, and protection of coastal wetlands.
1 Introduction
Mangroves represent a distinctive forest community found in tropical and subtropical regions (Wang et al., 2019; Zhao and Qin, 2022; Jia et al., 2023), characterized by their intricate structure, diverse species, significant productivity, exceptional ecological functions, and substantial social and economic value (Giri et al., 2008; Kuenzer et al., 2011; Xia et al., 2020). However, due to the impacts of human activities, such as excessive exploitation, expansion of aquaculture, and river regulation projects (Baloloy et al., 2020; Wan et al., 2020; Li et al., 2022), coupled with the interference of natural factors like tropical cyclones, sea-level rise, and biological invasions (Xia et al., 2018; Lymburner et al., 2020; Zhao et al., 2023b), a staggering loss of approximately one-third of the world’s mangroves has occurred over the past few decades (Elliott et al., 2014; Lu et al., 2022). Furthermore, the existing mangroves encounter various threats, including the reduction of biodiversity and degradation of ecosystem service functions (Kuenzer et al., 2011; Munang et al., 2013; Pimple et al., 2020). Currently, nations around the world have implemented pertinent policies to safeguard mangroves (Aslan et al., 2016; Romañach et al., 2018; Li W. et al., 2019). The Chinese government and relevant departments have issued multiple policies concerning the protection and restoration of mangroves (Jia et al., 2018; Yang et al., 2022; Zhang et al., 2022; Xia et al., 2023). Therefore, it is important to quickly and accurately mangrove mapping for the dynamic monitoring and management of mangroves.
The utilization of traditional field survey methods to map the spatial distribution of mangroves poses challenges in data collection and mapping quality due to limitations, such as time-consuming and labor-intensive (Pandey et al., 2019; Wang et al., 2020; Zhao et al., 2023a). Remote sensing has become indispensable for the monitoring and management of mangrove, finding applications in extent mapping, species classification, community structure analysis, and biomass estimation (Giri, 2016; Li H. et al., 2019; Pham et al., 2019). Mangrove forest mapping methods can be categorized into two main approaches: classification and index-based threshold segmentation (Gupta et al., 2018; Zhang et al., 2021). Among classification, it can be further divided into pixel-based and object-based approaches and primarily utilizes the spectral signature for classification (Kaplan and Avdan, 2017; Maurya et al., 2021). The common classifiers, such as Maximum Likelihood Classification, Nearest Neighbor Classification, Support Vector Machine, and Random Forest, are applied to implement classification (Thanh Noi and Kappas, 2017; Zhang X.M. et al., 2017; Ghorbanian et al., 2021; Fu et al., 2022). Among these classification algorithms, the Nearest Neighbor Classification is notable for its simplicity, efficiency and wide applicability (Dhingra and Kumar, 2019). The nearest neighbor classifier is a simple and powerful classification algorithm that operates on the principle of proximity-based decision-making. In this method, each unclassified data point is assigned to the class of its nearest neighbor in the feature space. Furthermore, some researchers have integrated additional features such as topography, texture, and other characteristics to enhance mangrove classification (Mao et al., 2020). However, existing classification methods have several problems. First, the mangrove forest patches extracted using the pixel-based approach exhibit excessive fragmentation. Second, common classification using the object-based approach mainly relies on one feature (spectral feature) or two feature fusion (such as spectral and texture, spectral and topography), which is unsuitable for accurate mangrove mapping due to the lack of multiple feature fusion. Last, the features involved in the classification approaches lack the ability to describe the characteristics specific to mangroves.
Utilizing spectral indices facilitates the extraction of targets and improves accuracy (Zhang et al., 2010; Guo et al., 2022; Zhao et al., 2023b). By utilizing various input bands of satellite data, researchers have proposed mangrove indices to facilitate the extraction of mangroves (Pu et al., 2011; Guo et al., 2021). The construction of mangrove indices mainly relies on the utilization of multispectral or hyperspectral images. Initially, mangrove indices are constructed based on single-temporal multispectral images (Winarso et al., 2014; Shi et al., 2016; Gupta et al., 2018). With the increasing availability of remote sensing imagery, mangrove indices based on multi-temporal multispectral images have been proposed. For example, the Mangrove Recognition Index incorporated the Green Vegetation Index and the Wetness Index during high and low tides to represent the spectral characteristics of mangroves using multispectral images (Zhang and Tian, 2013). Subsequently, mangrove indices based on hyperspectral imagery have been successively proposed by researchers. As an illustration, an Enhanced Mangrove Vegetation Index was proposed to amplify the distinction in the level of greenness and moisture content in canopy between mangroves and other vegetation using hyperspectral images (Yang et al., 2022). However, mangrove extraction methods based on index-based threshold segmentation predominantly utilize a fixed threshold to distinguish mangroves. The classification results are heavily influenced by threshold values, which depend on the expertise of the researchers (Chen et al., 2021; Tran et al., 2022).
Given the above challenges, the objective of this study is to propose an object-oriented multi-feature ensemble classification scheme. Specifically, an enhanced mangrove spectral index (EMSI) is proposed by analyzing the spectral reflectance differences between mangroves and other land cover types based on multispectral Sentinel-2 images. The multi-resolution segmentation method is utilized to segment Sentinel-2 images into objects. Subsequently, spectral (including original spectral and EMSI), textural, and geometric features are extracted from these objects and are inputted into the nearest neighbor classifier to implement mangrove classification.
2 Materials
2.1 Study area
Three typical mangrove areas of different types in China were selected as the study areas (Figure 1). The study area (a) is located in the Pearl Bay Mangrove Reserve in Fangchenggang City, Guangxi Province (21°33′-21°37′N, 108°08′- 108°13′E). This area falls under the subtropical monsoon climate, with an annual average temperature of 22.5 °C and the annual average precipitation of about 1745.6 mm. The research area (b) is situated in the Dongzhaigang Mangrove Nature Reserve in Hainan Province (19°58′-20°02′N, 110°31′-110°35′E). The region is classified as having a tropical monsoon climate, featuring an average temperature of 23.8 °C and an average annual precipitation of 1700 mm. It experiences a significant number of typhoons during the rainy season. The study area (c) is located in the Gaoqiao Mangrove Reserve in Zhanjiang City, Guangdong Province (21°27′-21°35′N, 109°44′-109°48′E). Similarly, this area is part of the subtropical monsoon climate. It has an annual average temperature of 22.9 °C and an average annual precipitation of approximately 1600 mm.
Figure 1
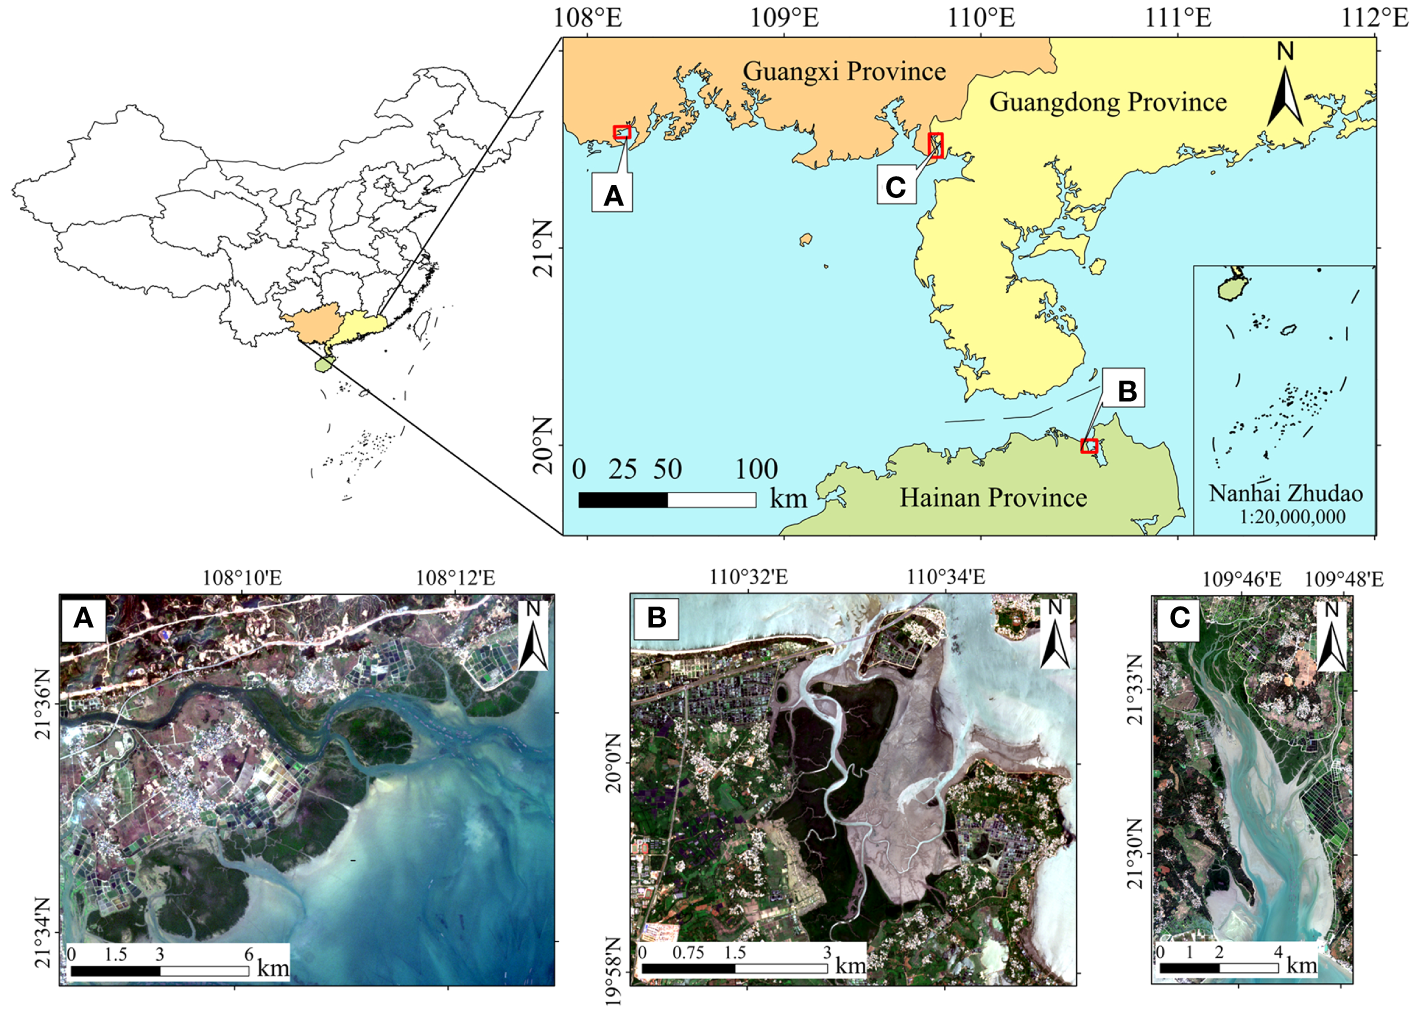
Location of the study area and true color composite (RGB: 665 nm-560 nm-490 nm) visualization of Sentinel-2 images in the study areas. (A) Fangchenggang, Guangxi Province (Date: 2021-12-31); (B) Dongzhaigang, Hainan Province (Date: 2021-06-16); (C) Zhanjiang, Guangdong Province (Date: 2021-12-03).
2.2 Satellite data and preprocessing
Sentinel-2A multispectral images were obtained from the European Space Agency (ESA) (https://scihub.copernicus.eu/dhus/#/home, accessed on 31 December 2022), with three spatial resolutions of 10 m for bands 2-4, 8, and 20 m for bands 5-7, 11, 12 and 60 m for bands 1, 9, and 10. Top-of -atmosphere reflectance and surface reflectance data were acquired from Sentinel-2 images (Campos-Taberner et al., 2020). Only images with a cloud cover of less than 20% were chosen for analysis. To mitigate the impact of clouds, the images were masked using the QA60 band (Nguyen et al., 2020). In order to reduce the influence of tides on mangrove inundation, Sentinel-2A images from 2021 were specifically selected when tidal levels closely resembled low tide conditions.
The Sentinel-2A images were preprocessed using SNAP software (version 9.0.0) to convert them into an ENVI readable format (version 5.6). Subsequently, the images were imported into ENVI for geometric correction and atmospheric correction. All bands were resampled to a spatial resolution of 10 m.
In October 2021, we conducted a survey of the study area and utilize a handheld GPS device with a positional accuracy of 5 m to record the locations of the sample points, which included mangroves and non-mangroves areas. The positional accuracy of the GPS is suitable for the spatial resolution of the Sentinel-2A images, which is 10 m. Additionally, inaccessible sample points were collected using high-resolution images obtained from Google Earth (Figure 2). A total of 4995 sample points were collected, consisting of 1354 point for mangroves and 3641 points for non-mangroves. Among these, 3996 sample points were allocated for training, while 999 sample points were set aside for validation.
Figure 2
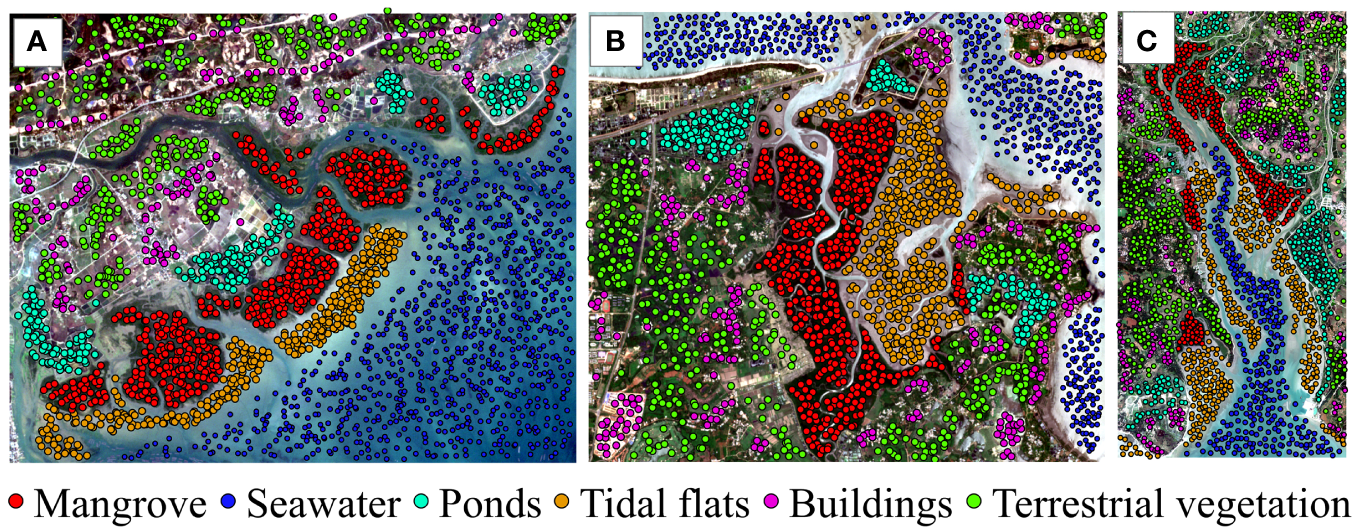
Distribution of sample points. (A) Fangchenggang, Guangxi Province (Date: 2021-12-31); (B) Dongzhaigang, Hainan Province (Date: 2021-06-16); (C) Zhanjiang, Guangdong Province (Date: 2021-12-03).
3 Methods
3.1 Development of EMSI
3.1.1 Comparison of spectral curves
In order to make spectral signatures of different land cover types more representative, especially terrestrial vegetation and mangroves, we added two additional study areas (d) and (e) in this section (Figure 3). The average spectral curves of six land cover types (i.e., mangroves, tidal flats, terrestrial vegetation, ponds, buildings, and seawaters) were calculated based on the sample points from field survey and the high-resolution images obtained from Google Earth, with the respective sample point counts of 201, 268, 182, 102, 105, and 274 (Figure 4). Vegetation, whether it be mangroves or other types, exhibits distinct spectral characteristics that differentiate it from seawater, tidal flats, and other land cover types (Zhang X. et al., 2017). The spectral response of vegetation in visible wavelengths is primarily influenced by various pigments, with chlorophyII playing a vital role. ChlorophyII absorption peaks are observed in two bands centered around 490 nm (blue) and 665 nm (red), while a reflection peak appears near 560 nm (green), explaining the predominant green appearance of many plants (Matthews, 2011). There is a significant increase in reflectance between visible light and near-infrared light (approximately 705 nm), creating the well-known “red-edge” phenomenon. Leaf pigments and cellulose exhibit transparency to near-infrared wavelengths. Consequently, healthy green vegetation demonstrates high reflectance, high transmittance, and low absorptance in the near-infrared spectrum. In the short-infrared bands of the spectrum, the spectral response of green vegetation is predominantly influenced by strong absorption bands related to seawater near wavelengths of 1375 nm, 1610nm, and 2190 nm.
Figure 3
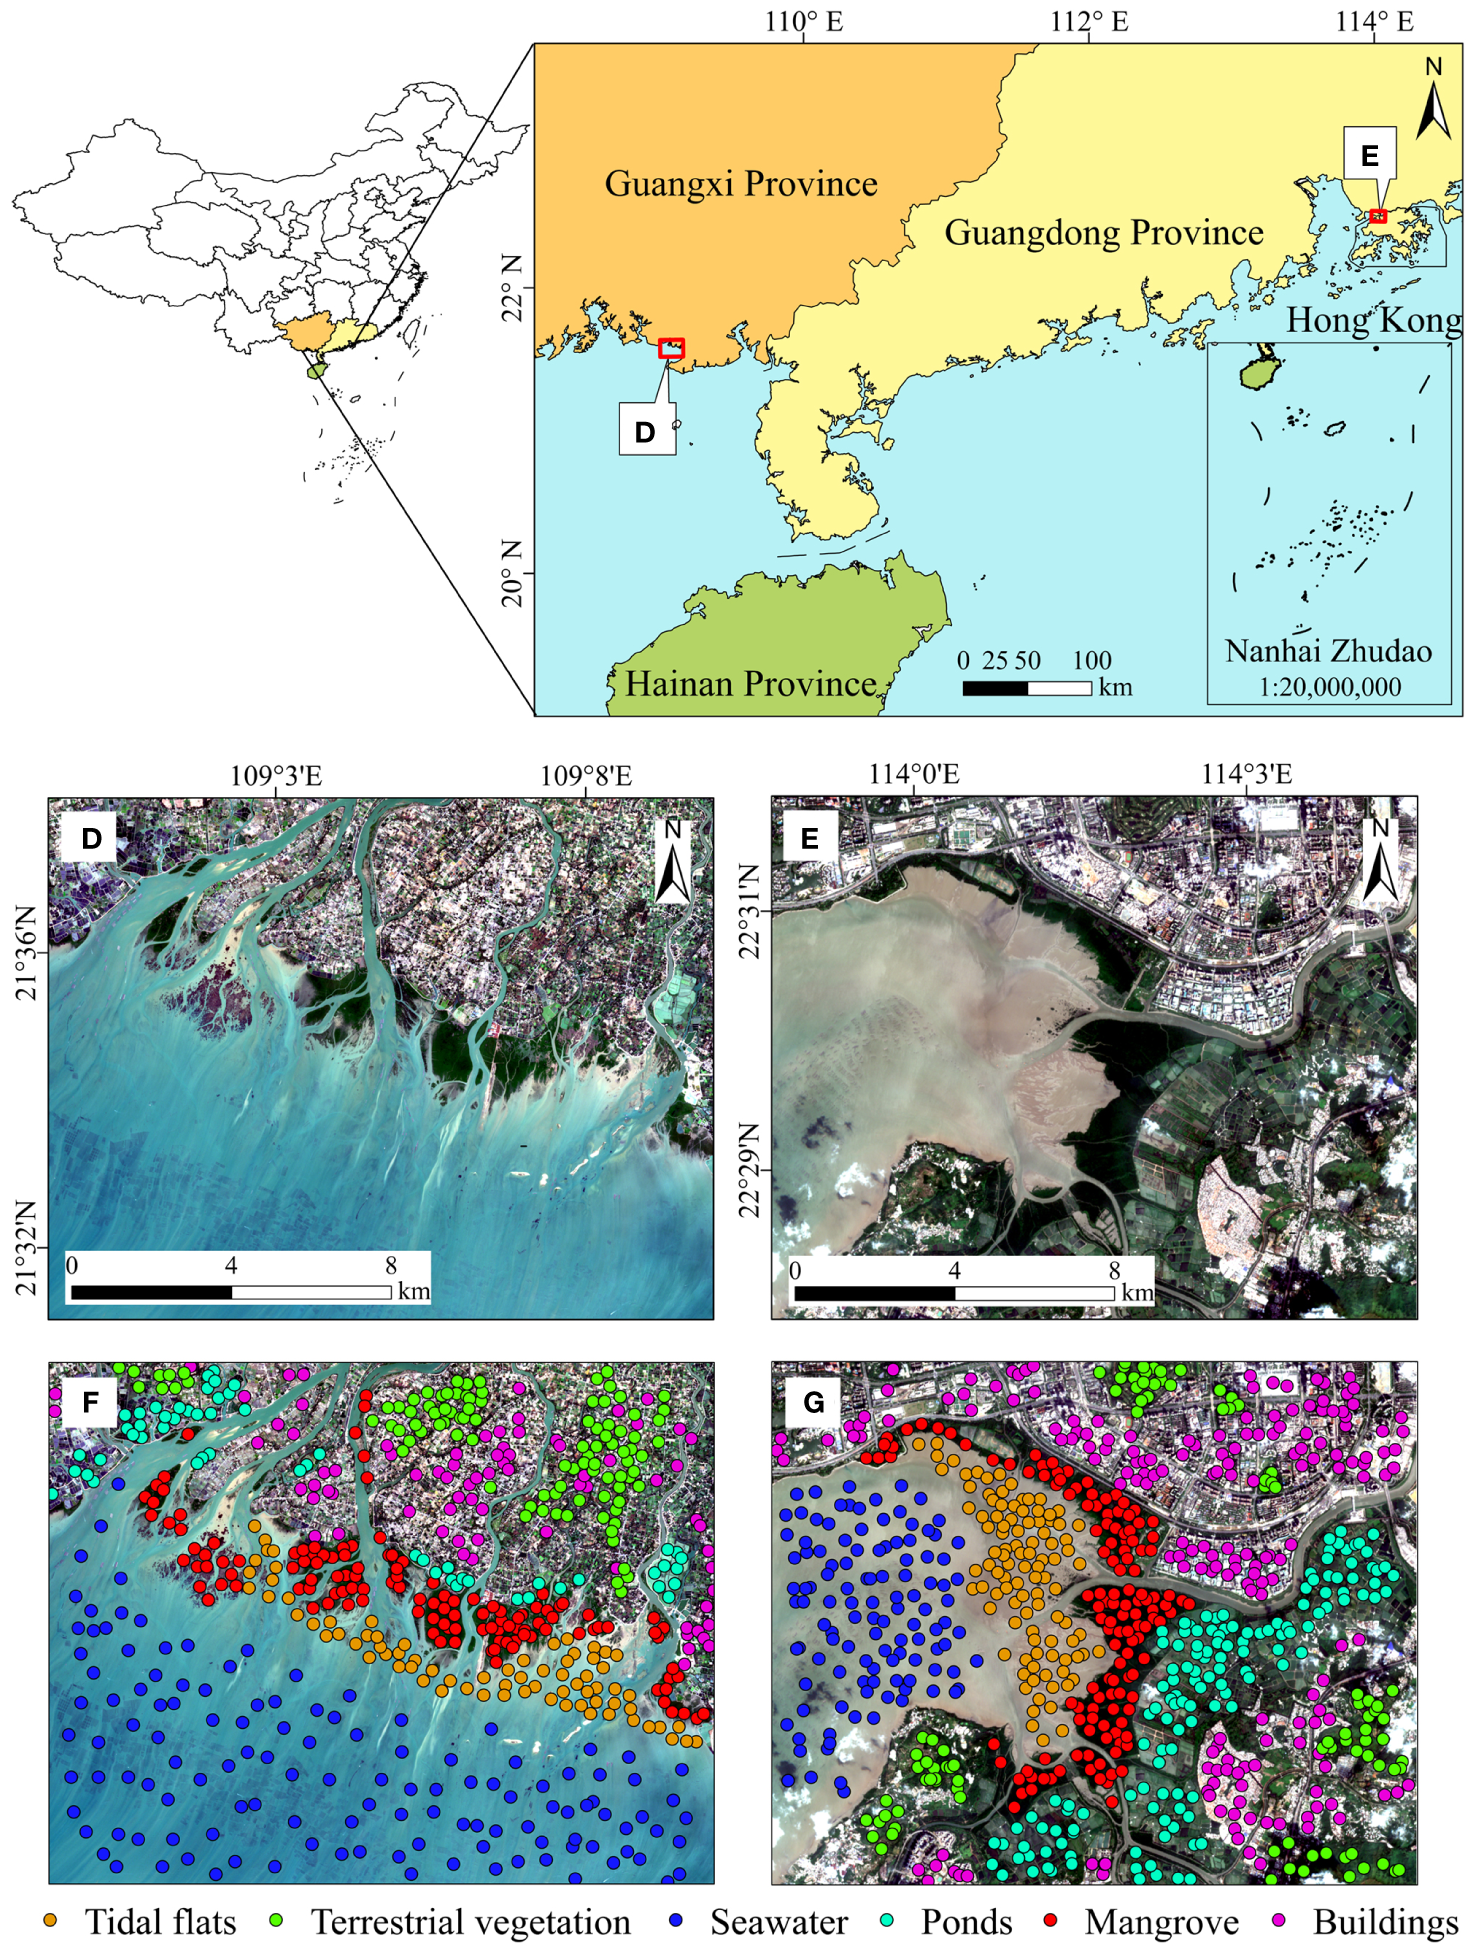
Two additional study areas and the distribution of sample points. (D, E) represent two additional study areas; (F, G) show the corresponding distribution of sample points.
Figure 4
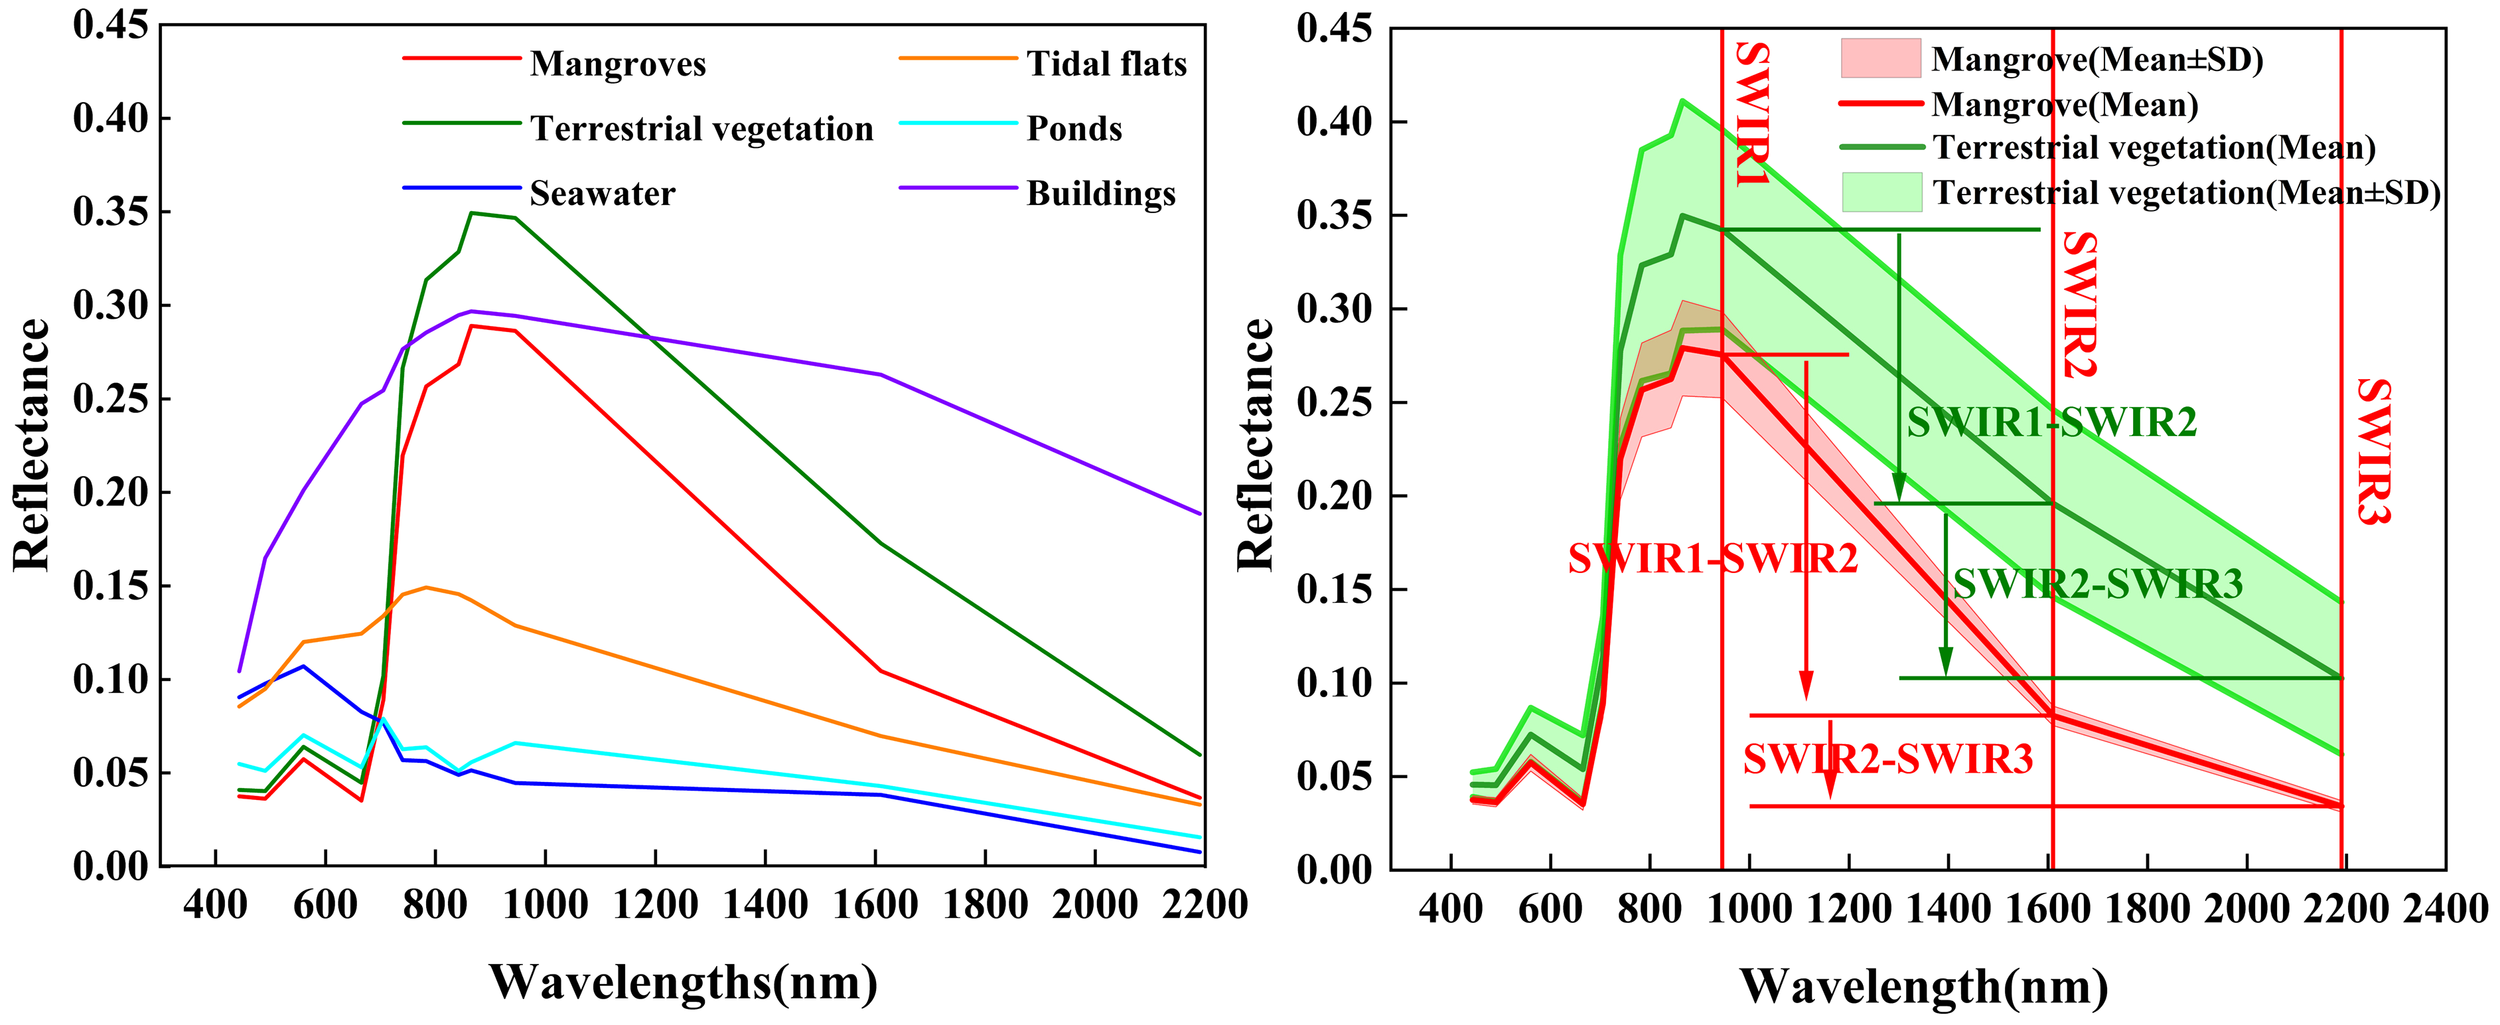
Average spectral reflection of six feature types.
In comparison to other vegetation, mangroves exhibit a similar level of greenness, with the primary distinction being the moisture content found in their leaves and canopies (Yang et al., 2022). The amount of infrared wavelengths absorbed by plants from sunlight is contingent upon the moisture content of their leaves. The reflectance of vegetation in the infrared wavelength clearly increases as leaf moisture decreases (Furlanetto et al., 2020). Compared to the majority of terrestrial vegetation, mangroves possess higher leaf and canopy water content. Consequently, the reflectance of mangroves in the infrared wavelength is lower than that of other vegetation. The near-infrared reflectance of terrestrial vegetation can differ from that of mangroves, with the possibility of being higher or lower. This distinction is typically influenced by the condition of the internal chlorophyII structure and leaf cellulose, as they play a role in reflecting near-infrared electromagnetic waves. Distinguishing mangroves from other types of vegetation can be achieved through the utilization of shortwave-infrared reflectance (Osei Darko et al., 2021; Yang et al., 2022).
3.1.2 Formulation of EMSI
Based on previous research on the properties of mangrove vegetation properties and its spectral responses across various wavelengths, three short-wave infrared bands (SWIR1 with a central wavelength of 945 nm, SWIR2 with a central wavelength of 1610 nm and SWIR3 with a central wavelength of 2190 nm) from Sentinel-2 data were chosen and combined to create EMSI. The reason for choosing these three bands is as follows. Mangroves and terrestrial vegetation share a similar spectral reflectance in the ultra-blue, blue, green and red (with central wavelengths of 443 nm, 490 nm, 560 nm, and 665 nm, respectively). However, distinguishing mangroves from other vegetation based on bands separability proves to be challenging due to their poor differentiation. In the short-wave infrared bands, including central wavelengths of 945 nm, 1610 nm and 2190 nm, the spectral reflectance of mangroves exhibited considerably lower values compared to terrestrial vegetation. There bands are sensitive to monitoring leaf and canopy water contents (Jia et al., 2019; Jiang et al., 2022). This difference can be attributed to the sensitivity of the short-wave infrared bands to the moisture content present in mangrove leaves. Additionally, the Normalized Difference Vegetation Index (NDVI) is a widely used and traditional index that indicates the extent of vegetation coverage. In this study, NDVI was specifically chosen to capture and emphasize the vegetation information characteristics of mangroves (Baloloy et al., 2020). The following spectral extraction indices for mangroves were proposed:
Where: represents the Normalized Difference Vegetation Index, SWIR1, SWIR2 and SWIR3 (with a central wavelength of 945 nm, 1610 nm and 2190 nm) are the spectral reflectance values.
3.2 Spatial feature extraction
Spatial features encompass texture features and geometric features. Texture features represent repetitive transformations on object surfaces or regular grayscale patterns, which provide insight into the visual characteristics of homogeneous phenomena in images (Chaki and Dey, 2020). The gray-level co-occurrence matrix is a widely utilized method for describing texture features. Commonly employed image texture features include mean, contrast, entropy, and standard deviation in Table 1 (De Siqueira et al., 2013). In visual inspection, the texture of mangroves appears to be finer and less saturated in color compared to terrestrial vegetation. Thus, mean and contrast were chosen in this study to describe texture features.
Table 1
| Texture features | Formula |
|---|---|
| Mean | |
| Contrast | |
| Entropy | |
| Standard Deviation |
Specific formulas for common texture features.
The element value in the matrix represents the joint conditional probability density between two gray levels. That is, when the spatial distance P(i,j|d,θ) and direction θ are given, d starting from j the gray level, i represents the probability of the gray level appearing.
Geometric features are employed to describe the shape of an image object, aiding in better understanding its characteristics. Commonly used geometric features include length, width, aspect ratio, perimeter, area, rectangularity, circularity, and more. Mangroves are typically found in the coastal zones, occupying shoals and shallows areas near the land-sea junction. They are predominantly distributed in strip-like patterns, with some occurring as patches or fragments. In this study, aspect ratio and circularity were chosen as the two geometric factors to describe the geometric features.
3.3 OMEC method
This study proposes an object-oriented multi-feature fusion ensemble classification (OMEC) method. First. the spectral reflectance characteristics and distinctions of various land cover types are initially examined. EMSI is created through band math. Then, the Sentinel-2 images are segmented into objects using the multi-resolution segmentation method. Following that, spectral features (including original spectral and EMSI), texture features and geometric features are extracted from these objects. Finally, there features are input into the nearest neighbor classifier to carry out mangrove classification (Figure 5).
Figure 5
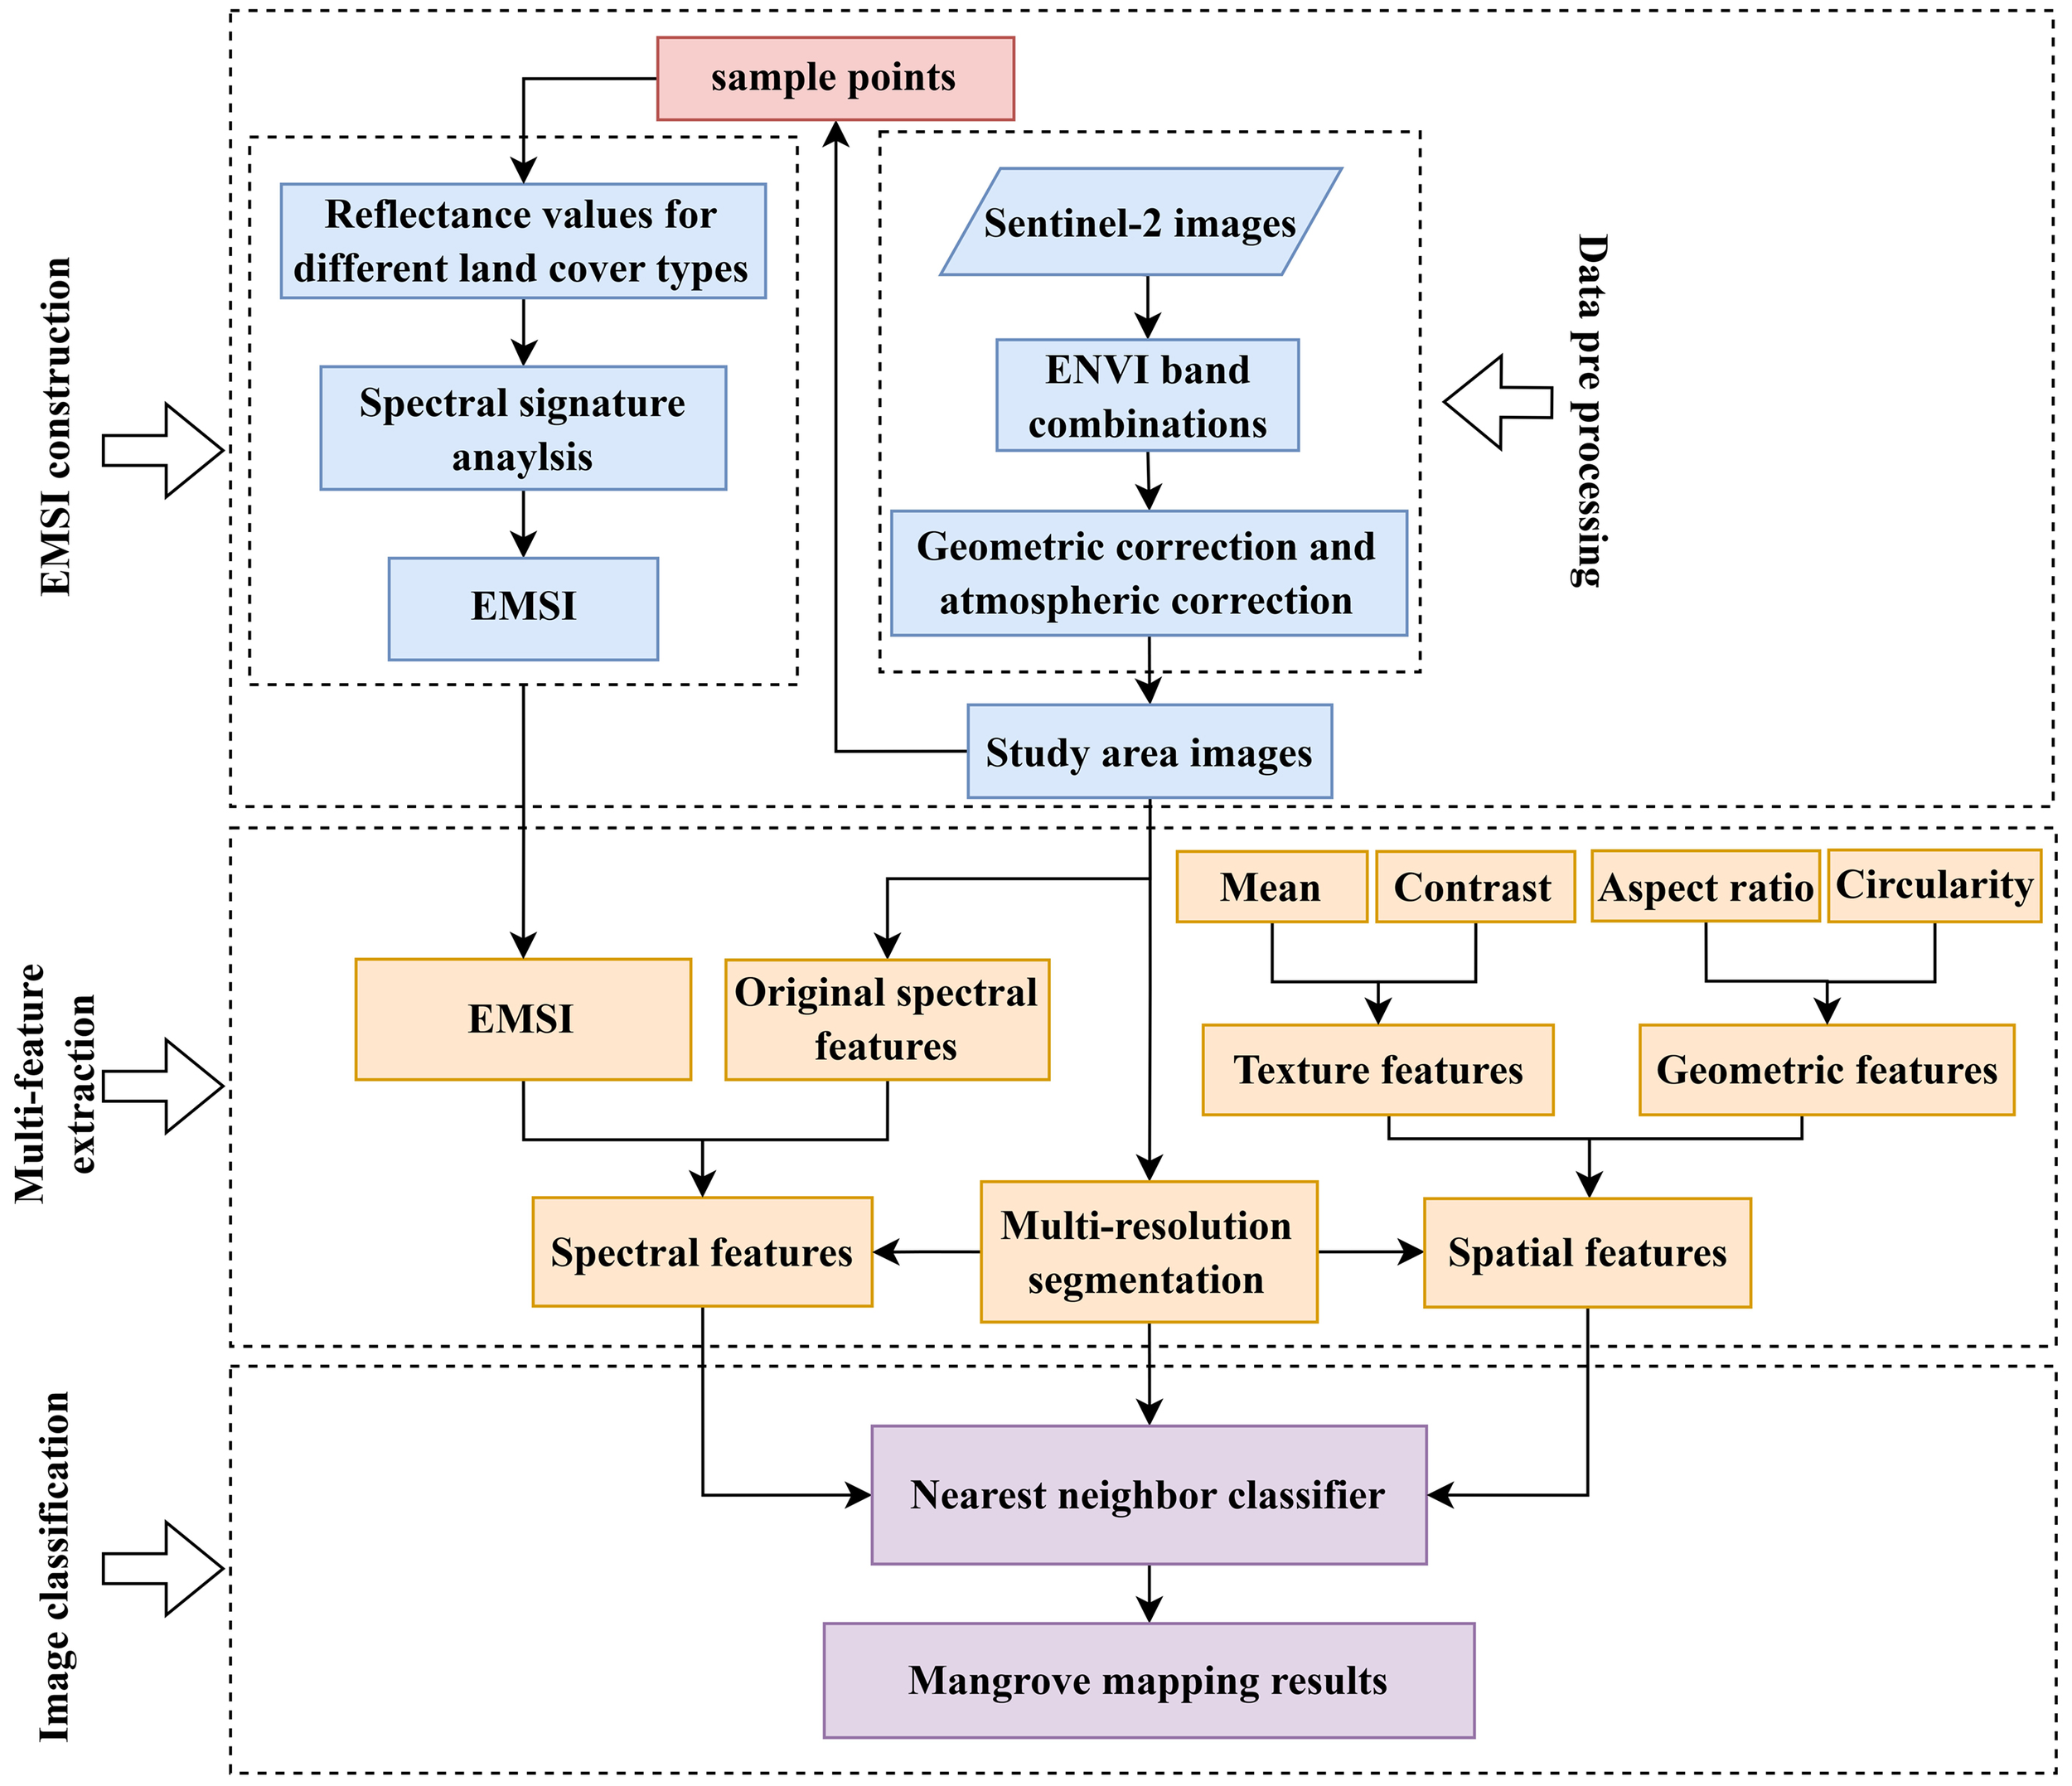
The flowchart of mangrove mapping.
Specifically, the construction of the EMSI is addressed in Section 3.1. Object-oriented classification utilizes segmented image objects as the basis for classification, incorporating relevant information such as spectrum, texture, and shape. This approach maximizes the use of image information, overcoming the limitations of pixel-oriented classification algorithms and reducing the likelihood of misclassification. Multi-resolution segmentation (MRS) is widely used image segmentation method in object-oriented classification, characterized by a bottom-up approach that divides an image into hierarchical levels (Platt and Rapoza, 2008; Su et al., 2008). In this study, the MRS was applied to segment Sentinel-2 images. The outcome of the segmentation primarily depends on three key parameters: scale, color-shape, and smoothness-compactness. Optimal segmentation parameters were determined through visual interpretation, with the aim of achieving accurate segmentation of mangroves. After conducting a series of experiments, the optimal parameters were determined as follows: scale of 50, shape of 0.1, and compactness of 0.3. The image segmentation was performed on the RGB image.
Based on the segmentation images, spatial features of mangroves are extracted, including texture features such as average value and contrast, as well as geometric features such as aspect ratio and circularity. Additionally, spectral features of mangroves, including the original spectral values and EMSI, are obtained. These extracted features are then inputted into the nearest neighbor classifier to carry out the mangrove classification.
3.4 Accuracy assessment
To evaluate the mangrove maps generated by OMEC method, we conducted a quantitative accuracy assessment using sample datasets. Since mangroves are the primary focus of this study, the evaluation is carried out based on two categories: mangrove and non-mangrove. The assessment includes calculations of overall accuracy (OA), and the Kappa coefficient (Kappa). These metrics are derived from the confusion matrix, which utilized the sample datasets (Wang et al., 2018).
where represents number of correctly classified pixels; represents total number of pixels; represents the proportion of pixels correctly classified out of the total number of pixels; represents the proportion of pixels expected to be correctly classified by chance.
4 Results
The results of mangrove forest mapping in three study areas using OMEC method have been obtained (Figure 6). Among them, (a-c) represent the segmentation results, (d-f) depict the results of different land cover types, and (g-i) display the mangrove mapping results obtained using OMEC method. From Figure 6, it is evident that the mangroves distributed along the coastal zones of the three study areas have been effectively extracted. Furthermore, the scattered mangroves located adjacent to inland aquaculture ponds have also been identified. Additionally, besides the favorable extraction of mangroves, other land cover types also displayed satisfactory extraction results from a visual perspective.
Figure 6
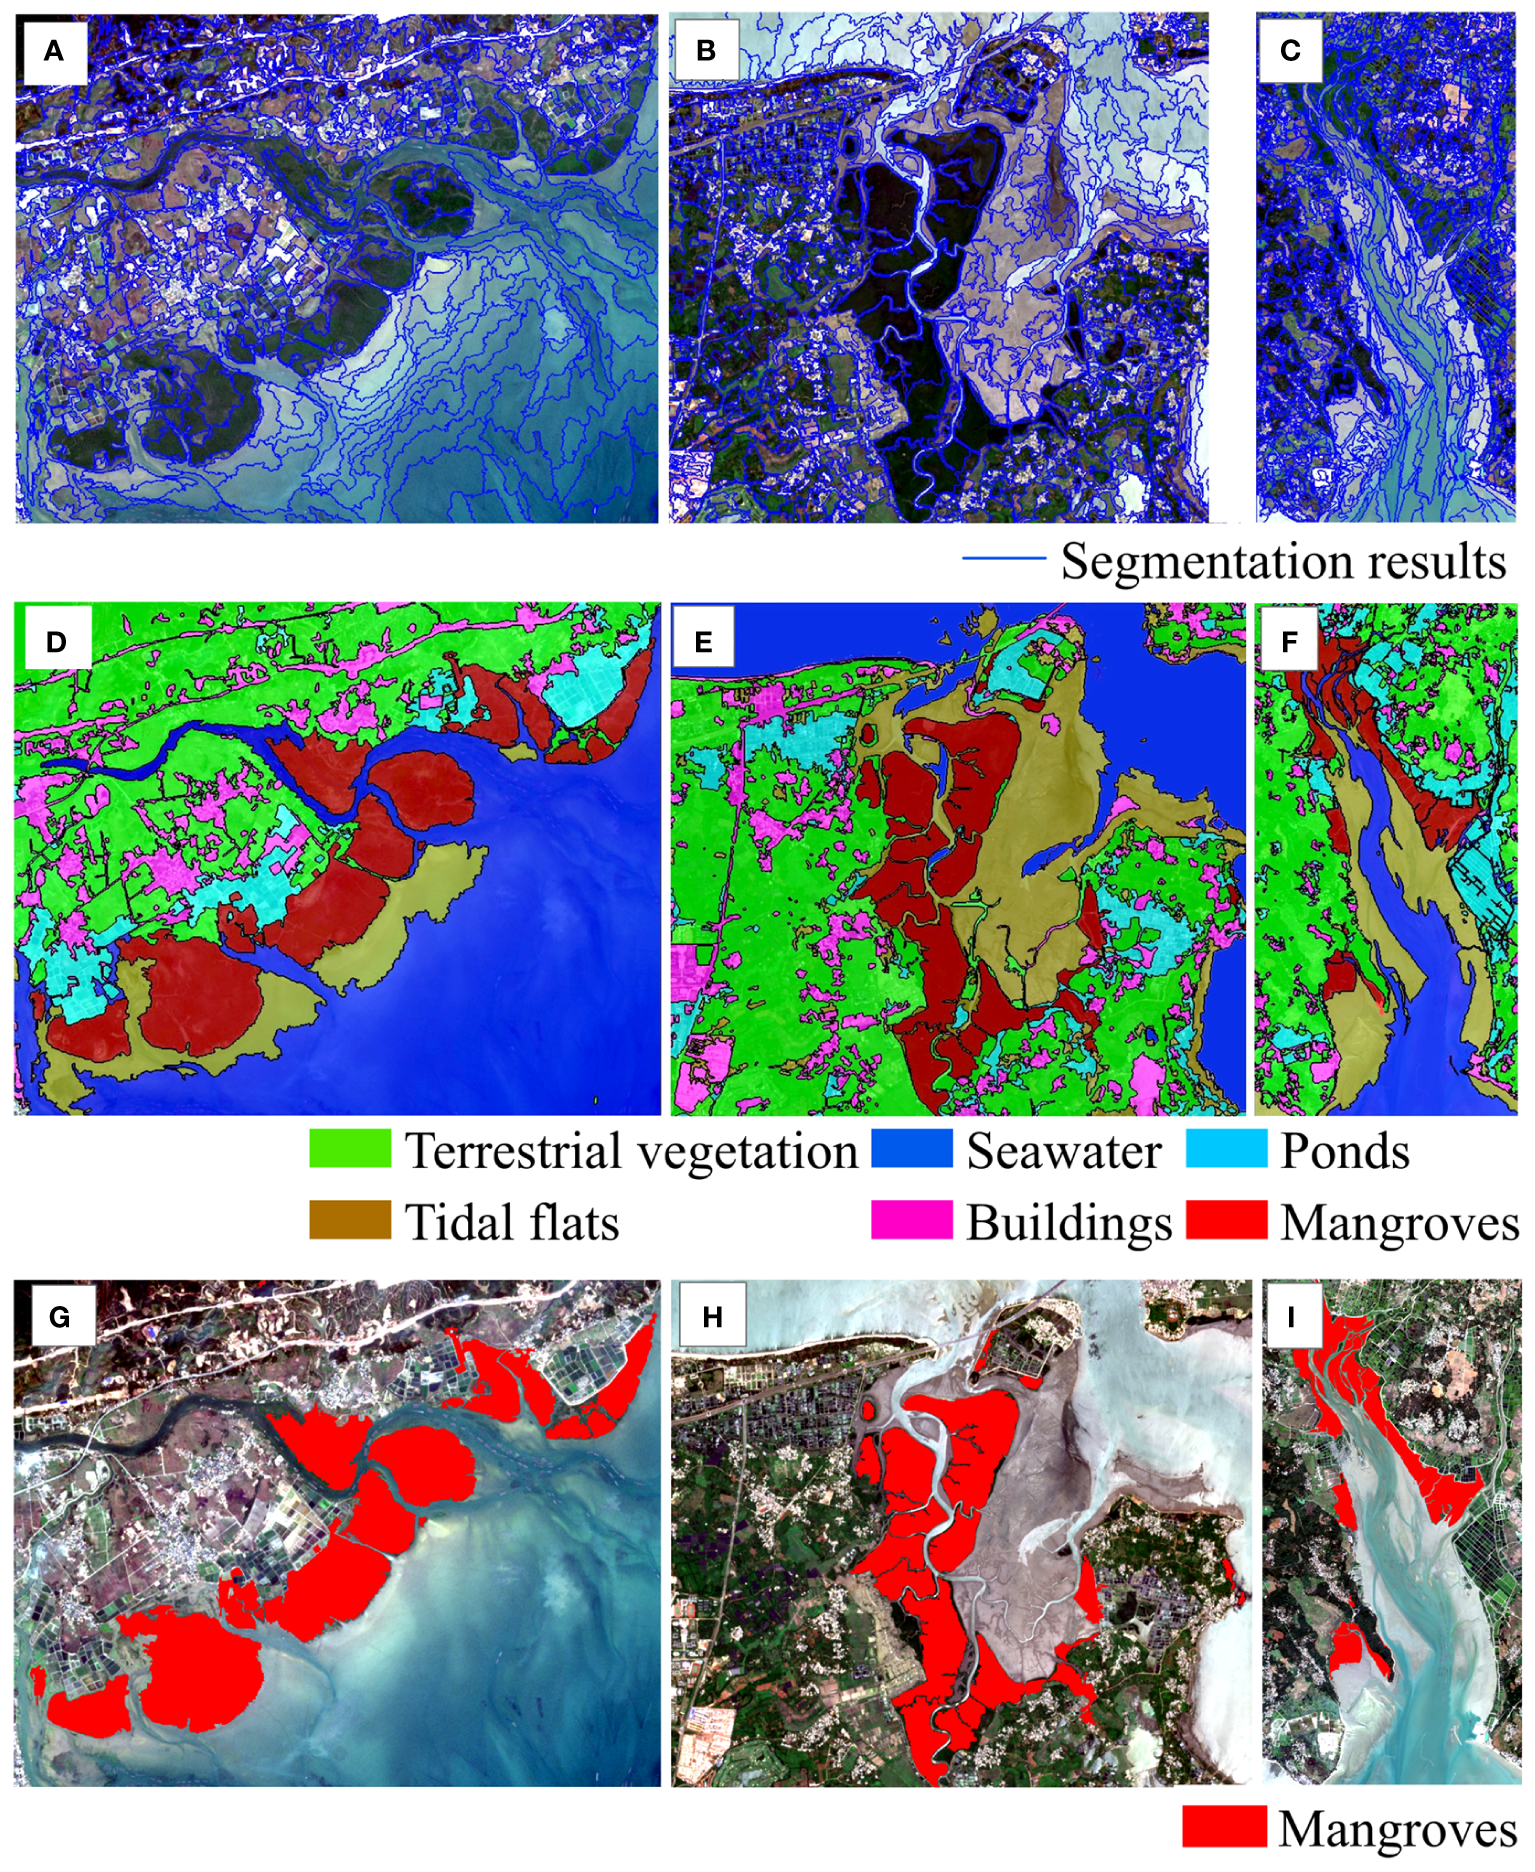
Mangrove mapping results. (A–C) represent the segmentation results for study areas (A–C); (D–F) represent the classification results for different land cover types for study areas (A–C); (G–I) represent the mangrove classification results for study areas (A–C).
The accuracy evaluation primarily relied on the confusion matrix in Table 2. The OA of OMEC method at the three study areas ranged from 90% to 95%, and the Kappa ranged from 0.88 to 0.93. Among the three study areas, the highest accuracy results were achieved at Dongzhaigang in Hainan Province with an OA of 95% and a Kappa of 0.93. The OA result at Fangchenggang in Guangxi Province was 90%, with a Kappa of 0.88, which was the lowest compared to the other two study areas. The aforementioned accuracy results indicate that OMEC method achieves good precision in mangrove forest mapping.
Table 2
| Category | Study area (a) | Study area (b) | Study area (c) | |||
|---|---|---|---|---|---|---|
| Mangroves | Non- Mangroves |
Mangroves | Non- Mangroves |
Mangroves | Non- Mangroves |
|
| Mangroves | 58 | 1 | 40 | 2 | 50 | 3 |
| Non-Mangroves | 3 | 278 | 3 | 305 | 1 | 254 |
| OA | 90% | 95% | 93% | |||
| Kappa | 0.88 | 0.93 | 0.91 | |||
Accuracy evaluation from the three study areas.
5 Discussion
5.1 Separability analysis of EMSI
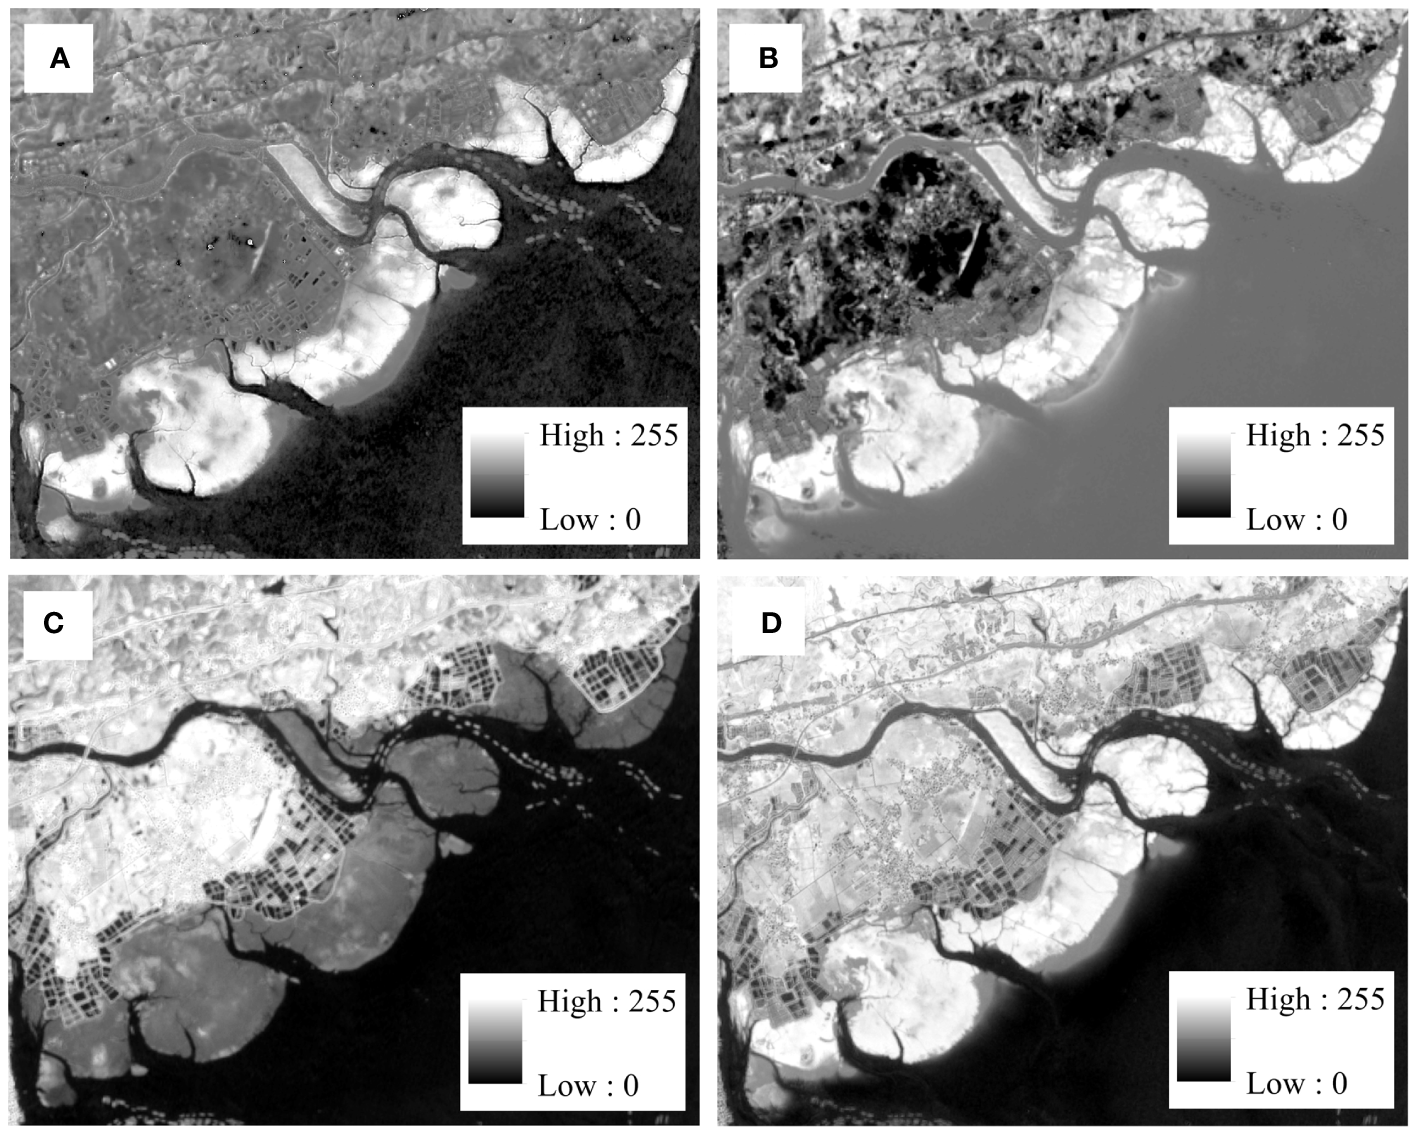
To further assess the separability of EMSI, we calculated the EMSI results for the three study areas (Figure 7). From a quantitative perspective, the EMSI value for mangroves is observed to be higher than that for other land cover types. Mangroves are depicted in white on the image, while the other land cover types are displayed in different shades of gray and black. Based on visual assessment, there is a clear distinction between mangroves and other land cover types, indicating that utilizing EMSI is feasible for assisting in mangrove extraction.
Figure 7
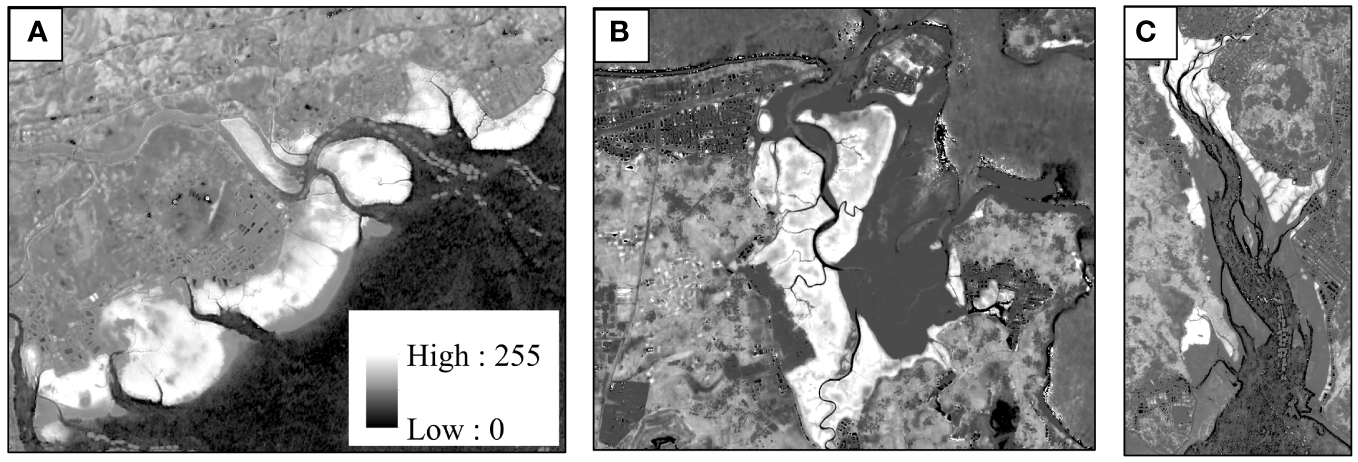
The EMSI result images. (A) Fangchenggang, Guangxi Province (Date: 2021-12-31); (B) Dongzhaigang, Hainan Province (Date: 2021-06-16); (C) Zhanjiang, Guangdong Province (Date: 2021-12-03).
From a quantitative perspective, we calculated the average values of the EMSI of different land cover types in the three study areas (Figure 8). The calculated EMSI values for mangroves showed no overlap with the values for four other land cover types: seawater, tidal flats, ponds, and buildings. This indicates a strong separation between mangroves and these land cover types, highlighting the effectiveness of the mangrove extraction. In the case of terrestrial vegetation, the statistical values of the EMSI for mangroves showed no overlap with the statistical values of terrestrial vegetation at Fangchenggang in Guangxi Province and Dongzhaigang in Hainan Province. However, at Zhangjiang in Guangdong Province, there was a slight overlap between mangroves and terrestrial vegetation. This deviation could be attributed to the randomness of the sample points, but it does not affect the applicability of the EMSI. Overall, at Fangchenggang in Guangxi Province and Dongzhaigang in Hainan Province, the EMSI demonstrate good separability for mangroves.
Figure 8
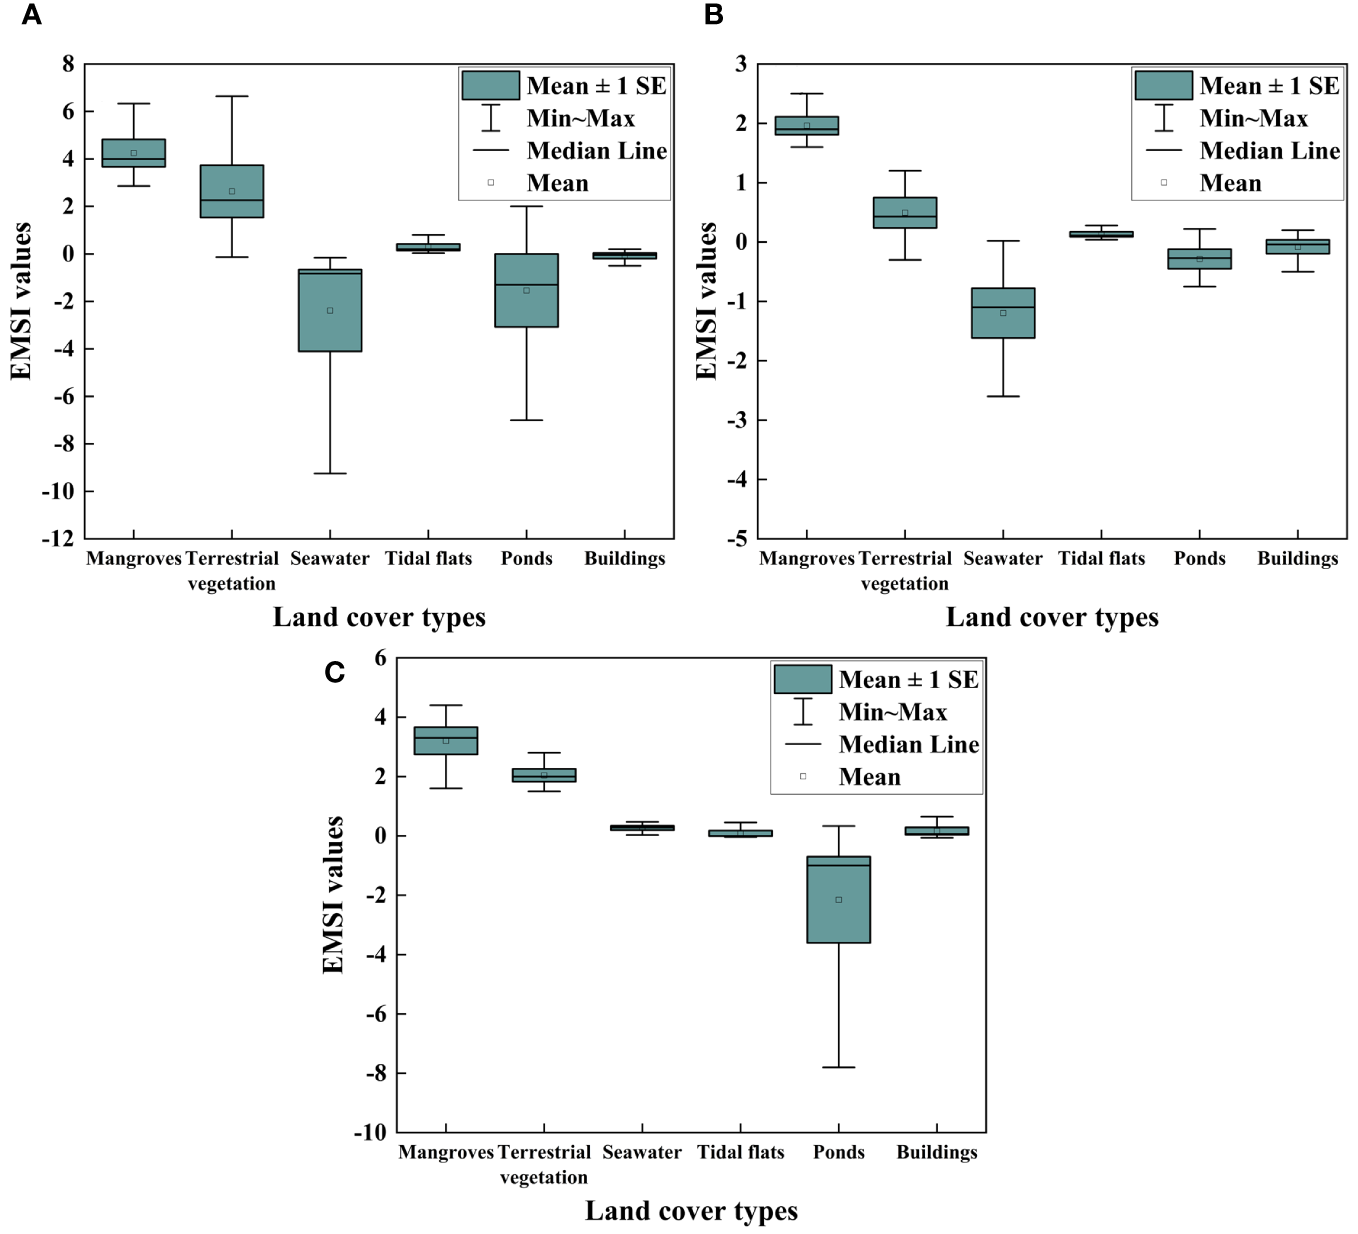
Box plot of the EMSI for different land cover types. (A–C) represent statistical results for study areas (A–C), respectively.
5.2 Comparison with existing mangrove extraction indices
We compared existing Mangrove Vegetation Indices (MVIs), such as Mangrove Index (MI) (Winarso et al., 2014), Normalized Difference Mangrove Index (NDMI) (Shi et al., 2016), and Combine Mangrove Recognition Index (CMRI) (Gupta et al., 2018), with EMSI to evaluate its capability to extract mangroves from the background. MVI images for the study area were created using Sentinel-2 images.
From Figure 9, mangroves are depicted as white on the EMSI, MI and CMRI images, and appear as gray on the NDMI image. CMRI is a composite index combining NDVI and NDWI. The presence of white-colored terrestrial vegetation in the CMRI image makes it difficult to differentiate mangroves from the background. Due to the similarity in greenness and varying water content between mangroves and other vegetation, NDMI’s distinguishing ability is inferior. EMSI and MI demonstrate a strong ability to distinguish mangroves from other vegetation, while CMRI and NDMI exhibits a poor ability. MI shares similar spectral reflectance characteristics with EMSI. MI reflects vegetation water content, while EMSI combines NDVI and water content information, and both indices demonstrate good performance in representing mangroves.
Figure 9
Calculation results of different mangrove extraction indices. (A–D) represent EMSI, MI, NDMI, and CMRI, respectively.
5.3 Object-oriented and pixel-oriented mangrove mapping results
In this study, we employed OMEC and pixel-oriented classification methods in three study areas and obtained mangrove mapping results (Figure 10). Both methods utilized the same features, including the original spectral information, EMSI, texture, and geometry feature. The accuracy evaluation of these two methods was conducted using the same sample points as described in Section 2.2.
Figure 10
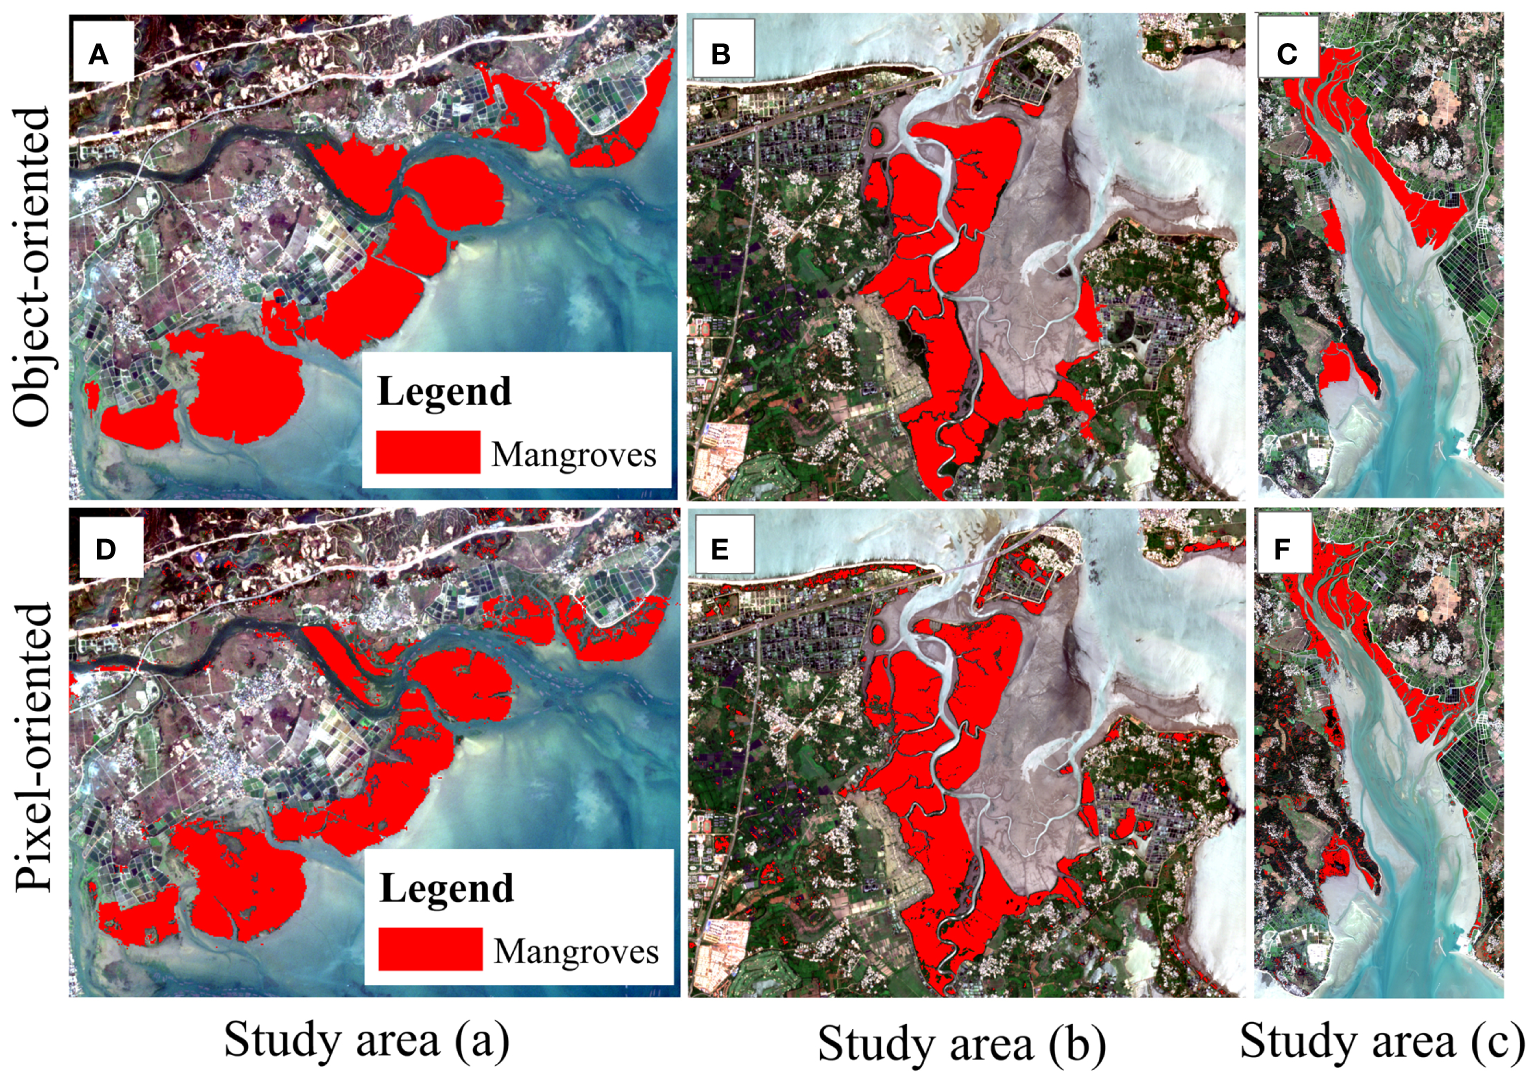
Object-oriented and pixel-oriented mangrove interpretation results. (A–C) are mangrove mapping results using OMEC method (object-oriented); (D–F) are the results using pixel-oriented classification method (pixel-oriented).
From Figure 10, it can be observed that OMEC method resulted in predominantly regular patches in the mangrove mapping results, indicating a high level of completeness in extracting the mangroves. Conversely, the pixel-oriented classification method produced primarily fragmented patches in the mangrove mapping results. It failed to accurately extract some mangroves and misclassified a few small patches as mangroves. When comparing the two classification methods, it is evident that OMEC method demonstrates superior performance in mangrove mapping.
According to Table 3, it can be observed that both the OMEC and pixel-oriented classification methods exhibited an OA exceeding 86% and Kappa coefficients higher than 0.82. For the three study areas, OMEC method achieved OAs of 90.2%, 94.6% and 92.8%, with corresponding Kappa coefficients of 0.88, 0.93 and 0.91. Conversely, the pixel-oriented method yielded OAs of 86.5%, 90.7% and 88.7%, with corresponding Kappa coefficients of 0.83, 0.88 and 0.86. It is evident that the accuracy of the pixel-oriented method was lower than that of OMEC method. Consequently, OMEC method outperforms the pixel-oriented method.
Table 3
| Methods | Category | Study area (a) | Study area (b) | Study area (c) |
|---|---|---|---|---|
| Object-oriented results (OMEC) | OA | 90.2% | 94.6% | 92.8% |
| Kappa | 0.88 | 0.93 | 0.91 | |
| Pixel-oriented results | OA | 86.5% | 90.7% | 88.7% |
| Kappa | 0.83 | 0.88 | 0.86 |
Accuracy evaluation for OMEC and pixel-oriented mangrove mapping results.
5.4 Analysis of different feature ensemble classification results
We fused different features and then input them into a nearest neighbor classifier to extract mangroves (Figure 11). These features were categorized into three classes. The first class only employed the original spectral information (OS) from the imagery as a feature, and mangrove results were obtained using a nearest neighbor classifier. The second class incorporated both the original spectral information and spatial features (OS_SF), including texture and geometry features. Texture features, such as mean and contrast, were utilized, while geometric features such as aspect ratio and circularity were employed to facilitate mangrove extraction. The third class integrated the original spectral feature, the EMSI, and spatial features utilized in the second class (OS_SF_EMSI). Mangrove extraction was subsequently conducted using a nearest neighbor classifier.
Figure 11
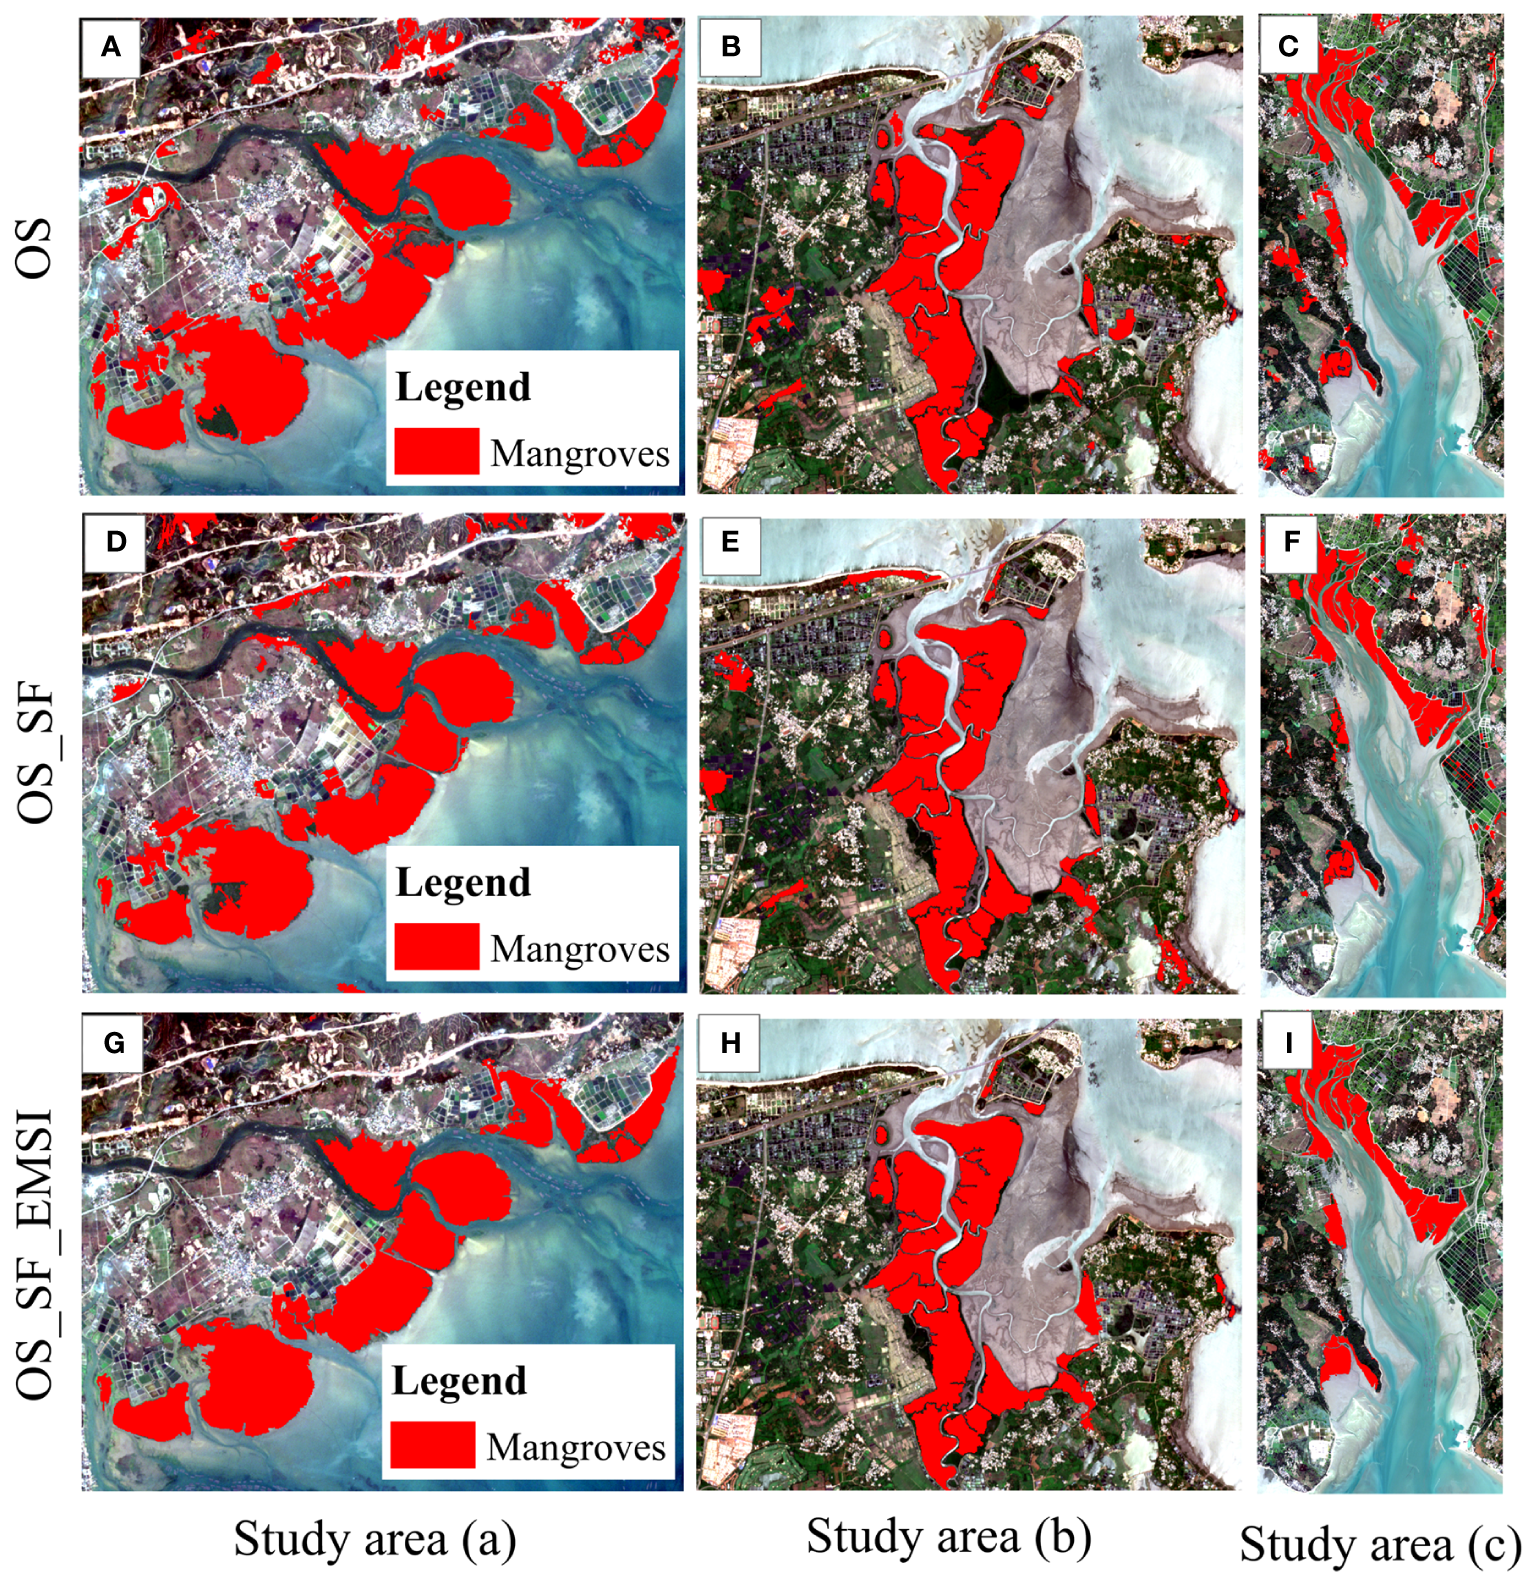
Mangrove mapping results from different feature ensemble. (A–C) represent the mangrove mapping results using OS features for study areas (A–C); (D–F) represent the mangrove mapping results using OS_SF features for study areas (A–C); (G–I) represent the mangrove mapping results using OS_SF_EMSI features for study areas (A–C).
It can be observed that the various feature-level fusion methods have achieved a certain degree of success in mangrove extraction. When using the OS method for mangrove extraction, the distribution of mangrove patches appeared scattered. However, some small mangrove patches could not be captured, and misclassification occurred with some terrestrial vegetation being misclassified as mangroves. The results of mangrove extraction are unsatisfactory. The OS_SF method demonstrates superior performance in mangrove extraction compared to the OS method. While the majority of mangrove patches were successfully captured, there were still cases where patches of terrestrial vegetation were misclassified as mangroves. The utilization of the OS_SF_EMSI method has greatly enhanced the results of mangrove extraction. The resulting mangrove patches exhibit a more uniform distribution, with few misclassifications with terrestrial vegetation. The OS_SF_EMSI method successfully distinguishes mangroves from other land cover types. The extraction performance for mangroves stands out as the most superior among the three methods.
The accuracy evaluation of the three methods was conducted using the same sample points as described in Section 2.2 (Table 4).
Table 4
| Methods | Accuracy evaluation | Study area (a) | Study area (b) | Study area (c) |
|---|---|---|---|---|
| OS | OA | 76.2% | 82.1% | 78.1% |
| Kappa | 0.71 | 0.78 | 0.73 | |
| OS-SF | OA | 80.7% | 88.9% | 81.5% |
| Kappa coefficient | 0.76 | 0.86 | 0.77 | |
| OS_SF_EMSI | OA | 90.2% | 94.6% | 92.8% |
| Kappa | 0.88 | 0.93 | 0.91 |
Accuracy evaluation for the three methods.
The OA of the OS method was below 80% (except for Dongzhaigang in Hainan Province at 82.1%), and the Kappa was all below 0.79 for the three study areas. In comparison, the OS_SF method showed improved classification accuracy. The OAs were 80.7%, 88.9%, and 81.5% for the three study areas, respectively, with corresponding Kappa coefficients of 0.76, 0.86, and 0.77. The OS_SF_EMSI method achieved the highest classification accuracy among the three methods, with OAs exceeding 90% for all study areas. The corresponding Kappa coefficients were all above 0.88. In summary, it is evident that by incorporating EMSI and spatial features, the classification accuracy of mangroves can be improved.
5.5 Comparison with other mangrove products
We collected study areas (a, b) and compared the results of OMEC method with two reference maps (Figure 12), namely the 10 m resolution global mangrove forest dataset (HGMF_2020) provided by Mingming Jia (Jia et al., 2023) and the 1 m resolution China mangrove forest dataset (SMRI) provided by Qing Xia (Xia et al., 2022). Our results show similarities in terms of the mangrove areas with both HGMF_2020 and SMRI datasets in study areas (a, b). However, when comparing with the HGMF_2020 results, it can be observed that HGMF_2020 extracted some incorrect pixels at the edge of the river. Compared with the SMRI results, the mangrove patches extracted by the SMRI dataset were more fragmented due to the finer 1 m spatial resolution.
Figure 12
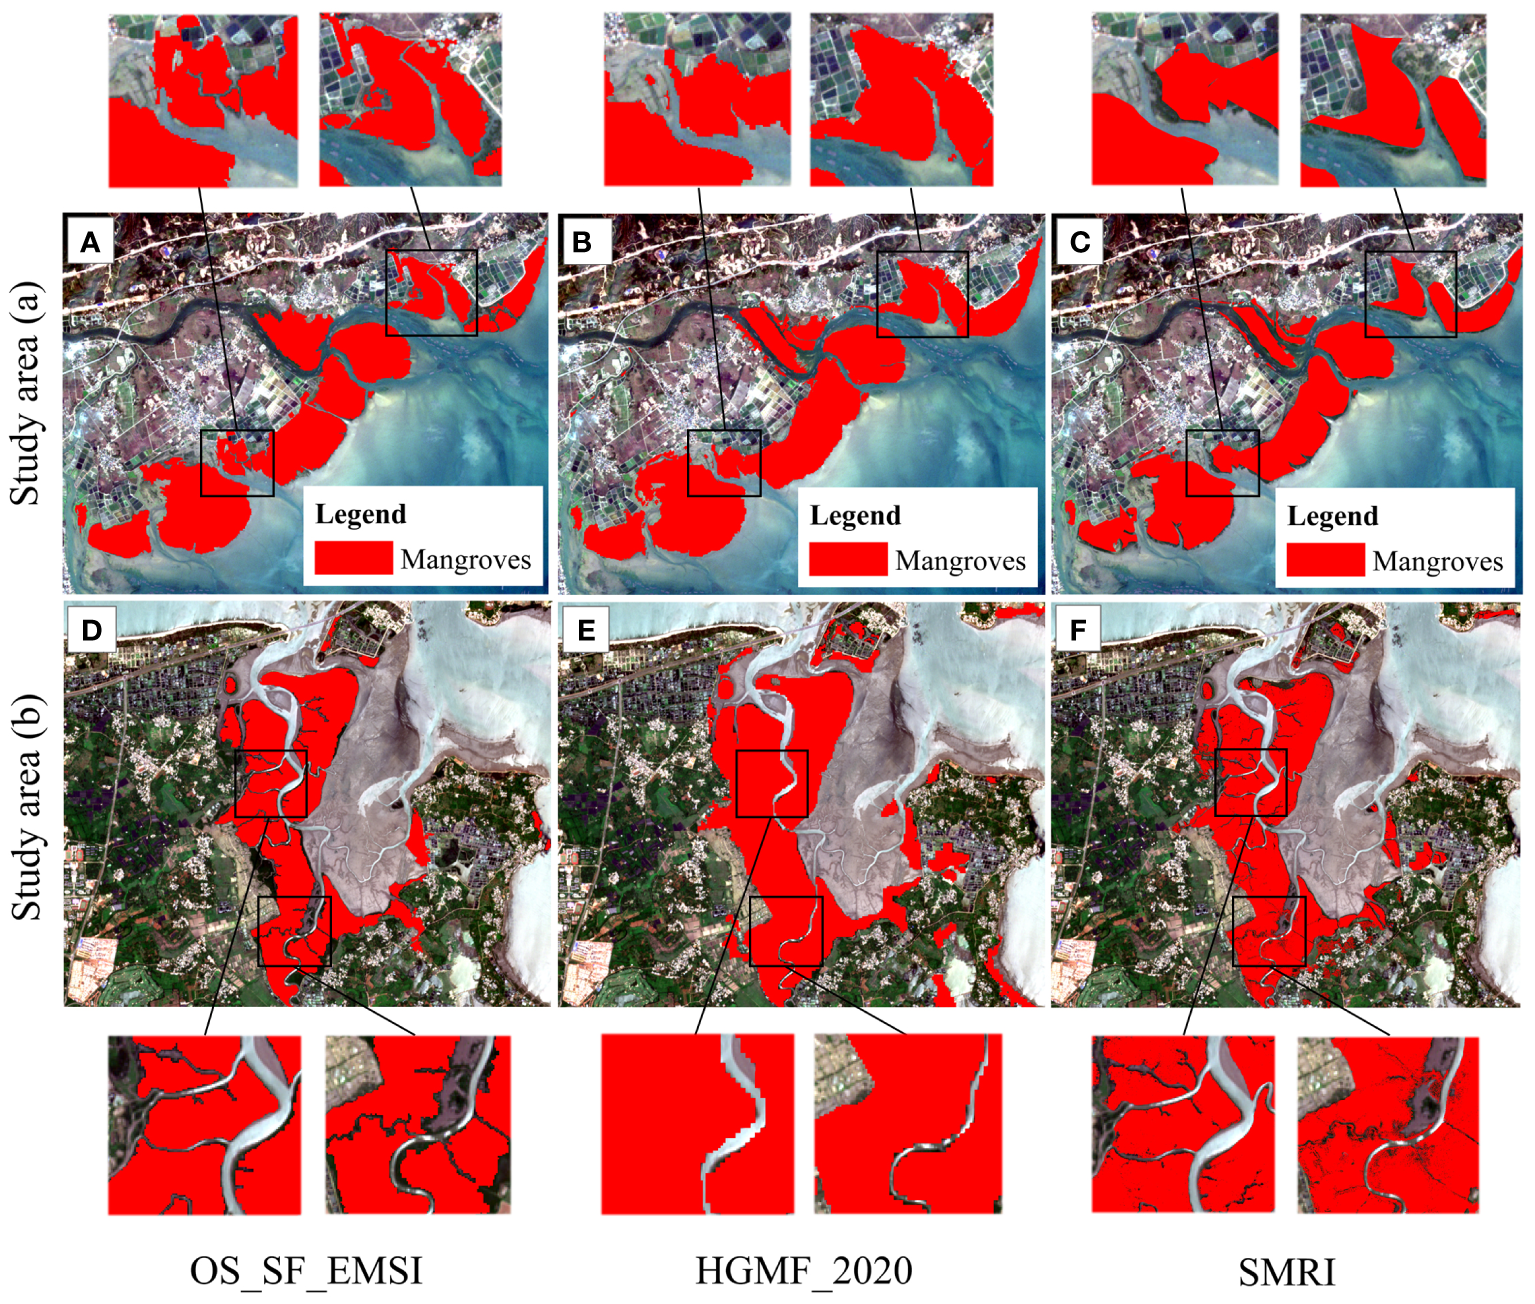
Mangrove results and the reference maps (i.e., HGMF_2020 and SMRI) were compared at the two study areas. (A, D) represents the results of OS_SF_EMSI for study areas (A, B); (B, E) represents the results of HGMF_2020 for study areas (A, B); (C, F) represents the results of SMRI for study areas (A, B).
6 Conclusions
This study proposes EMSI, which is based on the analysis of spectral reflectance differences between mangroves and other land cover types in multi-spectral images. It proposes an object-oriented multi-feature ensemble classification method. The research results demonstrate that EMSI exhibits good separability for mangroves. OMEC method achieves excellent performance in mangrove mapping, with high accuracy, OA exceeding 90%, and Kappa coefficients exceeding 0.88. Comparing the mangrove extraction results of different feature fusion approaches, it is evident that incorporating EMSI and spatial features enhances the mangrove classification. The pixel-oriented method is also compared with OMEC method, and although both methods exhibit an OA exceeding 86% and Kappa coefficients higher than 0.82, OMEC method outperforms the pixel-oriented method in terms of OA and mangrove mapping. The comparison with the results from the HGMF_2020 and SMRI datasets also shows similarities, indicating the good performance of our method. However, further investigation is needed to apply the proposed method to nationwide or global-scale mangrove extraction. This study provides valuable methods and insights for the accurate interpretation of coastal mangroves, contributing fundamental data and scientific references for the restoration, management, and protection of coastal wetlands.
Statements
Data availability statement
The original contributions presented in the study are included in the article/supplementary material. Further inquiries can be directed to the corresponding author.
Author contributions
QX: conceptualization, methodology, writing—original draft, review, editing, and supervision. HZ and SD: Software, validation, investigation. QZ: data curation and analysis. YZ and XD: language editing. All authors contributed to the article and approved the submitted version.
Funding
This research was supported by National Natural Science Foundation of China (No. 42101356) and Hunan Provincial Natural Science Foundation Youth Fund Project (No. 2022JJ40473).
Conflict of interest
The authors declare that the research was conducted in the absence of any commercial or financial relationships that could be construed as a potential conflict of interest.
Publisher’s note
All claims expressed in this article are solely those of the authors and do not necessarily represent those of their affiliated organizations, or those of the publisher, the editors and the reviewers. Any product that may be evaluated in this article, or claim that may be made by its manufacturer, is not guaranteed or endorsed by the publisher.
References
1
Aslan A. Abdullah F. Matthew W. Scott M. (2016). Mapping spatial distribution and biomass of coastal wetland vegetation in Indonesian Papua by combining active and passive remotely sensed data. Remote Sens. Environ.183, 65–81. doi: 10.1016/j.rse.2016.04.026
2
Baloloy A. Blance A. Rhommel R. Nadaoka K. (2020). Development and application of a new mangrove vegetation index (MVI) for rapid and accurate mangrove mapping. ISPRS J. Photogrammetry Remote Sens.166, 95–117. doi: 10.1016/j.isprsjprs.2020.06.001
3
Campos-Taberner M. Javierm F. Martinez B. Izquierdo E. Atzberger C. Camps-Valls G. et al . (2020). Understanding deep learning in land use classification based on Sentinel-2 time series. Sci. Rep.10 (1), 17188. doi: 10.1038/s41598-020-74215-5
4
Chaki J. Dey N. (2020). Texture feature extraction techniques for image recognition (Singapore: Springer). doi: 10.1007/978-981-15-0853-0
5
Chen D. Wang Y. Shen Z. Liao J. Chen J. Sun S. (2021). Long time-series mapping and change detection of coastal zone land use based on Google Earth Engine and multi-source data fusion. Remote Sens.14 (1), 1. doi: 10.3390/rs14010001
6
De Siqueira F. Schwartz W. Pedrini H. (2013). Multi-scale gray level co-occurrence matrices for texture description. Neurocomputing120, 336–345. doi: 10.1016/j.neucom.2012.09.042
7
Dhingra S. Kumar D. (2019). A review of remotely sensed satellite image classification. Int. J. Electrical Comput. Eng.9 (3), 1720. doi: 10.11591/ijece.v9i3
8
Elliott M. Cutts N. D. Trono A. (2014). A typology of marine and estuarine hazards and risks as vectors of change: a review for vulnerable coasts and their management. Ocean Coast. Manage.93, 88–99. doi: 10.1016/j.ocecoaman.2014.03.014
9
Fu B. He X. Yao H. Liang Y. Deng T. He H. et al . (2022). Comparison of RFE-DL and stacking ensemble learning algorithms for classifying mangrove species on UAV multispectral images. Int. J. Appl. Earth Observation Geoinf.112, 102890. doi: 10.1016/j.jag.2022.102890
10
Furlanetto R. H. Moriwaki T. Falcioni R. Pattaro M. Vollmann A. Sturion Junior A. C. et al . (2020). Hyperspectral reflectance imaging to classify lettuce varieties by optimum selected wavelengths and linear discriminant analysis. Remote Sens. Applications: Soc. Environ.20, 100400. doi: 10.1016/j.rsase.2020.100400
11
Ghorbanian A. Zaghian S. Asiyabi R. M. et al . (2021). Mangrove ecosystem mapping using Sentinel-1 and Sentinel-2 satellite images and random forest algorithm in Google Earth Engine. Remote Sens.13 (13), 2565. doi: 10.3390/rs13132565
12
Giri C. (2016). Observation and monitoring of mangrove forests using remote sensing: Opportunities and challenges. Remote Sens.8 (9), 783. doi: 10.3390/rs8090783
13
Giri C. Zhu Z. Tieszen L. Singh A.Gillette J. Kelmelis J. (2008). Mangrove forest distributions and dynamics, (1975–2005) of the tsunami-affected region of Asia. J. Biogeogr.35 (3), 519–528. doi: 10.1111/j.1365-2699.2007.01806.x
14
Guo Y. Long T. Jiao W. Zhang X. He G. Wang W. et al . (2022). Siamese detail difference and self-inverse network for forest cover change extraction based on Landsat 8 OLI satellite images. Remote Sens.14 (3), 627. doi: 10.3390/rs14030627
15
Guo M. Yu Z. Xu Y. Huang Y. Li C. (2021). Me-net: a deep convolutional neural network for extracting mangrove using sentinel-2a data. Remote Sens.13 (7), 1292. doi: 10.3390/rs13071292
16
Gupta K. Mukhopadhyay A. Giri S. Chanda et al . (2018). An index for discrimination of mangroves from non-mangroves using LANDSAT 8 OLI imagery. MethodsX5, 1129–1139. doi: 10.1016/j.mex.2018.09.011
17
Jia M. Wang Z. Mao D. Ren C. Song K. Zhao C. et al . (2023). Mapping global distribution of mangrove forests at 10-m resolution. Sci. Bull. doi: 10.1016/j.scib.2023.05.004
18
Jia M. Wang Z. Wang C. Mao D. Zhang Y. (2019). A new vegetation index to detect periodically submerged mangrove forest using single-tide Sentinel-2 imagery. Remote Sens.11 (17), 2043. doi: 10.3390/rs11172043
19
Jia M. Wang Z. Wang C. Mao D. Zhang Y. (2018). Monitoring loss and recovery of mangrove forests during 42 years: The achievements of mangrove conservation in China. Int. J. Appl. Earth Observation Geoinf.73, 535–545. doi: 10.1016/j.jag.2018.07.025
20
Jiang X. Zhen J. Miao J. Zhao D. Shen Z. Jiang J. et al . (2022). Newly-developed three-band hyperspectral vegetation index for estimating leaf relative chlorophyll content of mangrove under different severities of pest and disease. Ecol. Indic.140, 108978. doi: 10.1016/j.ecolind.2022.108978
21
Kaplan G. Avdan U. (2017). Object-based water body extraction model using Sentinel-2 satellite imagery. Eur. J. Remote Sens.50 (1), 137–143. doi: 10.1080/22797254.2017.1297540
22
Kuenzer C. Bluemel A. Gebhardt S. Quoc T. Dech S. (2011). Remote sensing of mangrove ecosystems: A review. Remote Sens.3 (5), 878–928. doi: 10.3390/rs3050878
23
Li W. El-Askary H. Qurban M. Li J. Manikandan K. Piechota T. (2019). Using multi-indices approach to quantify mangrove changes over the Western Arabian Gulf along Saudi Arabia coast. Ecol. Indic.102, 734–745. doi: 10.1016/j.ecolind.2019.03.047
24
Li H. Jia M. Zhang R. Ren Y. Wen X. (2019). Incorporating the plant phenological trajectory into mangrove species mapping with dense time series Sentinel-2 imagery and the Google Earth Engine platform. Remote Sens.11 (21), 2479. doi: 10.3390/rs11212479
25
Li Y. Wen H. Wang F. (2022). Analysis of the evolution of mangrove landscape patterns and their drivers in Hainan Island from 2000 to 2020. Sustainability15 (1), 759. doi: 10.3390/su15010759
26
Lu C. Li L. Wang Z. Su Y. Su Y Huang Y. et al . (2022). The national nature reserves in China: Are they effective in conserving mangroves? Ecol. Indic.142, 109265. doi: 10.1016/j.ecolind.2022.109265
27
Lymburner L. Bunting P. Lucas R. Scarth P. Alam I. Phillips C. et al . (2020). Mapping the multi-decadal mangrove dynamics of the Australian coastline. Remote Sens. Environ.238, 111185. doi: 10.1016/j.rse.2019.05.004
28
Mao D. Wang Z. Du B. Li L. Tian Y. Jia M. et al . (2020). National wetland mapping in China: A new product resulting from object-based and hierarchical classification of Landsat 8 OLI images. ISPRS J. Photogrammetry Remote Sens.164, 11–25. doi: 10.1016/j.isprsjprs.2020.03.020
29
Matthews M. W. (2011). A current review of empirical procedures of remote sensing in inland and near-coastal transitional waters. Int. J. Remote Sens.32 (21), 6855–6899. doi: 10.1080/01431161.2010.512947
30
Maurya K. Mahajan S. Chaube N. (2021). Remote sensing techniques: mapping and monitoring of mangrove ecosystem—a review. Complex Intelligent Syst.7, 2797–2818. doi: 10.1007/s40747-021-00457-z
31
Munang R. Thiaw I. Alverson K. Liu J. Han Z. (2013). The role of ecosystem services in climate change adaptation and disaster risk reduction. Curr. Opin. Environ. Sustainability5 (1), 47–52. doi: 10.1016/j.cosust.2013.02.002
32
Nguyen M. Baez-Villanueva O. Bui D. Nguyen P. Ribbe L. (2020). Harmonization of landsat and sentinel 2 for crop monitoring in drought prone areas: Case studies of Ninh Thuan (Vietnam) and Bekaa (Lebanon). Remote Sens.12 (2), 281. doi: 10.3390/rs12020281
33
Osei Darko P. Kalacska M. Arroy-Mora J. Fagan M. (2021). Spectral complexity of hyperspectral images: a new approach for mangrove classification. Remote Sens.13 (13), 2604. doi: 10.3390/rs13132604
34
Pandey P. C. Anand A. Srivastava P. K. (2019). Spatial distribution of mangrove forest species and biomass assessment using field inventory and earth observation hyperspectral data. Biodiversity Conserv.28, 2143–2162. doi: 10.1007/s10531-019-01698-8
35
Pham T. Yokoya N. Bui D. Yoshino K. Friess D. (2019). Remote sensing approaches for monitoring mangrove species, structure, and biomass: Opportunities and challenges. Remote Sens.11 (3), 230. doi: 10.3390/rs11030230
36
Pimple U. Simonetti D. Hinks I. Oszwald J. Berger U. Pungkul S. et al . (2020). A history of the rehabilitation of mangroves and an assessment of their diversity and structure using Landsat annual composites, (1987–2019) and transect plot inventories. For. Ecol. Manage.462, 118007. doi: 10.1016/j.foreco.2020.118007
37
Platt R. V. Rapoza L. (2008). An evaluation of an object-oriented paradigm for land use/land cover classification. Prof. Geographer60 (1), 87–100. doi: 10.1080/00330120701724152
38
Pu R. Landry S. Yu Q. (2011). Object-based urban detailed land cover classification with high spatial resolution IKONOS imagery. Int. J. Remote Sens.32 (12), 3285–3308. doi: 10.1080/01431161003745657
39
Romañach S. DeAngelis D. Lye H. Li Y. Yean S. Sulaiman R. et al . (2018). Conservation and restoration of mangroves: Global status, perspectives, and prognosis. Ocean Coast. Manage.154, 72–82. doi: 10.1016/j.ocecoaman.2018.01.009
40
Shi T. Z. Liu J. Hu Z. W. Liu H. Z. Wang J. J. Wu G. F. (2016). New spectral metrics for mangrove forest identification. Remote Sens. Lett.7 (9), 885–894. doi: 10.1080/2150704X.2016.1195935
41
Su W. Li J. Chen Y. Liu Z. Zhang J. Low T. M. et al . (2008). Textural and local spatial statistics for the object-oriented classification of urban areas using high resolution imagery. Int. J. Remote Sens.29 (11), 3105–3117. doi: 10.1080/01431160701469016
42
Thanh Noi P. Kappas M. (2017). Comparison of random forest, k-nearest neighbor, and support vector machine classifiers for land cover classification using Sentinel-2 imagery. Sensors18 (1), 18. doi: 10.3390/s18010018
43
Tran T. V. Reef R. Zhu X. (2022). A review of spectral indices for mangrove remote sensing. Remote Sens.14 (19), 4868. doi: 10.3390/rs14194868
44
Wan L. Lin Y. Zhang H. Wang F. Liu M. Lin H. (2020). GF-5 hyperspectral data for species mapping of mangrove in Mai Po, Hong Kong. Remote Sens.12 (4), 656. doi: 10.3390/rs12040656
45
Wang L. Jia M. Yin D. Tian J. (2019). A review of remote sensing for mangrove forests: 1956–2018. Remote Sens. Environ.231, 111223. doi: 10.1016/j.rse.2019.111223
46
Wang D. Wan B. Qiu P. Su Y. Guo Q. Wu X. (2018). Artificial mangrove species mapping using pléiades-1: An evaluation of pixel-based and object-based classifications with selected machine learning algorithms. Remote Sens.10 (2), 294. doi: 10.3390/rs10020294
47
Wang X. Xiao X. Zou Z. Hou L. Qin Y. Dong J. et al . (2020). Mapping coastal wetlands of China using time series Landsat images in 2018 and Google Earth Engine. ISPRS J. Photogrammetry Remote Sens.163, 312–326. doi: 10.1016/j.isprsjprs.2020.03.014
48
Winarso G. Purwanto A. D. Yuwono D. M. (2014). “New mangrove index as degradation/health indicator using Remote Sensing data: Segara Anakan and Alas Purwo case study,” in 12th Biennial Conference of Pan Ocean Remote Sensing Conference (Bali, Indonesia).
49
Xia Q. He T. Qin C. Xing X. Xiao W. (2022). An improved submerged mangrove recognition index-based method for mapping mangrove forests by removing the disturbance of tidal dynamics and S. alterniflora. Remote Sens.14 (13), 3112. doi: 10.3390/rs14133112
50
Xia Q. Li J. Dai S. Zhang H. Xing X. (2023). Mapping high-resolution mangrove forests in China using remotely-sensed imagery under the tide. Natl. Remote Sens. Bull., 1–17. doi: 10.11834/jrs.20221848
51
Xia Q. Qin C. Z. Li H. Huang C. Su F. -Z. (2018). Mapping mangrove forests based on multi-tidal high-resolution satellite imagery. Remote Sens.10 (9), 1343. doi: 10.3390/rs10091343
52
Xia Q. Qin C. Li H. Huang C. Su F. (2020). Evaluation of submerged mangrove recognition index using multi-tidal remote sensing data. Ecol. Indic.113, 106196. doi: 10.1016/j.ecolind.2020.106196
53
Yang G. Huang K. Sun W. Meng X. Mao D. Ge Y. (2022). Enhanced mangrove vegetation index based on hyperspectral images for mapping mangrove. ISPRS J. Photogrammetry Remote Sens.189, 236–254. doi: 10.1016/j.isprsjprs.2022.05.003
54
Zhang X. Feng X. Jiang H. (2010). Object-oriented method for urban vegetation mapping using IKONOS imagery. Int. J. Remote Sens.31 (1), 177–196. doi: 10.1080/01431160902882603
55
Zhang X. He G. Zhang Z. Peng Y. Long T. (2017). Spectral-spatial multi-feature classification of remote sensing big data based on a random forest classifier for land cover mapping. Cluster Comput.20, 2311–2321. doi: 10.1007/s10586-017-0950-0
56
Zhang T. Hu S. He Y You S. Yang X. Gan Y. et al . (2021). A fine-scale mangrove map of China derived from 2-meter resolution satellite observations and field data. ISPRS Int. J. Geo-Inf.10 (2), 92. doi: 10.3390/ijgi10020092
57
Zhang R. Jia M. Wang Z. Zhou Y. Mao D. Ren C. et al . (2022). Tracking annual dynamics of mangrove forests in mangrove National Nature Reserves of China based on time series Sentinel-2 imagery during 2016–2020. Int. J. Appl. Earth Observation Geoinf.112, 102918. doi: 10.1016/j.jag.2022.102918
58
Zhang X. Tian Q. (2013). A mangrove recognition index for remote sensing of mangrove forest from space. Curr. Sci.105 (8), 1149. doi: 10.1016/j.isprsjprs.2020.06.001
59
Zhang R. Jia M. Wang Z. Zhou Y. Mao D. Ren C. (2017). Mapping mangrove forests using multi-tidal remotely-sensed data and a decision-tree-based procedure. Int. J. Appl. Earth Observation Geoinf.62, 201–214. doi: 10.1016/j.jag.2017.06.010
60
Zhao C. Jia M. Wang Z. Mao D. Wang Y. (2023a). Identifying mangroves through knowledge extracted from trained random forest models: An interpretable mangrove mapping approach (IMMA). ISPRS J. Photogrammetry Remote Sens.201, 209–225. doi: 10.1016/j.isprsjprs.2023.05.025
61
Zhao C. Jia M. Wang Z. Mao D. Wang Y. (2023b). Toward a better understanding of coastal salt marsh mapping: A case from China using dual-temporal images. Remote Sens. Environ.295, 113664. doi: 10.1016/j.rse.2023.113664
62
Zhao C. Qin C. Z. (2022). Identifying large-area mangrove distribution based on remote sensing: A binary classification approach considering subclasses of non-mangroves. Int. J. Appl. Earth Observation Geoinf.108, 102750. doi: 10.1016/j.jag.2022.102750
Summary
Keywords
Sentinel-2 images, an enhanced mangrove spectral index, multi-features, object-oriented segmentation, spectral reflectance signature
Citation
Zhang H, Xia Q, Dai S, Zheng Q, Zhang Y and Deng X (2023) Mangrove forest mapping from object-oriented multi-feature ensemble classification using Sentinel-2 images. Front. Mar. Sci. 10:1243116. doi: 10.3389/fmars.2023.1243116
Received
20 June 2023
Accepted
28 September 2023
Published
20 October 2023
Volume
10 - 2023
Edited by
Mingming Jia, Chinese Academy of Sciences (CAS), China
Reviewed by
Rina Kumari, Central University of Gujarat, India; Yulong Guo, Henan Agricultural University, China; Bolin Fu, Guilin University of Technology, China; Dehua Mao, Chinese Academy of Sciences, China; Jinyan Tian, Capital Normal University, China
Updates
Copyright
© 2023 Zhang, Xia, Dai, Zheng, Zhang and Deng.
This is an open-access article distributed under the terms of the Creative Commons Attribution License (CC BY). The use, distribution or reproduction in other forums is permitted, provided the original author(s) and the copyright owner(s) are credited and that the original publication in this journal is cited, in accordance with accepted academic practice. No use, distribution or reproduction is permitted which does not comply with these terms.
*Correspondence: Qing Xia, xiaqing@csust.edu.cn
Disclaimer
All claims expressed in this article are solely those of the authors and do not necessarily represent those of their affiliated organizations, or those of the publisher, the editors and the reviewers. Any product that may be evaluated in this article or claim that may be made by its manufacturer is not guaranteed or endorsed by the publisher.