 Carolina E. González1
 Leocadio Blanco-Bercial2
 Rubén Escribano1,3*
 Igor Fernández-Urruzola1
 Reinaldo Rivera1
 Osvaldo Ulloa1,3
- 1Instituto Milenio de Oceanografía (IMO), Universidad de Concepción, Concepción, Chile
- 2Bermuda Institute of Ocean Sciences, Arizona State University, St. Georges, Bermuda
- 3Departamento de Oceanografía, Facultad de Ciencias Naturales y Oceanografía, Universidad de Concepción, Concepción, Chile
Zooplankton diversity in the deep “midnight zone” (>1000 m), where sunlight does not reach, remains largely unknown. Uncovering such diversity has been challenging because of the major difficulties in sampling deep pelagic fauna and identifying many (unknown) species that belong to these complex swimmer assemblages. In this study, we evaluated zooplankton diversity using two taxonomic marker genes: mitochondrial cytochrome oxidase subunit 1 (COI) and nuclear 18S ribosomal RNA (18S). We collected samples from plankton net tows, ranging from the surface to a depth of 5000 m above the Atacama Trench in the Southeast Pacific. Our study aimed to assess the zooplankton diversity among layers from the upper 1000 m to the ultra-deep abyssopelagic zone to test the hypothesis of decreasing diversity with depth resulting from limited carbon sources. The results showed unique, highly vertically structured communities within the five depth strata sampled, with maximal species richness observed in the upper bathypelagic layer (1000–2000 m). The high species richness of zooplankton (>750 OTUS) at these depths was higher than that found in the upper 1000 m. The vertical diversity trend exhibited a pattern similar to the well-known vertical pattern described for the benthic system. However, a large part of this diversity was either unknown (>50%) or could not be assigned to any known species in current genetic diversity databases. DNA analysis showed that the Calanoid copepods, mostly represented by Subeucalanus monachus, the Euphausiacea, Euphausia mucronata, and the halocypridade, Paraconchoecia dasyophthalma, dominated the community. Water column temperature, dissolved oxygen, particulate carbon, and nitrogen appeared to be related to the observed vertical diversity pattern. Our findings revealed rich and little-known zooplankton diversity in the deep sea, emphasizing the importance of further exploration of this ecosystem to conserve and protect its unique biota.
1 Introduction
The deep ocean represents over 95% of the global biosphere (Corinaldesi, 2015) and has traditionally been considered a challenging environment because of its low temperatures, lack of light, low food availability, and high hydrostatic pressure (Jamieson et al., 2010). However, previous research has shown that this realm hosts a highly diverse range of metazoan organisms that are vertically distributed across ecological zones (McIntyre, 2010). These zones are characterized by the presence of distinctive species assemblages in various taxonomic groups (Vinogradov, 1970; Angel and Fasham, 1975; Angel, 1979). Diversity inventories implemented in these zones suggest that less than 1% of the species have been described (De Vargas et al., 2015), and their richness may, in fact, be as high as that recorded for tropical forests (Grassle, 1989). In the deep sea, zooplankton contains a large part of this metazoan species richness. However, studies on zooplankton diversity have mainly focused on epipelagic habitats (0-200 m) (Tittensor et al., 2010; Costello and Chaudhary, 2017), and very few studies have dealt with their vertical patterns of diversity (e.g., Sommer et al., 2017; Laroche et al., 2020). In general terms, large-scale patterns of zooplankton diversity show increasing species richness in subtropical areas (Tittensor et al., 2010), while vertical trends exhibit a species richness peak in the upper mesopelagic layer (200-300 m) (Sommer et al., 2017), or a bimodal distribution between the surface and 3000 m (Cheng et al., 2022).
Understanding the vertical patterns of diversity in deep pelagic environments is a subject of significant scientific interest. Researchers have been particularly intrigued by the role that environmental gradients may play in structuring and maintaining deep-ocean diversity. Previous studies have proposed a parabolic vertical pattern of diversity, with the maximum observed at depths between 1000 and 2000 m (Vinogradov, 1970; Angel and Fasham, 1975; Angel, 1979; Lindsay and Hunt, 2005; Yamaguchi et al., 2015). However, this pattern has been described based on specific taxonomic groups, mainly within the same genus or family, and on communities from the top 3000 m. Consequently, the general vertical pattern of zooplankton diversity from the surface to the ultra-deep zone (>3000 m) remains poorly known (Angel et al., 1982; Ramírez-Flandes et al., 2022). In benthic metazoans, where more studies have been conducted below 3000 m, a parabolic pattern of diversity with depth has also been observed. Because competition, predation, food sources, and spatial relationships play a crucial role in this compact habitat (Rex, 1981), it is unknown whether these factors may differently affect the diversity patterns of metazoans across the water column in the planktonic environment, where the gradients and resource availability are not equivalent.
The pelagic metazoan fauna includes a diverse array of groups, including Cnidaria, Ctenophora, Chaetognatha, Polychaeta, Mollusca, Crustacea, Urochordata, and Vertebrata (Rogers, 2015). Although these groups comprise the majority of zooplankton and are characterized by high levels of phylogenetic and taxonomic diversity, there are a total of 15 phyla and 41 functional groups (Bucklin et al., 2021). As in most regions, copepods dominate, constituting as much as 80% of the community in the upper 1000 m, but other groups, such as euphausiids, ostracods, and siphonophores, may also be abundant in the deep ocean (Steinberg et al., 2008; Ramírez-Flandes et al., 2022). Among the pelagic components, zooplankton are an ecologically sensitive and adaptable group that responds rapidly to environmental variation (Richardson and Schoeman, 2004). The abundance and composition of these organisms can be influenced by temperature (González et al., 2020b), salinity (Purushothama et al., 2011), oxygen levels (Wishner et al., 2020), hydrostatic pressure (Childress and Thuesen, 1993), and quantity and quality of resources (Vargas et al., 2006). However, it remains unknown which environmental factors might drive the diversity and vertical distribution of zooplankton in the abyssopelagic zone (>4000 m), which has scarcely been sampled before. Understanding the diversity and drivers of zooplankton distribution in the deep ocean is crucial, as it serves as a fundamental building block of the pelagic food web and plays a key role in the flux and recycling of carbon and nitrogen (Tutasi and Escribano, 2020; Fernández-Urruzola et al., 2021; González et al., 2023).
The pelagic environment is a vast and mysterious realm that harbors over 7000 known species of marine zooplankton. The total number of species in this environment is estimated to be as high as 28,000 if meroplankton are included (Bucklin et al., 2011; Lenz, 2012). Taxonomic analysis of this group at the species level poses several challenges, including the high number of cryptic species (González et al., 2020a) and a lack of diagnostic characteristics during their immature and larval developmental stages (Bucklin et al., 2016). In addition, traditional techniques require advanced taxonomic expertise and are time consuming (Zhang et al., 2018). Therefore, there is a need for new techniques that allow for faster, more accurate, and reliable discrimination of zooplankton biodiversity, especially when investigating poorly known and inaccessible communities, such as those found in the deep ocean. High-throughput sequencing (HTS) methods, such as metabarcoding, have proven valuable in biodiversity research on complex communities (Taberlet et al., 2012; Creer et al., 2016). Metabarcoding involves sequencing thousands to millions of DNA fragments simultaneously, providing faster and cheaper processing of multiple samples than the traditional taxonomy. This molecular technique utilizes HTS to identify several taxa from a single sample by comparing the DNA of one or more specific genes, such as mitochondrial cytochrome oxidase subunit 1 (COI) (Leray et al., 2013) and nuclear 18S ribosomal RNA (18S) (Amaral-Zettler et al., 2009), to a reference database of known species and sequences (Taberlet et al., 2012). The application of this technique to zooplankton communities has demonstrated its capacity to identify small, immature, and cryptic specimens, allowing for the detection of more species or genera than traditional taxonomy (Lindeque et al., 2013; Kim et al., 2020). Moreover, it has allowed the identification of vertical distribution gradients and changes in the zooplankton structure associated with oceanographic variability in shallow pelagic environments (Lindeque et al., 2013; De Vargas et al., 2015). However, the diversity of the deeper layers (>3000 m) of the ocean based on net tows has not been explored using these molecular methods. In this study, molecular analysis was conducted to assess the diversity of zooplankton at different depths in the Southeast Pacific Ocean (SEP), including the unexplored > 5000 m “midnight zone.” For this purpose, vertically stratified samples were collected from two sites above the Atacama Trench on the SEP. COI and 18S gene metabarcoding analyses were performed to study zooplankton diversity and obtain precise information on the composition and distribution of different taxa along the water column, reaching depths beyond 3000 m, which had not been sampled before. The main goal of this study was to uncover the pattern of zooplankton diversity from the photic zone to the ultra-deep ecosystem, referred to here as the midnight zone, to address the question of whether this diversity decreases with depth because of the limited sources of food in the deep sea. Additionally, this study provides insights into the key environmental variables that influence the vertical distribution of zooplankton diversity.
2 Materials and methods
2.1 Study site and sampling
Samples were collected between February 2 and March 21 during the austral summer of 2018 off the northern coast of Chile, on board the German FS Sonne (cruise So261). The stations were located above the Atacama Trench (stations 2 and 4), between 21° 47’ S and 23° 21’ S (Figure 1A). Hydrographic data, including temperature, salinity, oxygen concentration, and pressure, were obtained using a Seabird SBE-9 plus CTD equipped with an oxygen sensor, coupled to an oceanographic rosette with 10–24 L Niskin bottles. Once on deck, the Niskin bottles were emptied and pre-filtered using a 100 µm nylon mesh. Water samples were obtained at several discrete depths from the two sites for analysis of particulate organic carbon (POC), particulate organic nitrogen (PON), carbon and nitrogen (C/N) ratios, and isotope signatures of carbon and nitrogen (δ13C and δ15N (‰)). Between 0.5-60 L of seawater, depending on the POM concentration, were gently filtered through pre-combusted (450°C, 24 h) GF/F filters (Whatman, 47 mm diameter), which were immediately dried at 60°C for 24 h. The filters were subsequently wrapped in aluminum foil and stored in a sealed container with silica gel to avoid moisture until analysis in the Laboratory of Biogeochemistry and Applied Stable Isotopes (Pontifical Catholic University of Chile). The filters were placed overnight in a desiccator saturated with HCl fumes to remove inorganic carbonate, packed in tin capsules, and fed via flash combustion into a Thermo Scientific Flash 2000 CHN elemental analyzer (EA) coupled with a Thermo DeltaV Advantage isotope ratio mass spectrometer (IRMS). Analytical errors in the elemental determinations were 3 μg and 7 μg for nitrogen and carbon, respectively, according to linear regression against the standard (acetanilide). The precision of the stable isotope analyses, as determined using four internal standards (acetanilide, atropine, caffeine, and glutamic acid) in triplicate, was 0.33‰ for δ13C and 0.21‰ for δ15N.
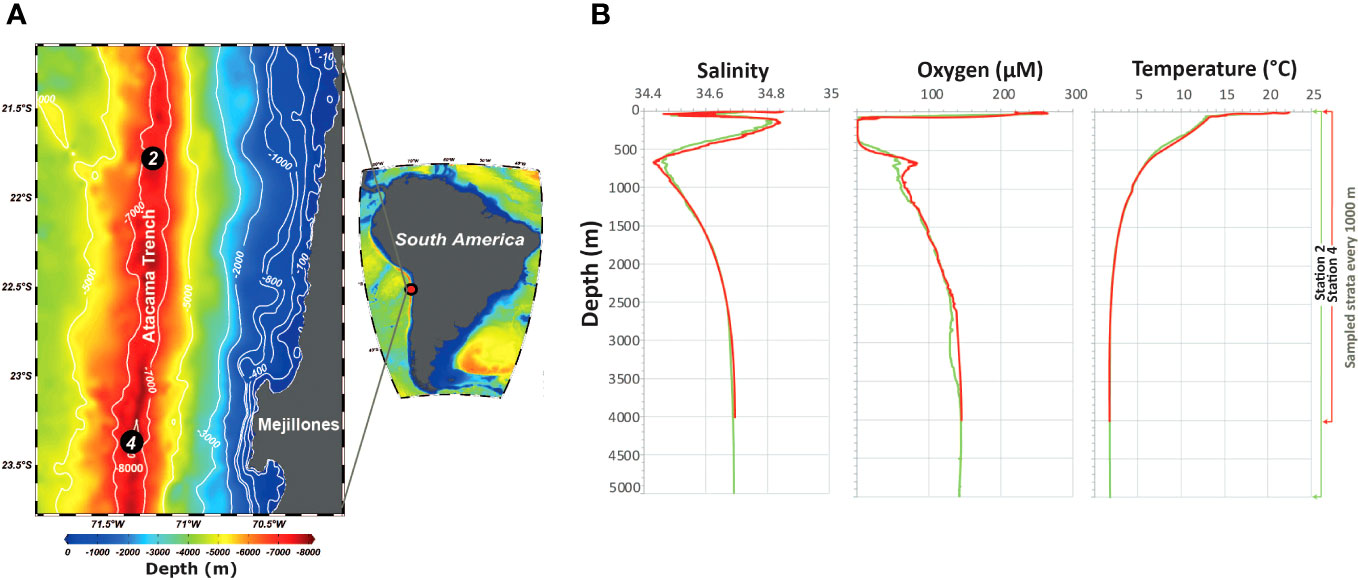
Figure 1. (A) Sampling stations during the FS Sonne cruise in summer 2018. Black circles represent sampling sites for zooplankton and water. (B) Depth profiles of salinity, oxygen concentration, and temperature at Stations 2 and 4 above the Atacama Trench.
Zooplankton samples for metabarcoding analysis were collected at two stations (details are provided in Supplementary Table S1). Sampling was conducted between 0 and 5000 m using a multiple opening/closing net and an environmental sensing system (MOCNESS-10) with a 10 m2 mouth opening and five 333-μm mesh nets, equipped with pressure and flowmeter sensors. Five nets were closed every 1000 m. Zooplankton samples were split in half with a Motoda splitter (Motoda, 1959) and sieved using a 200-μm mesh sieve to remove excess water. Half of the samples were preserved in 99% ethanol, which was replaced after 24 hours. The samples were stored at -20°C for subsequent DNA analysis in the laboratory.
2.1 DNA extraction
The extraction method followed that described by Blanco-Bercial (2020). In short, this is a modification of the E.Z.N.A.® Mollusc DNA Kit (Omega Bio-Tek, Norcross, GA, United States) adapted for large volumes, using Sodium Dodecyl Sulfate (SDS) lysis buffer instead of the ML1 buffer from OMEGA. Two pseudoreplicates were obtained from each sample from each stratum. DNA was quantified for each sample with a Qubit 4.0® fluorometer, reporting concentrations of 6.8 and 73.8 ng μL-1.
2.2 Polymerase chain reaction amplification, library preparation, and sequencing
One PCR reaction and sequencing were performed for each pseudoreplicate per sample for the two different genetic regions at the AUSTRAL-omics laboratory of the Universidad Austral de Chile. Amplification of the mitochondrial COI gene was performed using the primers mlCOIintF and jgHCO2198 (Geller et al., 2013; Leray et al., 2013), whereas primers 1389F and 1510R (Amaral-Zettler et al., 2009) were used for the nuclear V9 region of the 18S gene. Amplifications were performed independently for each amplicon in a final volume of 12 μL, which included 6μL of AmpliTaq Gold enzyme (0.3 U μL-1), 2 μL of ultrapure water (HyClone), and 1 μL each of forward and reverse primers at a concentration of 2.5 μM each, and 2 μL of template. The amplification protocols for the two amplicons are shown in Supplementary Table S2. PCR success was confirmed on 1.5% agarose gel in 1x TAE Buffer. The PCR products were purified using magnetic beads in 10 mM Tris buffer.
Libraries were created according to a protocol based on “Illumina 16S Metagenomic Sequencing Library Preparation” (Illumina, 2015) for both markers. In this step, the index primers and the purified amplicon were used in a second PCR reaction with a master mix composed of 25 μL of 2x KAPA HiFi HotStart ReadyMix, 5 μL of each Index Illumina primer, 5 µL of purified PCR product, and 10 µL of PCR-grade water (HyClone), for a total volume of 50 µL. The PCR protocol followed to amplify the libraries included one cycle of initial denaturation at 95°C for 3 min, followed by eight cycles of denaturation at 95°C for 30 s, alignment at 55°C for 30 s, elongation at 72°C for 30 s, and one cycle of final elongation at 72°C for 5 min. The indexed PCR product was purified using AMPure XP magnetic beads, with a final elution volume of 25 μL. Subsequently, the libraries were checked by capillary electrophoresis using an Agilent Fragment Analyzer with the DNF-910 Kit. The libraries were quantified by fluorometry using Qubit 4.0®. Bidirectional sequencing was performed, including negative controls and samples, on an Illumina MiSeq using the Reagent Kit v3 (600-cycles), spiked with a minimum of 20% PhiX. The sequences obtained are available on the NCBI website under the bioproject: https://www.ncbi.nlm.nih.gov/bioproject/?term=PRJNA908823.
2.3 Bioinformatics pipeline
The demultiplexed COI and 18S gene samples were analyzed using MOTHUR ver. 1.43 (Schloss et al., 2009) on the computing cluster of the Instituto Milenio de Oceanografía (IMO) (https://www.imo-chile.com). The full script with annotations is available at https://github.com/carolinagonzaleze/SONNE_above_Atacama_Trench. Forward and reverse sequences were compared nucleotide by nucleotide, and mismatched positions were kept ambiguous if the quality difference between both strands was less than 10. If a base was compared with a gap in the other fragment, it was maintained only if Q > 30. Subsequently, all contigs with ambiguous nucleotides, more than 10 homopolymers, and fewer than 250 base pairs for COI and 115 for 18S were removed. The sequences obtained from the 18S gene were aligned to the v9 region of the SILVA 18S database (Quast et al., 2012). The sequences were trimmed to the length of the V9 region and all incomplete sequences were removed. For both genes, chimeras were detected using VSEARCH (Rognes et al., 2016) and MOTHUR. Errors associated with high-throughput sequencing were removed by UNOISE (Edgar and Flyvbjerg, 2015) using MOTHUR (diffs = 1) for 18S, obtaining amplicon sequence variants (ASVs) that were 100% similar. The COI gene sequences were clustered to 95% similarity, which is the most common threshold for COI species (Supplementary Figure S1) (Bucklin et al., 2021, Bucklin et al., 2010). Potentially erroneous operational taxonomic units (OTUs) were further removed with the “LULU” package in R (Frøslev et al., 2017; R Core Team A, 2020).
2.4 Taxonomic assignment to zooplankton groups and species
Taxonomic assignment for 18S V9 ASVs was performed using the Silva 128 ribosomal database with a naïve Bayesian classifier algorithm implemented in MOTHUR. For COI OTUs, the assignment was done using BLASTN (Zhang et al., 2004) against the GenBank nucleotide database (Benson et al., 2005), comparing the first ten matches and selecting assignments with e-values lower than 10-6 and identity values greater than 97% (species) or 85% (family or order). Only sequences assigned to metazoans were selected for further analysis of both markers.
2.5 Data analysis
Pseudoreplicates from each sample were summed for each station, allowing for greater sequencing depth of the study genes. All samples were standardized using the minimum number of reads per sample:220,984 for ASVs and 109,358 for OTUs. These standardized values are hereafter referred to as sequence abundances. The resulting ASVs/OTUs with total abundances below two were eliminated (global singletons and doubletons). To analyze the effect of the number of reads per sample on diversity, rarefaction curves were performed in the iNEXT (iNterpolation and EXTrapolation) package in R (Hsieh et al., 2016; R Core Team A, 2020), with confidence values obtained after 1000 bootstraps. Diversity indices, such as the total number of taxa (S), Shannon diversity index (H’), Simpson’s inverse (1-λ), and Pielou’s evenness index (J’), were calculated using PRIMER ver. 7 (Clarke and Gorley, 2015). Additionally, Phylogenetic diversity (PD) was calculated from a tree generated using ClearCut, as implemented in MOTHUR (Faith, 1992).
Similarity matrices between samples were constructed using the Bray–Curtis distance after Hellinger transformation (Legendre and Gallagher, 2001) and plotted using Principal Coordinate Analysis (PCoA). Clustering between samples from different strata and stations was performed using a similarity profile routine (SIMPROF test) (Clarke and Gorley, 2015). Differences in the community structures of the generated clusters were compared using the analysis of similarities (ANOSIM) procedure with 10000 permutations for significance testing in PRIMER ver. 7 (Clarke and Gorley, 2015).
Considering the strong gradients in near-surface waters and for statistical purposes, environmental data (including POC, PON, C/N, and their isotopic signatures) from the upper 1000 m were assumed as well represented by mid-layer values (500 m), whereas average values were estimated for deeper layers that had much weaker gradients. A summary statistic for all the environmental data can be found in Table S3 of the Supplementary Material.
The relationship between the abundance of ASVs/OTUs and the oceanographic and biogeochemical conditions of the water column was evaluated using Distance-based Linear Modeling (DistLM) in PRIMER ver.7 (Clarke and Gorley, 2015). Consequently, this analysis provided a pseudo-pseudo-F statistic” and a probability value for each environmental variable after 10000 permutations. To define the environmental variables to be included in the final model, Spearman’s rank correlation was applied to remove highly correlated variables (Spearman’s R > 0.80, p < 0.05) such as POC and PON.
Finally, generalized additive models (GAMs) were constructed to evaluate the effect of oceanographic variability on the diversity indices of OTUs for the most abundant taxonomic groups per sampling site. An automated stepwise procedure was used in the GAMs through the Akaike information criterion (AIC), providing the percentage Deviance Explained (DE), coefficient of determination (R2), and significance value (p) for each model. The models were built using a Gaussian distribution and an identity link function through the mgcv package in R (Wood, 2017; R Core Team A, 2020).
3 Results
3.1 DNA and bioinformatics assessment
All samples were subjected to DNA extraction and amplification. A total of 4,860,867 reads were obtained for the 18S gene and 2,665,637 for the COI gene, of which 3,696,340 and 1,619,482 passed the quality control and chimera cleanup, respectively. Unique sequences were grouped into ASVs (18S) and OTUs (COI), resulting in 47,871 ASVs for 18S and 2624 OTUs for COI, although only 1681 ASVs and 1631 OTUs could be assigned to metazoans. Rarefaction curves based on the number of ASVs and OTUs showed saturation in most cases, indicating high sampling coverage. Only two samples did not appear to reach saturation (Station 2: 4000-5000 (18S) and 1000–2000 m (COI)) (Figure 2). The raw data are presented in an Excel file (Supplementary Dataset S1), including the abundance per sample, taxonomic assignment, and representative sequences for each ASV and OTU.
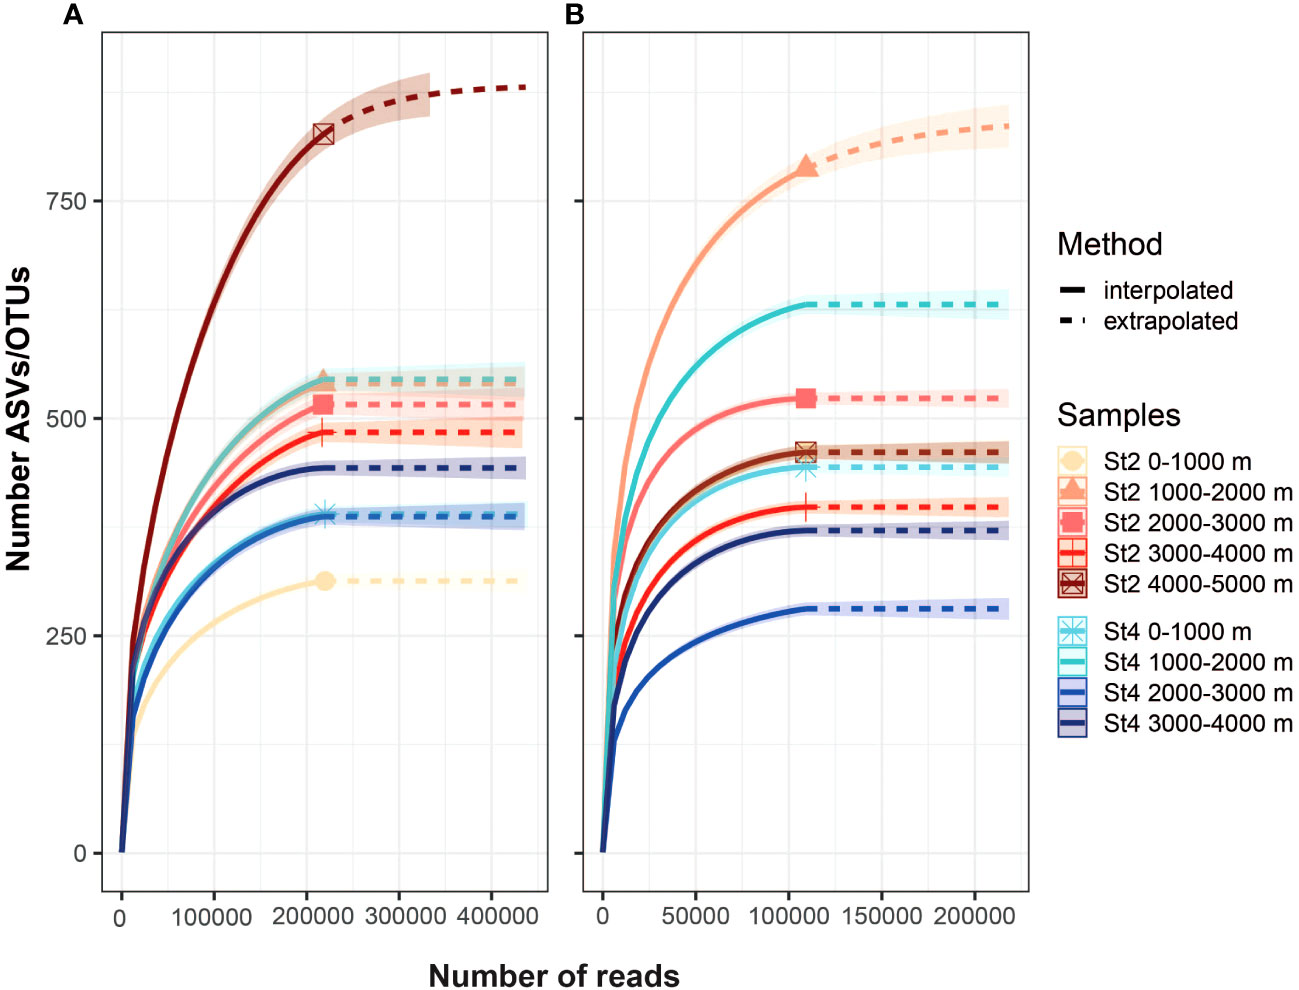
Figure 2. Accumulation curves of amplicon sequence variants (ASVs) for the 18S (A) and operational taxonomic units (OTUs) COI (B). The curves represent values extrapolated to more than 200000 reads per sample. Most of the samples showed an asymptotic profile, indicating that all OTUs had been detected. The highest number of OTUs was observed at Station 2 for both genes, at depths of 4000–5000 m for 18S and 1000–2000 m for COI.
3.2 Diversity and community composition
Vertical profiles of the diversity indices (Figure 3 and Supplementary Table S4) for the 18S gene exhibited the lowest values in the upper layer at Station 2. The maximum diversity values were also observed at the same station, but in the deepest layer. The COI gene showed the lowest values in the deep layers at Station 4, whereas the maximum values were observed in the 1000–2000 m layer at Station 2. When comparing the stations between 0 m and 4000 m, S, H’, 1-λ, J’, and PD exhibited the same pattern. The diversity indices of the most abundant groups exhibited strong variability (COI gene) (Supplementary Table S5). The diversity was the highest in the upper layer for Peracarida and Halocyprida, whereas Calanoida and Siphonophorae showed the highest values in the middle, bathypelagic layers (1000–3000 m). The other groups exhibited great variability between stations; however, in most cases, the highest values of the S and PD indices were centered between 0 and 2000 m. The 18S gene indicated that the major zooplankton groups were calanoid copepods (>50% relative abundance) at both sampling stations along the water column (Figure 4). Other dominant groups averaged across the water column and stations included Euphausiacea (>10%), Halocyprida (ca. 7%), Doliolida (ca. 5%), Peracarida (ca. 4.9%), Siphonophorae (ca. 3%), other Eucarida (ca. 2.4%), and Salpida (ca. 2.2%). However, the distribution of these groups varied greatly among the strata and sampling stations. For example, the intermediate layer (2000–3000 m) at Station 4 showed a peak in the relative abundance (~ 48%) of Euphausiacea compared with the other groups.
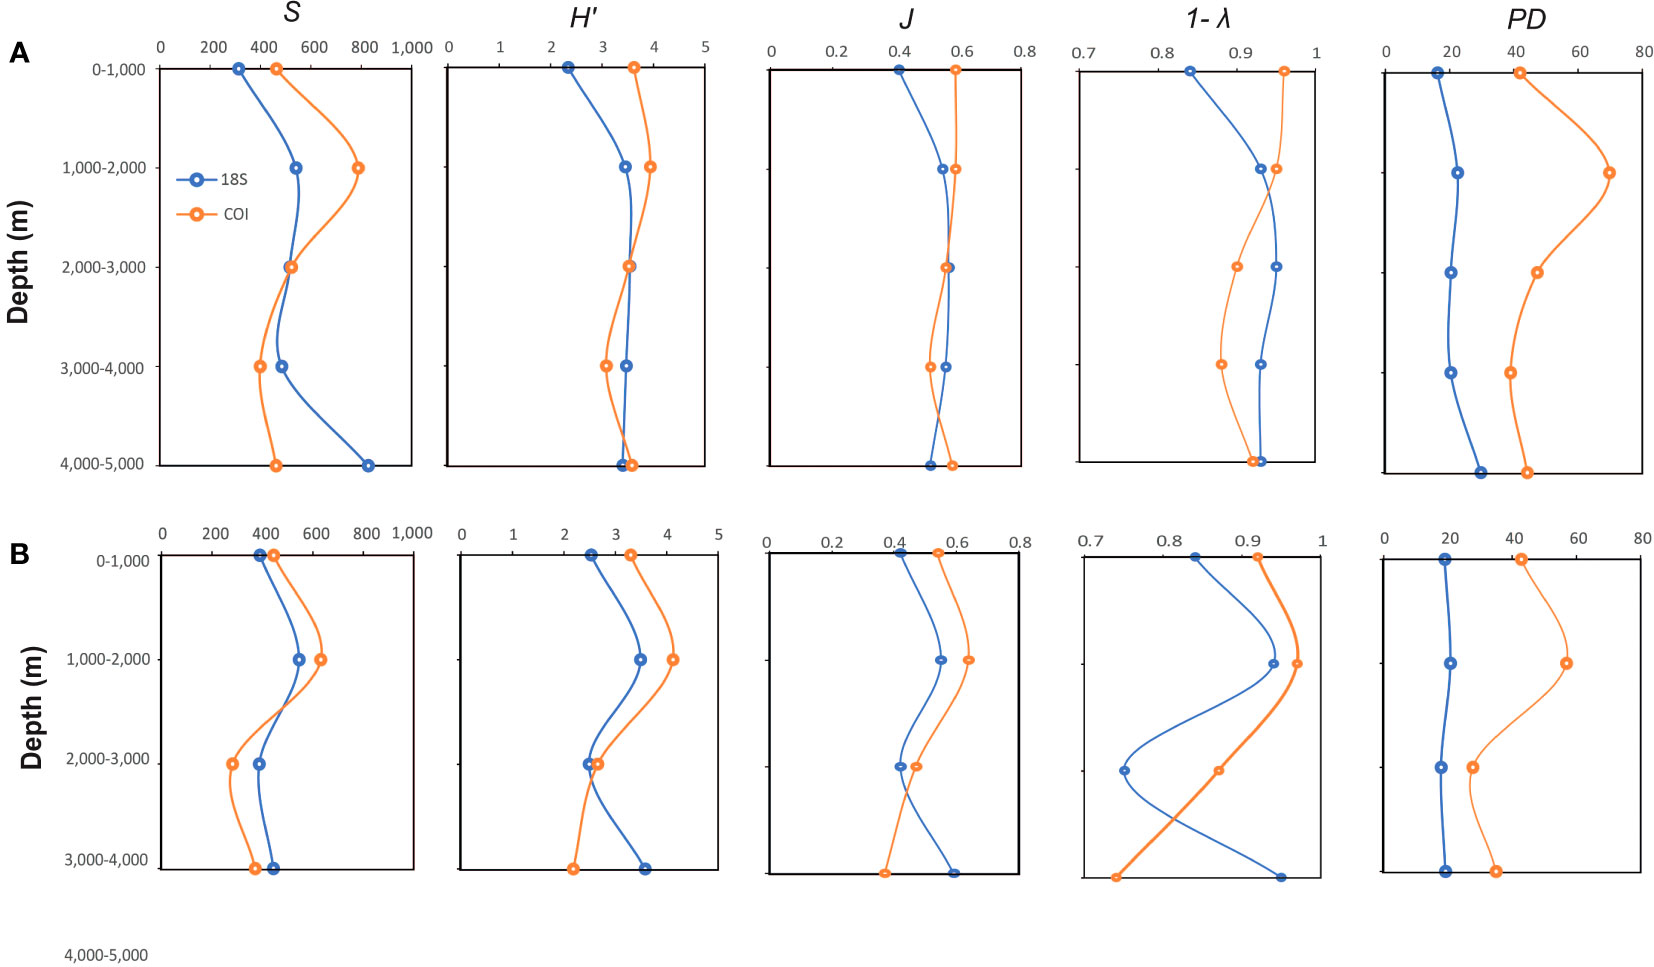
Figure 3. Variation of the total number of taxa (S), Pielou’s evenness (J´), Shannon diversity index (H’), Simpson’s inverse (1-λ), and phylogenetic diversity (PD) of 18S (light blue) and COI (orange) genes with depth at Stations 2 (A) and 4 (B). The implemented sequences were normalized, cleaned, and assigned to metazoans. For the COI gene, sequences with an identity value greater than 85% obtained from the GenBank database were use.
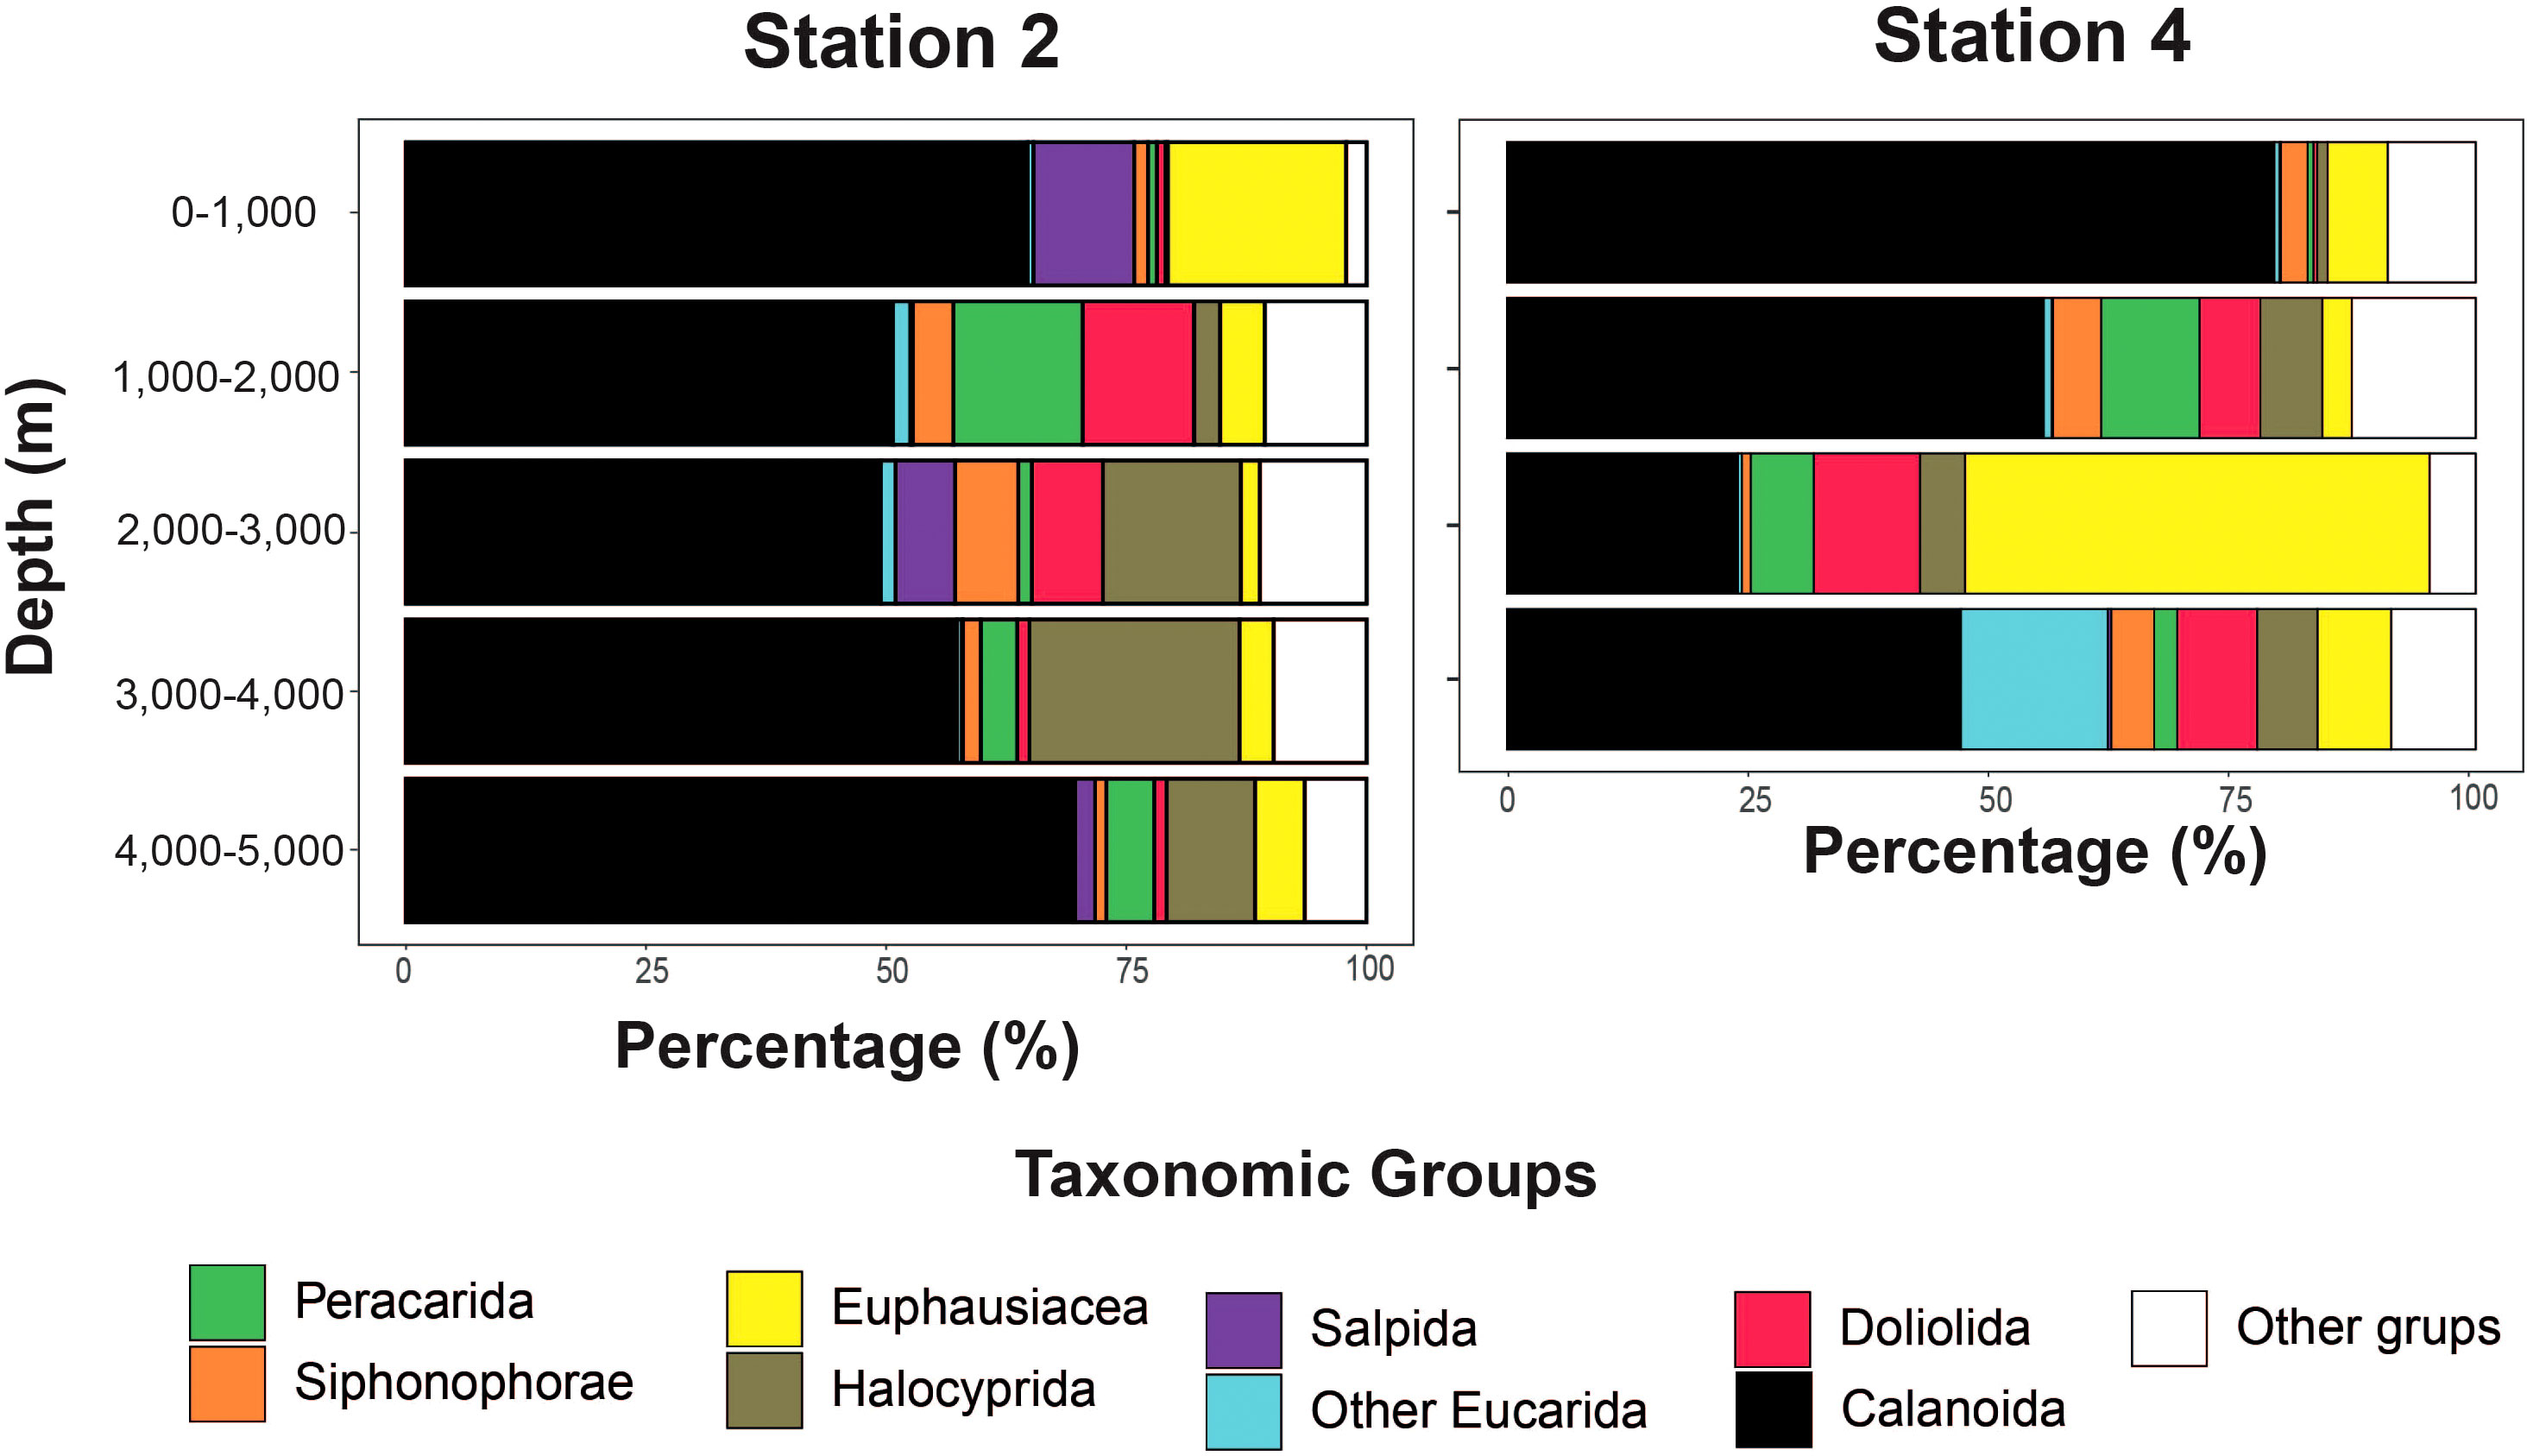
Figure 4. Relative frequency of the most abundant taxonomic groups (>2%) with depth for the two sampling sites, determined from the 18S gene. Calanoid copepods were the most abundant taxonomic group across different strata (>50%), followed by Euphausiacea (>11%) and Halocyprida (7%).
At the species level, provided by the COI data (Figure 5), the number of species varied across groups, with Calanoida having the highest number of species (64), followed by Halocypridae (21 species), whereas fewer than ten species belonged to the remaining groups. In general, the most dominant species showed ubiquitous distribution based on both depth and station, such as Subeucalanus monachus (Calanoida), Euphausia mucronata (Euphausiacea), Erenna sirena (Siphonophorae), Lanceola sayana (Peracarida), and Bentheogennema corbariae (other Eucarida). However, within the Halocypridae group, the distribution of the predominant species Conchoecetta giesbrechti was restricted to the uppermost layer (0–1000 m) at both stations.
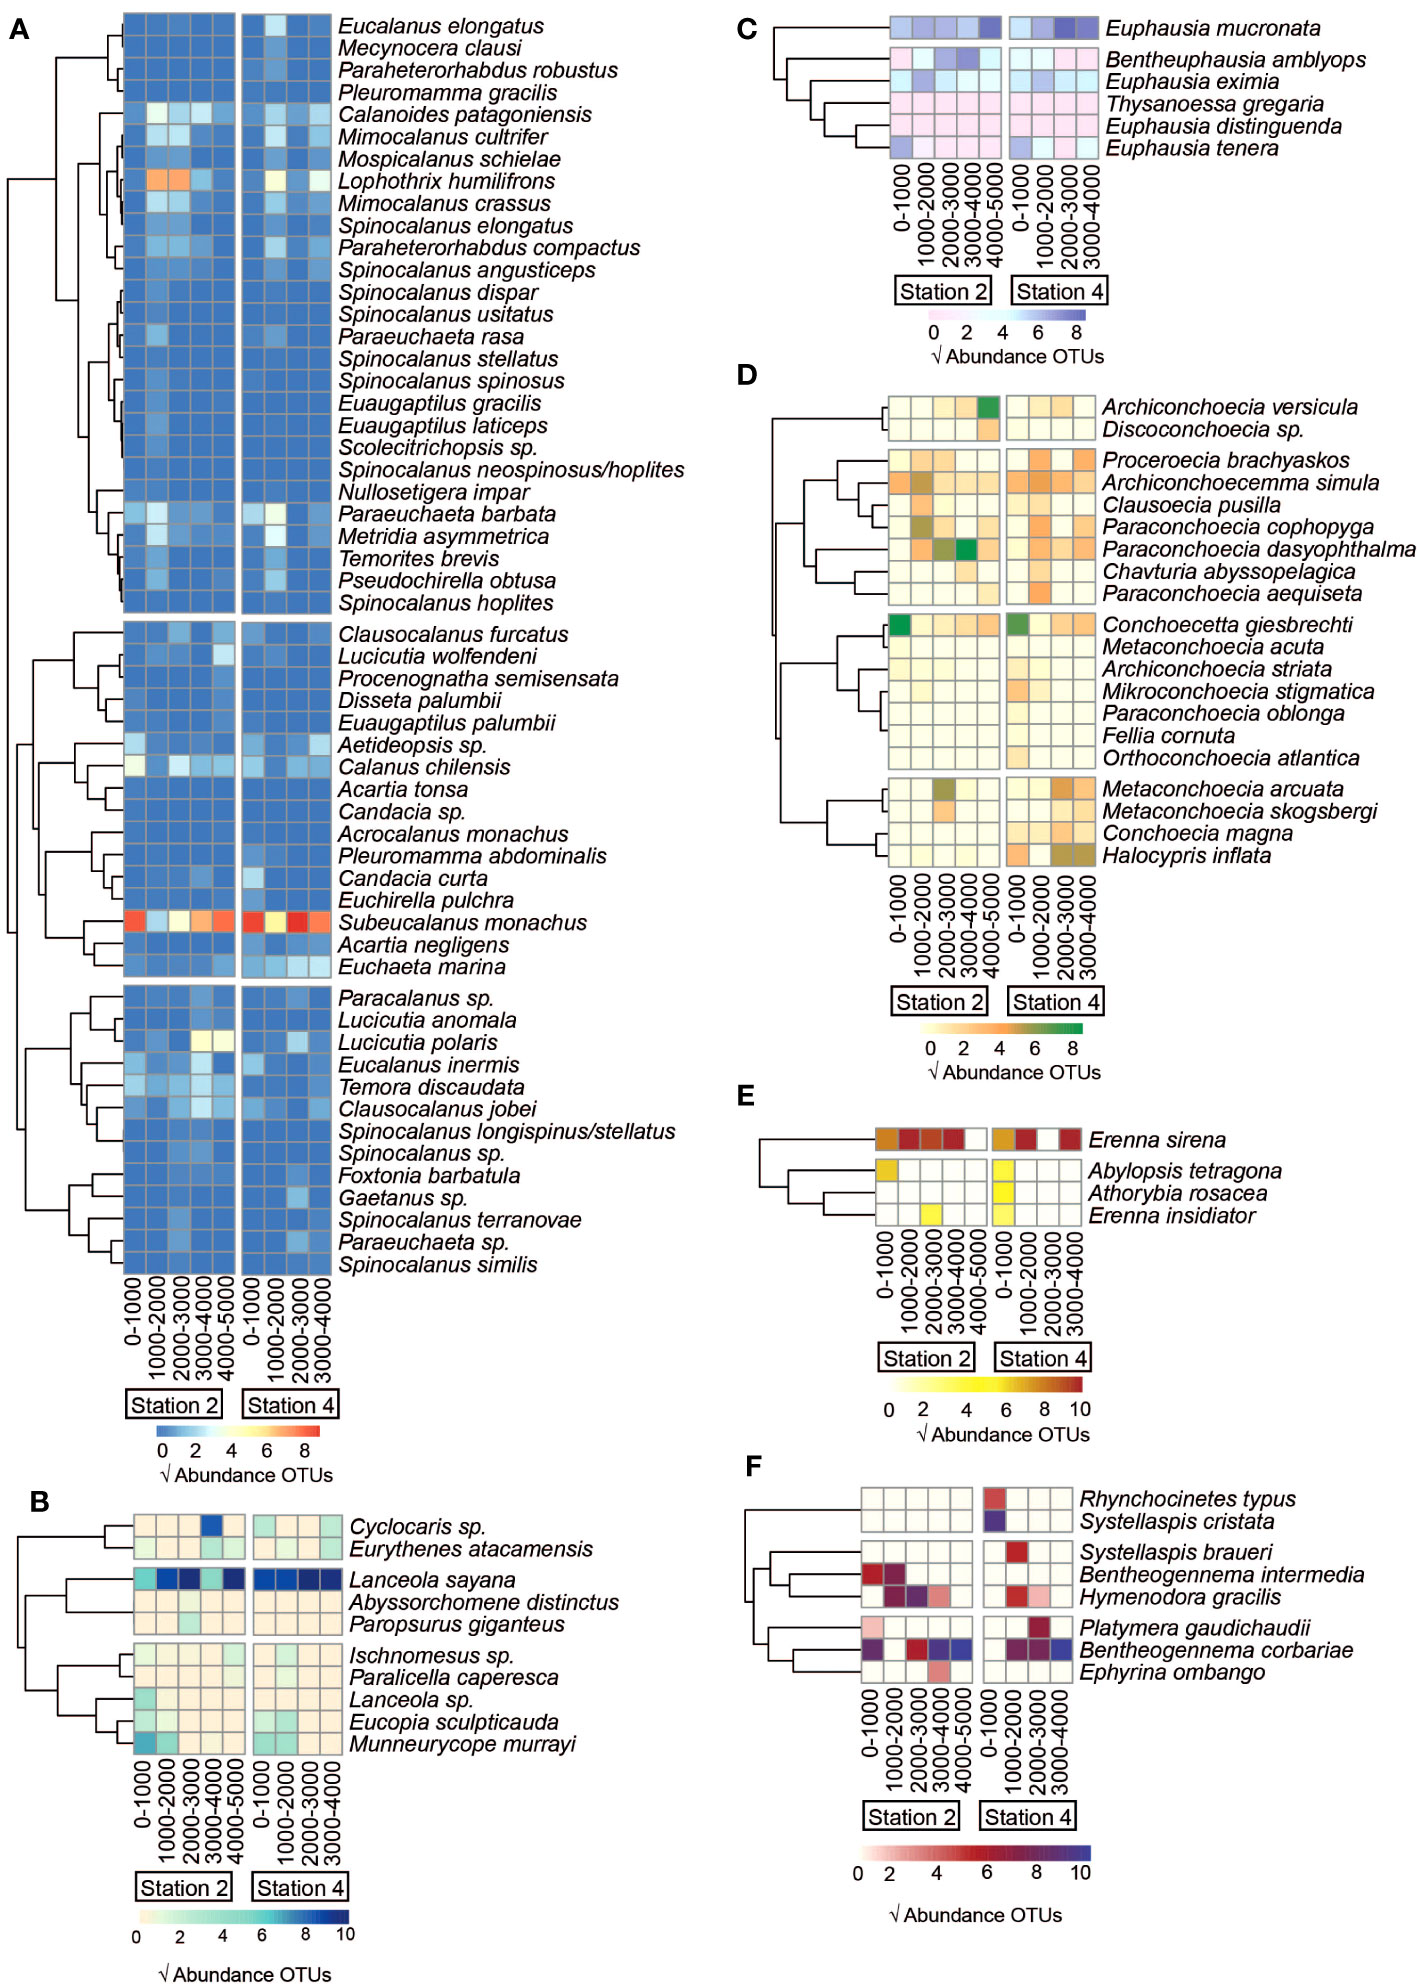
Figure 5. Variation in the species composition of the main groups identified with the COI gene at the two study stations. Sequences with an identity value > 97% obtained from the GenBank database were selected. The abundance of reads was standardized and transformed using the square root. (A) Calanoida, (B) Peracarida, (C) Euphausiacea, (D) Halocyprida, (E) Siphonophorae, (F) Other Eucarida.
The taxonomic assignment based on COI resulted in 177 OTUs that could be identified at the species level. Comparing the number of assignments with the total number of OTUs, it was concluded that there were many unknown (non-assigned) species (~ 80%) throughout the water column at both stations (Figure 6A). This pattern of unknown vs. identified species was homogeneous across the depth strata and stations. However, when considering known versus unknown species, based on the relative abundance of OTUs, the number of known species assignments made up 50% of the total number of reads (Figure 6B). The highest percentage of unknown species (>78%) was found in the 2000–3000 m (Station 2) and 1000–2000 m (Station 4) strata.
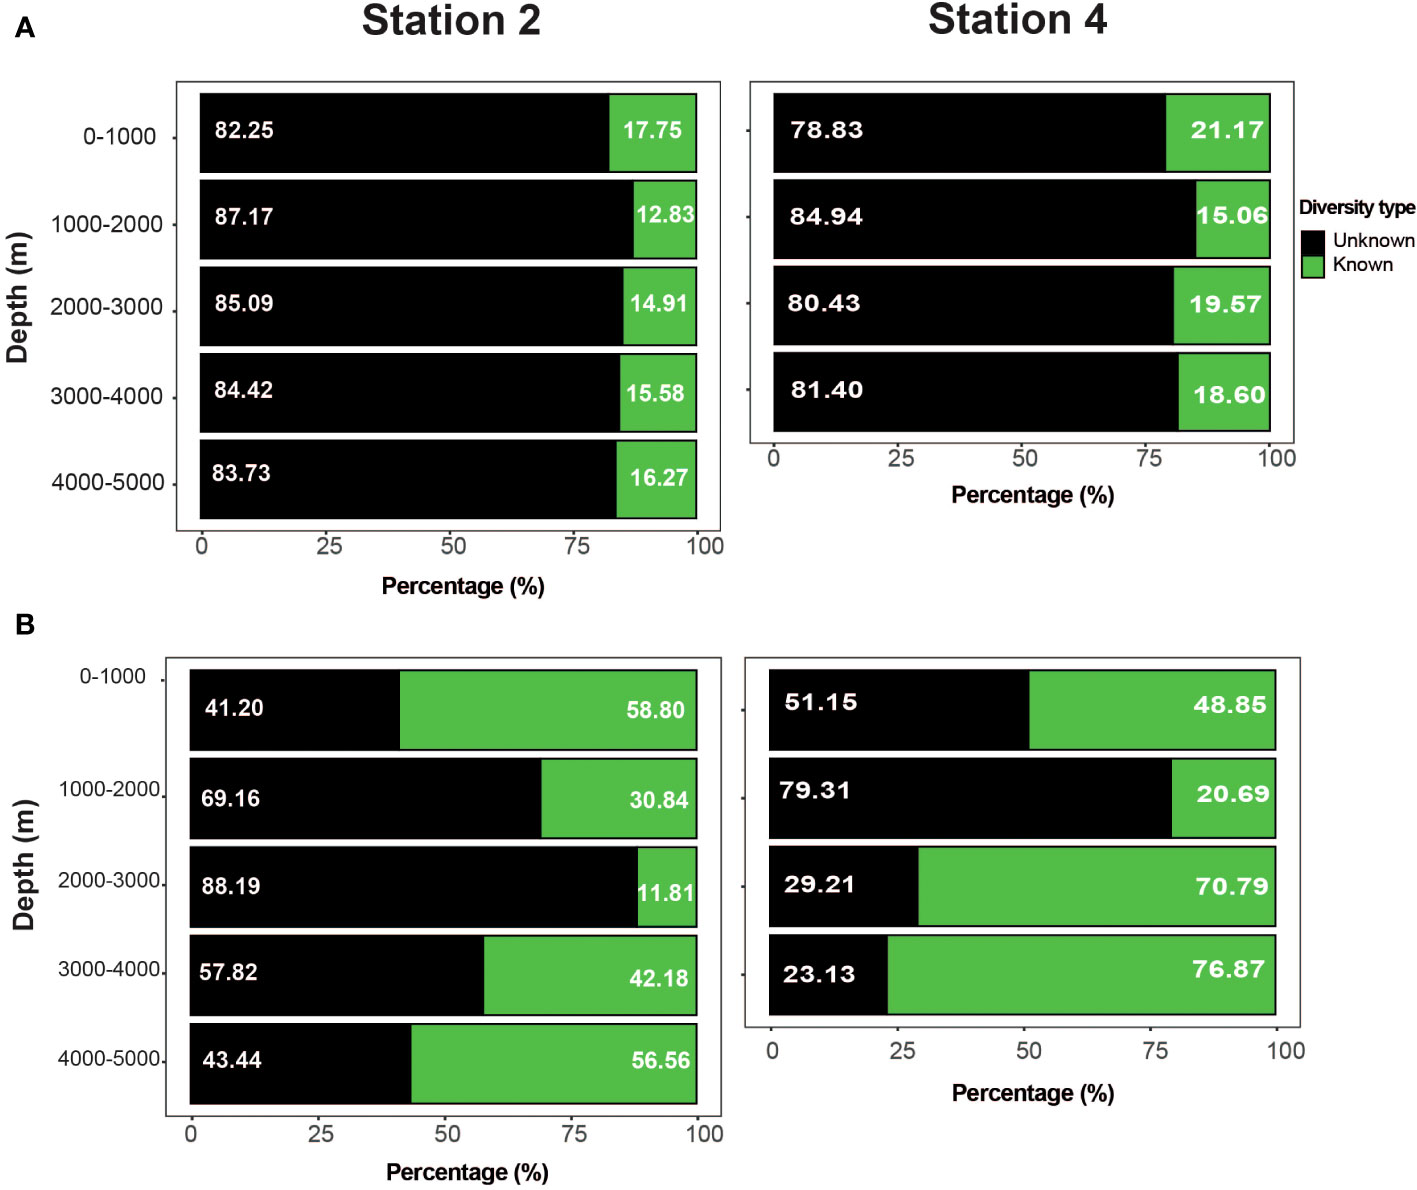
Figure 6. Unknown diversity (non-assigned) at the two study stations, calculated from the identity values obtained from the GeneBank COI database. Diversity was classified as known (green; identity > 97%) and unknown (black; identity < 97%) according to the total number (A) and relative abundance of OTUs (B).
Clustering analysis of 18S and COI genes for the entire diversity of different samples indicated that the two stations did not differ from each other, showing a similar pattern with depth, with five and four clusters for each gene, respectively (SIMPROF test; p < 0.05) (Supplementary Figure S2). ANOSIM of the clusters generated for both genes indicated significant segregation (18S: R = 0.98, p < 0.01; COI: R = 0.93, p < 0.01) (Supplementary Table S6). Temperature, oxygen concentration, and salinity were the main environmental factors that correlated with the PCoA ordination (Figure 7). A similar procedure was performed on the main taxonomic groups identified for both genes, showing two–seven clusters, although some groups indicated an absence of structuring depending on the gene analyzed (Supplementary Table S6 and Figures S3–S10). The Calanoida, Halocyprida, and Peracarida groups showed significant community structuring, concordant with both the genes (R > 0.70; p ≤ 0.01). The structure reflected mainly separate clusters for the layers 0–1000 m and 1000–2000 m, and for the rest of the bathypelagic samples (>2000 m). For the other groups, only one gene indicated structuring, and the patterns differed among them.
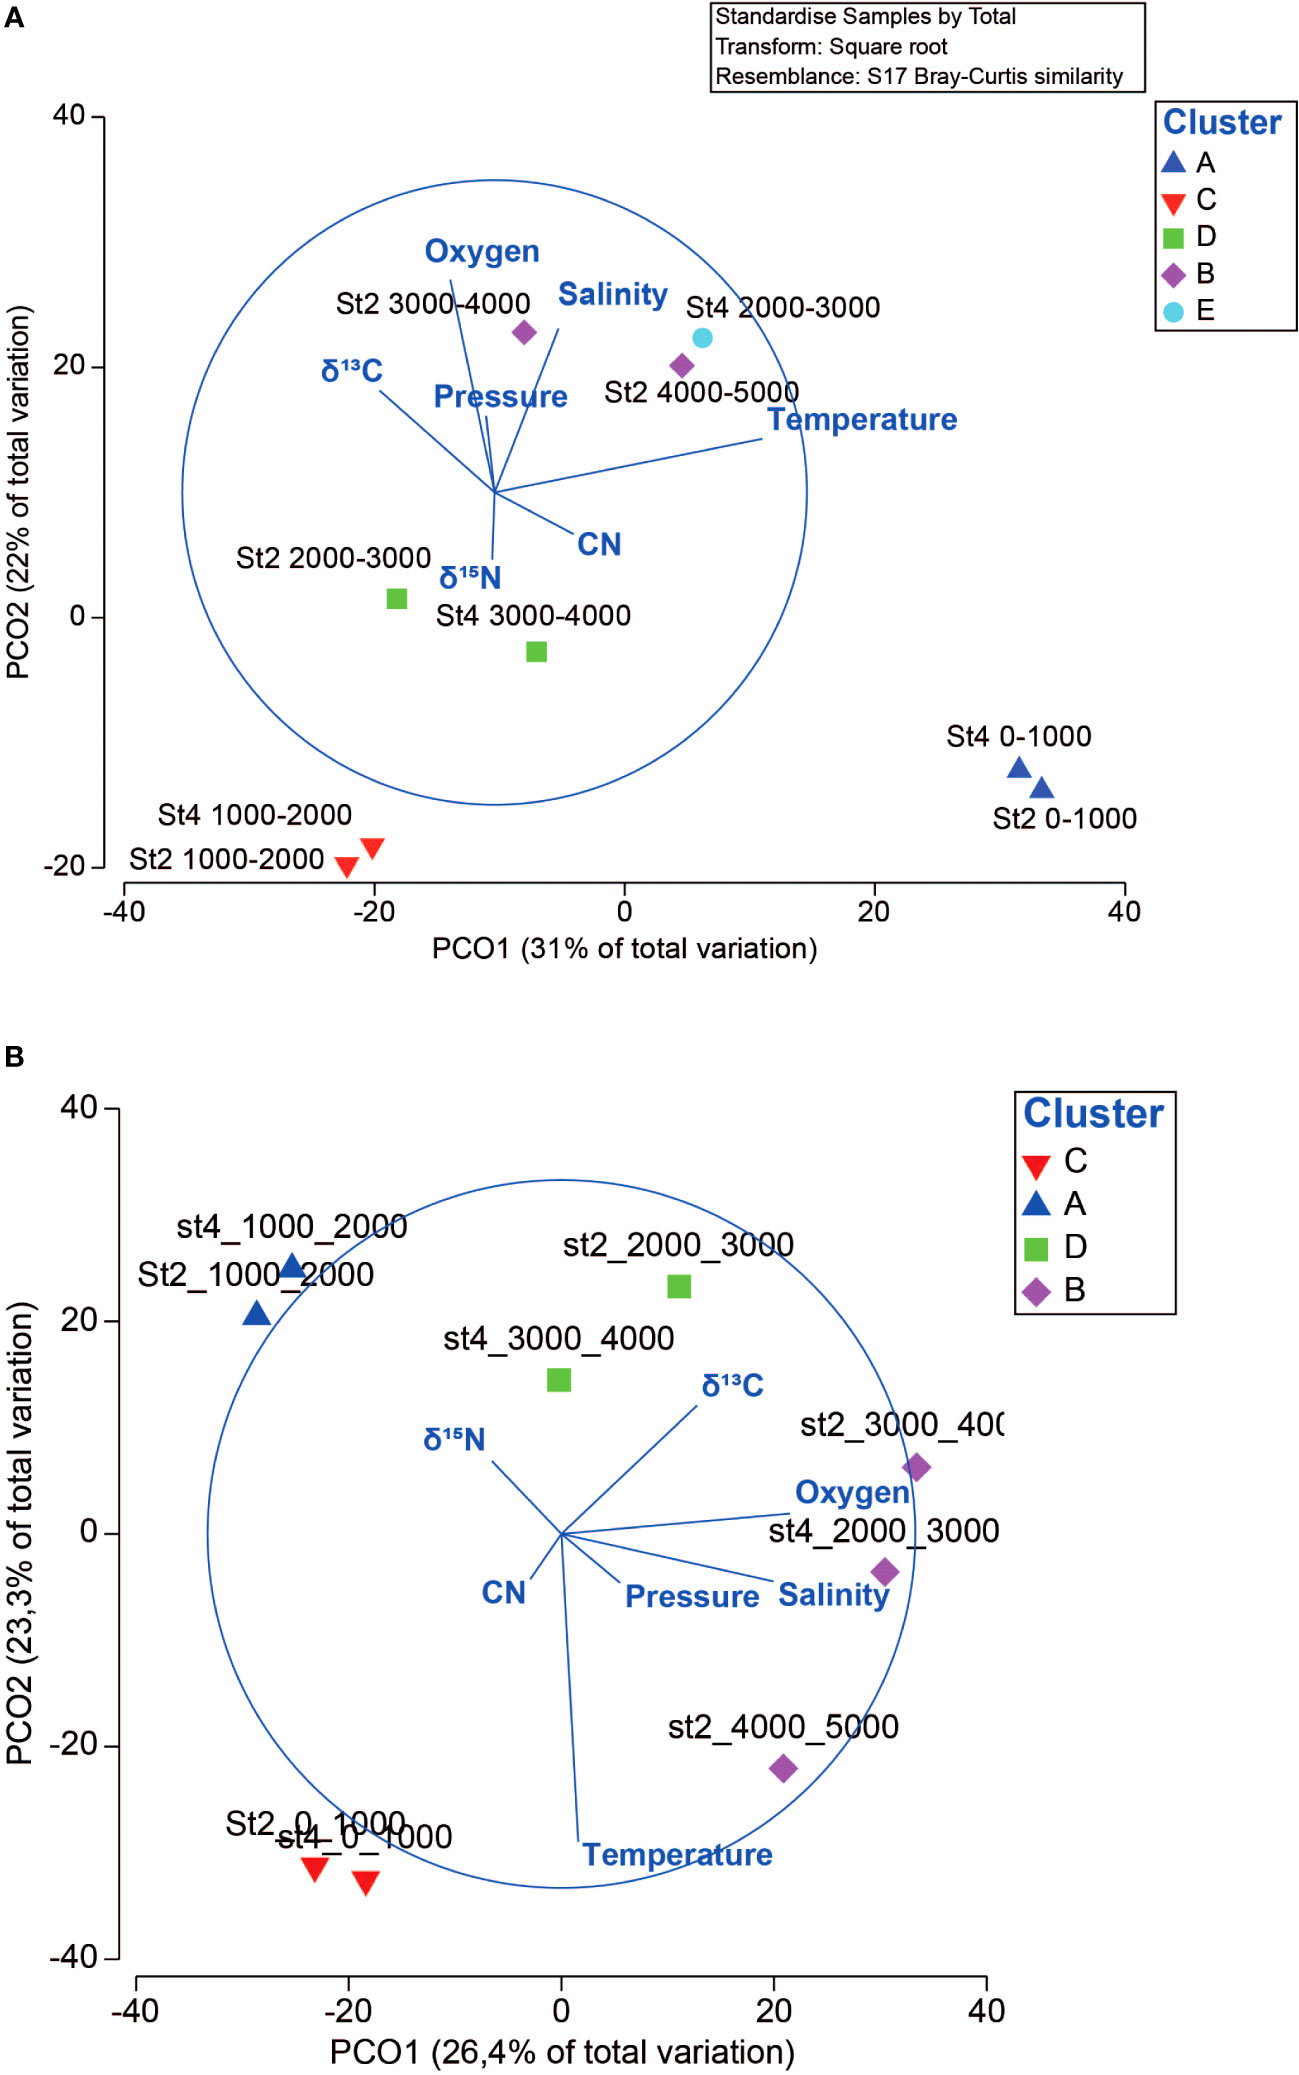
Figure 7. Principal coordinate analysis (PCoA) showing the abundance of the operational taxonomic units (OTUs) for the 18S (A) and COI (B) genes. The number of clusters was determined by a SIMPROF test (p < 0.05). The length of the arrows indicates the correlation between hydrographic variables and ordination axes. Each sampling site and its corresponding depth are indicated. The red circle highlights the area on the plane where the correlation between the analyzed environmental variables is maximized.
3.3 Environmental correlations
A strong gradient of oceanographic conditions was observed at the two study stations, particularly within the upper 500 m layer (Figure 1B). The temperature gradually decreased with depth, with an abrupt thermocline at approximately 50 m. Salinity followed a different pattern, exhibiting two abrupt decreases, one in the first 50 m and the other between 500 and 1000 m, associated with Subantarctic Water (SAAW) and Antarctic Intermediate Water (AAIW) respectively (see Supplementary Figure S11). The oxygen concentration decreased abruptly below 25 m depth, reaching hypoxic conditions (<50 µM) from 60 to 100 m and anoxic conditions from ~100 to 400 m due to the presence of Equatorial Subsurface Water (ESSW). The two sampling sites showed departures in the hydrographic profiles between stations at 500–1000 m and 2500–3500 m, where lower salinity and more oxygenated conditions were found for Station 4, associated with AAIW and Pacific Deep Water (PDW) mixtures, respectively. Regarding the sources of C and N, the quality and quantity of potential food sources, indicated by POC, PON, C/N ratios, δ13C, and δ15N, were highly variable between the stations and vertical layers (Supplementary Figure S12), revealing highly heterogeneous food conditions in the upper 1000 m compared to the layers below, the latter having more stable food availability in terms of quality and quantity, although much lower than in the upper 1000 m.
Temperature, salinity, oxygen concentration, pressure, and biogeochemical (δ15N, δ13C, C/N, POC, and PON) variables showed high and significant correlations in some cases (Spearman’s R > 0.80, p < 0.05); therefore, POC and PON were analyzed separately. Multivariate analysis between environmental variables and community structure with DistLM (Distance-based Linear Modeling) showed that the patterns differed depending on the gene and group analyzed (see Supplementary Table S7). When considering the entire community, temperature and oxygen were significantly correlated with the community structure (p < 0.05), explaining more than 23% of the total deviation in both genes. In some groups, e.g., Euphausiacea (18S) and other Eucarida (COI), C/N explained up to 71% of the community variability (p < 0.05). In contrast, Halocyprida and Peracarida showed a significant correlation with salinity (>25%; p < 0.05) for both genes, whereas Calanoida only presented a significant correlation with the 18S gene, exhibiting the best fit with temperature (deviance > 34%; p = 0.02). The biogeochemical variables POC and PON also had a significant influence on community structure, but with a lower contribution to the total variance than the uncorrelated variables (16–35%, p < 0.05), except for Euphausiacea (up to 75%) in both genes (Supplementary Table S8). Furthermore, when searching for nonlinear predictive models (GAMs) for species diversity, oxygen concentration and temperature were once again the variables with the best fit in the models (Supplementary Table S9). The entire diversity evaluated using the S and PD indices showed that temperature and oxygen concentration significantly explained up to 71.8% of their variance (p < 0.05). The main pattern was similar among the groups, although some other variables, such as salinity and pressure, showed significant relationships of >48% (p < 0.05). Meanwhile, POC and PON only influenced the diversity of specific groups, such as Euphausiacea and other Eucarida, explaining up to 52% of the variability (Supplementary Table S10).
4 Discussion and conclusions
4.1 The vertical pattern of zooplankton diversity
The high zooplankton species diversity found at mid-depths in the subtropical region of the SEP, comparable to or even higher than that found in the upper 1000 m, agrees with the pattern of maximum biodiversity at intermediate depths, as described in the benthic system (Rex, 1981). However, a large part of it was either unknown (>50%) or could not be assigned to any known species found in current genetic diversity databases. This zooplankton diversity is highly structured along the vertical axis of the water column, with a depth pattern parallel to the well-known vertical pattern that describes the benthic system (Rogers, 2015). Concerning the potential drivers controlling zooplankton diversity and its vertical pattern, water temperature and dissolved oxygen appeared to be the most important factors. The role of oxygen in shaping the zooplankton community is not surprising, considering the hydrography of the region, with an acute oxygen minimum zone in the upper 1000 m. Additionally, carbon and nitrogen sources appeared to play a role, although their influence was weaker than those of temperature and oxygen.
Variability in zooplankton diversity with depth has been documented in the tropical and subtropical oceans. Maximum diversity is observed at mid-depths for some specific taxonomic groups, although there is a historical limitation in the sampled depths (max. 3000 m) (Angel, 2003; Yamaguchi et al., 2015; Sommer et al., 2017).This pattern cannot be generalized for the whole community because the maximum diversity for each group may be observed at different depths (Kosobokova and Hopcroft, 2010; Kosobokova et al., 2011). This might be due to environmental preferences, local adaptations, and even lineage evolution (if anything, over evolutionary scales), which may influence the shape of the diversity profiles for each group (Somero, 1992; Seibel and Drazen, 2007; Van der Spoel and Heyman, 2013). For example, Calanoida and Siphonophorae show higher diversity in the intermediate layers (1000–2000 m) (Yamaguchi et al., 2015; Hirai et al., 2021; Ramírez-Flandes et al., 2022), which is possibly associated with intense predatory–driven coevolution (Mackie et al., 1988; Robison, 2004). In contrast, other Eucarida, Euphausiacea, and Halocyprida exhibit higher diversity in the upper layer, possibly due to better adaptation to primary productivity in the photic zone and a close relationship with the shallow oxygen minimum zone (OMZ) typical of this region (Antezana, 2002; Mujica et al., 2022). A few studies have assessed the vertical trend of species richness of the entire zooplankton community, using metabarcoding analysis, and revealed either a peak of diversity in the upper mesopelagic depth (200-300 m) of the North Pacific central gyre (Sommer et al., 2017), or a bimodal vertical pattern with a first peak in the upper 200 m and a second one below 1000 m found in the Indian Ocean (Cheng et al., 2022), and two other regions with a marked oxygen minimum zone in the mesopelagic depths. However, both studies reached maximum depths of 1500 m and 3000 m, respectively. In our study region, analysis of environmental DNA targeting the whole metazoan community suggested a gradual increase in diversity with depth down to 8000 m (Ramírez-Flandes et al., 2022), although this pattern was uncertain for the zooplankton group.
4.2 Community composition and gene markers
The relative abundance of species observed in this study were consistent with previous research conducted using morphological and genetic approaches, extending down to the abyssopelagic zone (Kosobokova and Hirche, 2000; Vereshchaka et al., 2017; de Puelles et al., 2019; Ramírez-Flandes et al., 2022). In the study region off northern Chile, Calanoida and Euphausiacea dominated the zooplankton communities (Heinrich, 1973; Escribano and Hidalgo, 2000; Antezana, 2002), with Subeucalanus monachus and Euphausia mucronata adapting to hypoxic conditions in the upper 500 m (Binet, 1983; Escribano et al., 2000; Antezana, 2002; Valdés et al., 2007). Halocyprida and Doliolida, which have a detritivorous or sometimes filter-feeding style, might be associated with the high productivity reported in the region that reaches the bathypelagic environment (Nigro et al., 2016; Frischer et al., 2021), playing an important role in vertical carbon transfer to deep waters globally and off the Chilean coast (Martens, 1981; Stone and Steinberg, 2016; Sutherland and Thompson, 2022). In other regions, with lower levels of productivity, such as the Indian Ocean, the zooplankton composition over the vertical axis down to 3000 m was dominated by copepods, hydrozoa, and malacostraca (Cheng et al., 2022), while in the subtropical North Pacific gyre copepods, ostracods and mollusks prevailed in the upper 1500 m (Sommer et al., 2017).
The accumulation curves obtained using the two molecular markers indicated that study sampling may have captured nearly the entire community diversity. However, the percentage of ASVs/OTUs (<62.16%) assigned to metazoans was lower than that reported in other regions using environmental DNA in the abyssopelagic zone (e.g., 74% in Laroche et al., 2020) and zooplankton nets in surface layers (e.g., 69.5% in Schroeder et al., 2021). This suggests that, although the sampling method is appropriate, there is a discrepancy in the assigned percentage due to the molecular markers used and the reference database employed to assign metazoans. Our study showed that less than half of the deep zooplankton diversity could be assigned at the species level. In coastal zones, investigations conducted in the epipelagic layer have assigned 45–80% of the OTUs obtained at the species level (Sommer et al., 2017; Schroeder et al., 2020; Singh et al., 2021). Therefore, there are no complete reference databases for coastal zones, and this situation becomes critical when examining the deep ocean (Chaudhary et al., 2016). Furthermore, identification at the species level assumes a percentage of similarity within species (e.g., 97%) that can vary between lineages, resulting in different degrees of taxonomic classification, particularly in zones where most the species are unknown (Lindeque et al., 2013; Brown et al., 2015; Hirai and Tsuda, 2015). Moreover, the absence of reference databases and different rates of evolution in deep-sea communities may reduce the taxonomic resolution in diversity studies (Pinheiro et al., 2019). This problem can be addressed in the future by generating a reference database of the main deep-sea species, in collaboration with expert taxonomists. This would allow for a faster understanding of the diversity of this environment (Wheeler, 2018; Pinheiro et al., 2019).
Recent diversity analyses have employed a combination of 18S and COI genes as biomarkers to characterize the zooplankton community structure (Cowart et al., 2015; Djurhuus et al., 2018; Stefanni et al., 2018; Zhang et al., 2018; Carroll et al., 2019). However, the results of these studies indicated a discrepancy in the level of taxonomic classification among genes, yielding up to three times higher diversity in the COI gene, coinciding with the findings of other studies (Tang et al., 2012; Clarke et al., 2017). Furthermore, the 18S V9 hypervariable region has a low resolution capability at the species level, providing information on higher taxonomic levels, such as genera or families (De Vargas et al., 2015; Djurhuus et al., 2018; Bucklin et al., 2019; Sawaya et al., 2019; Blanco-Bercial, 2020). In contrast, the COI gene has a greater taxonomic resolution for species identification, but a lower amplification success rate in taxonomically diverse groups (Hebert et al., 2003; Leray et al., 2013; Deagle et al., 2014). This indicates that there is currently no single marker capable of fully resolving the diversity in communities. However, the development of more comprehensive reference databases, standardization, and application of multiple markers can contribute to a more powerful approach, thus allowing a more general view of the deep ecosystem to be conserved in the face of environmental changes (Cristescu, 2014; Deagle et al., 2014; Bucklin et al., 2016; Clarke et al., 2017).
4.3 Environmental effects
Several studies investigating the epipelagic zone have indicated that the diversity and distribution of zooplankton can be driven by the vertical gradients of temperature and oxygen (Beaugrand et al., 2002; Richardson and Schoeman, 2004; Peterson et al., 2006; Aronés et al., 2009; Gewin, 2010; Tittensor et al., 2010; Seibel, 2011). However, in the deep sea, hydrostatic pressure and sources of organic carbon and nitrogen may be the main factors in structuring communities in the deep ocean (Danovaro et al., 2003; Jamieson et al., 2010; Tamburini et al., 2013; Ichino et al., 2015). Our data showed that, despite the significant correlations between diversity and biogeochemical variables (POC, PON, and C/N), temperature and oxygen were the main correlated variables. In the same context, it is worth noting that the highest species diversity was found in the 1000 and 2000 m layers, far below the influence of the OMZ, which is located between 200 and 500 m in this area (Ulloa et al., 2012). The OMZ is known to act as an ecological barrier to species dispersion and migration from the photic zone to the layers below (Donoso and Escribano, 2014; Wishner et al., 2020). It may then be suggested that such a barrier promotes a higher diversity than that reported for the upper layers in this region. It is also important to note that the two stations were different when comparing the peaks of diversity. In this regard, the hydrographic characteristics of the Southeast Pacific indicate that temperature and oxygen are not linearly linked to depth; rather, they differ between sampling stations owing to the spatial variability in water mass properties, as reflected by the dissolved oxygen concentration between 2500 and 3500 m. This allowed for disentanglement of the influence of depth from the environmental variables in this study. In addition, optimal ranges of environmental conditions for some species cause community distribution to vary across the water column (Laakmann et al., 2009; Kosobokova and Hopcroft, 2010), and they are not always tightly linked to an increase in depth. The case of this study robustly demonstrates this conclusion using both the entire zooplankton community and specific groups.
When interpreting the mechanisms linking diversity and environmental drivers, it must be recognized that temperature is an environmental parameter that influences the rates of development, respiration, hatching, mortality, and zooplankton distribution (Nogueira et al., 2018; Jo et al., 2019; Biard and Ohman, 2020). Oxygen concentration is a key factor influencing the growth, metabolic processes, and behavioral processes of various pelagic organisms (Ekau et al., 2010). The findings of this study suggest that these variables might modulate the community, at least in the upper 2000 m. In the deep ocean of the SEP, variable water masses, including the ESSW, AAIW, and PDW, generate a gradient across the water column (50–2000 m), showing an intense OMZ in the surface and subsurface layers and a stronger temperature gradient than that observed in the deeper layers (Morales et al., 1996; Escribano et al., 2004; Ulloa et al., 2012). Strikingly, the weak gradients in deep waters (>2000 m) might still contribute to a higher rate of allopatric specialization by generating suboptimal conditions for dispersal, thus promoting high diversity along the Chilean coast, as suggested for other regions (Wilson and Hessler, 1987; Grassle, 1989; Ekau et al., 2010). These factors acting across the water column can have different effects on the benthic system, where the characteristics of the ocean bottom (e.g., muddy, rocky, sandy) and processes, such as burial and sediment transport, play critical roles in influencing life diversification and species establishment. Nevertheless, similar vertical patterns of diversity between benthic and pelagic ecosystems suggest the existence of a common ecological process that controls species diversification in the ocean. The vertical diversity pattern observed in our study was derived from data collected from only two sampling stations, which could be considered a relatively small sample size from a statistical perspective. However, it is important to note that these sampling stations represented patterns observed in large water masses, with a substantial volume of water (> 20,000 m3) sampled by MOCNESS in each stratum. Despite these limitations, the findings of this study are unique because comparative studies conducted in other regions at similar depths are lacking.
The significant correlations between zooplankton diversity and environmental variables should be interpreted with caution, this because some sources of bias may have affected the study results. For instance, the vertical partitioning of the water column every 1000 m was based on an arbitrary design and did not necessarily reflect the actual ecological structure of zooplankton distribution across the vertical axis. However, some zooplankton species perform daily vertical migrations mostly across the upper water column, which can cause daytime-nighttime species exchange and mixing between the upper hundred meters where the environmental gradient is steepest (Sommer et al., 2017; Tutasi and Escribano, 2020). These day-night effects due to vertical migration would be, however, not significant for the comparison between layers with 1000 m spacing. An additional source of bias may have arisen from the characteristics of the sampling gear, such as the mesh size of the nets, towing speed, and opening size, which can affect the quality and quantity of samples (Skjoldal et al., 2013). For instance, larger, or smaller animals could have been under-sampled, and even some dead animals or parts of them could have been caught in the nets. However, it is reasonable to presume that the study samples adequately represented the living mesozooplankton community (0.2-2.0 mm) at each strata. Therefore, in future research pertaining to the midnight zones, it will be of utmost importance to consider these factors and compare the observed vertical patterns with those of various regions worldwide. Therefore, in future research pertaining to the midnight zones, it will be of utmost importance to consider these factors and compare the observed vertical patterns with those of various regions across the globe.
Data availability statement
The datasets presented in this study can be found in online repositories. The names of the repository/repositories and accession number(s) can be found in the article/Supplementary Material.
Ethics statement
Ethical review and approval was not required for the study on animals in accordance with the local legislation and institutional requirements.
Author contributions
RE, IF-U, and OU conducted fieldwork on the cruise. CG and RE performed experiments. CG and LB-B conducted the data analyses, and CG, LB-B, and RE equally contributed to the writing of the manuscript. OU, IF-U, and RR participated in the discussions and commented on the manuscript. RE provided grant and equipment support for this research. All authors contributed to the article and approved the submitted version.
Funding
The author(s) declare financial support was received for the research, authorship, and/or publication of this article. The ship time for FS Sonne was provided by the BMBF (Germany). The molecular analyses were funded by the Chilean Agency for Research and Development (ANID-FONDECYT 3220468 research project) and Millennium Science Initiative Project (grant ICN12_019-IMO). MOCNESS was provided by FONDEQUIP grant EQM 140029. SCOR WG157 was funded by the U.S. National Science Foundation (OCE-1840868). L.B.B. was partially supported by the US National Science Foundation under Grant OCE-1948162 and I.F.U. under the ANID-FONDECYT 11221079 Research Project.
Acknowledgments
We wish to express our deepest gratitude to the European Research Council (Hades-ERC) for providing us with an invaluable opportunity to participate in their cruise, SONNE SO261. We also extend our thanks to D. Toledo, E. Navarro, N. Ramirez, and G. Alarcón for their valuable assistance with the sampling process. We are grateful to two reviewers for their highly valuable comments to improve our work. This study contributes to the Scientific Committee on Oceanic Research (SCOR) Working Group 157, MetaZooGene: Towards a new global view of marine zooplankton biodiversity based on DNA metabarcoding and reference DNA sequence databases (https://metazoogene.org/ and https://scor-int.org/group/157/).
Conflict of interest
The authors declare that the research was conducted in the absence of any commercial or financial relationships that could be construed as a potential conflict of interest.
Publisher’s note
All claims expressed in this article are solely those of the authors and do not necessarily represent those of their affiliated organizations, or those of the publisher, the editors and the reviewers. Any product that may be evaluated in this article, or claim that may be made by its manufacturer, is not guaranteed or endorsed by the publisher.
Supplementary material
The Supplementary Material for this article can be found online at: https://www.frontiersin.org/articles/10.3389/fmars.2023.1252535/full#supplementary-material
References
Amaral-Zettler L. A., McCliment E. A., Ducklow H. W., Huse S. M. (2009). A method for studying protistan diversity using massively parallel sequencing of V9 hypervariable regions of small-subunit ribosomal RNA genes. Vol. 4. Ed. Langsley G. doi: 10.1371/journal.pone.0006372
Angel M. V. (1979). Studies on Atlantic halocyprid ostracods: their vertical distributions and community structure in the central gyre region along latitude 30°N from off Africa to Bermuda. Prog. Oceanogr. 8, 3–124. doi: 10.1016/0079-6611(79)90009-0
Angel M. V., De A., Baker C. (1982). Vertical distribution of the standing crop of plankton and micronekton at three stations in the northeast atlantic. Biol. Oceanogr. 2, 1–30. doi: 10.1080/01965581.1982.10749451
Angel M. V., Fasham M. J. R. (1975). Analysis of the vertical and geographic distribution of the abundant species of planktonic ostracods in the North-east Atlantic. J. Mar. Biol. Assoc. United Kingdom 55, 709–737. doi: 10.1017/S0025315400017379
Antezana T. (2002). Adaptive behavior of Euphausia mucronata in relation to the oxygen minimum layer of the Humboldt Current. Oceanogr. East. Pacific 2, 29–40.
Aronés K., Ayón P., Hirche H.-J., Schwamborn R. (2009). Hydrographic structure and zooplankton abundance and diversity off Paita, northern Peru (1994 to 2004)—ENSO effects, trends and changes. J. Mar. Syst. 78, 582–598. doi: 10.1016/j.jmarsys.2009.01.002
Beaugrand G., Reid P. C., Ibañez F., Lindley J. A., Edwards M. (2002). Reorganization of North Atlantic marine copepod biodiversity and climate. Science 296, 1692–1694. doi: 10.1126/science.1071329
Benson D. A., Karsch-Mizrachi I., Lipman D. J., Ostell J., Wheeler D. L. (2005). GenBank. Nucleic Acids Res. 33, D34–D38. doi: 10.1093/nar/gki063
Biard T., Ohman M. D. (2020). Vertical niche definition of test-bearing protists (Rhizaria) into the twilight zone revealed by in situ imaging. Limnol. Oceanogr. 65, 2583–2602. doi: 10.1002/lno.11472
Binet D. (1983). Zooplancton des régions côtières à upwellings saisonniers du Golfe de Guinée. Océanographie Trop. 18, 357–380.
Blanco-Bercial L. (2020). Metabarcoding analyses and seasonality of the zooplankton community at BATS. Front. Mar. Sci. 173. doi: 10.3389/fmars.2020.00173
Brown E. A., Chain F. J. J., Crease T. J., Macisaac H. J., Cristescu M. E. (2015). Divergence thresholds and divergent biodiversity estimates: can metabarcoding reliably describe zooplankton communities? Ecol. Evol. 5, 2234. doi: 10.1002/ece3.1485
Bucklin A., Lindeque P. K., Rodriguez-Ezpeleta N., Albaina A., Lehtiniemi M. (2016). Metabarcoding of marine zooplankton: prospects, progress and pitfalls. J. Plankton Res. 38, 393–400. doi: 10.1093/plankt/fbw023
Bucklin A., Peijnenburg K. T. C. A., Kosobokova K. N., O’Brien T. D., Blanco-Bercial L., Cornils A., et al. (2021). Towards a global reference database of COI barcodes for marine zooplankton. Mar. Biol. 168, 1–26. doi: 10.1007/s00227-021-03887-y
Bucklin A., Steinke D., Blanco-Bercial L. (2010). DNA barcoding of marine metazoa. Annu. Rev. 3, 471–508. doi: 10.1146/annurev-marine-120308-080950
Bucklin A., Steinke D., Blanco-Bercial L. (2011). DNA barcoding of marine metazoa. Ann. Rev. Mar. Sci. 3, 471–508. doi: 10.1146/annurev-marine-120308-080950
Bucklin A., Yeh H. D., Questel J. M., Richardson D. E., Reese B., Copley N. J., et al. (2019). Time-series metabarcoding analysis of zooplankton diversity of the NW Atlantic continental shelf. ICES J. Mar. Sci. 76, 1162–1176. doi: 10.1093/icesjms/fsz021
Carroll E. L., Gallego R., Sewell M. A., Zeldis J., Ranjard L., Ross H. A., et al. (2019). Multi-locus DNA metabarcoding of zooplankton communities and scat reveal trophic interactions of a generalist predator. Sci. Rep. 9, 1–14. doi: 10.1038/s41598-018-36478-x
Chaudhary C., Saeedi H., Costello M. J. (2016). Bimodality of latitudinal gradients in marine species richness. Trends Ecol. Evol. 31, 670–676. doi: 10.1016/j.tree.2016.06.001
Cheng X. W., Zhang L. L., Gao F., Tan Y. H., Xiang R., Qiu Z. Y., et al. (2022). Biodiversity of zooplankton in 0–3000 m waters from the eastern Indian Ocean in spring 2019 based on metabarcoding. Water Biol. Secur. 1, 100005. doi: 10.1016/j.watbs.2022.100005
Childress J. J., Thuesen E. V. (1993). Effects of hydrostatic pressure on metabolic rates of six species of deep-sea gelatinous zooplankton. Limnol. Oceanogr. 38, 665–670. doi: 10.4319/lo.1993.38.3.0665
Clarke L. J., Beard J. M., Swadling K. M., Deagle B. E. (2017). Effect of marker choice and thermal cycling protocol on zooplankton DNA metabarcoding studies. Ecol. Evol. 7, 873–883. doi: 10.1002/ece3.2667
Clarke K. R., Gorley R. N. (2015). Getting started with PRIMER v7. Prim. Plymouth Plymouth Mar. Lab. 7, 20.
Corinaldesi C. (2015). New perspectives in benthic deep-sea microbial ecology. Front. Mar. Sci. 2, 17. doi: 10.3389/fmars.2015.00017
Costello M. J., Chaudhary C. (2017). Marine biodiversity, biogeography, deep-sea gradients, and conservation. Curr. Biol. 27, R511–R527. doi: 10.1016/j.cub.2017.06.015
Cowart D. A., Pinheiro M., Mouchel O., Maguer M., Grall J., Miné J., et al. (2015). Metabarcoding is powerful yet still blind: a comparative analysis of morphological and molecular surveys of seagrass communities. PloS One 10, e0117562. doi: 10.1371/journal.pone.0117562
Creer S., Deiner K., Frey S., Porazinska D., Taberlet P., Thomas W. K., et al. (2016). The ecologist’s field guide to sequence-based identification of biodiversity. Methods Ecol. Evol. 7, 1008–1018. doi: 10.1111/2041-210X.12574
Cristescu M. E. (2014). From barcoding single individuals to metabarcoding biological communities: towards an integrative approach to the study of global biodiversity. Trends Ecol. Evol. 29, 566–571. doi: 10.1016/j.tree.2014.08.001
Danovaro R., Della Croce N., Dell’Anno A., Pusceddu A. (2003). A depocenter of organic matter at 7800 m depth in the SE Pacific Ocean. Deep. Res. Part I Oceanogr. Res. Pap. 50, 1411–1420. doi: 10.1016/j.dsr.2003.07.001
Deagle B. E., Jarman S. N., Coissac E., Pompanon F., Taberlet P. (2014). DNA metabarcoding and the cytochrome c oxidase subunit I marker: not a perfect match. Biol. Lett. 10. doi: 10.1098/rsbl.2014.0562
de Puelles M. L. F., Gazá M., Cabanellas-Reboredo M., Santandreu M del M., Irigoien X., González-Gordillo J. I., et al. (2019). Zooplankton abundance and diversity in the tropical and subtropical ocean. Divers. 11, 203. doi: 10.3390/d11110203
De Vargas C., Audic S., Henry N., Decelle J., Mahé F., Logares R., et al. (2015). Eukaryotic plankton diversity in the sunlit ocean. Science 348. doi: 10.1126/science.1261605
Djurhuus A., Pitz K., Sawaya N. A., Rojas-Márquez J., Michaud B., Montes E., et al. (2018). Evaluation of marine zooplankton community structure through environmental DNA metabarcoding. Limnol. Oceanogr. Methods 16, 209–221. doi: 10.1002/lom3.10237
Donoso K., Escribano R. (2014). Mass-specific respiration of mesozooplankton and its role in the maintenance of an oxygen-deficient ecological barrier (BEDOX) in the upwelling zone off Chile upon presence of a shallow oxygen minimum zone. J. Mar. Syst. 129, 166–177. doi: 10.1016/j.jmarsys.2013.05.011
Edgar R. C., Flyvbjerg H. (2015). Error filtering, pair assembly and error correction for next-generation sequencing reads. Bioinformatics 31, 3476–3482. doi: 10.1093/bioinformatics/btv401
Ekau W., Auel H., P̈ortner H. O., Gilbert D. (2010). Impacts of hypoxia on the structure and processes in pelagic communities (zooplankton, macro-invertebrates and fish). Biogeosciences 7, 1669–1699. doi: 10.5194/bg-7-1669-2010
Escribano R., Daneri G., Farías L., Gallardo V. A., González H. E., Gutiérrez D., et al. (2004). Biological and chemical consequences of the 1997–1998 El Niño in the Chilean coastal upwelling system: a synthesis. Deep Sea Res. Part II Top. Stud. Oceanogr. 51, 2389–2411. doi: 10.1016/j.dsr2.2004.08.011
Escribano R., Hidalgo P. (2000). Spatial distribution of copepods in the north of the Humboldt Current region off Chile during coastal upwelling. J. Mar. Biol. Assoc. United Kingdom 80, 283–290. doi: 10.1017/S002531549900185X
Escribano R., Marin V. H., Irribarren C. (2000). Distribution of Euphausia mucronata at the upwelling area of Peninsula Mejillones, northern Chile: The influence of the oxygen minimum layer. Sci. Mar. 64, 69–77. doi: 10.3989/scimar.2000.64n169
Faith D. P. (1992). Conservation evaluation and phylogenetic diversity. Biol. Conserv. 61, 1–10. doi: 10.1016/0006-3207(92)91201-3
Fernández-Urruzola I., Ulloa O., Glud R. N., Pinkerton M. H., Schneider W., Wenzhöfer F., et al. (2021). Plankton respiration in the Atacama Trench region: Implications for particulate organic carbon flux into the hadal realm. Limnol. Oceanogr. 66. doi: 10.1002/lno.11866
Frischer M. E., Lamboley L. M., Walters T. L., Brandes J. A., Arneson E., Lacy L. E., et al. (2021). Selective feeding and linkages to the microbial food web by the doliolid Dolioletta gegenbauri. Limnol. Oceanogr. 66, 1993–2010. doi: 10.1002/lno.11740
Frøslev T. G., Kjøller R., Bruun H. H., Ejrnæs R., Brunbjerg A. K., Pietroni C., et al. (2017). Algorithm for post-clustering curation of DNA amplicon data yields reliable biodiversity estimates. Nat. Commun. 8, 1–11. doi: 10.1038/s41467-017-01312-x
Geller J., Meyer C., Parker M., Hawk H. (2013). Redesign of PCR primers for mitochondrial cytochrome c oxidase subunit I for marine invertebrates and application in all-taxa biotic surveys. Mol. Ecol. Resour. 13, 851–861. doi: 10.1111/1755-0998.12138
González C. E., Bode A., Fernández-Urruzola I., Hidalgo P., Oerder V., Escribano R. (2023). The lateral transport of zooplankton explains trophic and taxonomic similarities over the zonal gradient of central Chile. J. Mar. Syst. 238, 103840. doi: 10.1016/j.jmarsys.2022.103840
González C. E., Goetze E., Escribano R., Ulloa O., Victoriano P. (2020a). Genetic diversity and novel lineages in the cosmopolitan copepod Pleuromamma abdominalis in the Southeast Pacific. Sci. Rep. 10, 1–15. doi: 10.1038/s41598-019-56935-5
González C. E., Medellín-Mora J., Escribano R. (2020b). Environmental gradients and spatial patterns of calanoid copepods in the southeast pacific. Front. Ecol. Evol. 0, 422. doi: 10.3389/fevo.2020.554409
Grassle J. F. (1989). Species diversity in deep-sea communities. Trends Ecol. Evol. 4, 12–15. doi: 10.1016/0169-5347(89)90007-4
Hebert P. D. N., Cywinska A., Ball S. L., Dewaard J. R. (2003). Biological identifications through DNA barcodes. Proc. R. Soc London. Ser. B Biol. Sci. 270, 313–321. doi: 10.1098/rspb.2002.2218
Heinrich A. K. (1973). Horizontal distribution of copepods in the Peru current region. Oceanology 13, 97–103.
Hirai J., Tsuda A. (2015). Metagenetic community analysis of epipelagic planktonic copepods in the tropical and subtropical Pacific. Mar. Ecol. Prog. Ser. 534, 65–78. doi: 10.3354/meps11404
Hirai J., Yamazaki K., Hidaka K., Nagai S., Shimizu Y., Ichikawa T. (2021). Characterization of diversity and community structure of small planktonic copepods in the Kuroshio region off Japan using a metabarcoding approach. Mar. Ecol. Prog. Ser. 657, 25–41. doi: 10.3354/meps13539
Hsieh T. C., Ma K. H., Chao A. (2016). iNEXT: an R package for rarefaction and extrapolation of species diversity (Hill numbers). Methods Ecol. Evol. 7, 1451–1456. doi: 10.1111/2041-210X.12613
Ichino M. C., Clark M. R., Drazen J. C., Jamieson A., Jones D. O. B., Martin A. P., et al. (2015). The distribution of benthic biomass in hadal trenches: A modeling approach to investigate the effect of vertical and lateral organic matter transport to the seafloor. Deep Sea Res. Part I Oceanogr. Res. Pap. 100, 21–33. doi: 10.1016/j.dsr.2015.01.010
Illumina I. (2015). 16S metagenomic sequencing library preparation, part# 15044223 Rev. B 1213, 1214.
Jamieson A. J., Fujii T., Mayor D. J., Solan M., Priede I. G. (2010). Hadal trenches: the ecology of the deepest places on Earth. Trends Ecol. Evol. 25, 190–197. doi: 10.1016/j.tree.2009.09.009
Jo Y. J., Park W., Lee B. W., Kang C. G., Kim Y. E. (2019). Effect of temperature on egg development time and productivity of Acartia steueri and population variations of family Acartiidae in Dadaepo Beach, Busan, Korea. J. Environ. Biol. 40, 962–968. doi: 10.22438/jeb/40/5(SI)/SI-19
Kim H., Lee C. R., Lee S.k., Oh S. Y., Kim W. (2020). Biodiversity and community structure of mesozooplankton in the marine and coastal national park areas of Korea. Diversity 12, 233. doi: 10.3390/d12060233
Kosobokova K., Hirche H. J. (2000). Zooplankton distribution across the Lomonosov Ridge, Arctic Ocean: species inventory, biomass and vertical structure. Deep Sea Res. Part I Oceanogr. Res. Pap. 47, 2029–2060. doi: 10.1016/S0967-0637(00)00015-7
Kosobokova K. N., Hopcroft R. R. (2010). Diversity and vertical distribution of mesozooplankton in the Arctic’s Canada Basin. Deep Sea Res. Part II Top. Stud. Oceanogr. 57, 96–110. doi: 10.1016/j.dsr2.2009.08.009
Kosobokova K. N., Hopcroft R. R., Hirche H. J. (2011). Patterns of zooplankton diversity through the depths of the Arctic’s central basins. Mar. Biodivers. 41, 29–50. doi: 10.1007/s12526-010-0057-9
Laakmann S., Kochzius M., Auel H. (2009). Ecological niches of Arctic deep-sea copepods: Vertical partitioning, dietary preferences and different trophic levels minimize inter-specific competition. Deep Sea Res. Part I Oceanogr. Res. Pap. 56, 741–756. doi: 10.1016/j.dsr.2008.12.017
Laroche O., Kersten O., Smith C. R., Goetze E. (2020). From sea surface to seafloor: a benthic allochthonous eDNA survey for the abyssal ocean. Front. Mar. Sci. 7. doi: 10.3389/fmars.2020.00682/full
Legendre P., Gallagher E. D. (2001). Ecologically meaningful transformations for ordination of species data. Oecologia 129, 271–280. doi: 10.1007/s004420100716
Lenz P. H. (2012). The biogeography and ecology of myelin in marine copepods. J. Plankton Res. 34, 575–589. doi: 10.1093/plankt/fbs037
Leray M., Yang J. Y., Meyer C. P., Mills S. C., Agudelo N., Ranwez V., et al. (2013). A new versatile primer set targeting a short fragment of the mitochondrial COI region for metabarcoding metazoan diversity: application for characterizing coral reef fish gut contents. Front. Zool. 10, 1–14. doi: 10.1186/1742-9994-10-34
Lindeque P. K., Parry H. E., Harmer R. A., Somerfield P. J., Atkinson A. (2013). Next generation sequencing reveals the hidden diversity of zooplankton assemblages ed A ianora. PloS One 8, e81327. doi: 10.1371/journal.pone.0081327
Lindsay D. J., Hunt J. C. (2005). Biodiversity in midwater cnidarians and ctenophores: submersible-based results from deep-water bays in the Japan Sea and northwestern Pacific. J. Mar. Biol. Assoc. United Kingdom 85, 503–517. doi: 10.1017/S0025315405011434
Mackie G. O., Pugh P. R., Purcell J. E. (1988). Siphonophore biology. Adv. Mar. Biol. 24, 97–262. doi: 10.1016/S0065-2881(08)60074-7
Martens J. M. (1981). Die pelagischen Ostracoden der Expedition MarChile I (Südost-Pazifik) II: Systematik und Vorkommen (Crustacea: Ostracoda: Myodocopa). Mitt. aus dem Hambg. Zool. Museum und Inst. 76, 303–366. doi: 10.1080/01650528109360583
McIntyre A. D. (2010). Life in the world’s oceans: diversity, distribution, and abundance. Life World’s Ocean. Divers. Distrib. Abundance 1, 1–361. doi: 10.1002/9781444325508
Morales C. E., Braun M., Reyes H., Blanco J. L., Davies A. G. (1996). Anchovy larval distribution in the coastal zone off northern Chile: the effect of low dissolved oxygen concentrations and of a cold-warm sequence, (1990-95). Invest. Mar. Valparaíso 24, 77–96. doi: 10.4067/S0717-71781996002400007
Mujica A., Nava M. L., Leiva-Dietz F., Mujica A., Nava M. L., Leiva-Dietz F. (2022). Planktonic ostracods off the north-central coast of Chile. Lat. Am. J. Aquat. Res. 50, 68–77. doi: 10.3856/vol50-issue1-fulltext-2748
Nigro L. M., Angel M. V., Blachowiak-Samolyk K., Hopcroft R. R., Bucklin A. (2016). Identification, discrimination, and discovery of species of marine planktonic ostracods using DNA barcodes. PloS One 11, e0146327. doi: 10.1371/journal.pone.0146327
Nogueira N., Sumares B., Andrade C. A. P., Afonso A. (2018). The effects of temperature and photoperiod on egg hatching success, egg production and population growth of the calanoid copepod, Acartia grani (Calanoida: Acartiidae). Aquac. Res. 49, 93–103. doi: 10.1111/are.13437
Peterson W. T., Emmett R., Goericke R., Venrick E., Mantyla A., Bograd S. J., et al. (2006). The State of the California current 2005-2006: warm in the North, cool in the South. Calif. Coop. Ocean. Fish. Investig. Rep. 47, 30.
Pinheiro H. T., Moreau C. S., Daly M., Rocha L. A. (2019). Will DNA barcoding meet taxonomic needs? Science 365, 873–874. doi: 10.1126/science.aay7174
Purushothama R., Sayeswara H. A., Goudar M. A., Harishkumar K. (2011). Physicochemical profile and zooplankton community composition in Brahmana Kalasi Tank, Sagar, Karnataka, India. Ecoscan 5, 99–103.
Quast C., Pruesse E., Yilmaz P., Gerken J., Schweer T., Yarza P., et al. (2012). The SILVA ribosomal RNA gene database project: improved data processing and web-based tools. Nucleic Acids Res. 41, D590–D596. doi: 10.1093/nar/gks1219
Ramírez-Flandes S., Gonzalez C., Aldunate M., Poulain J., Wincker P., Glud R. N., et al. (2022). High genetic diversity in the pelagic deep-sea fauna of the Atacama Trench revealed by environmental DNA. bioRxiv. doi: 10.1101/2022.04.14.488404v2
R Core Team A (2020). R: A language and environment for statistical computing (Vienna, Austria: R Foundation for Statistical Computing).
Rex (1981) Community structure in the deep-sea benthos on JSTOR. Available at: https://www.jstor.org/stable/2097115.
Richardson A. J., Schoeman D. S. (2004). Climate impact on plankton ecosystems in the Northeast Atlantic. Science 305, 1609–1612. doi: 10.1126/science.1100958
Robison B. H. (2004). Deep pelagic biology. J. Exp. Mar. Bio. Ecol. 300, 253–272. doi: 10.1016/j.jembe.2004.01.012
Rogers A. D. (2015). Environmental change in the deep ocean. Annual Reviews 40, 1–38. doi: 10.1146/annurev-environ-102014-021415
Rognes T., Flouri T., Nichols B., Quince C., Mahé F. (2016). VSEARCH: a versatile open source tool for metagenomics. PeerJ 4. doi: 10.7717/peerj.2584
Sawaya N. A., Djurhuus A., Closek C. J., Hepner M., Olesin E., Visser L., et al. (2019). Assessing eukaryotic biodiversity in the Florida Keys National Marine Sanctuary through environmental DNA metabarcoding. Ecol. Evol. 9, 1029–1040. doi: 10.1002/ece3.4742
Schloss P. D., Westcott S. L., Ryabin T., Hall J. R., Hartmann M., Hollister E. B., et al. (2009). Introducing mothur: Open-source, platform-independent, community-supported software for describing and comparing microbial communities. Appl. Environ. Microbiol. 75, 7537–7541. doi: 10.1128/AEM.01541-09
Schroeder A., Pallavicini A., Edomi P., Pansera M., Camatti E. (2021). Suitability of a dual COI marker for marine zooplankton DNA metabarcoding. Mar. Environ. Res. 170, 105444. doi: 10.1016/j.marenvres.2021.105444
Schroeder A., Stanković D., Pallavicini A., Gionechetti F., Pansera M., Camatti E. (2020). DNA metabarcoding and morphological analysis - Assessment of zooplankton biodiversity in transitional waters. Mar. Environ. Res. 160. doi: 10.1016/j.marenvres.2020.104946
Seibel B. A. (2011). Critical oxygen levels and metabolic suppression in oceanic oxygen minimum zones. J. Exp. Biol. 214, 326–336. doi: 10.1242/jeb.049171
Seibel B. A., Drazen J. C. (2007). The rate of metabolism in marine animals: environmental constraints, ecological demands and energetic opportunities. Philos. Trans. R. Soc B Biol. Sci. 362, 2061–2078. doi: 10.1098/rstb.2007.2101
Singh S. P., Groeneveld J. C., Huggett J., Naidoo D., Cedras R., Willows-Munro S. (2021). Metabarcoding of marine zooplankton in South Africa. Afr. J. Mar. Sci. 43, 147–159. doi: 10.2989/1814232X.2021.1919759
Skjoldal H. R., Wiebe P. H., Postel L., Knutsen T., Kaartvedt S., Sameoto D. D. (2013). Intercomparison of zooplankton (net) sampling systems: Results from the ICES/GLOBEC sea-going workshop. Prog. Oceanogr. 108, 1–42. doi: 10.1016/j.pocean.2012.10.006
Somero G. N. (1992). Adaptations to high hydrostatic pressure. Annu. Rev. Physiol. 54, 557–577. doi: 10.1146/annurev.ph.54.030192.003013
Sommer S. A., Van Woudenberg L., Lenz P. H., Cepeda G., Goetze E. (2017). Vertical gradients in species richness and community composition across the twilight zone in the North Pacific Subtropical. Gyre Mol. Ecol. 26, 6136–6156. doi: 10.1111/mec.14286
Stefanni S., Stanković D., Borme D., de Olazabal A., Juretić T., Pallavicini A., et al. (2018). Multi-marker metabarcoding approach to study mesozooplankton at basin scale. Sci. Rep. 8, 1–13. doi: 10.1038/s41598-018-30157-7
Steinberg D. K., Cope J. S., Wilson S. E., Kobari T. (2008). A comparison of mesopelagic mesozooplankton community structure in the subtropical and subarctic North Pacific Ocean. Deep Sea Res. Part II Top. Stud. Oceanogr. 55, 1615–1635. doi: 10.1016/j.dsr2.2008.04.025
Stone J. P., Steinberg D. K. (2016). Salp contributions to vertical carbon flux in the Sargasso Sea. Deep Sea Res. Part I Oceanogr. Res. Pap. 113, 90–100. doi: 10.1016/j.dsr.2016.04.007
Sutherland K. R., Thompson A. W. (2022). Pelagic tunicate grazing on marine microbes revealed by integrative approaches. Limnol. Oceanogr. 67, 102–121. doi: 10.1002/lno.11979
Taberlet P., Coissac E., Pompanon F., Brochmann C., Willerslev E. (2012). Towards next-generation biodiversity assessment using DNA metabarcoding. Mol. Ecol. 21, 2045–2050. doi: 10.1111/j.1365-294X.2012.05470.x
Tamburini C., Boutrif M., Garel M., Colwell R. R., Deming J. W. (2013). Prokaryotic responses to hydrostatic pressure in the ocean – a review. Environ. Microbiol. 15, 1262–1274. doi: 10.1111/1462-2920.12084
Tang C. Q., Leasi F., Obertegger U., Kieneke A., Barraclough T. G., Fontaneto D. (2012). The widely used small subunit 18S rDNA molecule greatly underestimates true diversity in biodiversity surveys of the meiofauna. Proc. Natl. Acad. Sci. U. S. A. 109, 16208–16212. doi: 10.1073/pnas.1209160109
Tittensor D. P., Mora C., Jetz W., Lotze H. K., Ricard D., Berghe E.V., et al. (2010). Global patterns and predictors of marine biodiversity across taxa. Nature 466, 1098–1101. doi: 10.1038/nature09329
Tutasi P., Escribano R. (2020). Zooplankton diel vertical migration and downward C flux into the oxygen minimum zone in the highly productive upwelling region off northern Chile. Biogeosciences 17, 455–473. doi: 10.5194/bg-17-455-2020
Ulloa O., Canfield D. E., DeLong E. F., Letelier R. M., Stewart F. J. (2012). Microbial oceanography of anoxic oxygen minimum zones. Proc. Natl. Acad. Sci. 109, 15996–16003. doi: 10.1073/pnas.1205009109
Valdés L., López-Urrutia A., Cabal J., Alvarez-Ossorio M., Bode A., Miranda A., et al. (2007). A decade of sampling in the Bay of Biscay: What are the zooplankton time series telling us? Prog. Oceanogr. 74, 98–114. doi: 10.1016/j.pocean.2007.04.016
Van der Spoel S., Heyman R. P. (2013). A comparative atlas of zooplankton: biological patterns in the oceans (Springer Science & Business Media).
Vargas C. A., Escribano R., Poulet S. (2006). Phytoplankton food quality determines time windows for successful zooplankton reproductive pulses. Ecology 87, 2992–2999. doi: 10.1890/0012-9658%282006%2987%5B2992%3APFQDTW%5D2.0.CO%3B2
Vereshchaka A., Abyzova G., Lunina A., Musaeva E. (2017). The deep-sea zooplankton of the North, Central, and South Atlantic: Biomass, abundance, diversity. Deep Sea Res. Part II Top. Stud. Oceanogr. 137, 89–101. doi: 10.1016/j.dsr2.2016.06.017
Vinogradov M. E. (1970). Vertical distribution of the oceanic zooplankton:(Vertikal’noe Raspredelenie Okeanicheskogo Zooplanktona) (Israel Program for Scientific Translations).
Wheeler Q. (2018). Blank canvas: the case for descriptive taxonomy. Integr. Comp. Biol. 58, 1118–1121. doi: 10.1093/icb/icy067
Wilson G. D. F., Hessler R. R. (1987). Speciation in the deep sea. Annu. Rev. Ecol. Syst. 18, 185–207. doi: 10.1146/annurev.es.18.110187.001153
Wishner K. F., Seibel B., Outram D. (2020). Ocean deoxygenation and copepods: Coping with oxygen minimum zone variability. Biogeosciences 17, 2315–2339. doi: 10.5194/bg-17-2315-2020
Yamaguchi A., Matsuno K., Homma T. (2015). Spatial changes in the vertical distribution of calanoid copepods down to great depths in the north pacific. Zool. Stud. 54, 1–12. doi: 10.1186/s40555-014-0091-6
Zhang G. K., Chain F. J. J. J., Abbott C. L., Cristescu M. E. (2018). Metabarcoding using multiplexed markers increases species detection in complex zooplankton communities. Evol. Appl. 11, 1901–1914. doi: 10.1111/eva.12694
Keywords: deep-ocean, zooplankton, diversity pattern, Atacama Trench, Southeast Pacific
Citation: González CE, Blanco-Bercial L, Escribano R, Fernández-Urruzola I, Rivera R and Ulloa O (2023) Revealing zooplankton diversity in the midnight zone. Front. Mar. Sci. 10:1252535. doi: 10.3389/fmars.2023.1252535
Received: 03 July 2023; Accepted: 20 November 2023;
Published: 07 December 2023.
Edited by:
Sergio Stefanni, Zoological Station Anton Dohrn, ItalyReviewed by:
Xiaoshou Liu, Ocean University of China, ChinaAtsushi Yamaguchi, Hokkaido University, Japan
Copyright © 2023 González, Blanco-Bercial, Escribano, Fernández-Urruzola, Rivera and Ulloa. This is an open-access article distributed under the terms of the Creative Commons Attribution License (CC BY). The use, distribution or reproduction in other forums is permitted, provided the original author(s) and the copyright owner(s) are credited and that the original publication in this journal is cited, in accordance with accepted academic practice. No use, distribution or reproduction is permitted which does not comply with these terms.
*Correspondence: Rubén Escribano, cmVzY3JpYmFub0B1ZGVjLmNs