 Manon Nivière1†
 Ariane Blanchard1Oussama Jraifi1Olivier Van Canneyt1
 Ghislain Dorémus1
 Jérôme Spitz1,2Bruno Mansoux1,3
 Simone Panigada4
 Sophie Laran1*†
- 1Observatoire Pelagis, UAR 3462 CNRS - La Rochelle Université, La Rochelle, France
- 2Centre d’Etude Biologique de Chizé, UMR 7273 CNRS - La Rochelle Université, La Rochelle, France
- 3UAR 3468 (BBEES) Bases de données sur la Biodiversité, Écologie, Environnement et Sociétés, Muséum National d’Histoire naturelle – CNRS, Paris, France
- 4Tethys Research Institute, Milan, Italy
The distribution of wild animals and their monitoring over large areas raises many logistical and technical difficulties that hinder the collection of observation data. The use of Geographic Information Systems (GIS) has increased significantly in recent years. QGIS, an open-source GIS software dedicated to the processing of geospatial data, enables the development of dedicated plugins for specific workflows. The open-source PelaSIG plugin has been developed in Python for QGIS 3 to facilitate and standardise the different steps before and after distance sampling surveys. It brings together a set of tools for survey preparation, automatic data checking, visualisation and presentation of survey effort and sightings to provide an adapted workflow. This plugin is currently designed to process dedicated aerial datasets collected with the SAMMOA software during marine megafauna surveys (i.e., marine mammals, seabirds, elasmobranchs, sea turtles, etc.). Here, we first describe the different tools already available, and then, we present an application with the dataset from the aerial survey of the ACCOBAMS Survey Initiative (ASI) conducted in 2018 over the Mediterranean Sea and using a multi-target protocol.
1 Introduction
Line transect distance sampling is a widely used technique for the monitoring, mapping distribution, and estimating the density or abundance of marine megafauna. The heterogeneity of users and use cases requires the development of standardised procedures and tools to facilitate and improve the processing of these spatial datasets (Castro et al., 2013). To address these needs, the European Union has adopted the INSPIRE Directive (Infrastructure for Spatial Information in the European Community—2007/2/EC). The aim of this Directive is to establish a geographic information infrastructure to promote environmental protection. To this end, it requires public authorities to publish and share their geographical environmental data.
The adoption of the INSPIRE Directive reinforces the role that Geographical Information Systems (GIS) and spatial data can play in making decisions relevant to species conservation (Del Campo, 2012). In particular, “GIS software”, which refers to software for the creation, management, analysis, and visualisation of geospatial data (Steiniger and Weibel, 2010), can be enhanced with dedicated ad hoc plugins. Plugins are extensions that allow users to add any functionality that they need without modifying the source code of the GIS software (Sela et al., 2019). They provide an opportunity to automate tasks, as facilitating workflows has become a necessary process to manage the large amounts of data collected by saving significant amounts of time. Plugins can also support multi-user workflows by standardising data and analysis methods (Palomino et al., 2017).
Aerial surveys have been carried out by the Observatoire Pelagis (UAR 3462, La Rochelle University—CNRS) since the early 2000s. Since 2008, a multi-target protocol has been implemented in several large aerial surveys (e.g., Mannocci et al., 2013; Lambert et al., 2017; Pettex et al., 2017; Laran et al., 2017a; Laran et al., 2024). With the technical support of the data processing office, Code Lutin, a dedicated open source software has been developed to collect data during aerial surveys. This includes an automatic GPS connection and an audio recording system in order to fill in complementary information missed during the flight during the post-validation process (SAMMOA, 2019). In order to optimise and standardise the processing of these datasets, SAMMOA has been used for aerial surveys conducted by Pelagis since 2013. More recently, SAMMOA has been used for large European aerial surveys of marine mammals or marine megafauna [e.g., ASI (Panigada et al., 2023), ObSERVE II, and SCANS IV (Gilles et al., 2023)] and occasionally for ship surveys (but not well adapted). The use of this software improves data exchange and provides an opportunity to standardise analysis method through the use of geospatial tools, to check, map, and report survey data. Therefore, the workflow steps were designed in a dedicated plugin to prepare a planned survey design for SAMMOA, then return from the survey, check the data with automatic quality control before exploration, and map or prepare the dataset for further spatial analysis, including export as Basic Data Exchange. All the geospatial tools to carry out these different steps have been pooled in a QGIS 3 (Open Source Geospatial Foundation Project, http://qgis.org) plugin, called PelaSIG. Currently consisting of nine modules, the PelaSIG plugin aims to complete the process of standardising the representation of marine megafauna monitoring data. The aim of this paper is to detail the entire processing chain of PelaSIG and to illustrate its use with a case study, the aerial survey dataset of the ACCOBAMS Survey Initiative (ASI) conducted in the Mediterranean Sea in summer 2018 to assess the distribution of cetaceans, seabirds, and other marine megafauna species and the abundance of key cetacean species (see Cañadas et al., 2023; Panigada et al., 2023).
2 Plugin description
2.1 Required input
Data collected with SAMMOA during a survey are exported to three different files: an observation file containing all the collected observations and associated parameters; an effort file containing all the effort points, such as the start and end of each transect, the location of each change in associated parameters according to the protocol; and finally, a GPS file with positions automatically recorded at regular intervals, depending on the initial settings in SAMMOA.
PelaSIG has been designed to process the output files directly after data collection on SAMMOA, using effort and observation shapefiles. The use of other formats (e.g., SeaScribe, www.briwildlife.org/seascribe/) requires prior transformation.
2.2 Environment of development/software architecture
PelaSIG is integrated with QGIS software, a popular open-source GIS that runs on various operating systems including Linux, Mac OSX, Windows, and Android. Thanks to its large community of developers and a robust Python plugin framework, this software can be easily extended with external plugins. The graphical user interface has been built using Qt Designer (https://doc.qt.io/), and the associated functions have been written in Python 3.7. PelaSIG is now compatible with QGIS version 3 (3.16 up to 3.28 checked).
2.3 Plugin’s workflow
The PelaSIG plugin consists of nine modules (Figure 1). The modular structure of the plugin allows the operator to use each tool independently. 1) A comprehensive manual of the plugin is available through the first informative module of the toolbar. 2) The second tool is dedicated to the preparation of an aerial survey, using a shapefile of both the strata and the planned design of the transects (such as those produced by Distance software; Thomas et al., 2010); files are generated in the format required by the SAMMOA software to prepare a survey. 3) After the flights, the data are exported from SAMMOA to proceed to the quality control of the dataset, dedicated to the specific multi-target protocol used by the Observatoire Pelagis. 4) The following tool is then used to linearise the effort between points and associated sightings, either directly from the SAMMOA shapefiles export or from an export of a dedicated Postgres SQL database. This step allows the files to be prepared in the required format for the planned subsequent analysis (e.g., analysis and mapping tools of pelaSIG, R-Pelaverse (Genu and Authier, 2020), Distance with R packages or software, …). 5) The next module allows to cut this linearised effort in different segments, choosing the length, and then export as line centroids, and again with sightings associated to these new effort segments by an index to allow them to be matched. 6) The sixth tool produces several tables of descriptive statistics on the effort and observation files. 7) The next tool provides the ability to create different categories of maps and to export them as a shapefile or image according to a predefined layout. 8) Once the data have been validated, the shapefiles can be saved or stored directly in a PostgreSQL database using the next tool. 9) The last tool prepares the data for sharing in a lightweight format.
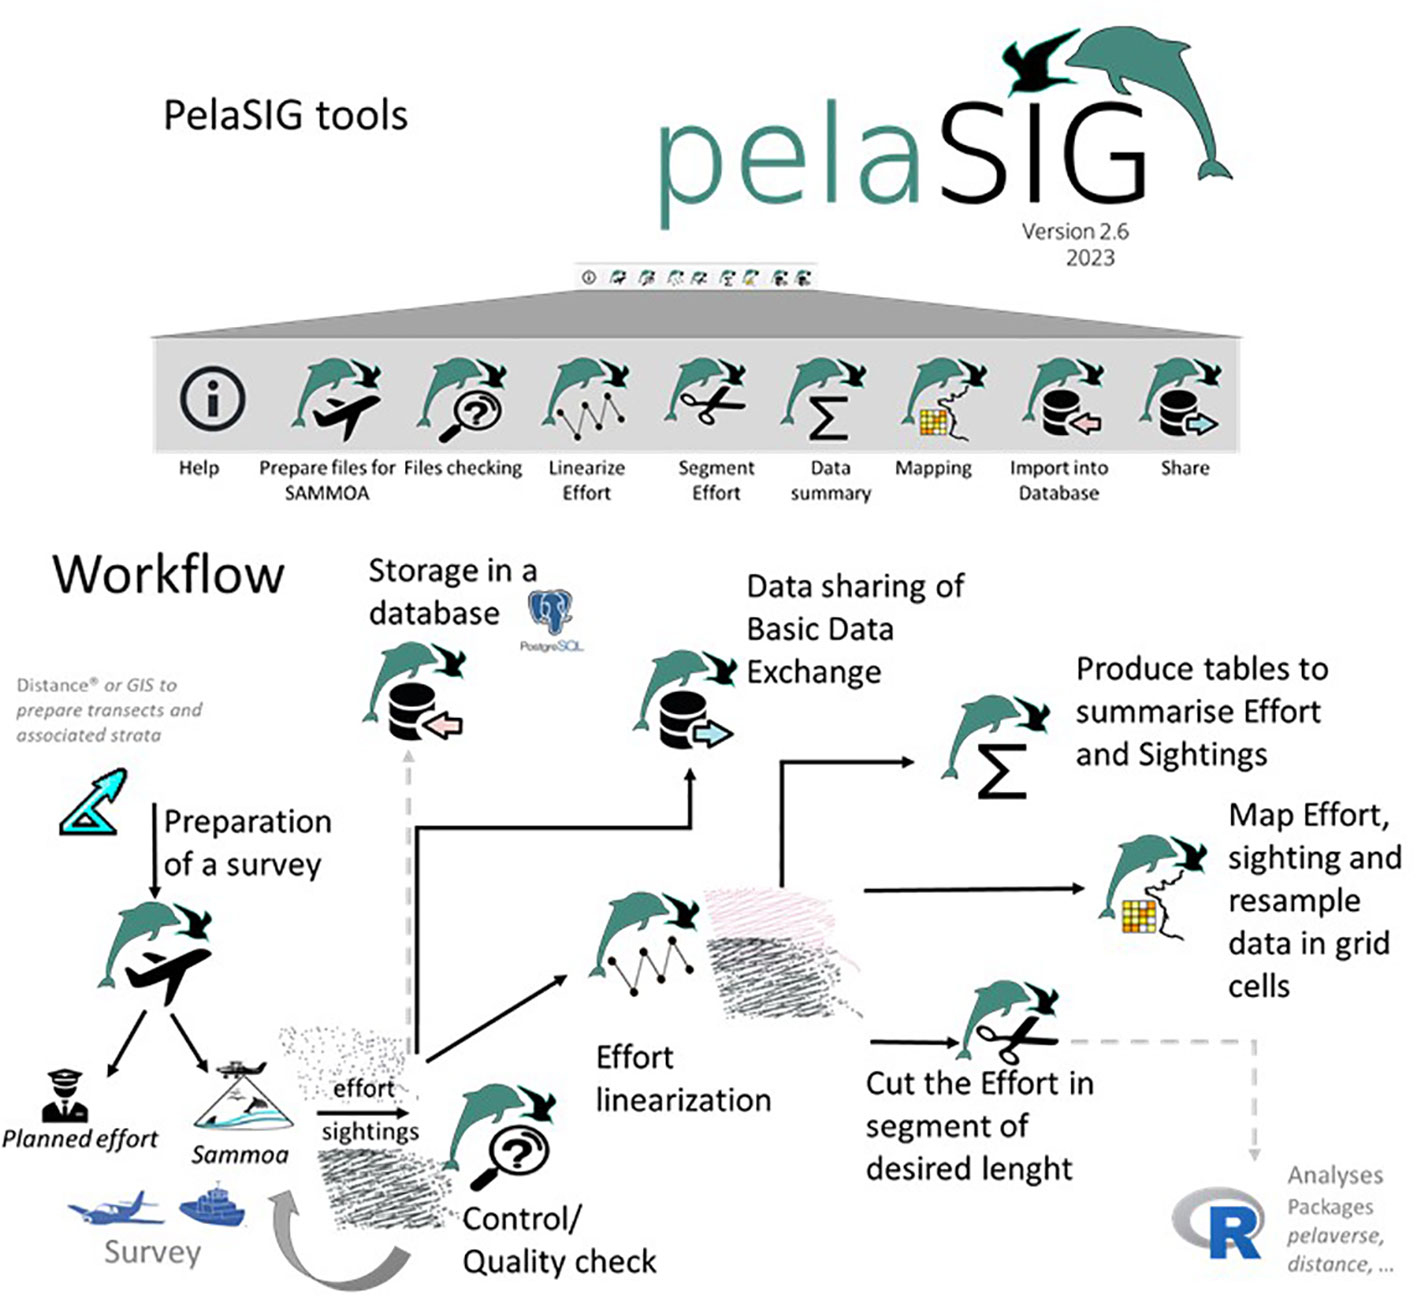
Figure 1 Tools visualization under QGIS project and Work flow.
2.3.1 User manual
Developed using the Sphinx Python library, the user manual is available online from the plugin’s first module (Help) on the left (Figure 1). The installation and activation of the plugin is explained in details, as in the user manual for each module (https://www.observatoire-pelagis.cnrs.fr/tools/pelasig/).
2.3.2 Survey planification and preparation for Sammoa software
This module is part of the survey preparation phase. The block survey (or multiple strata) and transects are designed in advance using Distance software (Thomas et al., 2010) or other tools. Once the transect shapefiles (as polylines) and associated strata (as a single or multiple polygon shapefiles) have been designed, they can be automatically prepared for SAMMOA using the Prepare files for SAMMOA tool. The transect shapefile needs to contain a linkID field and optionally the transect and plan (this later to distinguish multiple design runs for example), while the strata shapefile needs only the name field. This tool results in two shapefiles prepared for SAMMOA and additionally generates in kml, and gpx converted files, as a csv table including the location of the start and end points of each transect and the length in nautical miles (Figure 2) in order to facilitate survey implementation with pilots and authorities.
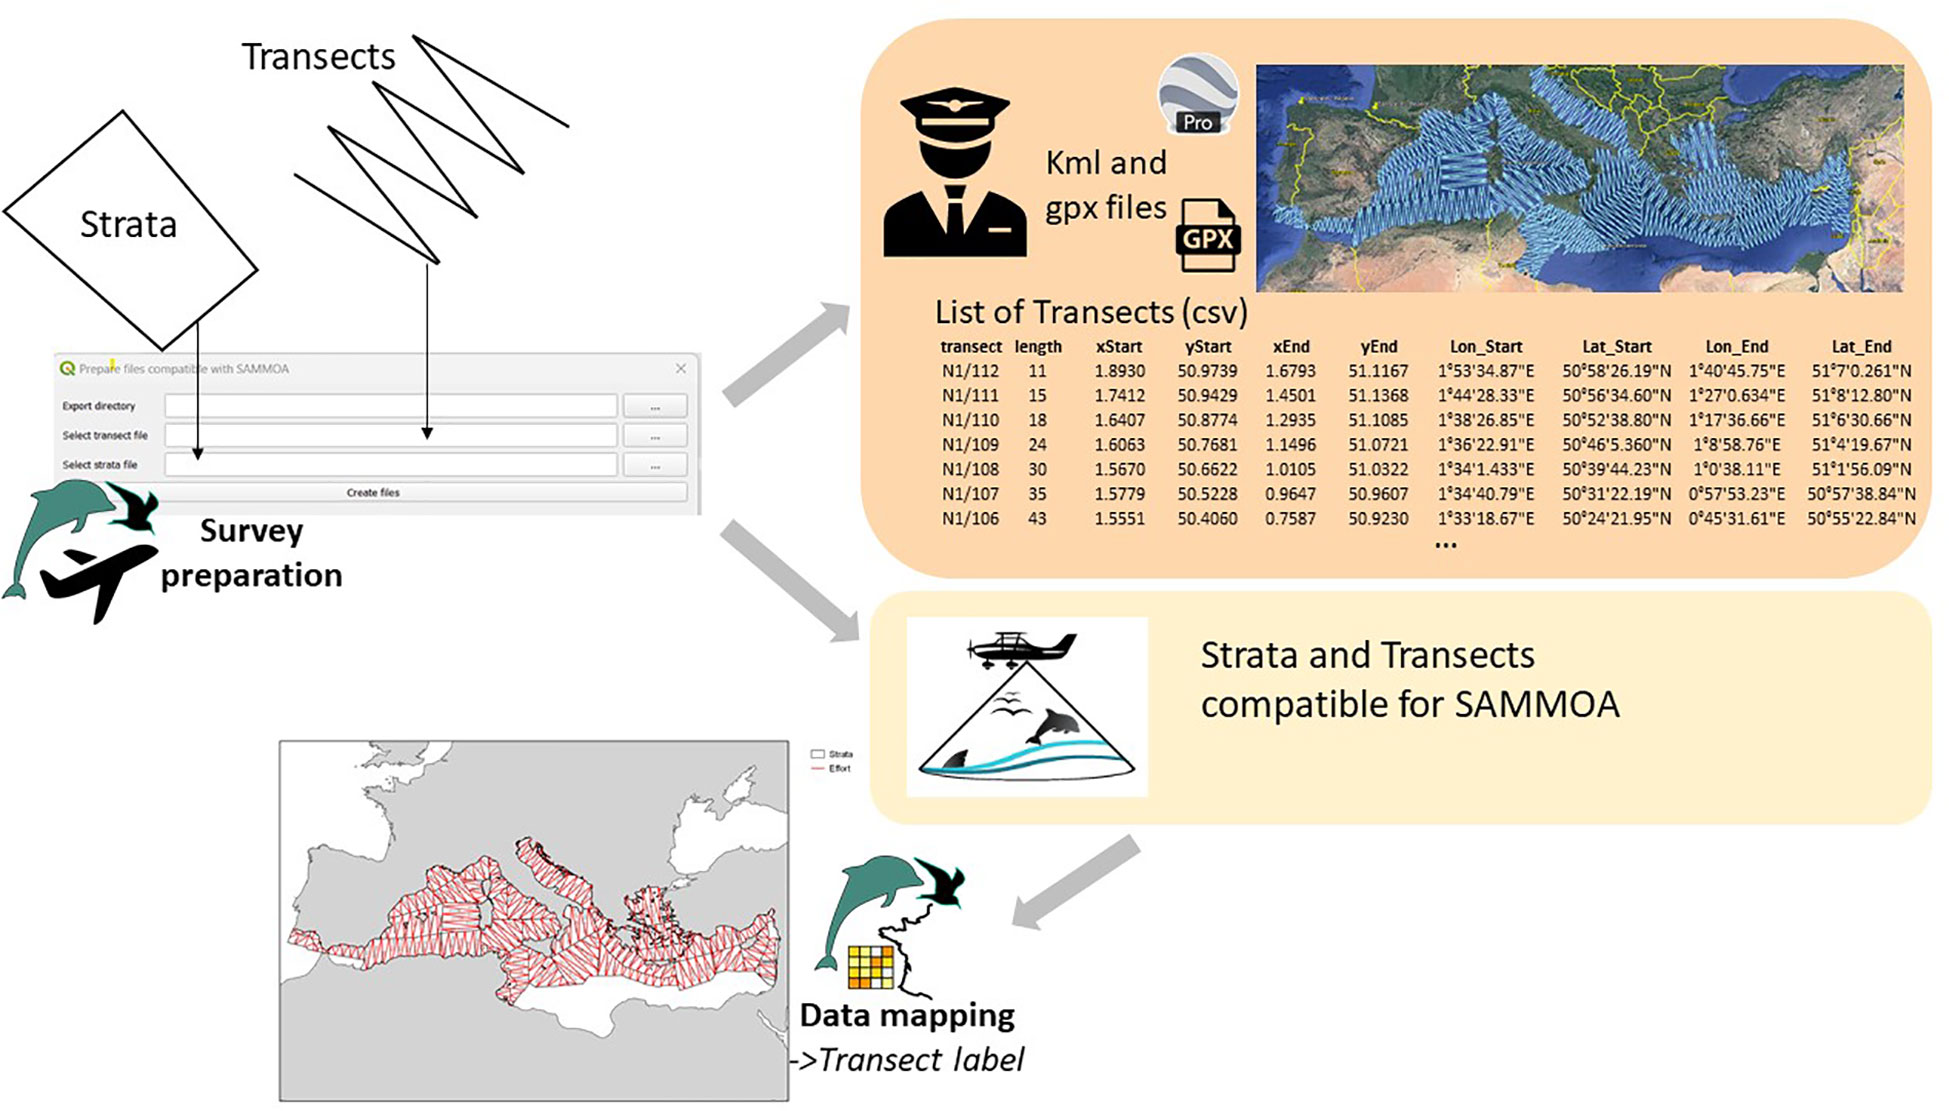
Figure 2 Survey preparation workflow through PelaSIG.
2.3.3 Data checking
Once the survey has been carried out and the dataset validated, possibly using the available audio recordings synchronised with sightings on SAMMOA, effort and sightings are exported as shapefiles. The Sammoa files checking allows the automatic checking of several parameters, taking into account the multi-target protocol (Dorémus et al., 2020). A list of potential errors is generated as log files (in text format) for both effort and sightings. Some of these checks are generic; others are specific to our protocol and therefore may not be appropriate for all surveys. For now, the listed errors need to be corrected directly in SAMMOA, and the shapefiles need to be re-exported. This step is optional.
2.3.4 Effort linearisation
Once the effort and sighting shapefiles have been exported from SAMMOA, the Linearize effort tool allows the trajectory of the survey platform to be visualised by creating lines between effort points and calculating their length in kilometres and duration in minutes. Only trajectories where observers were in standardised protocol are linearised (i.e., on effort). Each line (i.e., leg) is associated with all parameters collected with SAMMOA and has a homogeneous collected value. The date and time of the start and end of these legs are added as two new fields: DATE_TIME1 and DATE_TIME2. Linking the sighting shapefile is not mandatory, but could be associated and thus obtain a new field legID, which allows matching between sightings and the numerical identifier of the effort line. Considering an altitude of 600 ft (182 m) and using declination angles measured on board (angle field in sighing shape file), pDistTemp is estimated as the perpendicular distance for the aerial survey mode. Both new effort and observation files prepared at this step could be used for the next tools or directly for conventional distance sampling (CDS) analysis, also called design-based analysis using the Distance software (Thomas et al., 2010) or R packages (Miller et al., 2019; Genu and Authier, 2020).
2.3.5 Prepare data for analysis: clip effort in regular segments
In order to perform density surface modelling, or kriging analysis, for example, data must be segmented into regular portions of effort and sightings must be associated with each corresponding new segment. The Segment effort tool allows the user to split each leg of the previously linearised effort file into segments of the desired length. Beforehand, the linearised effort must be projected into the desired system, function of the location. The user defines the length of the segments, which is adjusted by dividing the remaining length to each segment. Three files are produced as output, with all initial parameters retained: a polyline of the effort segments resulting from the clipping, a point file with the centroid of each segment, and, if selected, the sighting file (optional). All are with a new field to identify each segment (i.e., segID) and to link sighting to the corresponding part of the effort. Several fields are also calculated: segLengKm (length of the new segment in km), DTstart, and DTend (the estimated date and time of the start and end of the leg).
2.3.6 Data summary
The Data summary tool provides a summary of observation and linearised effort data. The user can obtain a summary of the cumulative effort duration or the number of observations and individuals based on taxa or strata. The obtained results can be exported in csv format.
The filters available on the effort table are sampling plan, session, computer (when several platforms are working together), or strata, and effort is summarised by length (in km), duration (in min), and mean sea state condition, taking into account effort in each condition.
2.3.7 Data mapping
The Mapping module allows the user to spatially represent the data through different types of maps. On each map, the addition of a global coastal contour or other shape file is possible to customize the project. For the effort, the use of Transects labels allows to map the effort planned before the survey with labels and effort transects to be carried out, while Context map visualise the effort achieved, and the latter can be coloured according Beaufort scale using the Beaufort index map. The sighting file could be represented as dots coloured by taxa using the Observations map, or usually for a selected species (or group of species), or group size could be automatically plotted using the PodSize proportional circles map. Then, the data could be resampled on a regular grid, with the cell dimension chosen by the user (unit depends on the projection of the linearised effort), combining the number of encounters per kilometre per grid for a selected species or group of species, using the Detections rate map, while the Individuals rate map estimates the number of individuals counted per kilometre in each cell. Finally, the PodSize rate map gives the mean pod size of the selected species/taxon or other, in each grid cell. Sightings not recorded in protocol, as off-effort or only detected by the pilot or secretary, are not considered by the tool in this grid treatment. For the mapping module, a projected coordinate reference system is set up as default EPSG 4326. However, there is an option to change projection (especially for the grid size unit) or to import a suitable shape for the coastline.
For all these maps, the user can choose to apply filters to the sighting data (Observation) to select one or more species/date… (any field of the effort file). To customize, the title, source, and file name could be updated by the user, and a logo could be added to the final export available in pdf, png, or shape files. To generate multiple maps automatically, in a group of species, whatever, the attribute field is ticked, " Generate map should be selected. All the map will be exported automatically in the selected format (png, pdf, and/or shapefile).
2.3.8 Data sharing
The availability of comprehensive, accurate, and relevant data is central to the effectiveness of rapid assessment, collaboration, and data sharing. The Share tool allows data to be exported directly from a database in a lightweight exchange format, called Basic Data Exchange.
Similarly, the Import into database tool allows shapefiles exported from the SAMMOA software to be stored in the Observatoire Pelagis survey campaign PostgreSQL database. This tool is dedicated to the Pelagis database and may not be suitable for all databases.
2.4 Software availability
Latest software version: 2.6 (2023).
Hardware required: PC (2 GB RAM, 2 GHz CPU recommended).
Software required: Windows XP or later recommended, Linux, Mac; QGIS 3 (3.16 up to 3.28.5 optional but recommended).
Program languages: Python, PyQGIS.
Program size: 138 Mo.
Availability: www.observatoire-pelagis.cnrs.fr/tools/pelasig/
Cost: free, licensed under the GNU GPL.
3 Study case: the aerial survey of ACCOBAMS Survey Initiative
The workflow of the survey preparation is illustrated on Figure 2. Unfortunately, the Survey preparation tool was not ready to be used for the preparation of the ASI survey.
3.1 Data collection using SAMMOA
Surveys were conducted using a standard line-transect method (Buckland et al., 2001), similar to previous large-scale aerial surveys dedicated for marine mammals in European waters (Hammond et al., 2014) or to megafauna (Pettex et al., 2017; Laran et al., 2017b). The aircraft speed was 185 km h−1/100 knots, and the altitude was 182 m/600 ft (Cañadas et al, 2023; Panigada et al., 2023). The survey crew consisted of two naked-eye observers and a third person collecting data on a laptop computer equipped with SAMMOA, developed for the aerial survey; the version 1.1.2 was used at the time of the ASI aerial survey (SAMMOA, 2019). The position of the aircraft was automatically recorded (set to a 2-s interval using an on-board GPS device connected to the computer). Environmental conditions were recorded at the beginning of each transect and whenever any of these parameters changed (Panigada et al., 2023). For marine mammals, elasmobranchs and sunfish, perpendicular distances measured by clinometers were recorded by the observers, while for seabirds, turtles, other large fish, marine debris, and boats, all encounters within 200 m of the aircraft trackline (500 m for boats) were considered detected.
All flights collected by different teams could be combined on a single computer using SAMMOA and then exported as shapefiles. Given the large number of teams and flights for ASI aerial survey, shapefiles were exported for each team and then merged in QGIS before being processed using the PelaSIG plugin.
3.2 Data summary and mapping
Once the linearisation of effort (and association with sightings) is achieved, the Data mapping tool is used with the Context map option to visualise the effort achieved (Figure 3). Specific sea state representation is also possible using the Beaufort index option to represent weather conditions along the survey (Figure 4). Using the Data summary, it is possible to create a table of the cumulative effort by stratum (Table 1) or number of sightings and individuals per taxon (Table 2).
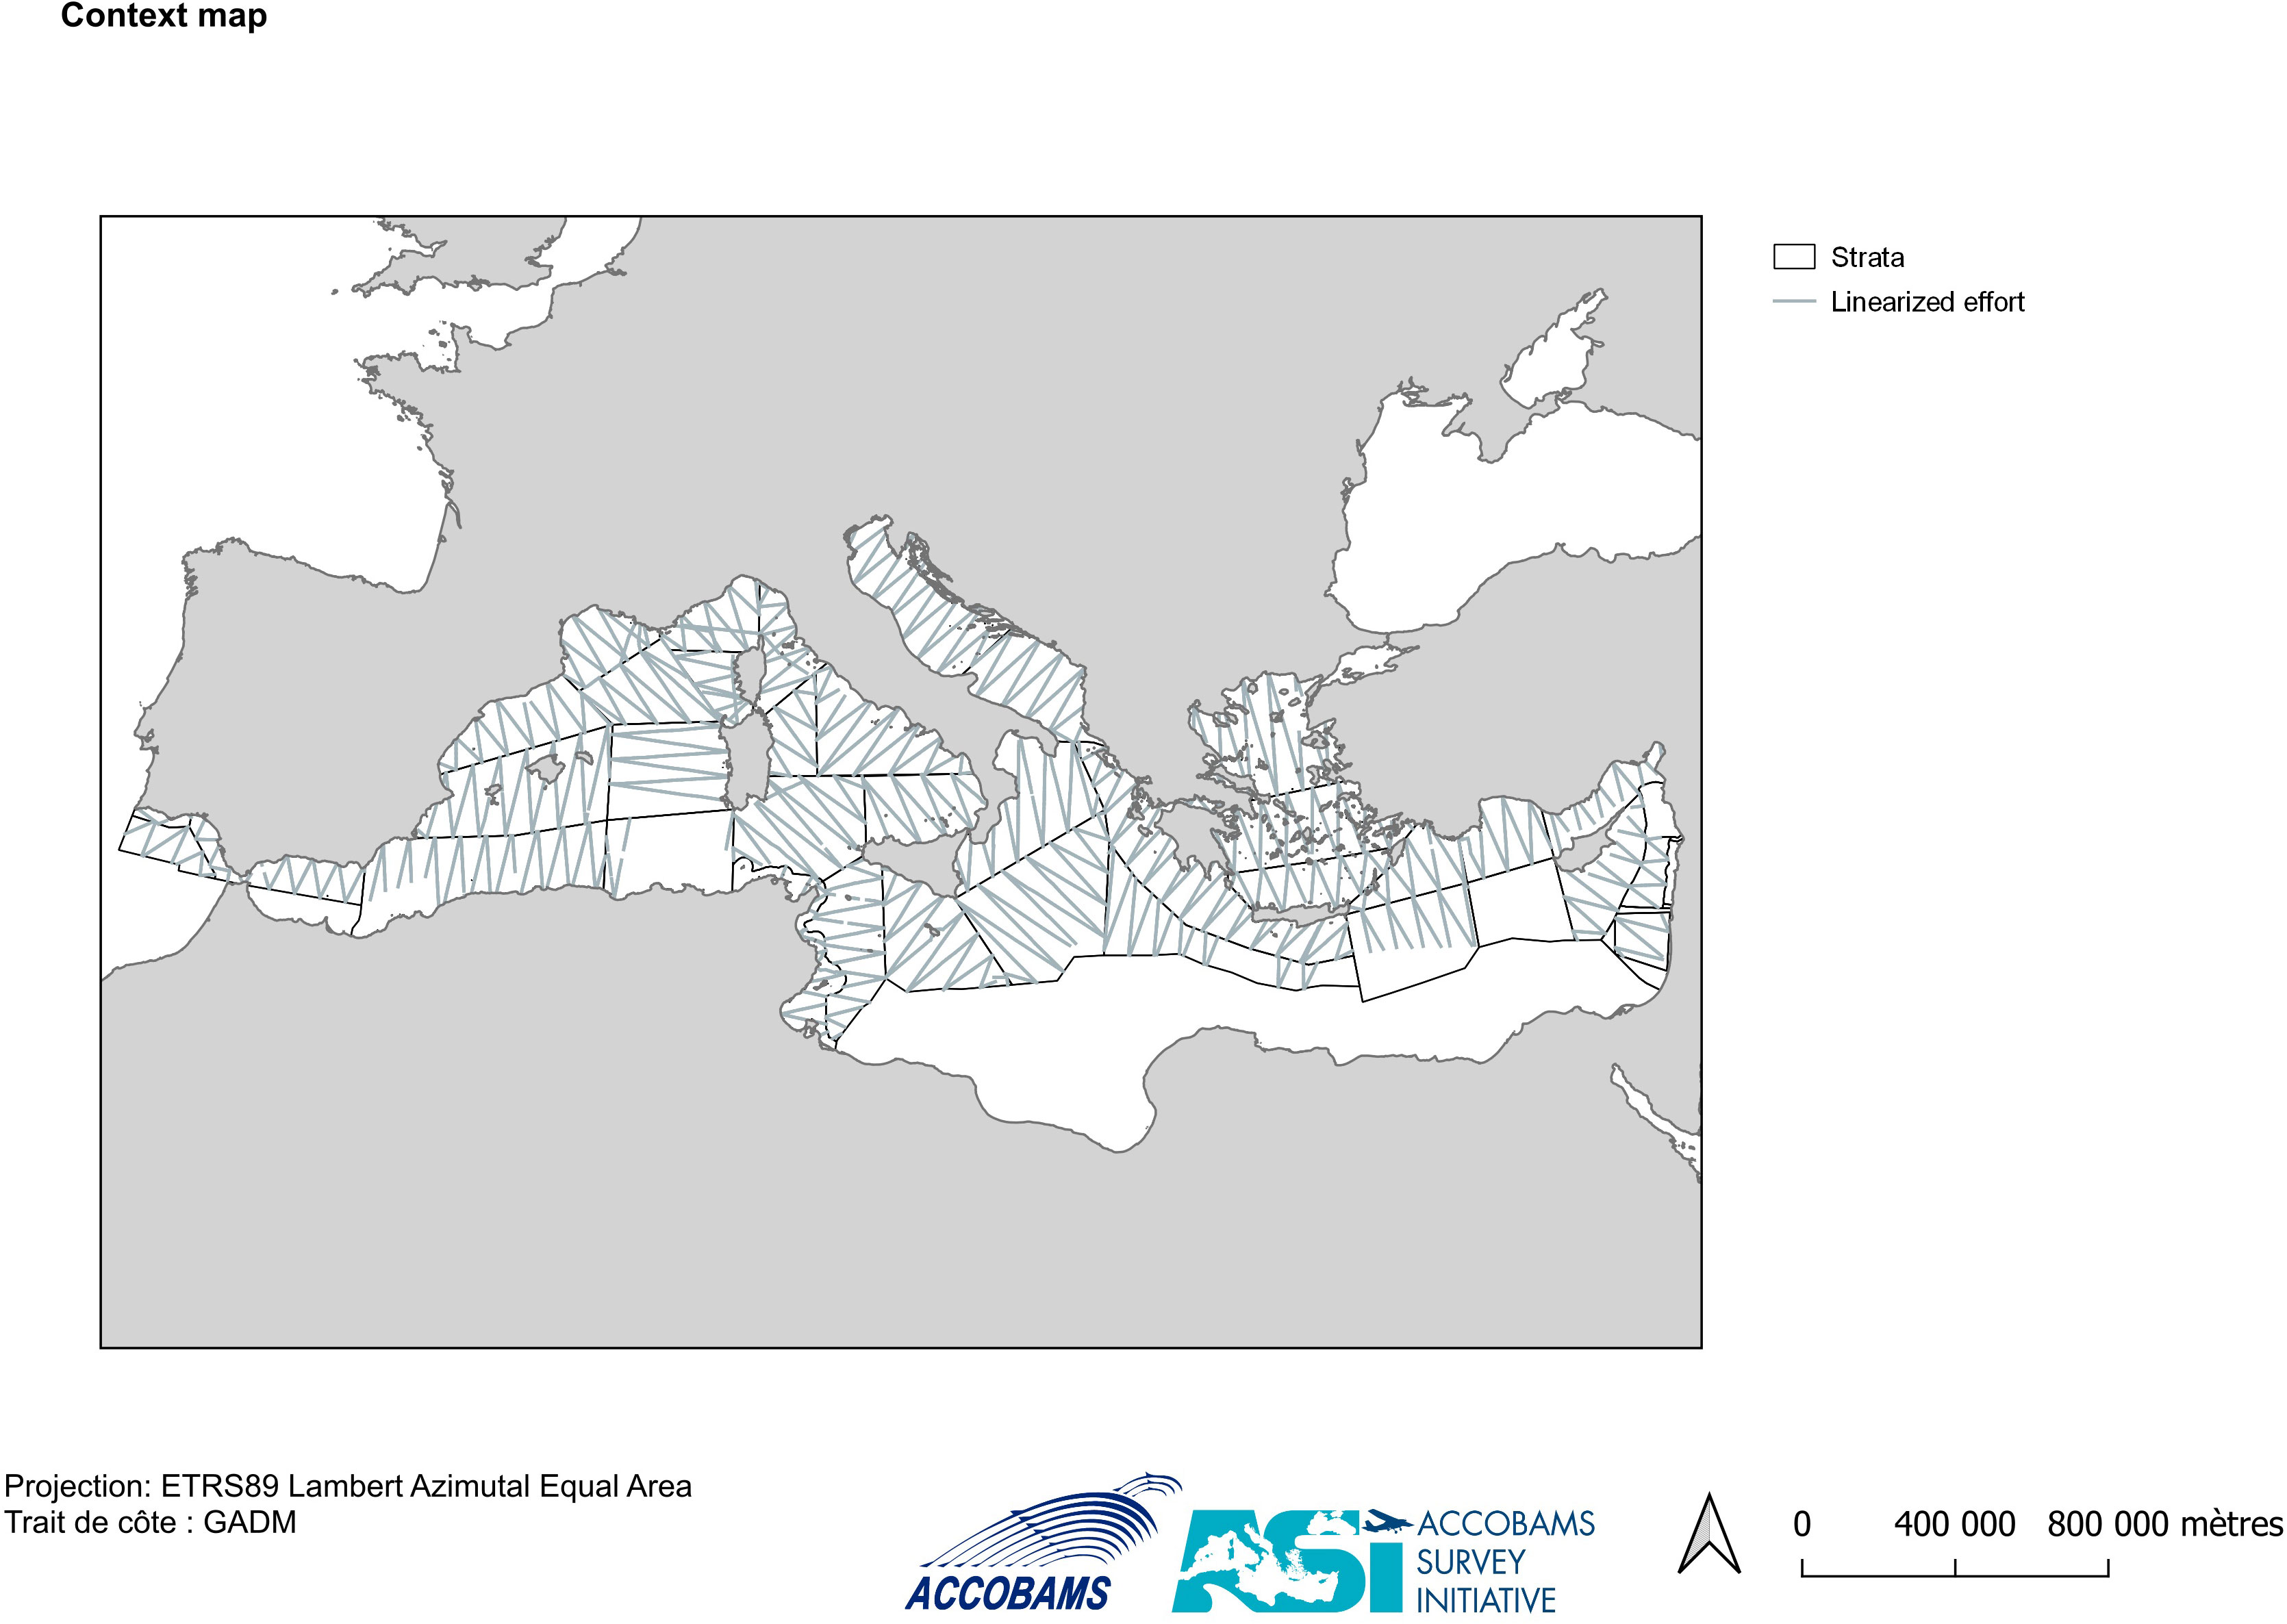
Figure 3 Data mapping with Context map with logo to represent effort during ASI aerial survey through PelaSIG.

Figure 4 Data mapping with Beaufort Index map to represent sea state condition during ASI aerial survey through PelaSIG.
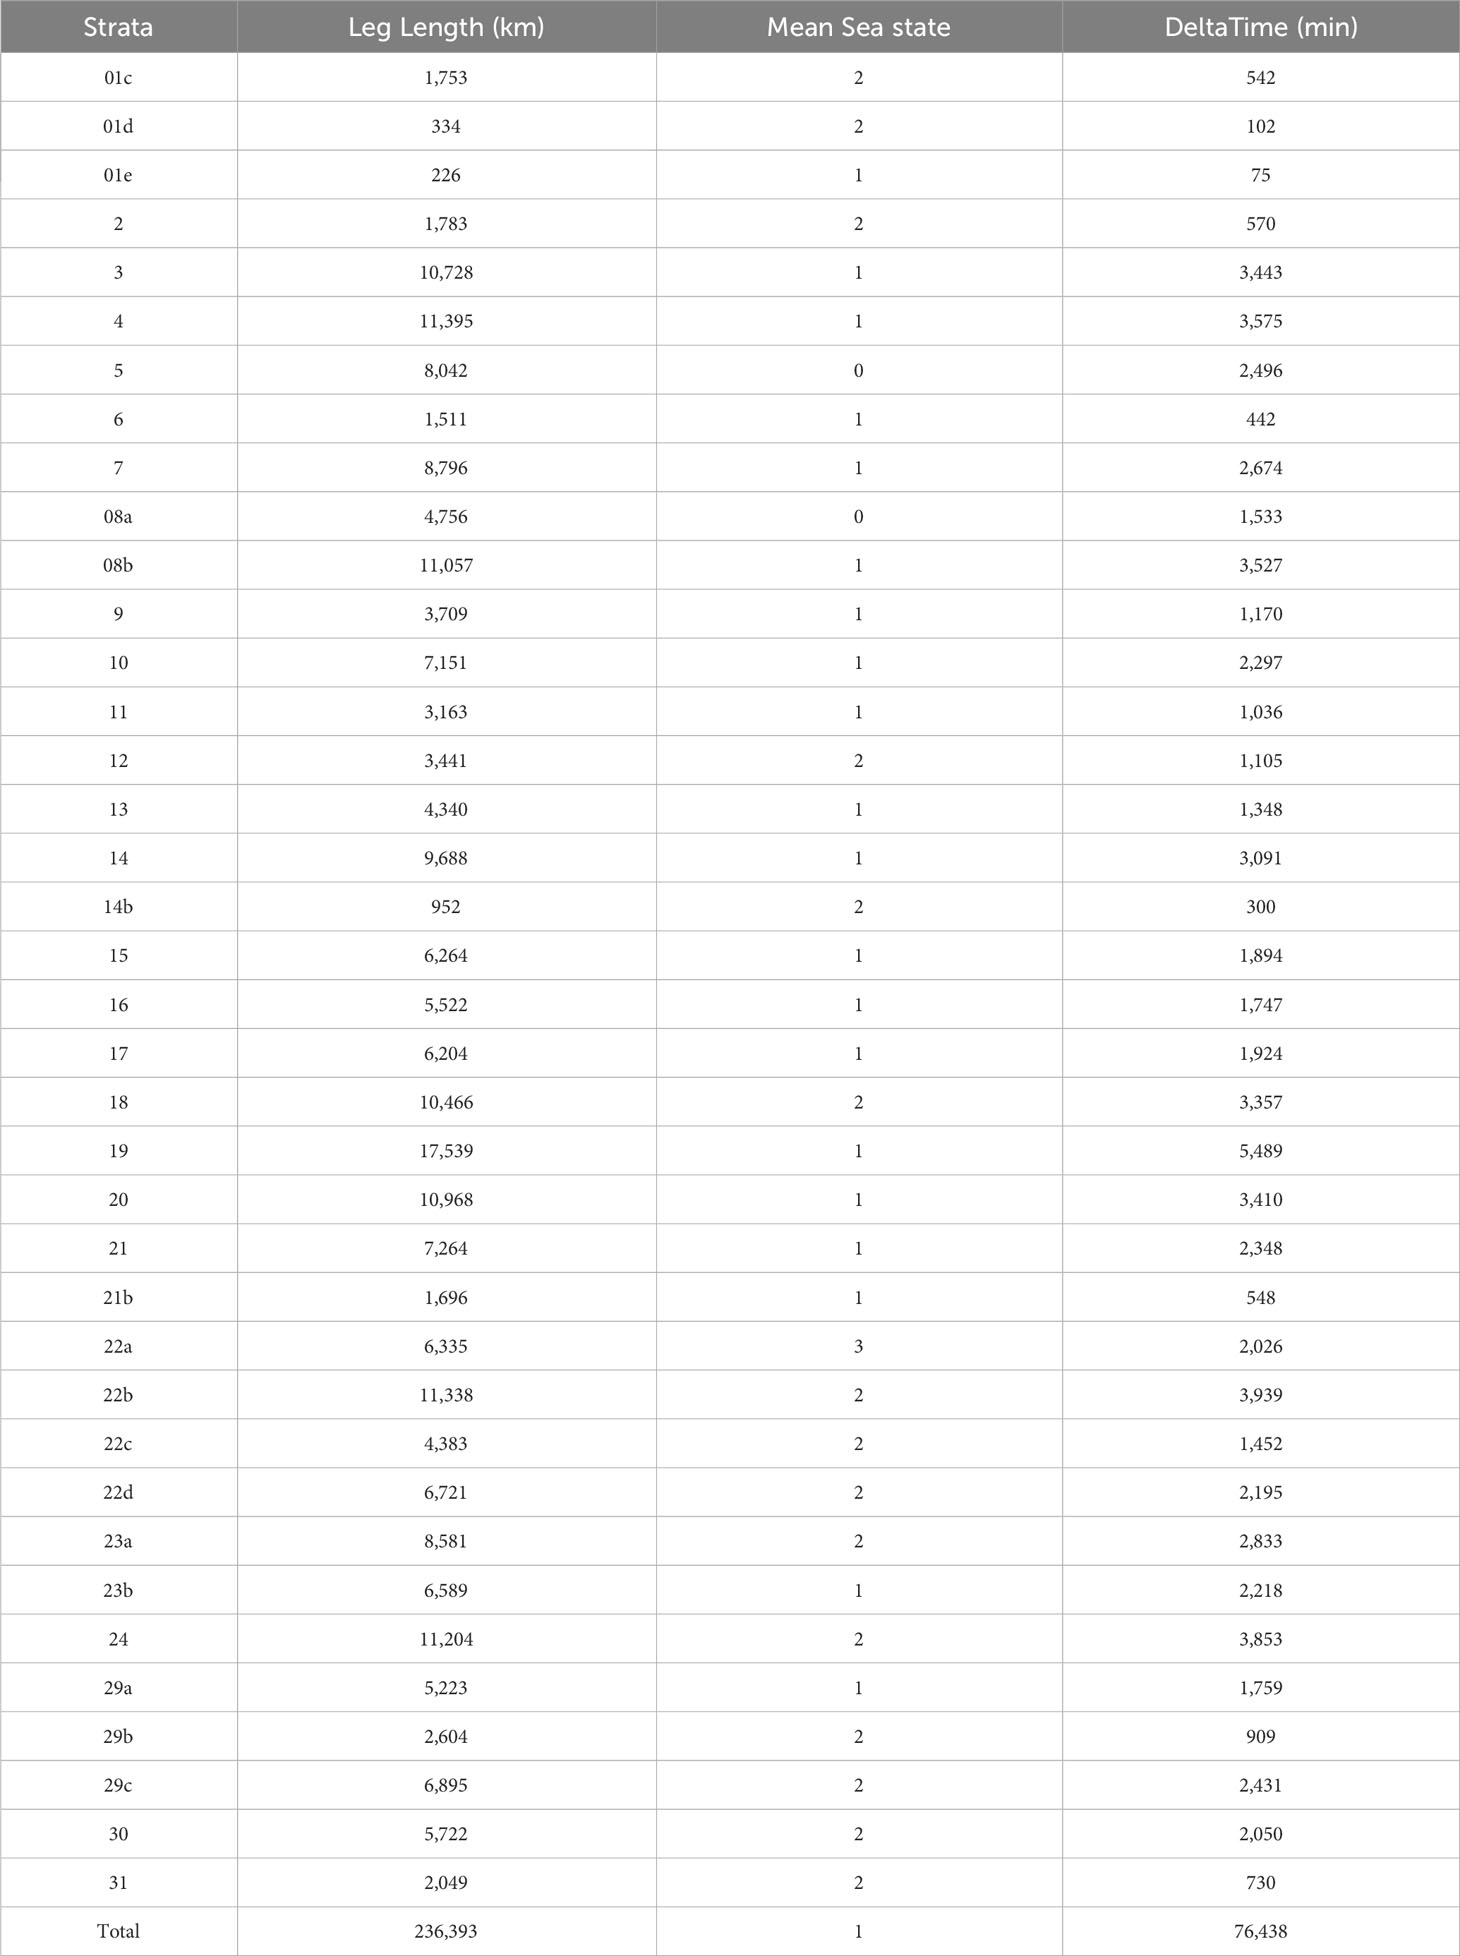
Table 1 Cumulative effort by strata during ASI aerial survey through the Data Summary tool of the PelaSIG. See Panigada et al., 2023 for the location of strata.
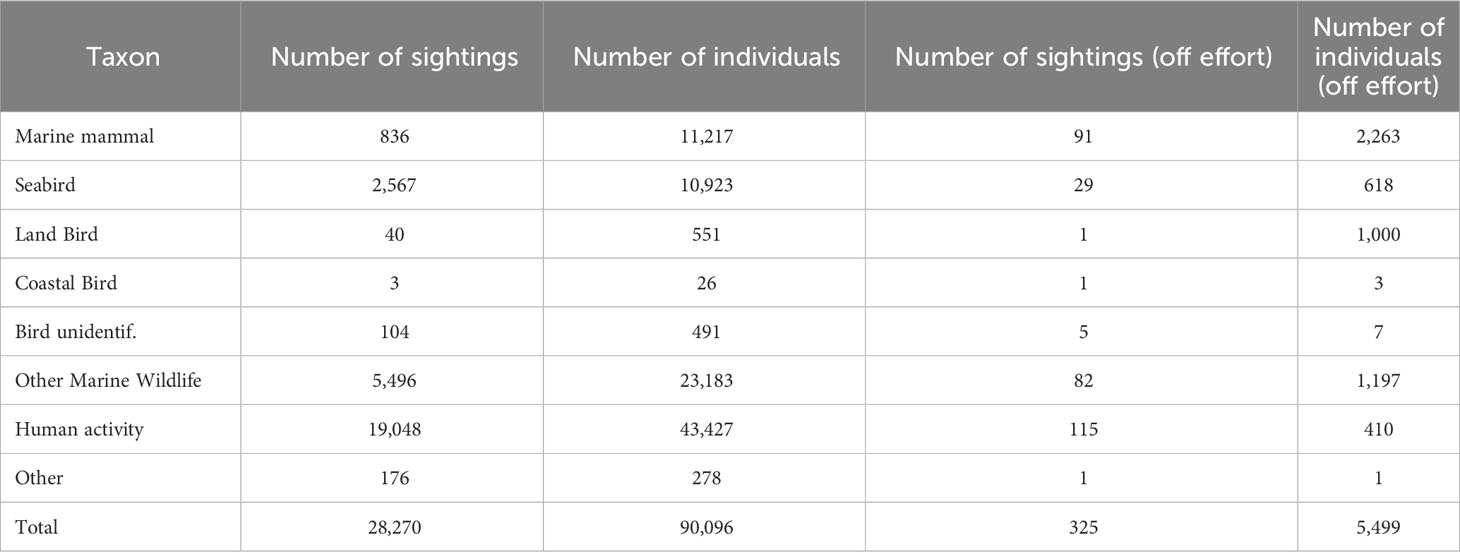
Table 2 Number of sighting and individuals per taxon during ASI aerial survey through Data Summary tool of the PelaSIG.
Considering the distribution of sightings, the three groups of marine megafauna taxa collected during the ASI aerial survey were plotted using Observation map (within Data mapping; Figure 5), while for marine mammals’ species, they are presented using Podsize proportional circles maps (Data mapping) and generated by family (Figure 6). Sea turtles and elasmobranchs (Figure 7) and seabirds (Figure 8) were also presented using Observation map, due to the large number of sightings.
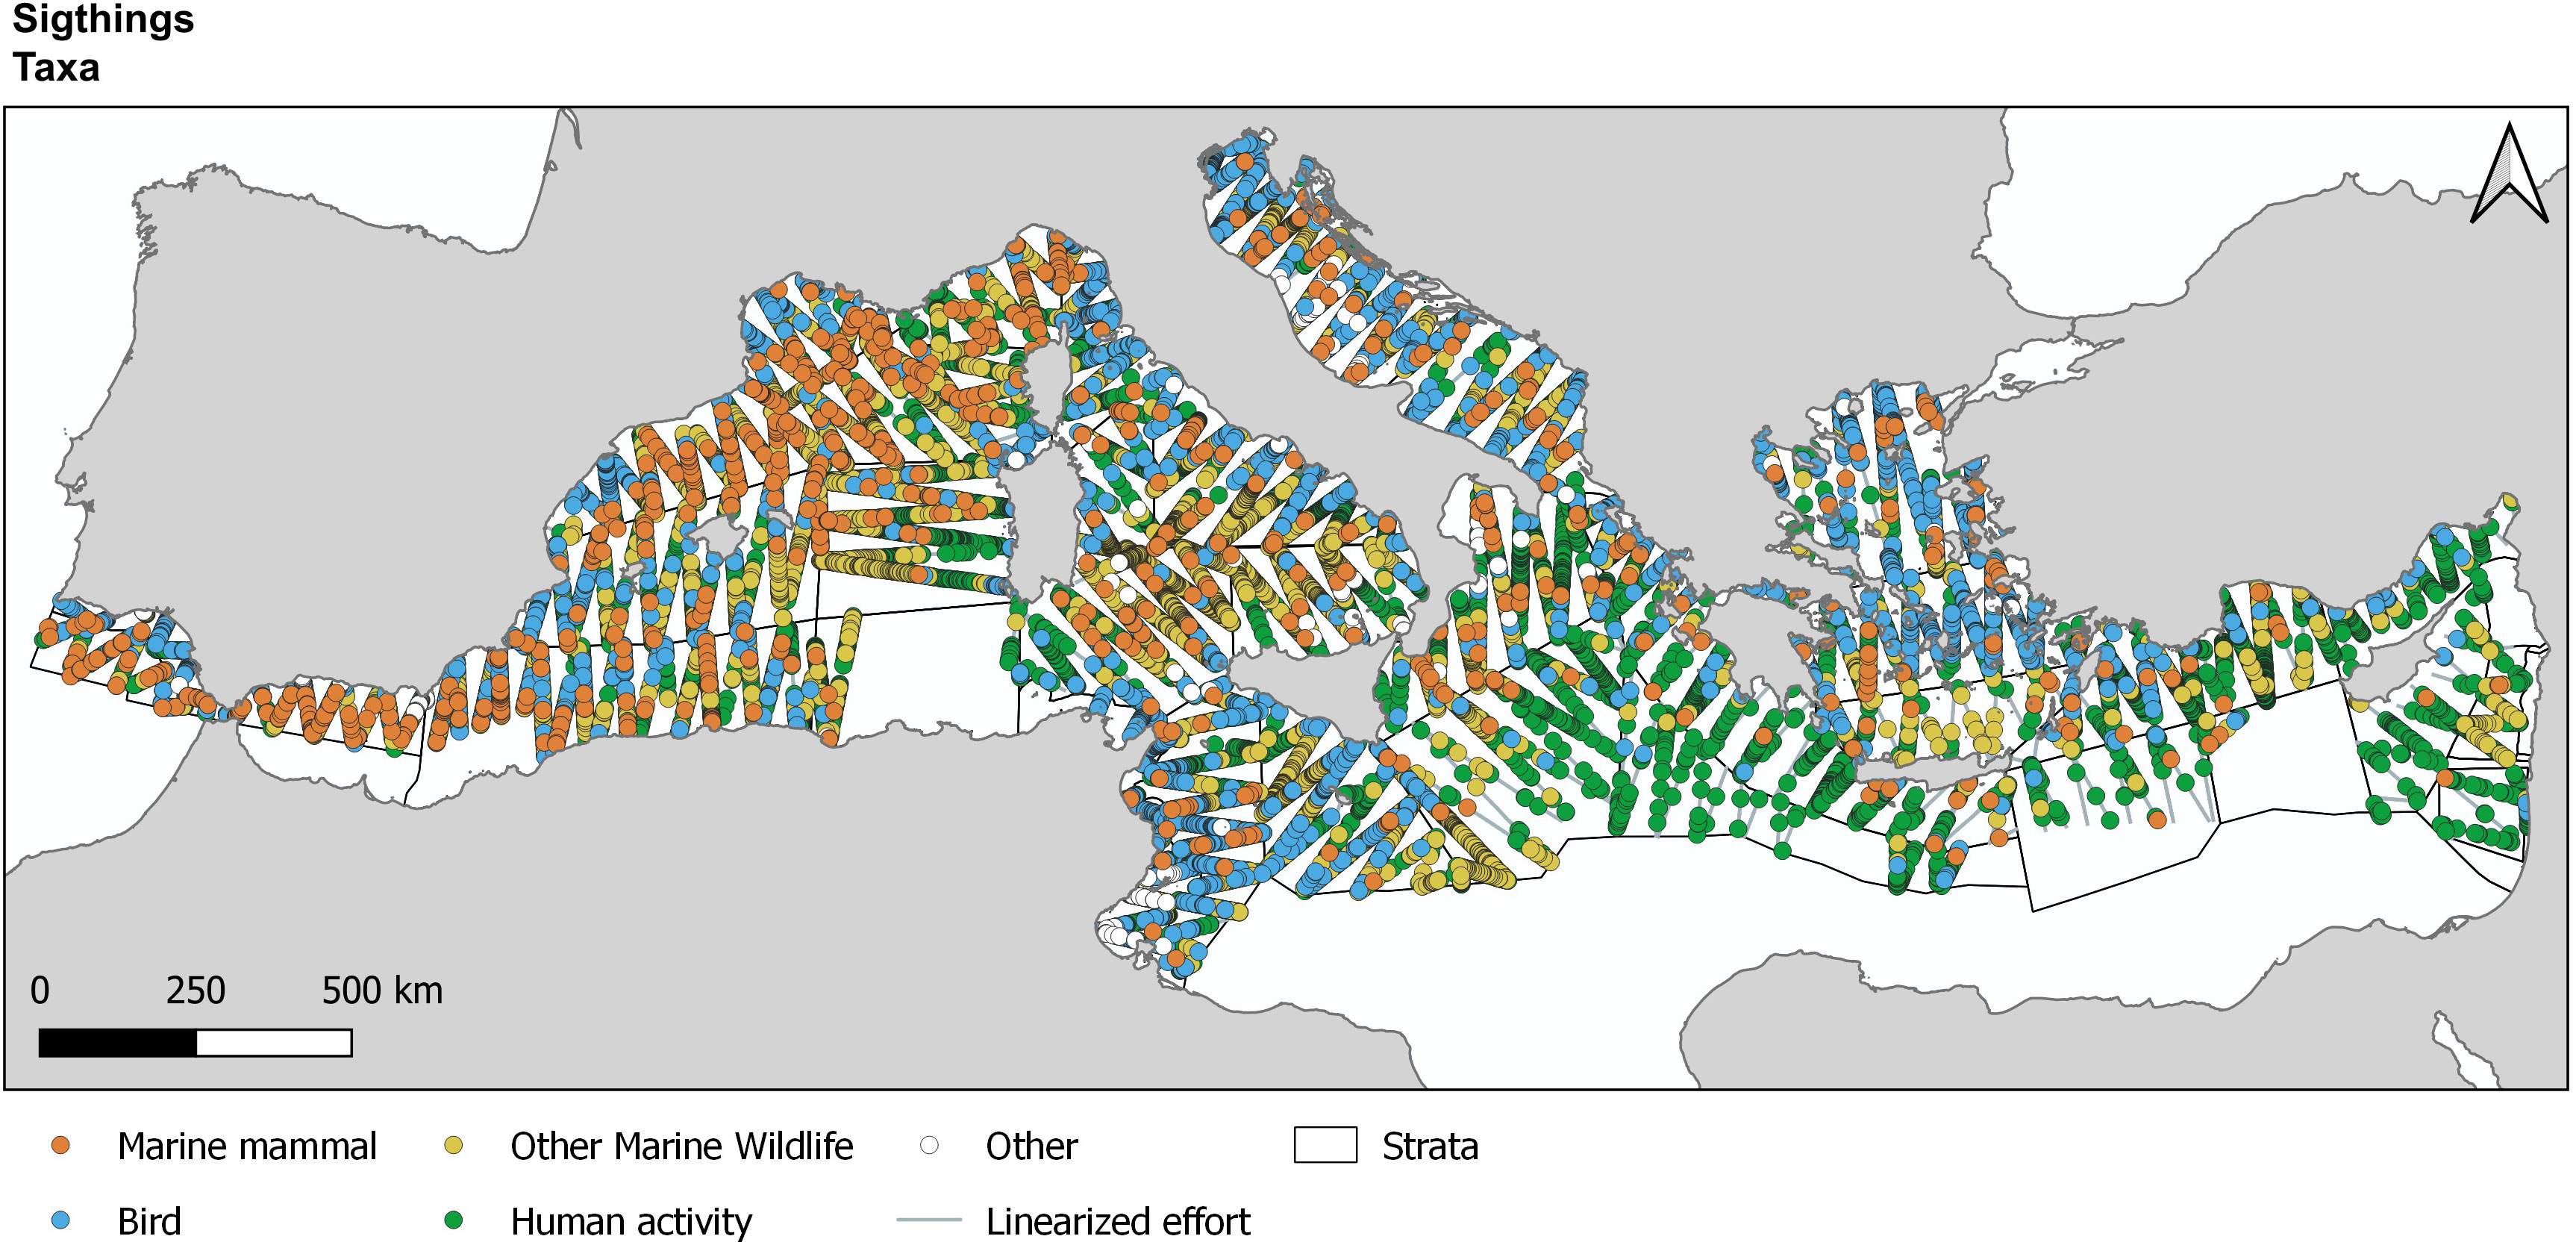
Figure 5 Data mapping with Observation map to visualize the distribution of the different taxa during ASI aerial survey through PelaSIG.
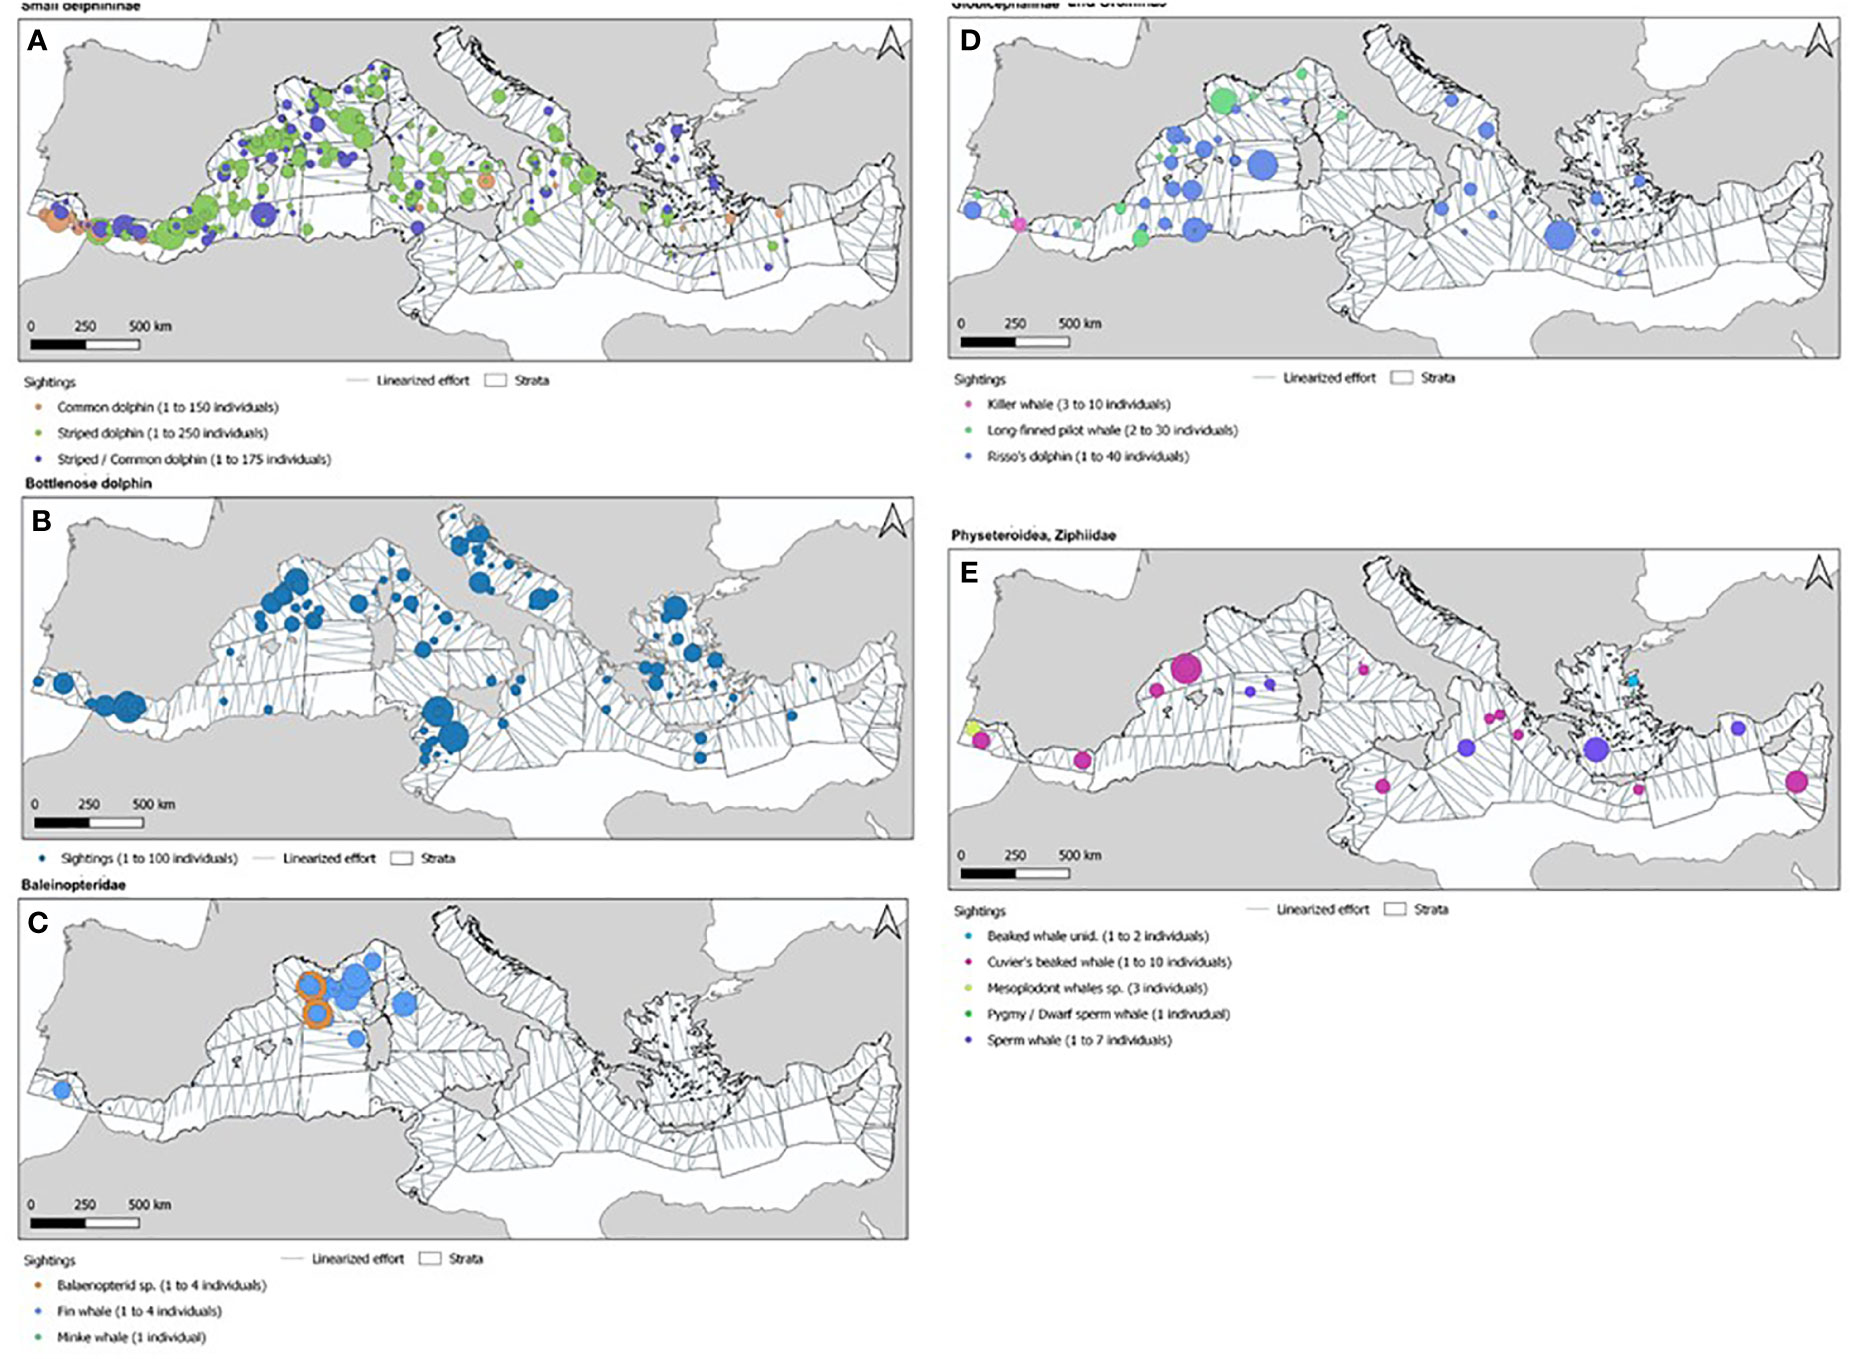
Figure 6 Data mapping with Podsize proportional circles maps for (A) small Delphininae (common dolphin, striped dolphin and striped or common d. unidentified), (B) Bottlenose dolphin, (C) Blaenopteridae (fin whales, minke whales and unidentified whales), (D) Globicephalinae & Ocrcininae (long finned pilot whales, Risso’s dolphin and killer whale) and (E) Deep divers (Beaked whale unidentified, Cuvier’s beaked whale, Mesoplodon spp., Kogia spp. and sperm whale during ASI aerial survey through PelaSIG.
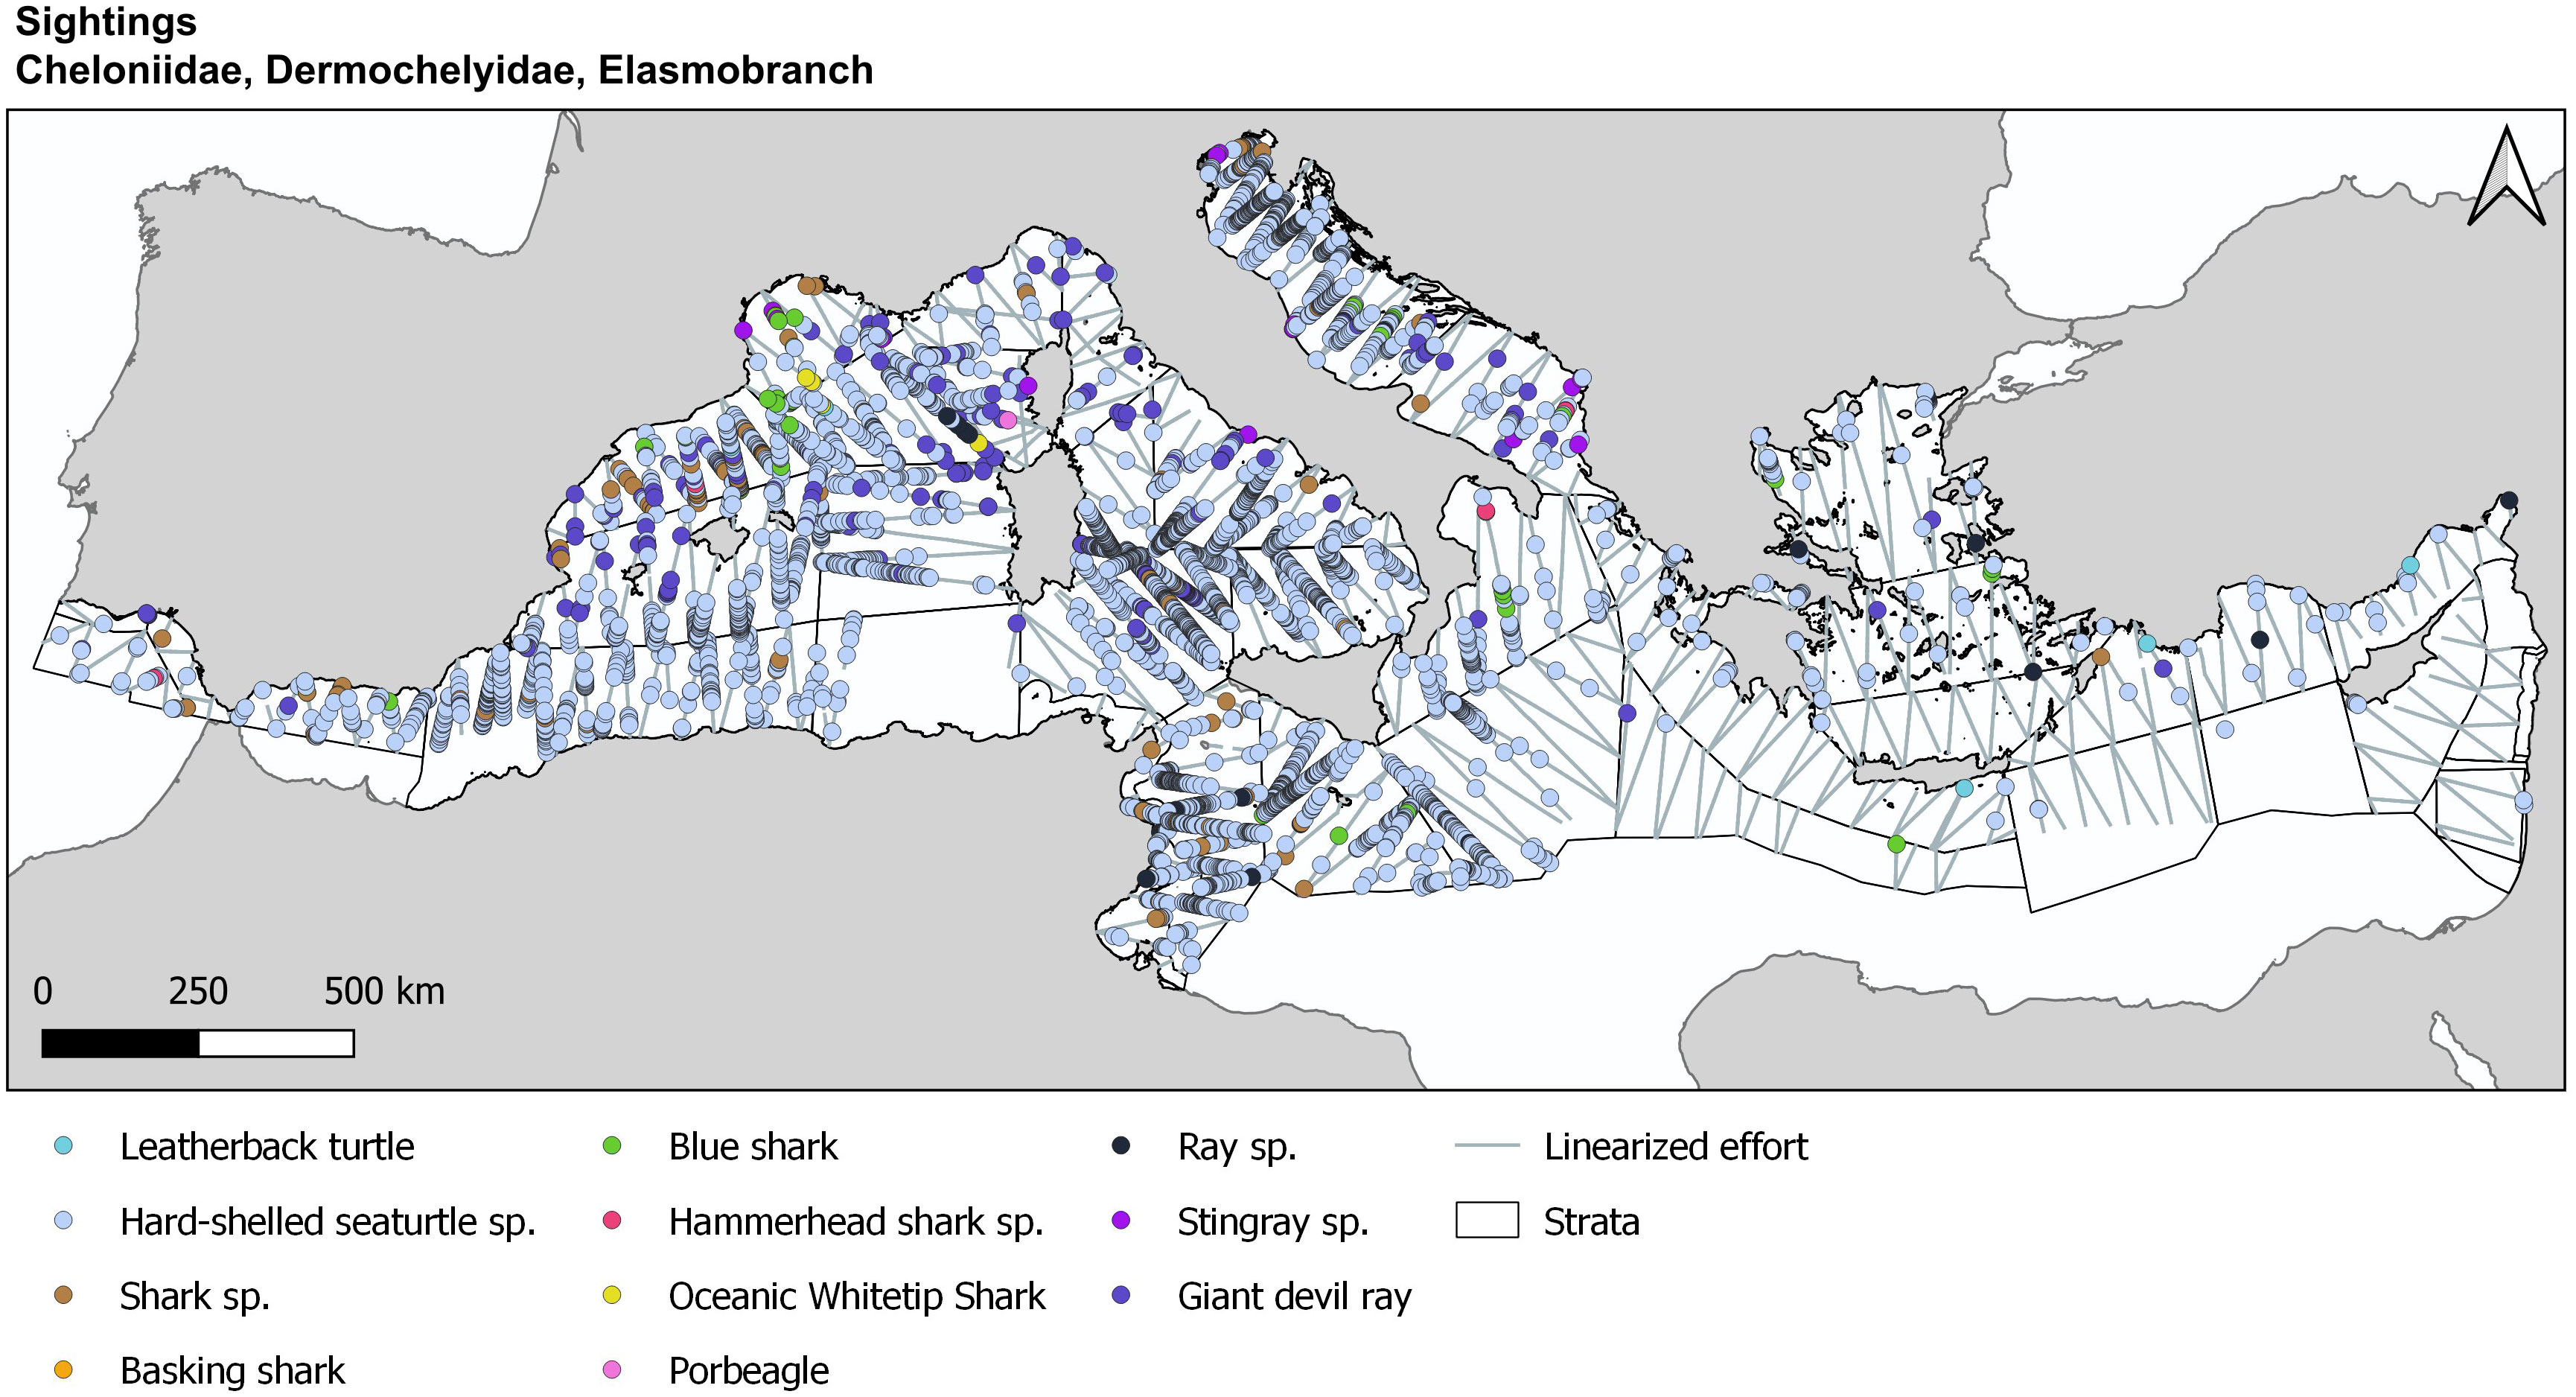
Figure 7 Data mapping with Observation map for sea turtles and Elasmobranches (rays and shark) during ASI aerial survey through PelaSIG.
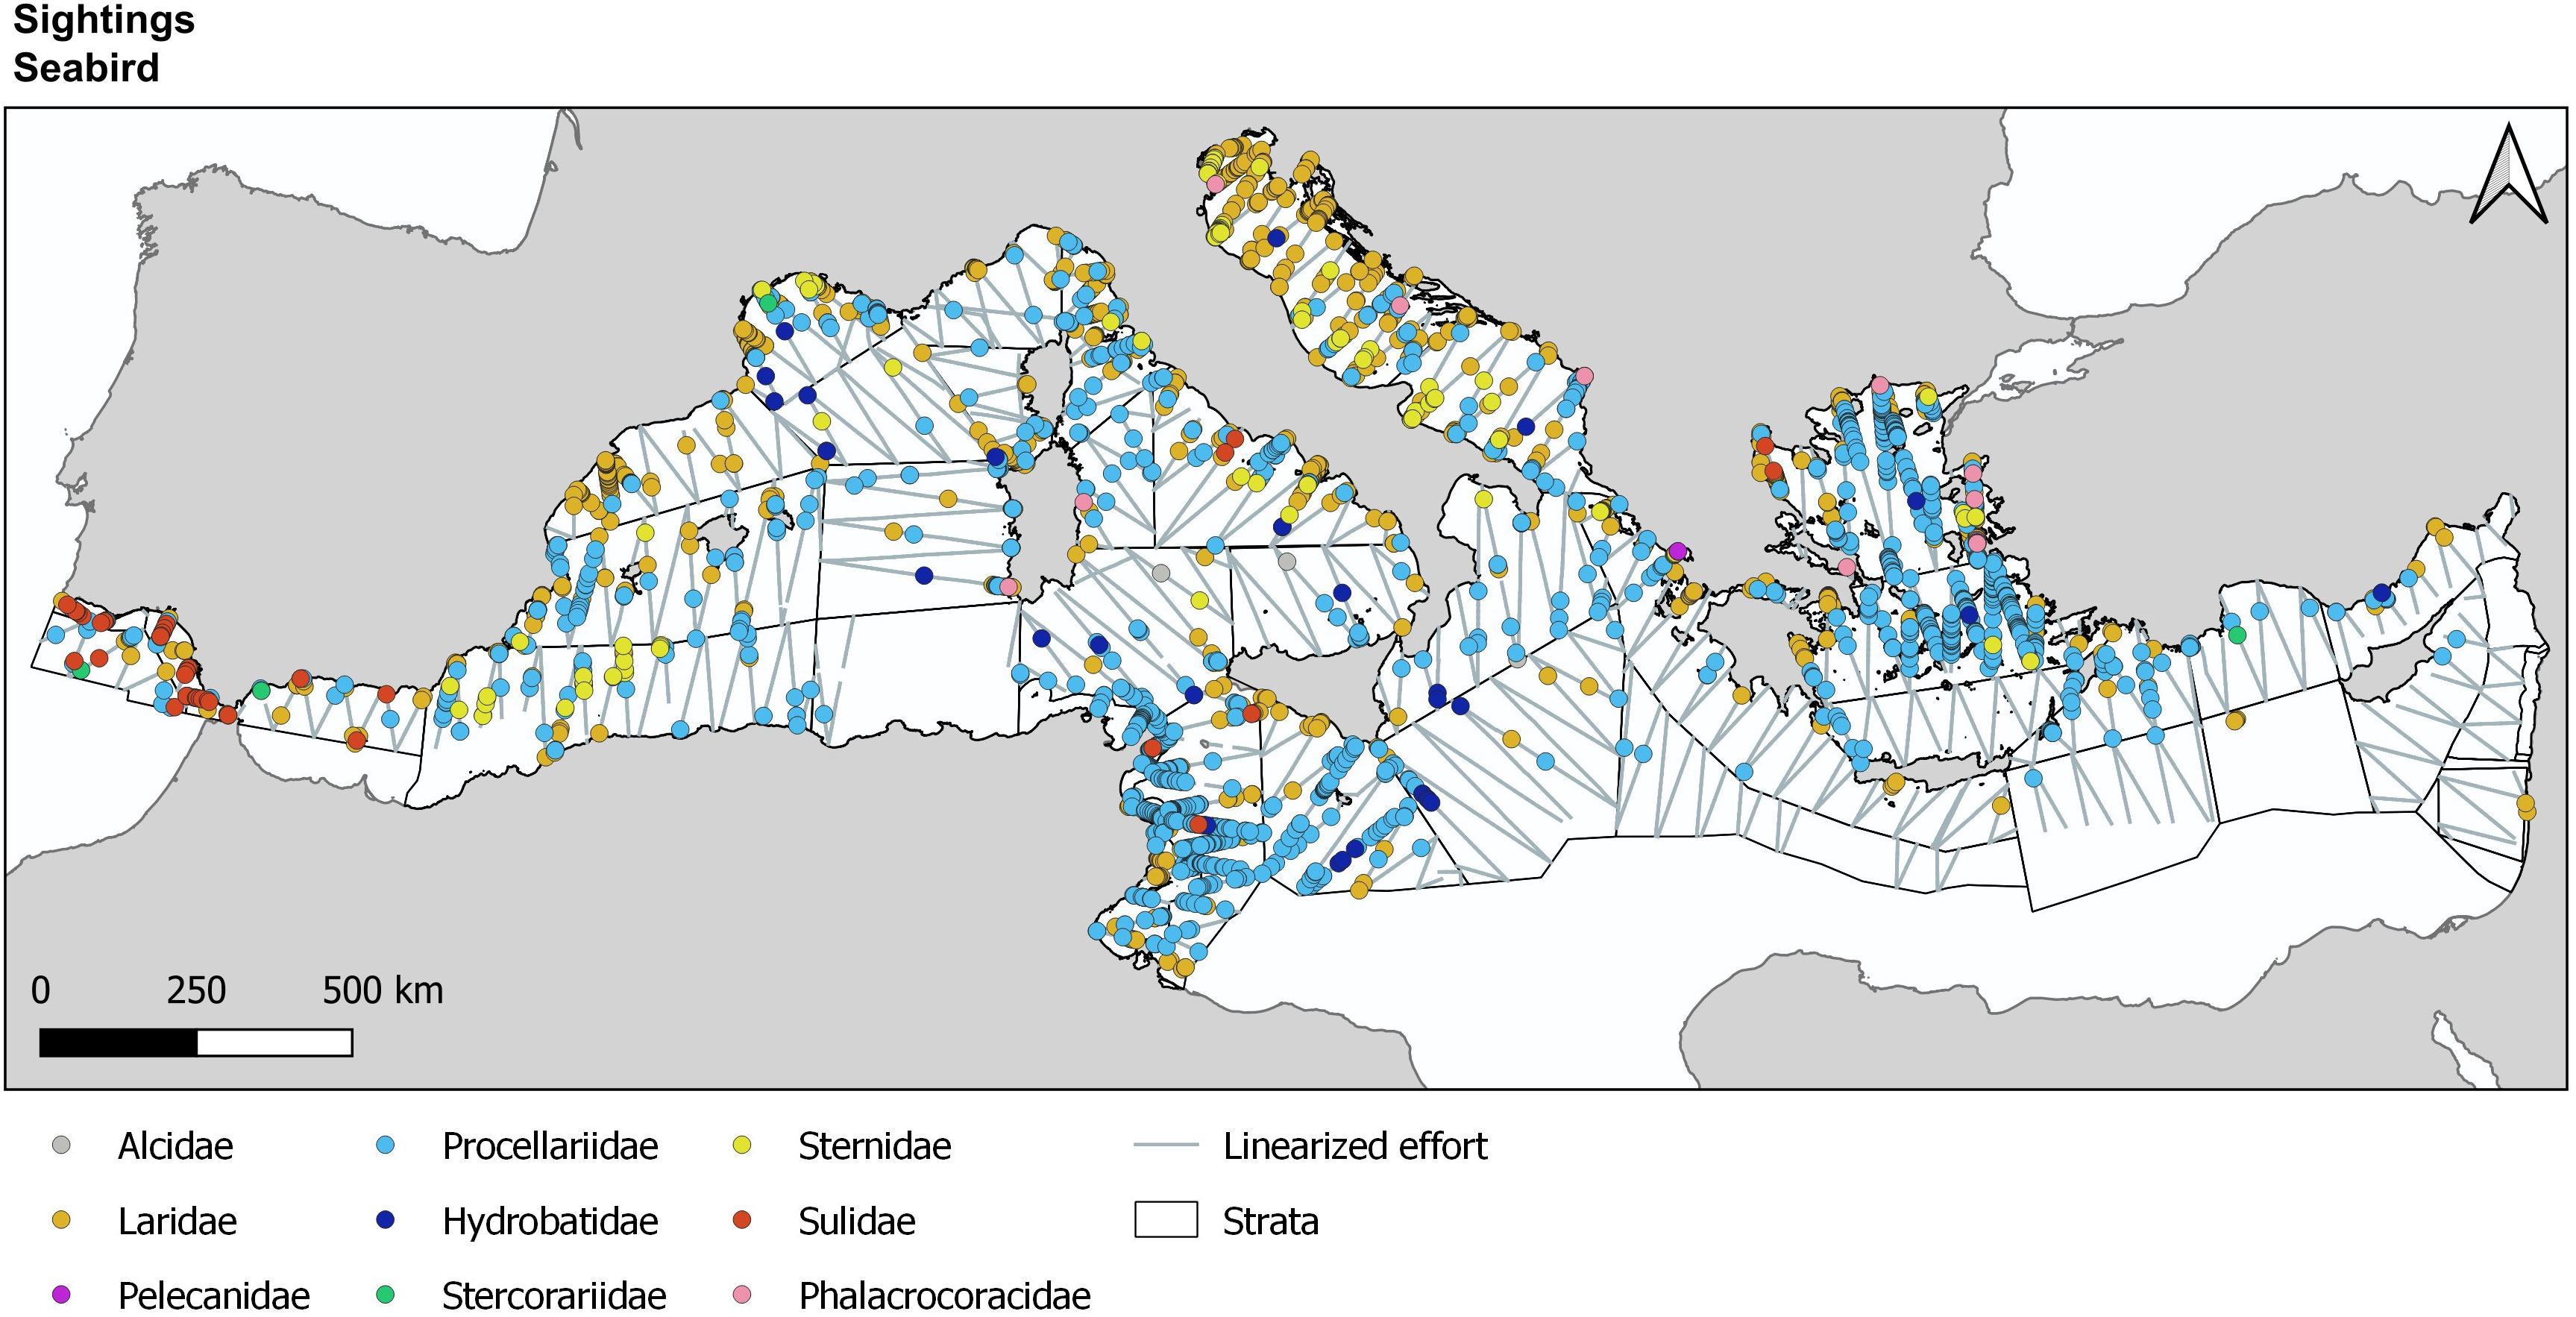
Figure 8 Data mapping with Observation map for seabirds observed during ASI aerial survey through PelaSIG.
Considering now the resampling in the grid cell in order to better compare the distribution through the two Mediterranean Basin, the Detection rate was presented for the four marine megafauna taxa collected: marine mammals, seabirds, sea turtles, and elasmobranchs (Figure 9), while for the index of anthropogenic activities, the individual rate was presented for marine debris and ship (Figure 10). Finally, the PodSize rate map was presented for the small Delphininae (striped and common dolphins, including undifferentiated) over the entire basin (Figure 11).
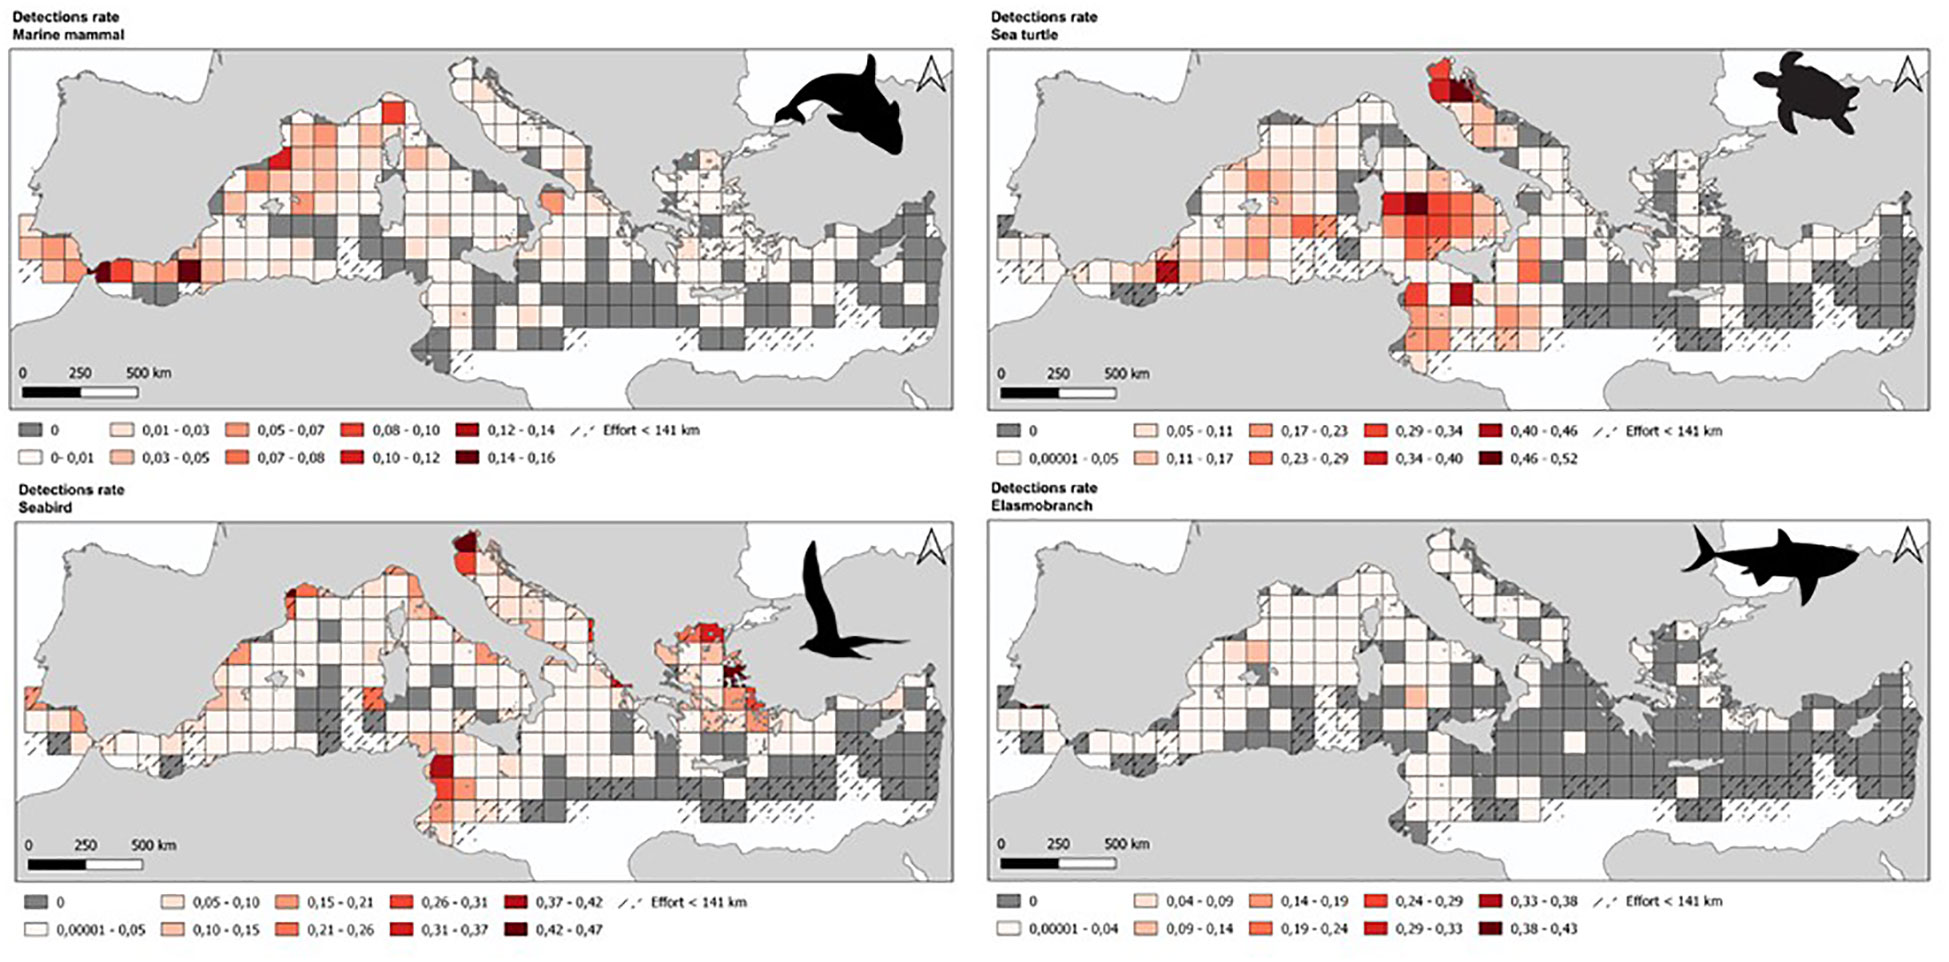
Figure 9 Data mapping with Detection rate maps for marine mammals, seabirds, sea turtles and Elasmobranchs during ASI aerial survey through PelaSIG.
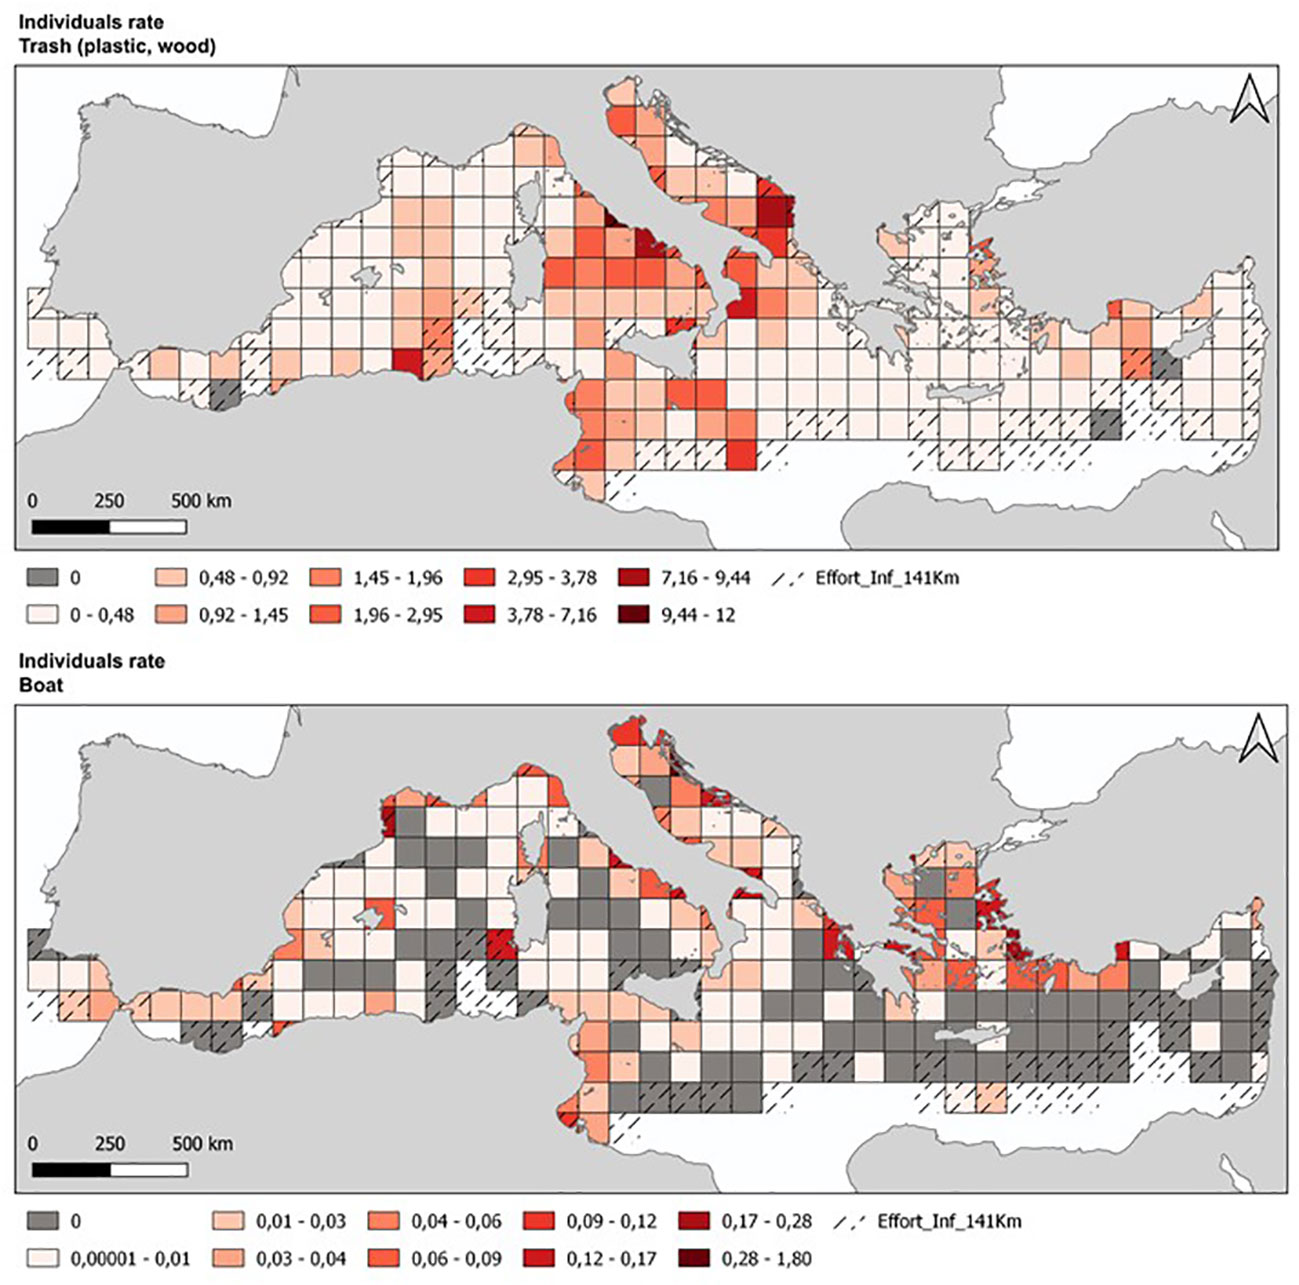
Figure 10 Data mapping with Individuals rate maps for marine debris (plastic and wood trash) and boats during ASI aerial survey through PelaSIG.
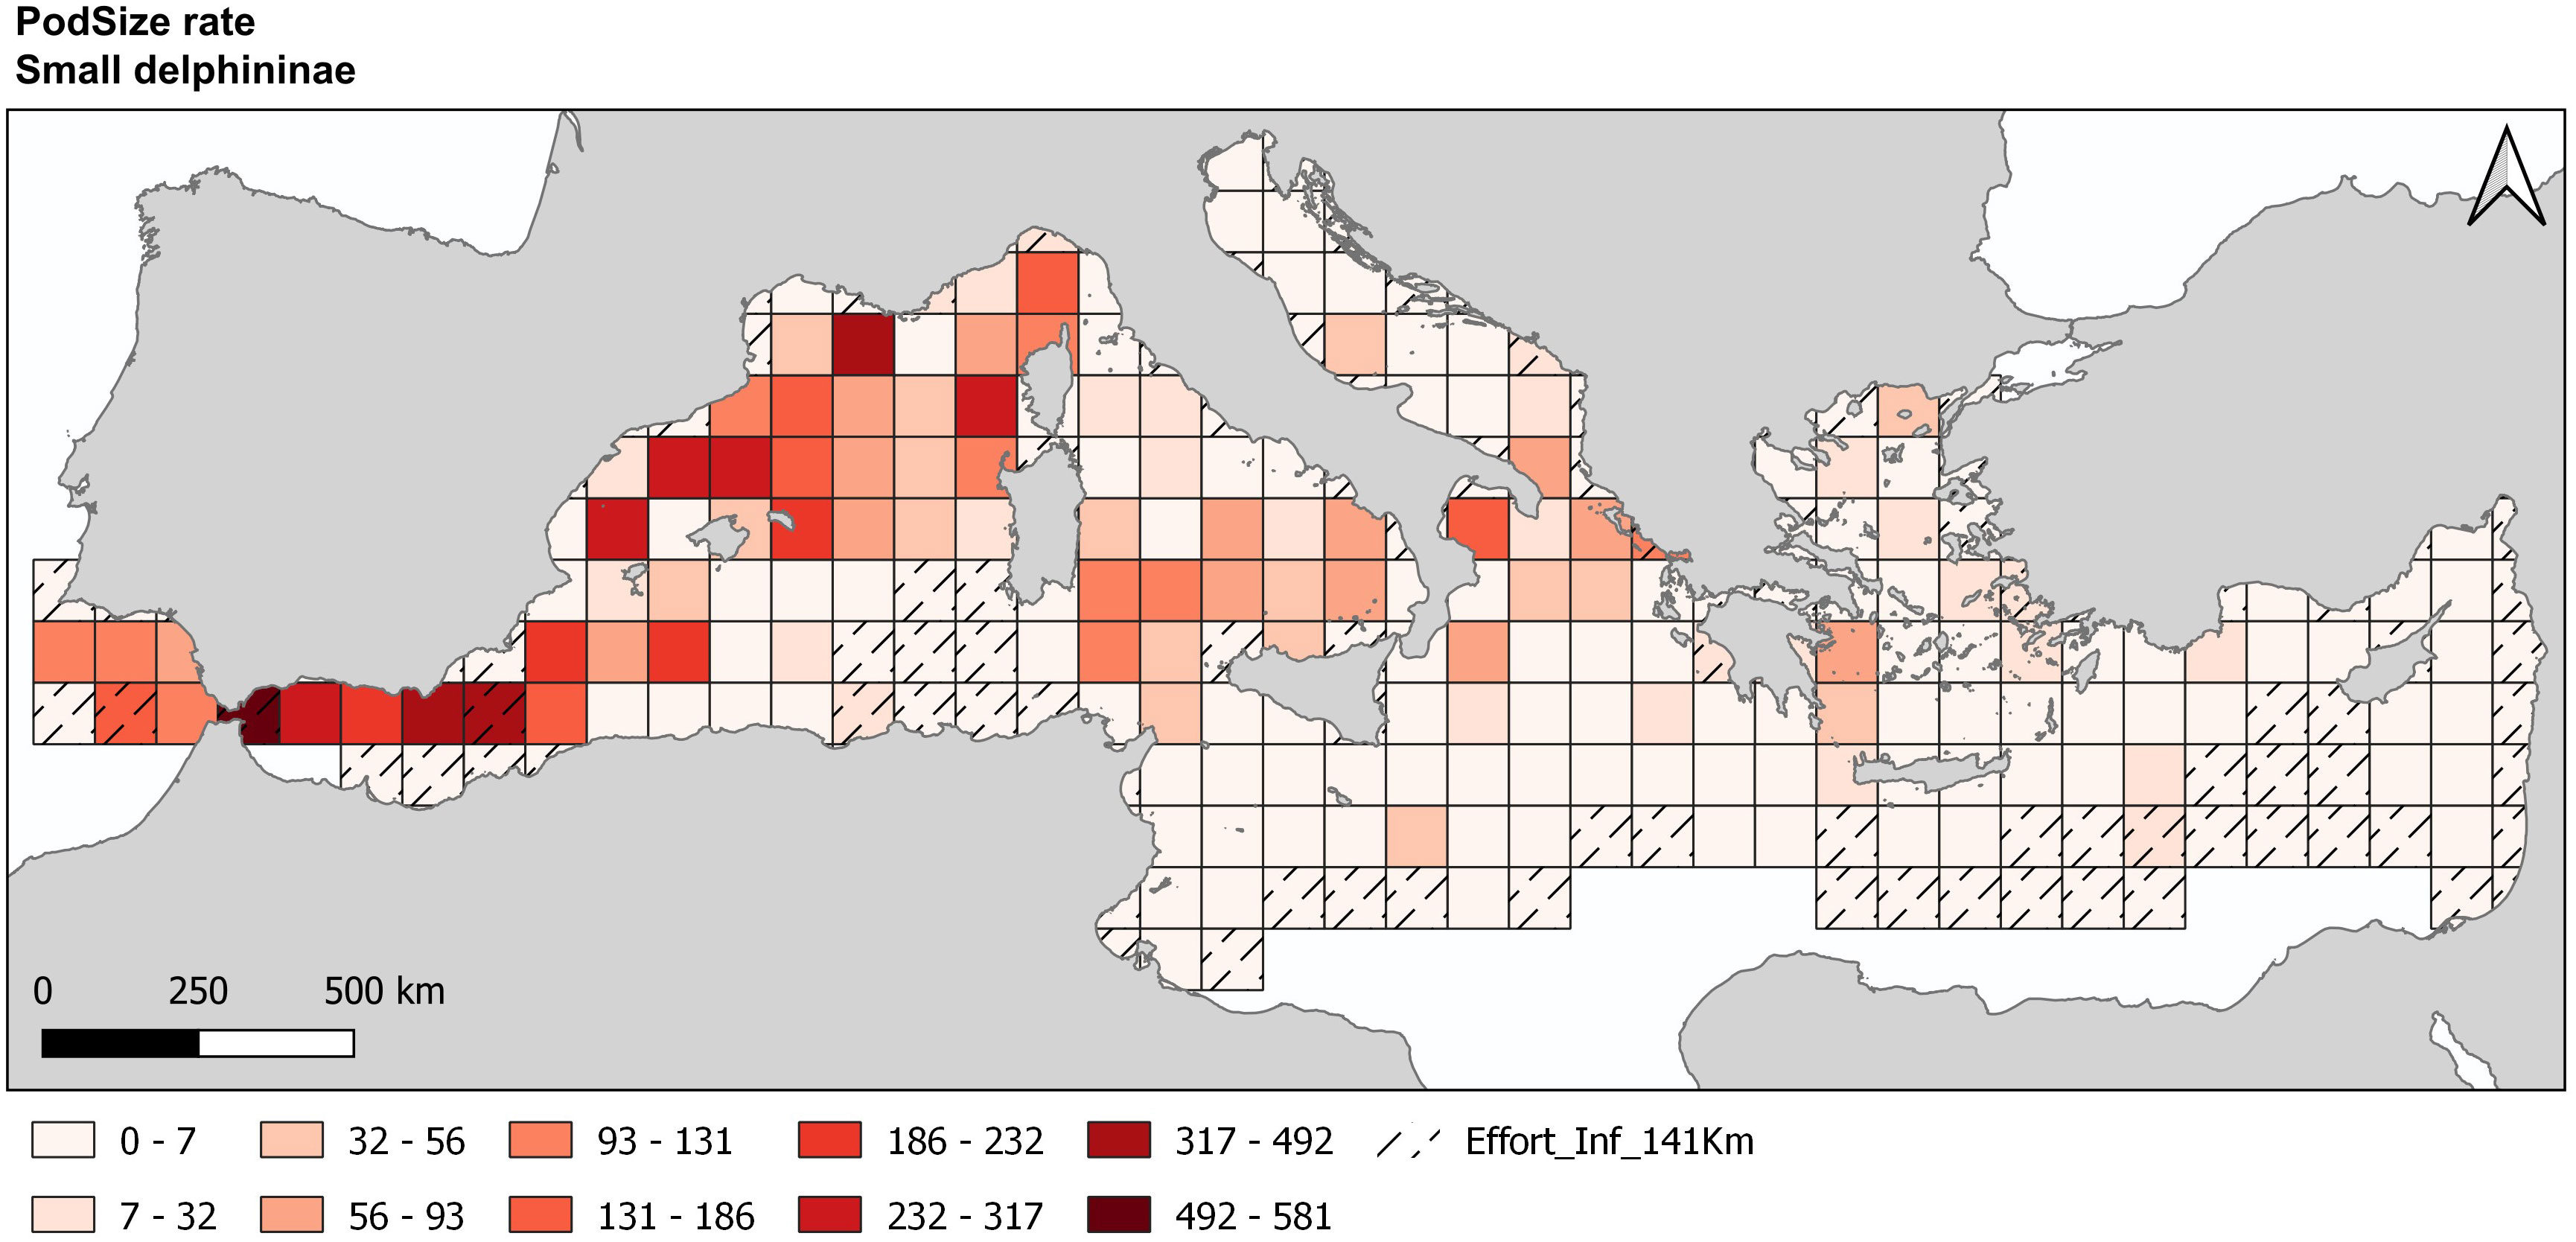
Figure 11 Data mapping with PodSize rate map for small delphininae sightings during ASI aerial survey through PelaSIG.
4 Conclusion
All steps using the PelaSIG plugin are summarised in Figure 12. The potential applications of GIS in the development of effective and sustainable conservation management strategies are many, but to fully realise the benefits of GIS, time and expertise must be allocated. The development of a tool to automate steps in a scientific workflow reduces the processing time, standardises methods and outputs, and facilitates multi-user collaboration. Choosing open-source technologies facilitates use by third parties and enables long-term collaborative development. In addition, the obligation of public agencies to make data available requires efforts to achieve data homogeneity and interoperability. This standardisation of data facilitated by the development of automation tools allows data to be used by several organisations.
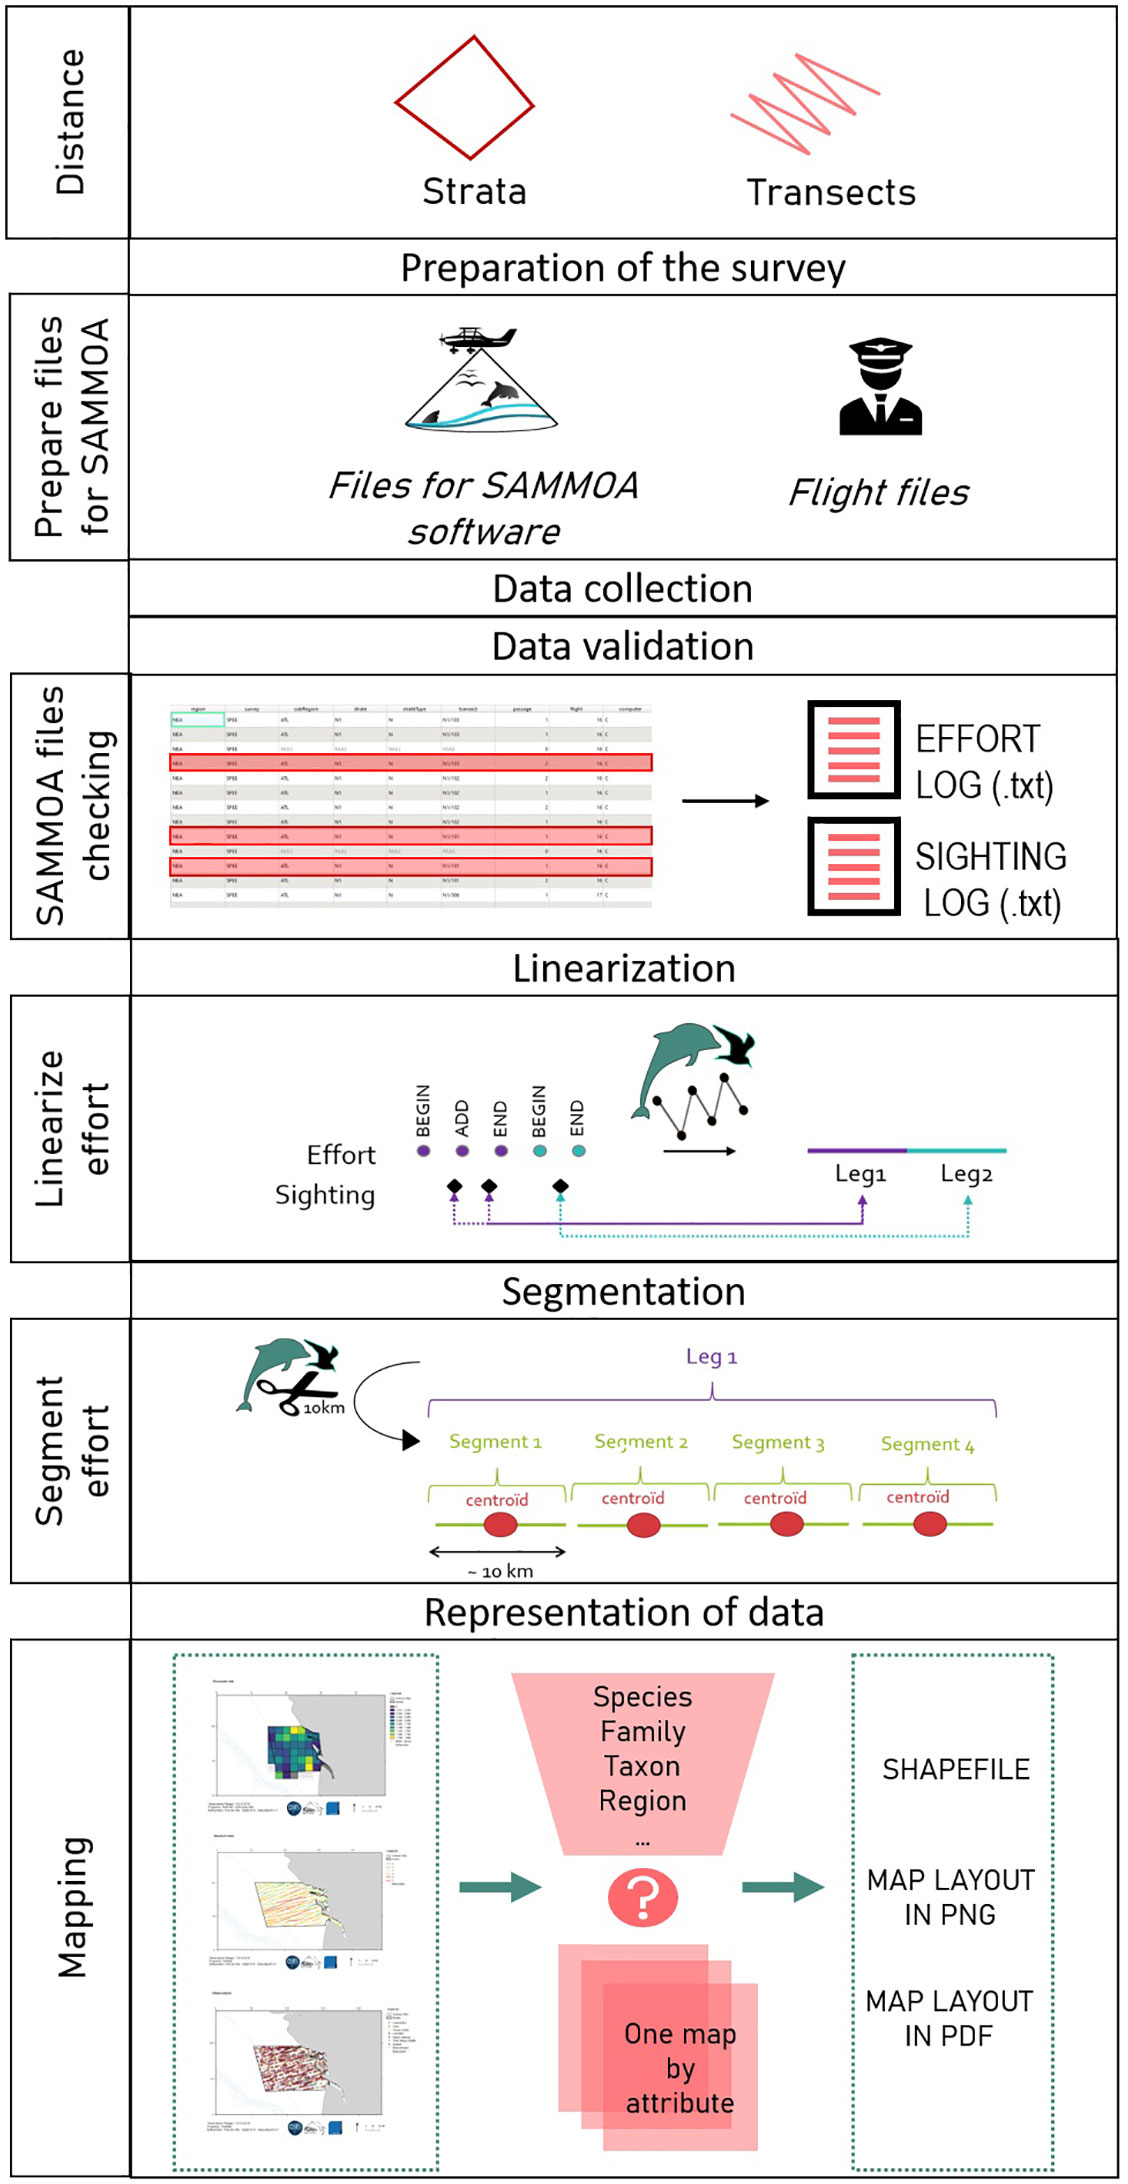
Figure 12 Steps of the entire processing chain of PelaSIG from survey preparation to mapping.
The PelaSIG plugin was initially developed for internal use, but its modular structure allows external use of most of the tools that make up the plugin, especially for teams already using SAMMOA. The linearisation tool and the mapping tool, which have already been tested by several colleagues from external organisations, are the most widely used, allowing for easy exploitation and visualisation of the data. The PelaSIG plugin is based on the SAMMOA data collection software, which is already used by several European partners, and will therefore be jointly distributed.
Current environmental challenges, such as biodiversity loss and climate change, require multi-scale and multi-temporal surveys and the need to standardise protocols as much as possible and especially in terms of data format. Here, we have proposed a set of open-source tools, the SAMMOA and the PelaSIG, to facilitate their collection, visualisation, processing, and dissemination.
Data availability statement
The PelaSIG plugin is available on https://www.observatoire-pelagis.cnrs.fr/tools/pelasig/. The dataset presented in this study is available on demand to ACCOBAMS (https://accobams.org/asi-data-access-request/).
Author contributions
MN: Conceptualization, Data curation, Investigation, Methodology, Project administration, Resources, Software, Validation, Visualization, Writing – original draft. AB: Validation, Visualization, Writing – review & editing. OJ: Software, Writing – review & editing. OC: Resources, Writing – review & editing. GD: Resources, Writing – review & editing. JS: Funding acquisition, Supervision, Writing – review & editing. BM: Resources, Writing – review & editing. SP: Resources, Writing – review & editing. SL: Conceptualization, Data curation, Methodology, Project administration, Resources, Software, Supervision, Validation, Visualization, Writing – original draft, Writing – review & editing.
Funding
The author(s) declare financial support was received for the research, authorship, and/or publication of this article. The time spend for this developpement receive financial support of the Office Français de la Biodiversité (OFB), Ministère français en charge de l'Environnement and the University of La Rochelle.
Acknowledgments
The plugin PelaSIG start from a student project conducted in 2018 by Manon Nivière, Oriane Penot and Adrien Gatineau from the professional degree in Cartography, Topography, and GIS from La Rochelle University.
Conflict of interest
The authors declare that the research was conducted in the absence of any commercial or financial relationships that could be construed as a potential conflict of interest.
Publisher’s note
All claims expressed in this article are solely those of the authors and do not necessarily represent those of their affiliated organizations, or those of the publisher, the editors and the reviewers. Any product that may be evaluated in this article, or claim that may be made by its manufacturer, is not guaranteed or endorsed by the publisher.
References
Buckland S. T., Anderson D. R., Burnham H. P., Laake J. L., Borchers D. L., Thomas L. (2001). Introduction to distance sampling: Estimating abundance of biological populations. (Oxford: Oxford University Press), 446.
Cañadas A., Pierantonio N., Araújo H., David L., Di Meglio N., Dorémus G., et al. (2023). Distribution patterns of marine megafauna density in the Mediterranean Sea assessed through the ACCOBAMS Survey Initiative. Front. Mar. Science. Special Issue. doi: 10.3389/fmars.2023.1270917
Castro P., Alonso J., Guerra C., Gonçalves J., Pôças I., Marcos B., et al. (2013). Novel tools to improve the management of spatial data quality in the context of ecosystem and biodiversity monitoring. GI_Forum, 1, 500–503. doi: 10.1553/giscience2013s500
Del Campo A. G. (2012). GIS in environmental assessment: a review of current issues and future needs. J. Environ. Assess. Policy Manage. 14 (01), 1250007. doi: 10.1142/S146433321250007X
Dorémus G., Laran S., Van Canneyt O. (2020). Guide méthodologique des campagnes d’observation aérienne de la mégafaune marine. Programme REMMOA (Outre-mer) & SAMM (Métropole), Cahier technique de l’Observatoire Pelagis. Observatoire Pelagis (UMS 3462 - La Rochelle Université et CNRS). Available at: https://www.observatoire-pelagis.cnrs.fr/wp-content/uploads/2021/08/GuideMethodoAerien2020.pdf.
Genu M., Authier M. (2020). “"Pelaverse",” in Pelagis observatory (UAR 3462 la rochelle university - CNRS). Available at: https://gitlab.univ-lr.fr/pelaverse.
Gilles A., Authier M., Ramirez-Martinez N. C., Araújo H., Blanchard A., Carlström J., et al. (2023). Estimates of cetacean abundance in European Atlantic waters in summer 2022 from the SCANS-IV aerial and shipboard surveys. : https://www.tiho-hannover.de/itaw/scans-iv-survey.
Hammond P. S., Gillespie D., Lovell P., Samarra F., Swift R., Macleod K., et al. (2014). Large scale surveys for cetaceans: Line transect assumptions, reliability of abundance estimates and improving survey efficiency – A response to MacLeod. Biol. Conserv. 170 (0), 338–339. doi: 10.1016/j.biocon.2014.01.016
Lambert C., Laran S., David L., Dorémus G., Pettex E., Van Canneyt O., et al. (2017). How does ocean seasonality drive habitat preferences of highly mobile top predators? Part I: The north-western Mediterranean Sea. Deep Sea Res. Part II: Topical Stud. Oceanography 141, 115–132. doi: 10.1016/j.dsr2.2016.06.012
Laran S., Authier M., Van Canneyt O., Dorémus G., Watremez P., Ridoux V. (2017a). A comprehensive survey of pelagic megafauna: their distribution, densities, and taxonomic richness in the tropical southwest Indian ocean. Front. Mar. Sci. 4 (139). doi: 10.3389/fmars.2017.00139
Laran S., Pettex E., Authier M., Blanck A., David L., Dorémus G., et al. (2017b). Seasonal distribution and abundance of cetaceans within French waters- Part I: The North-Western Mediterranean, including the Pelagos sanctuary. Deep Sea Res. Part II: Topical Stud. Oceanography 141, 20–30. doi: 10.1016/j.dsr2.2016.12.011
Laran S., Van Canneyt O., Dorémus G., Garrigue C., Berr T., Bourgogne H., et al. (2024). Who lives in the open sea? Distribution and densities of surfacing marine megafauna in three subregions of the South Pacific (New Caledonia, Wallis and Futuna, and French Polynesia). Pacific Conserv. Biol. 30, PC23023. doi: 10.1071/PC23023
Mannocci L., Monestiez P., Bolaños-Jiménez J., Dorémus G., Jeremie S., Laran S., et al. (2013). Megavertebrate communities from two contrasting ecosystems in the western tropical Atlantic. J. Mar. Syst., 111–112, 208-222. doi: 10.1016/j.jmarsys.2012.11.002
Miller D. L., Rexstad E., Thomas L., Marshall L., Laake J. L. (2019). Distance sampling in R. J. Stat. Software 89 (1), 1–28. doi: 10.18637/jss.v089.i01
Palomino J., Muellerklein O. C., Kelly M. (2017). A review of the emergent ecosystem of collaborative geospatial tools for addressing environmental challenges. Computers Environ. Urban Syst. 65, 79–92. doi: 10.1016/j.compenvurbsys.2017.05.003
Panigada S., Pierantonio N., Araújo H., David L., Di-Méglio N., Dorémus G., et al. (2023). The ACCOBAMS Survey Initiative: the first synoptic assessment of cetacean abundance in the Mediterranean Sea through aerial surveys. Front. Mar. Sci. 10, 1270513. doi: 10.3389/fmars.2023.1270513
Pettex E., Laran S., Authier M., Blanck A., Dorémus G., Falchetto H., et al. (2017). Using large scale surveys to investigate seasonal variations in seabird distribution and abundance. Part II: The Bay of Biscay and the English Channel. Deep Sea Res. Part II: Topical Stud. Oceanography 141, 86–101. doi: 10.1016/j.dsr2.2016.11.012
SAMMOA (2019). “"Système d'Acquisition des données sur la Mégafaune Marine par Observations Aériennes",” in Pelagis LRUniv-CNRS & Code lutin, vol. 1.1.2. .
Sela L., Salomons E., Housh M. (2019). Plugin prototyping for the EPANET software. Environ. Model. Software 119, 49–56. doi: 10.1016/j.envsoft.2019.05.010
Steiniger S., Weibel R. (2010). GIS Software: a description in 1000 word in Encyclopedia of Geography. Warf B. (Ed). Univ. Zurich e Zurich Open Repository Archive, London CB.
Keywords: QGIS, plugin, tools, line transect survey, spatial ecology, GIS, marine megafauna, Mediterranean Sea
Citation: Nivière M, Blanchard A, Jraifi O, Van Canneyt O, Dorémus G, Spitz J, Mansoux B, Panigada S and Laran S (2024) PelaSIG, a QGIS plugin for marine megafauna census: application to the aerial ACCOBAMS Survey Initiative dataset. Front. Mar. Sci. 10:1270335. doi: 10.3389/fmars.2023.1270335
Received: 31 July 2023; Accepted: 28 December 2023;
Published: 23 January 2024.
Edited by:
Mark Meekan, University of Western Australia, AustraliaReviewed by:
Dimitris Poursanidis, Foundation for Research and Technology Hellas (FORTH), GreeceSacha Viquerat, Alfred Wegener Institute Helmholtz Centre for Polar and Marine Research (AWI), Germany
Copyright © 2024 Nivière, Blanchard, Jraifi, Van Canneyt, Dorémus, Spitz, Mansoux, Panigada and Laran. This is an open-access article distributed under the terms of the Creative Commons Attribution License (CC BY). The use, distribution or reproduction in other forums is permitted, provided the original author(s) and the copyright owner(s) are credited and that the original publication in this journal is cited, in accordance with accepted academic practice. No use, distribution or reproduction is permitted which does not comply with these terms.
*Correspondence: Sophie Laran, c29waGllLmxhcmFuQHVuaXYtbHIuZnI=
†These authors have contributed equally to this work