 Kristian Spilling1,2*
 Mirian Arellano San Martín3Mira Granlund1
 Kai G. Schulz4Carsten Spisla3Mari Vanharanta1,5
 Silvan Urs Goldenberg3
 Ulf Riebesell3
- 1Marine and Freshwater Solutions, Finnish Environment Institute, Helsinki, Finland
- 2Centre for Coastal Research, University of Agder, Kristiansand, Norway
- 3Biological Oceanography, GEOMAR Helmholtz Centre for Ocean Research Kiel, Kiel, Germany
- 4Faculty of Science and Engineering, Southern Cross University, Lismore, NSW, Australia
- 5Tvärminne Zoological Station, University of Helsinki, Hanko, Finland
Ocean artificial upwelling has been suggested to boost primary production and increase harvestable resources such as fish. Yet, for this ecosystem-based approach to work, an effective energy transfer up the food web is required. Here, we studied the trophic role of microzooplankton under artificial upwelling via biomass and community composition as well as grazing rates on phytoplankton. Using mesocosms in the oligotrophic ocean, we supplied nutrient-rich deep water at varying intensities (low to high) and addition modes (a Singular large pulse or smaller Recurring pulses). Deep-water fertilization created a diatom-dominated bloom that scaled with the amount of inorganic nutrients added, but also Synechococcus-like cells, picoeukaryotes and nanophytoplankton increased in abundance with added nutrients. After 30 days, towards the end of the experiment, coccolithophores bloomed under recurring upwelling of high intensity. Across all upwelling scenarios, the microzooplankton community was dominated by ciliates, dinoflagellates (mixo- and heterotrophic) and radiolarians. Under the highest upwelling intensity, the average grazing rates of Synechococcus-like cells, picoeukaryotes and nanophytoplankton by microzooplankton were 0.35 d-1 ± 0.18 (SD), 0.09 d-1 ± 0.12 (SD), and 0.11 d-1 ± 0.13 (SD), respectively. There was little temporal variation in grazing of nanophytoplankton but grazing of Synechococcus-like cells and picoeukaryotes were more variable. There were positive correlations between abundance of these groups and grazing rates, suggesting a response in the microzooplankton community to prey availability. The average phytoplankton to microzooplankton ratio (biovolume) increased with added deep water, and this increase was highest in the Singular treatment, reaching ~30 (m3 m-3), whereas the phytoplankton to total zooplankton biomass ratio (weight) increased from ~1 under low upwelling to ~6 (g g-1) in the highest upwelling but without a difference between the Singular and the Recurring mode. Several smaller, recurring upwelling events increased the importance of microzooplankton compared with one large pulse of deep water. Our results demonstrate that microzooplankton would be an important component for trophic transfer if artificial upwelling would be carried out at scale in the oligotrophic ocean.
Introduction
Ocean primary production approximately equals primary production on land and forms the basis for higher trophic levels and harvestable marine resources (Field et al., 1998). In the ocean, we are currently harvesting too much of high trophic level resources, resulting in depleted fish stocks and impoverished biodiversity (FAO, 2022). With a global population recently exceeding 8 billion humans and still growing, we need to find new sources of food with minimal environmental footprint.
Vast areas of the ocean are oligotrophic and primary production is limited by inorganic nutrients. However, the ocean interior contains high concentrations of inorganic nutrients below the upper stratified surface water layer. That makes these nutrients mostly inaccessible for the microscopic phytoplankton that make up the bulk of ocean primary production. One way the nutrients become accessible is through physical mixing events at different scales (e.g. Gupta et al., 2022). This mixing is forecasted to decrease with warmer surface temperatures of the ocean as it increases the density difference between the upper ocean and underlying water layers. This will reduce the amount of inorganic nutrients reaching the sunlit surface and primary production limited by its availability (Moore et al., 2018).
A prominent form of mixing is natural upwelling. Wind and currents in combination with the earth’s rotation (Coriolis force) may push coastal surface waters offshore and this surface water is replaced with upwelling deep water. Due to the inorganic nutrients in the deep water, upwelling areas are some of the most productive areas of the ocean and crucial for fisheries. With large regional, seasonal and temporal differences in upwelling, the effect of global warming is difficult to project but seems to be dependent on the location (Varela et al., 2015), but there is still a lot of uncertainty about how upwelling will be affected by global warming (e.g. Bograd et al., 2023).
With the importance of upwelling for productivity, and many fisheries being close to, or exceeding the carrying capacity, the prospect of artificial upwelling has been suggested to first increase primary productivity and then harvestable resources (Kirke, 2003). The first part of this assumption is reasonably well established. If the surface of the oligotrophic ocean is fertilized with deep water, there will be an increase in phytoplankton biomass (e.g. Sommer et al., 2002). This does not, however, automatically transfer to higher trophic levels such as fish: first, each trophic level reduces the amount of biomass available for higher trophic levels (Eddy et al., 2021); second, there could be a mismatch between primary producers and the grazing community e.g. increasing export rather than trophic transfer (Spilling et al., 2018); third, the food quality of the phytoplankton varies and may not be very suitable, or even toxic to higher trophic levels (Ianora and Miralto, 2010; Thomas et al., 2022).
The most effective route resulting in increased fisheries would be the classical food web model where large primary producers (e.g. diatoms) are grazed by mesozooplankton (e.g. copepods), and pelagic fish feeding on them. This type of short food chain with a close match between primary producers and grazers supports some of the richest fisheries in the world (Chavez and Messié, 2009). In contrast, food webs in the oligotrophic ocean typically have longer food chains, with the microbial loop being relatively more important and where microzooplankton play a major role in the trophic transfer (Calbet, 2008). Microzooplankton such as ciliates have a wide range of preferred grazing prey and could play an integral part in trophic transfer during artificial upwelling in particular in cases where there is a mismatch between primary producers and mesozooplankton grazers. Yet, the role of microzooplankton during artificial upwelling needs to be investigated before any conclusion can be made.
Technically, there are different ways artificial upwelling of deep water could be introduced to the surface. The introduction of deep water could either be stationary at one location or be placed on a floating platform that moves with a water parcel. This difference will have implications for the input of nutrient-rich water. Water masses moving past a stationary upwelling point will get one addition of deep water, whereas using a platform that floats with the water parcel would add a continuous stream of nutrient-rich water to planktonic communities in that water parcel. A single addition would presumably make one large bloom of primary producers whereas several additions of nutrients would produce a prolonged bloom with a less pronounced biomass peak. The different modes of upwelling could potentially affect the match/mismatch between primary producers and the grazers, but what effect, if any, different modes of artificial upwelling have on trophic transfer is still an open question.
Here we investigate the effect of upwelling on planktonic biomass, community, and trophic transfer. We set up a mesocosm experiment and manipulated both the amount of deep water added to the mesocosms and the mode of addition, comparing one singular addition with the same amount of inorganic nutrients added as several recurring additions.
Materials and methods
Experimental setup
The mesocosm experiment was set up off Gran Canaria (Gando Bay; 27° 55.673’ N, 15° 21.870’ W). The mesocosm bags, each containing ~38m3, were set up and closed on 5th November 2018. The bags were circular (Ø = 2 m) and extended down to 15 m depth. At the bottom, there were conical-shaped sediment traps that enabled the collection of settling material. Further description of the bags can be found in Riebesell et al. (2013).
Nine mesocosm bags were used: one was left as an untreated control, and eight received different additions of deep water. These additions were done as a gradient, either in a single addition or eight smaller additions that in total equaled the nutrient gradient of the respective single addition (Table 1).
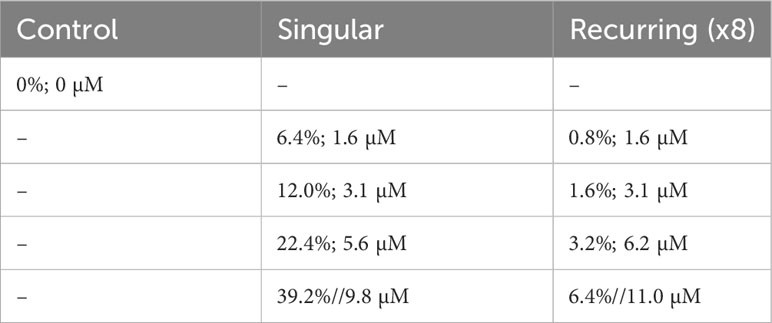
Table 1 The experimental setup with the percent original water exchanged with deep water during the addition(s), and the total addition of nitrate (sum of all additions in the Recurring treatment).
Deep water was collected on two occasions (26 Oct and 28 Nov) using a deep-water collector, which, in short, is a 100 m3 bag that is filled at the desired depth and brought to the surface (Taucher et al., 2017). The original plan was to collect deep-water from 600 m depth, but due to technical difficulties, the water collected was from ~300 m depth on both occasions. As this water did not contain the targeted concentration of inorganic nutrients, we added nitrate, phosphate and silicate to a final concentration of 25 µmol NO3 L-1, 1.38 µmol PO4 L-1 and 12.1 µmol DSi L-1 respectively. A more detailed description and outline of experiment events can be found in Baumann et al. (2021).
Sampling
Samples were taken every second day with an integrating water sampler (HYDRO BIOS), which collected an integrated sample from 0 – 13 m depth. The samples were stored in polycarbonate containers inside a cool box until they were processed. Samples were taken in the morning and were back in the laboratory around noon.
The plankton community was sampled and counted directly (no fixatives used) with a FlowCam (FluidImaging) using 4x magnification and a 300 µm flow cell. The camera was set to take 13 frames s-1 and all particles >3 µm were captured. Each sample was run for 10 min using the volumetric counting mode, equaling 10.1 mL of counted volume. Example of images taken are presented in the Supplementary Figure S1.
Microzooplankton samples were fixed with acidic Lugol’s solution and stored in a fridge until counting using a Utermöhl chamber (20 or 50 mL depending on how dense the sample was). Samples were settled overnight at room temperature before enumeration with an inverted microscope (Leitz labovert) using a 20x objective.
Mesozooplankton was collected with vertical net hauls with different sized Apstein nets (55/500 µm mesh size, ø 17/50 cm, HYDRO-BIOS Kiel) every four days. Mesozooplankton organisms were counted and categorized into different size classes (55-200 µm, 200-500 µm, > 500 µm). Based on their taxonomic identity, the most abundant species were handpicked, dried at 60°C for 24 h, packed into tin capsules and stored dry in a desiccator (GEOMAR Kiel, Thermo Scientific IRMS). Further details of sample processing can be found in Spisla (2021). Carbon content was determined by mass-spectrometry (GEOMAR Kiel, Thermo Scientific IRMS). Combining the carbon content of key species, covering different size groups, we converted the total abundance counts to mesozoplankton biomass in µg C L-1.
For the comparison of ratios between different groups we also made a conversion of the biovolume of phytoplankton from the measured seston carbon concentration presented in Baumann et al., 2021. These samples were filtered, mesozooplankton removed, and the carbon content determined with a CN analyzer (Euro EA-CN, HEKAtech GmbH, Wegberg, Germany). Assuming this represented the phytoplankton, microzooplankton and detritus determined with the FlowCam, we calculated an average conversion factor of 50 µg C mm-3 to get a carbon estimate of phytoplankton, but noted some variability in this number with higher values outside the main biomass peaks. For microzooplankton, we used a conversion factor of 190 µg C mm-3 (Putt and Stoecker, 1989).
Fresh samples were run through a flow cytometer (Cytosense, Cytobuoy) using two different flow rates 1.34µl s−1 (180 s) and 10.86 µl s−1 (300 s). The first flowrate was used to determine Synechococcus-like cells, and the second to determine larger phytoplankton species. The flow cytometer was calibrated by running MQ water for various periods and measuring the mass loss with a high-precision balance, allowing the determination of flow rates from the slope of mass loss against time. The photomultiplier tube settings were 65 for sideward scatter (SWS), 90 for green/yellow (FLY), 90 for orange (FLO) and 93 for red fluorescence (FLR), and the trigger was set to FLR7 for the prokaryote and to FLR17 for the larger phytoplankton setting. Clustering of the data was performed in Cytoclus (version 4.8.2.8), using exclusive sets (Marie et al., 1999). Distinct clusters of Synechococcus-like cells were identified using average FLR against total FLY. Total FLR against total FLO was used to cluster picoeukaryotes and total FLR against total SWS was used to identify nanophytoplankton. More details on the flow cytometer methods including data on additional groups can be found in Schulz et al. (in prep).
Grazing rates
Grazing rates were determined by setting up dilution experiments (Landry and Hassett, 1982). We did dilution experiments on every sampling day, but due to time constraints only for two mesocosms: Singular extreme and Recurring extreme.
Samples (5 L) were taken by the integrating water sampler. Half of the sample was filtered using a peristaltic pump and 0.2 µm filter cartridge (Pall). Care was taken to reduce shear stress in the sample water, e.g. by always homogenizing samples by gentle rotation of the bottle. The experiment was set up using 500 mL Tissue Culture flasks (Greiner), filled with 400 mL, leaving some headspace. The dilution series was set up using nine TC flasks. No dilution (100% sample water), and the most diluted (12.5% sample water + 87.5% 0.2 filtered water) were done in triplicates. In addition, bottles with 25%, 50% and 75% sample water, mixed with 0.2 µm filtered water of the same origin were set up.
Inorganic nutrients were added to the dilution series in F/20 medium concentration (Guillard and Ryther, 1962). The bottles were set up in a water reservoir with flow-through seawater keeping close to in situ temperature (20.7 - 21.5°C). The bottles were stored in random locations inside an open box to keep them in place. The box was submerged in the flow-through reservoir and covered with one layer of blue foil (172 Lagoon Blue, Lee filters) to bring the light spectrum closer to the one in the mesocosm bags. These incubations were done in the same way as the primary production measurements presented by Ortiz et al. (2022a); Ortiz et al. (2022b).
The counting of phytoplankton was done with a flow cytometer (Cube 8, Partec) with a connected autosampler taking samples from 96 well plates. The flow cytometer had two lasers (488 and 561 nm) and recorded forward and side scatter in addition to three fluorescence channels representing chlorophyll a (Chl a; 670/40 nm detection), phycoerythrin (610/30 nm) and phycocyanin (661/16 nm) pigment fluorescence. The original count was done right after the dilution series was set up and again after 24 h. Gating of the phytoplankton was done using FCS Express 6 software and main groups were identified as described above. The larger eukaryotes and coccolithophores were also excluded as we did not have the option of mounting the incubation bottles on a plankton wheel and these groups likely sank rapidly to the bottom of the incubation bottles.
Data analysis
Comparisons of treatments were done using added inorganic nitrate as explanatory variables and the mean of repeated measures of plankton biomass as response variables. Linear regressions with accompanying statistics were done in SigmaPlot 15. Comparisons between two groups were done with a Student’s pairwise t-test. The effect of the treatment and temporal development on the microzooplankton community was also determined using ordination scores of the first and second axis of a nonparametric multidimensional scaling (NMDS) estimated with the metaMDS function in the vegan package in R software (Oksanen et al., 2022).
Results
Biomass
The addition of deep water stimulated a bloom of diatoms in the mesocosms, with the highest concentration in the singular extreme addition of deep water (Figures 1A, B). The largest abundance peak of diatom chains developed in the Singular extreme treatment on days 11-13, a week after the addition of deep water. Smaller diatom peaks occurred in Singular high and medium. In the Recurring extreme treatment, the diatom abundance peak developed later and was more prolonged compared with the Singular treatment (Figure 1B). In the Recurring high and medium treatments there was more diatom biomass that declined towards the very end of the experiment. Also, towards the end of the experiment, there was a bloom of coccolithophores that occurred in the Recurring extreme and, to a smaller extent, in the Recurring high treatment (Figure 1C).
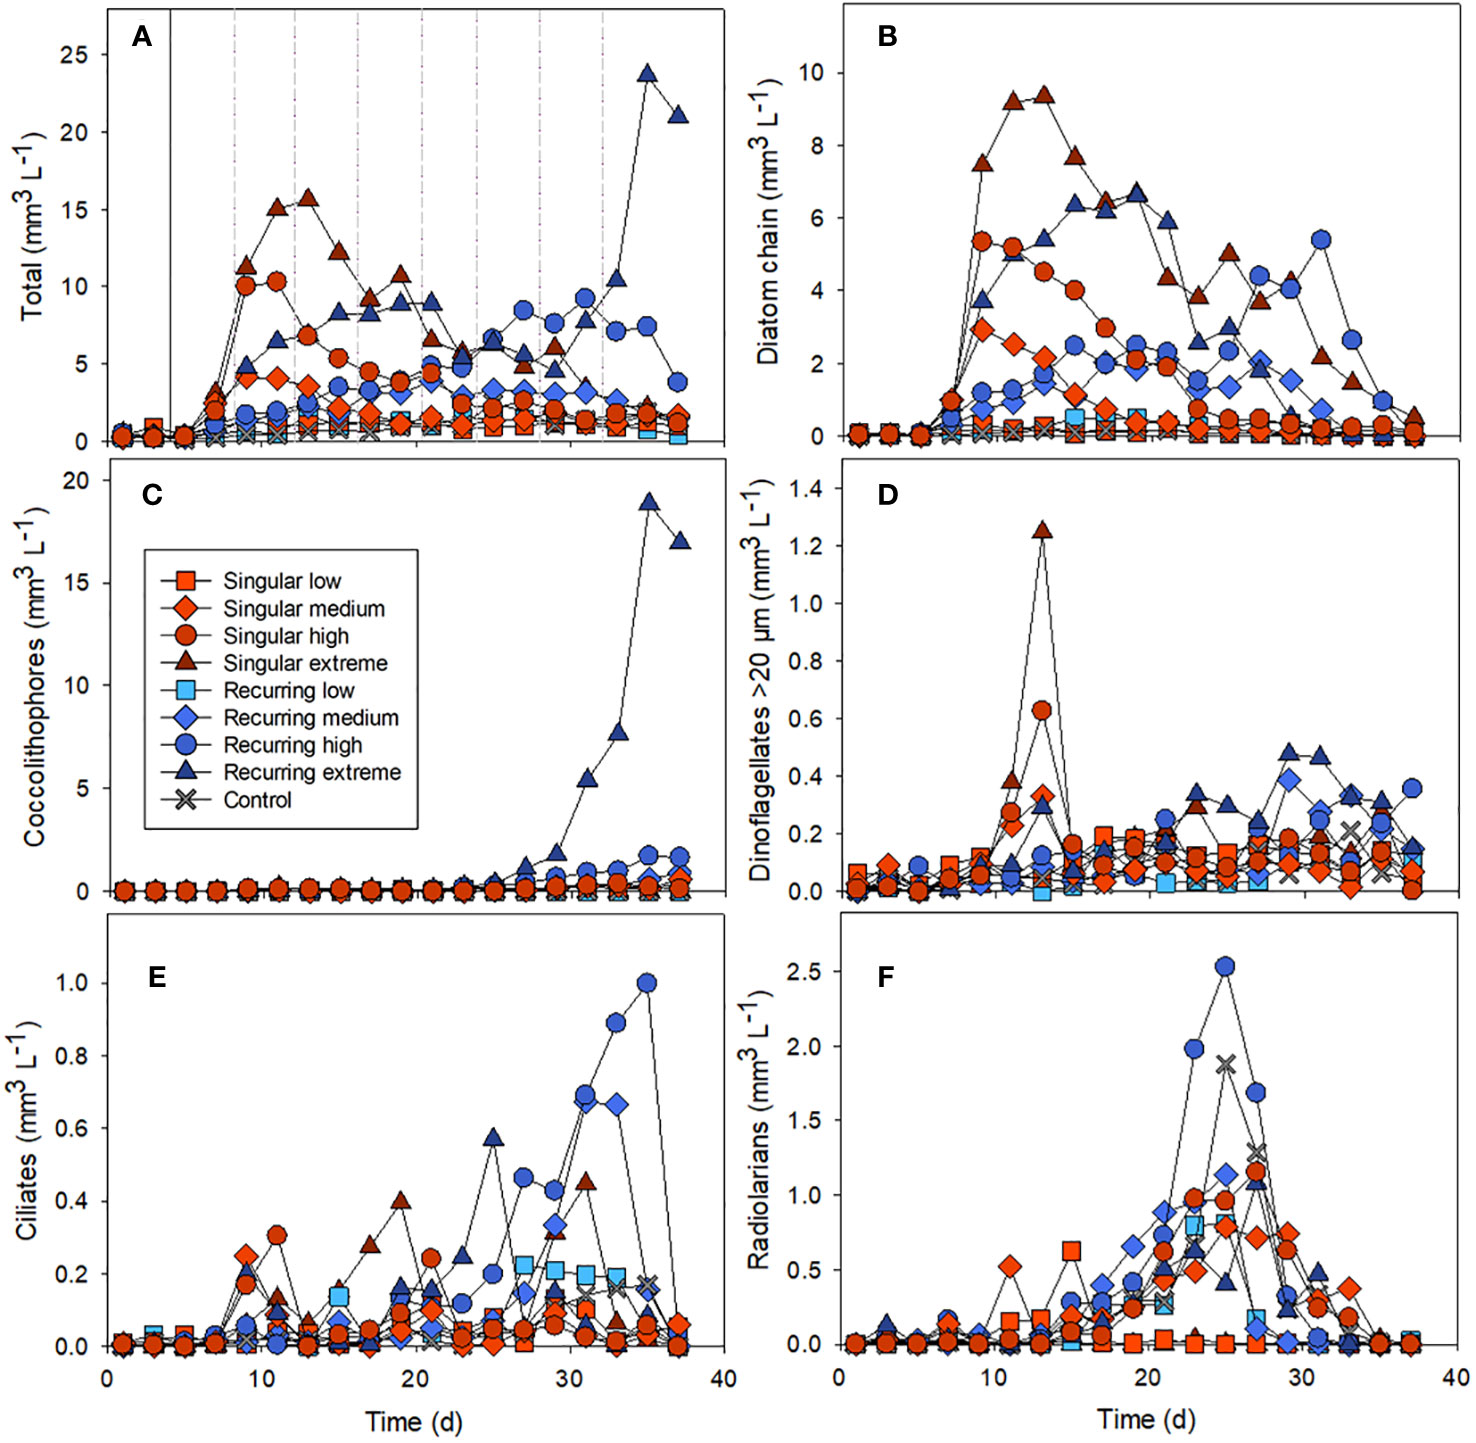
Figure 1 The biovolume over time of different nano- and microplankton groups: the total biovolume of all nano and microplankton (A), diatom chains (B), coccolithophores (C), dinoflagellates >20 µm (D), ciliates (E) and radiolarians (F). Example images used in the biovolume determination can be found in the Supplementary Material (Supplementary Figure S1). The solid vertical line in Figure 1A denotes the time of addition of deep water in both singular and recurring treatments and the dashed vertical lines are addition of deep water in the Recurring treatment (similar for all graphs).
Microzooplankton were dominated by ciliates, heterotrophic/mixotrophic dinoflagellates and radiolarians (Figures 1D–F). For ciliates, the abundance peaks varied temporally in the different mesocosms, with a first biomass peak at the same time as the diatom peak in the Singular high and medium treatments. This was followed by a biomass peak in the Singular extreme on day 19 followed by peaks in the Recurring extreme on day 25 and in the Recurring medium and high on days 31 and 25 respectively. There was also a second peak in ciliates biomass in the Singular extreme on day 31.
Large dinoflagellates (> 20 µm) had a peak at day 13 in the Singular extreme and high, with smaller abundance peaks in Singular medium and Recurring extreme at this time point. This dinoflagellate group became more abundant towards the end of the experiment (after day 25) in the Recurring extreme, high and medium treatments.
Radiolarians increased in biomass in most of the mesocosms with a peak around day 25, with a notable exception of Singular extreme where they were almost absent throughout the experiment. Also, in Singular low, radiolarians were at very low biomass during the main peak in other mesocosms, but there was a lower peak in this mesocosm at day 15.
There was also a clear effect of the deep-water addition on the smaller phytoplankton (Figure 2). Synechococcus-like cells increased in all mesocosm bags including the control, a week after the closure of the bags, but had the highest initial abundance peaks in the Singular treatment, in particular in Singular extreme and high. Picoeukaryotes and nanophytoplankton also increased rapidly in these same treatments after the addition of the deep water followed by lower abundance in all treatments after the initial peak.
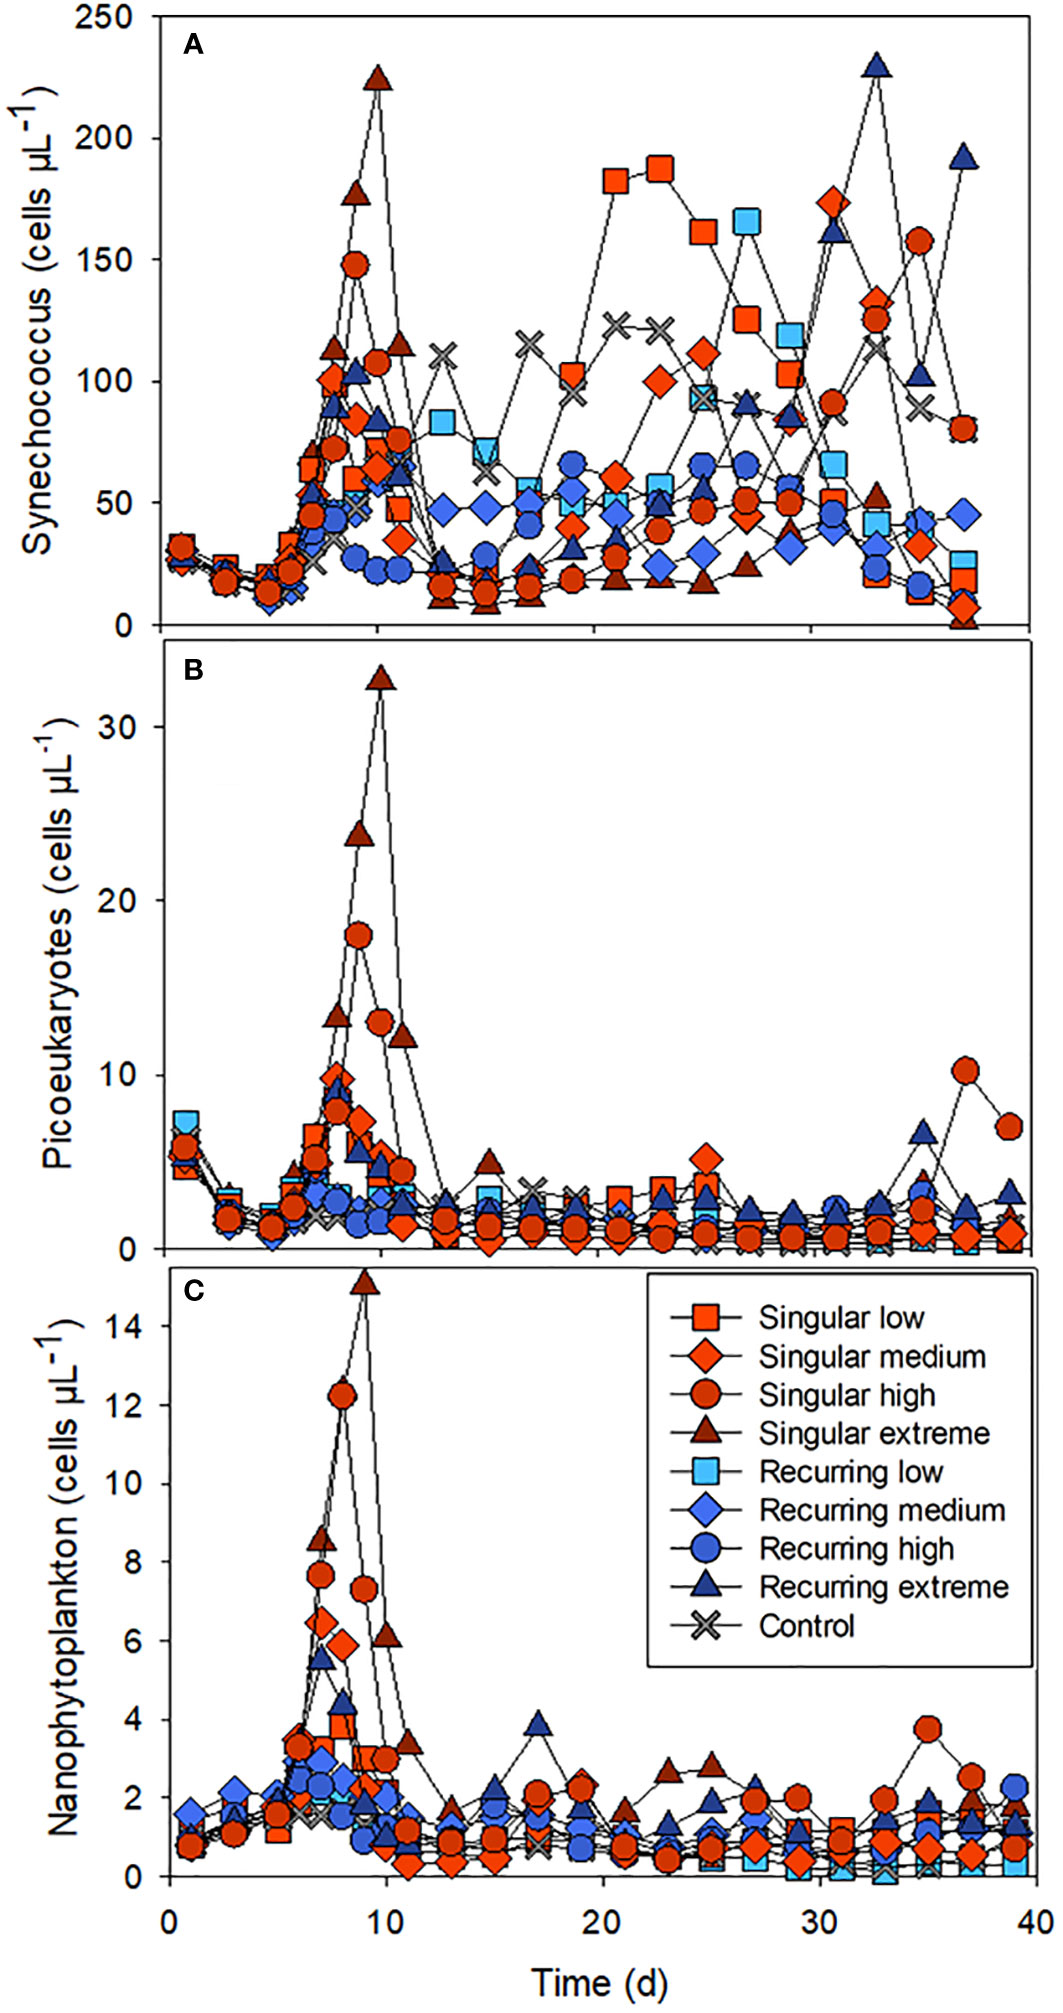
Figure 2 The abundance of Synechococcus-like cells (A), picoeukaryotes (B) and nanophytoplankton (C) during the experiment. See Figure 1A for the timing of the deep-water addition.
The development in the mesozooplankton biomass varied between 10 to 20 µg C L-1 at the beginning of the experiment (Figure 3). There was one exception, Singular low, where the biomass was much lower due to the presence of small fish (data not shown). The highest peak of mesozooplankton was in the Singular high reaching 57 µg C L-1 (Figure 3).
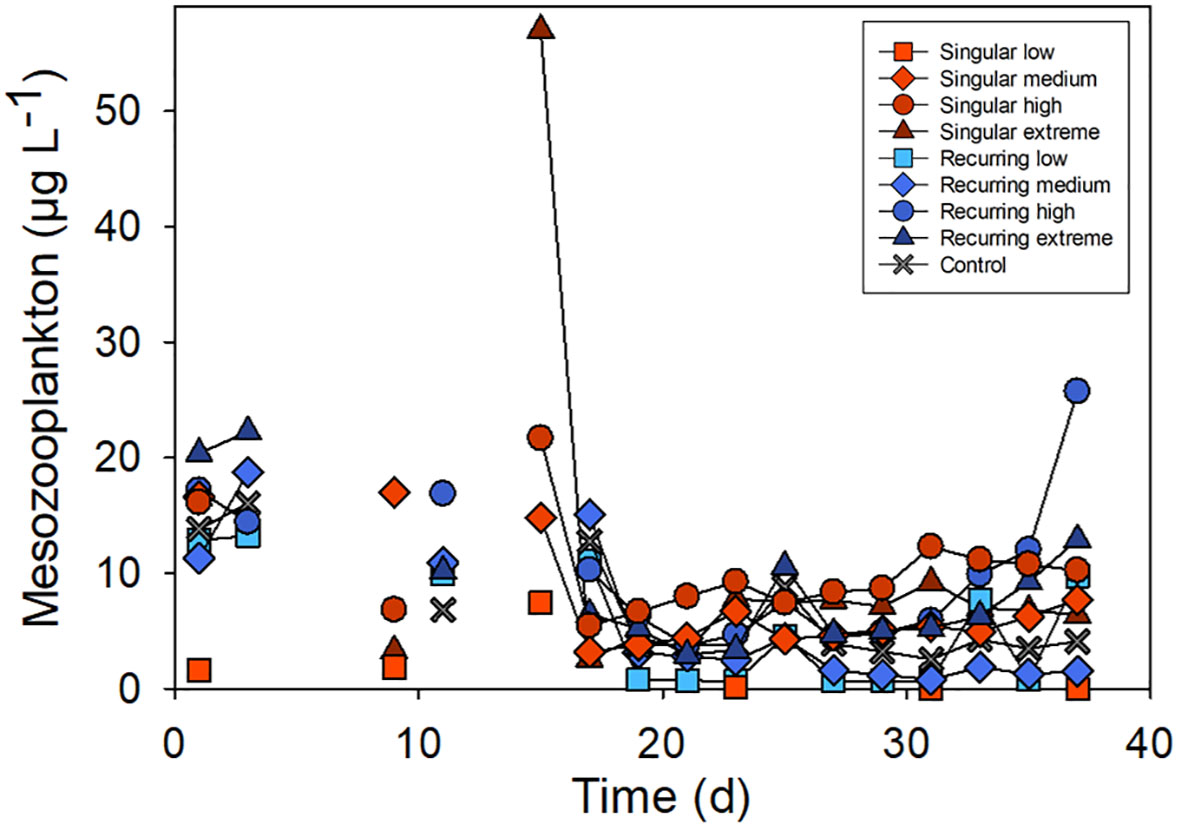
Figure 3 Temporal development in the total mesozooplankton biomass. See Figure 1A for the timing of the deep-water addition.
Community composition
There was an effect of both deep-water addition and temporal development in the microzooplankton community composition (Figure 4). Ciliates were dominated by Strobilidium sp., Strombidium sp. and the tintinnids Amphorides sp. and Dadayiella sp. during the first bloom of phytoplankton followed by an abundance peak in the tintinnid Eutintinnus sp. in the treatment with added deep water midway in the experiment. The main dinoflagellates present were Protoperidinium spp, Gymnodinium sp, Gyrodinium sp. Scrippsiella sp., Peridiniella sp. Heterocapsa spp and Ceratium spp. (Figure 4; Supplementary Table S1). Protoperidinium spp were mostly present in the Singular treatments and Recurring extreme, whereas some of the other dinoflagellates like Gymnodinium sp. increased in all mesocosms during the first half of the experiment. Scrippsiella sp. had the highest abundance peaks in the two extreme additions.
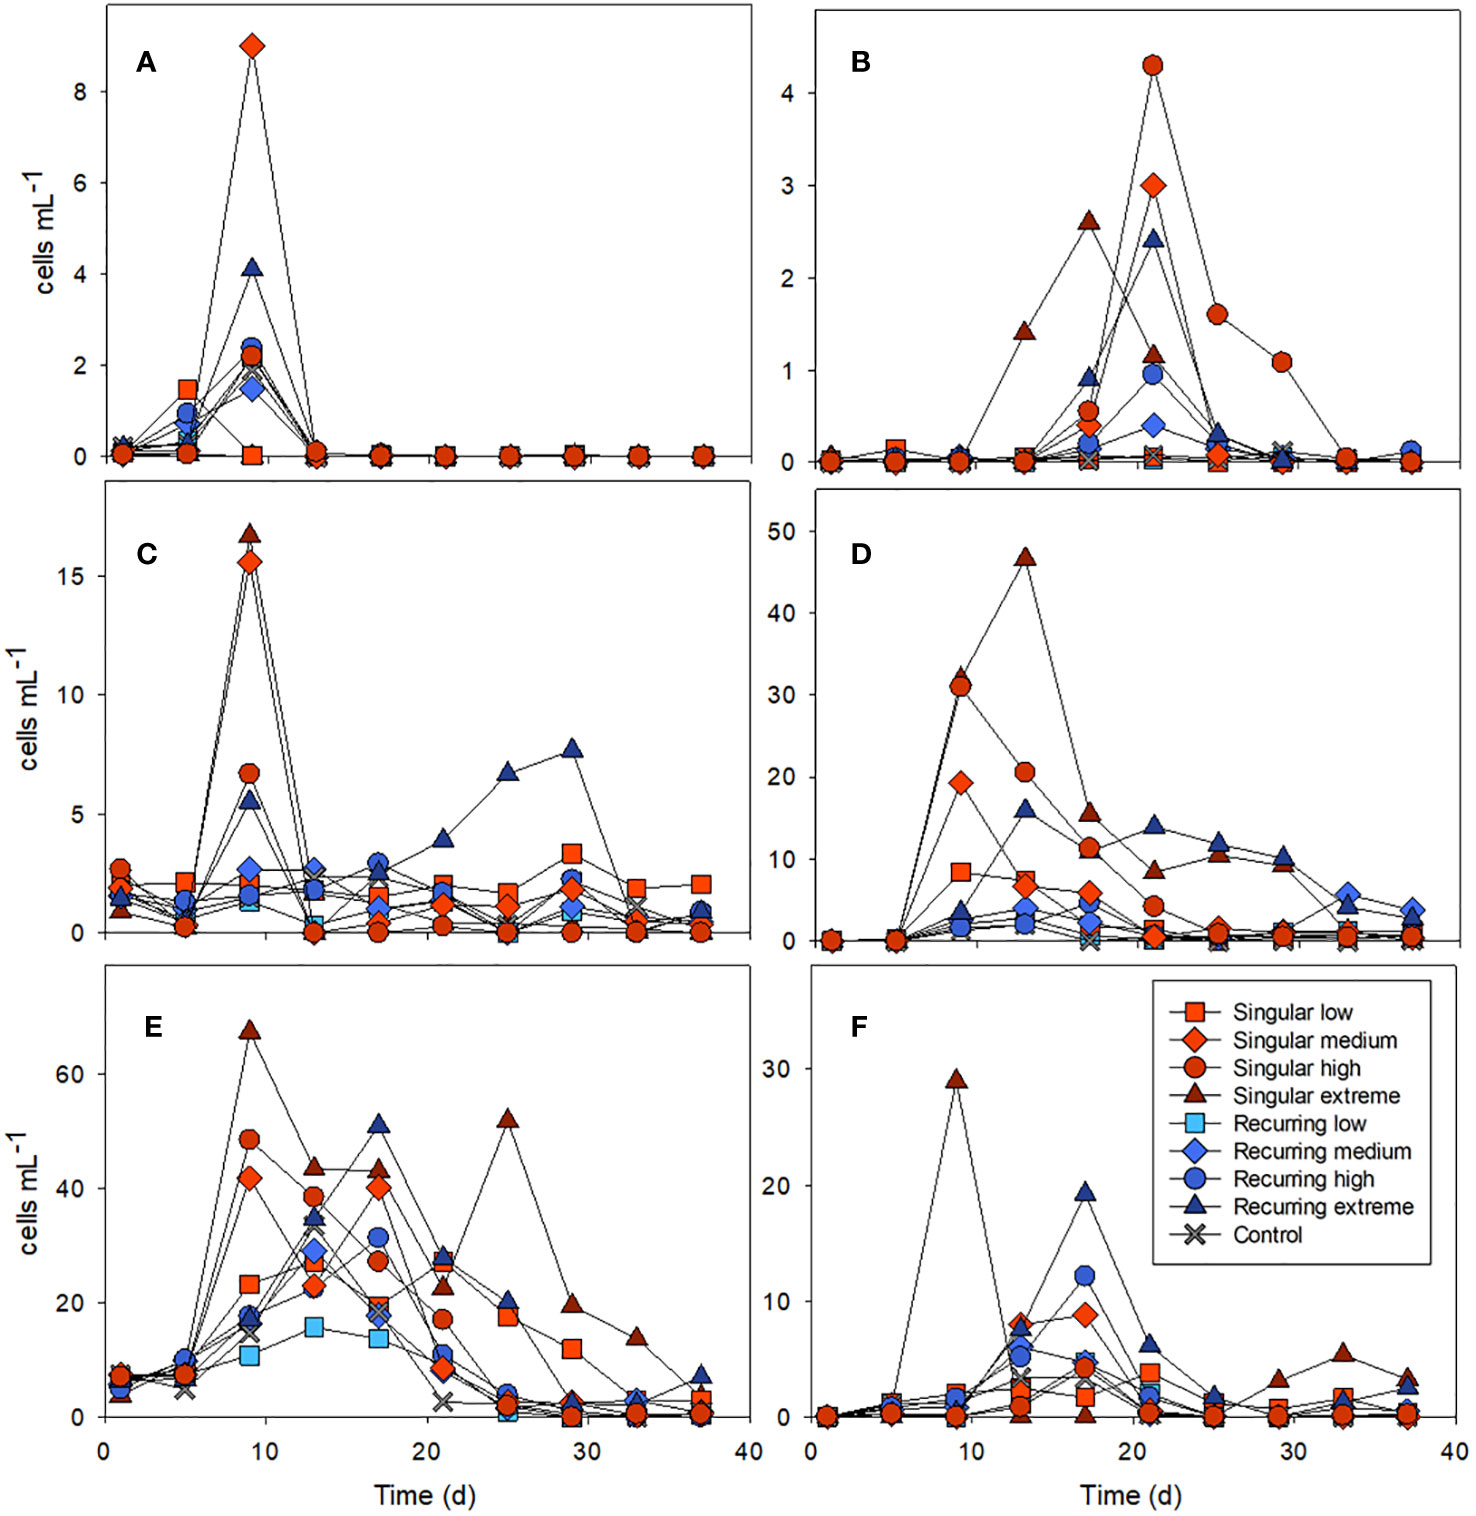
Figure 4 Examples of the abundance of key microzooplankton groups: ciliates combined Amphorides sp. plus Dadayiella sp. (A); Eutintinnus sp (B), combined Strobilidium sp. plus Strombidium sp (C), and dinoflagellates Protoperidinium sp (D), Gymnodinium (E) and Scrippsiella sp (F). Abundance of all counted groups can be found in the Supplementary Table S1. See Figure 1A for the timing of the deep-water addition.
Using the microscopy abundance counts as input variables, a nonparametric multidimensional scaling plot showed that the temporal development was more important than the treatment effects for the microzooplankton community composition, but the Singular high and Singular extreme treatments were positioned a bit apart from the other treatments (Supplementary Figure S2).
There was a positive correlation between deep water added and ciliate biomass with the exception of the Recurring extreme treatment which had less ciliate biovolume than Recurring high treatment (Figure 5). The same positive correlation was found for heterotrophic dinoflagellates in the Recurring treatment, whereas the radiolarian biovolume was independent of the deep-water addition. Overall, the biovolume of microzooplankton was higher in the Recurring compared with the Singular treatment (Student’s paired t-test; p = 0.02; Supplementary Figure S3). The mesozooplankton community was dominated by different copepods, but with a large peak of Oikopleura in some of the Singular treatments and in the Recurring high treatment towards the end of the experiment (data not shown). There was no detected difference in mesozooplankton biomass between Singular and Recurring modes of addition (Figure 6; p = 0.5).
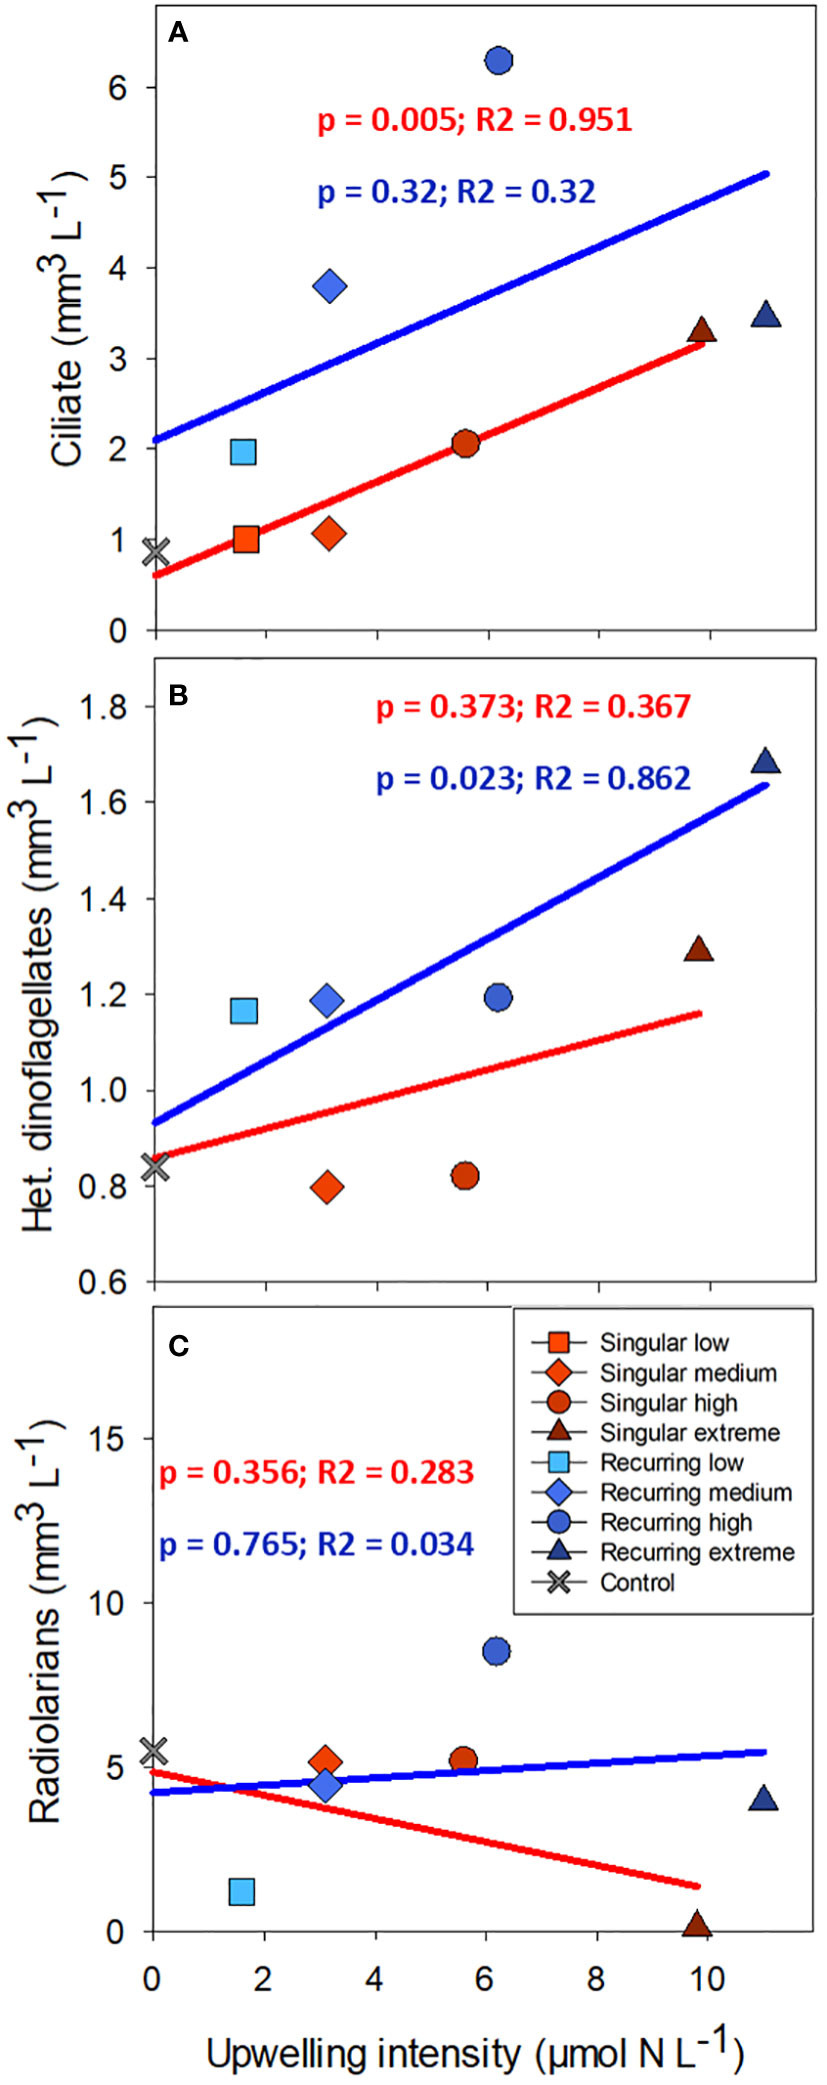
Figure 5 The average biovolume of ciliates (A), heterotrophic dinoflagellates (B) and radiolarians (C) plotted against the addition of deep-water. Linear regression statistics for Singular mode is in red and for Recurring mode in blue.
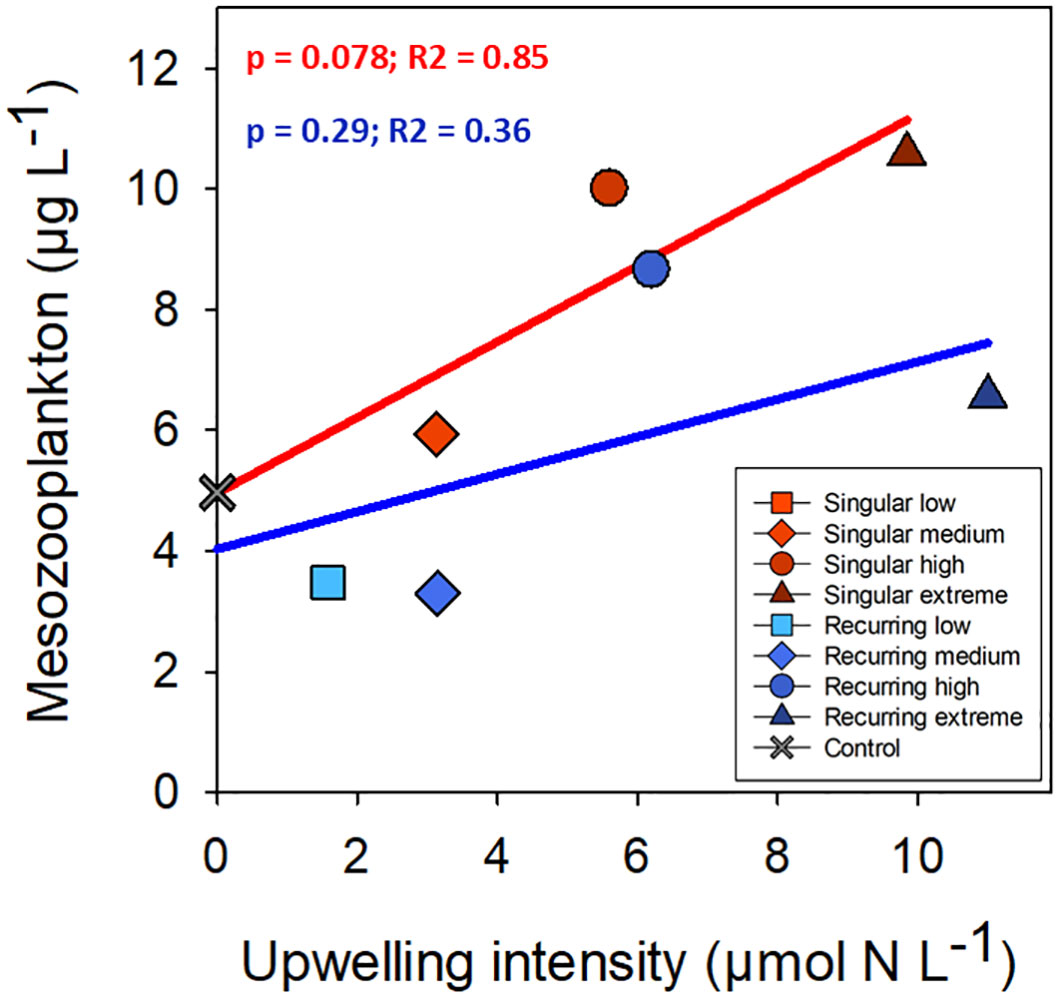
Figure 6 The average mesozooplankton biomass plotted against the addition of deep-water. Linear regression statistics for Singular mode is in red and for Recurring mode in blue.
There was a positive correlation between the ratio of phytoplankton to microzooplankton biomass and the deep-water addition, and the slope was steeper for the Singular compared with the Recurring treatment (Figure 7; p = 0.016). This ratio based on biovolume (m3 m-3) was 3.26 in the control, and elevated to 30.65 and 16.12 in the Singular extreme and Recurring extreme respectively. Using biovolume converted to carbon for phytoplankton and microzooplankton, the calculated phytoplankton to zooplankton (sum of micro- and mesozooplankton) ratio was positively correlated with upwelling intensity, with an average ratio around 1 in the control and low upwelling modes increasing to ~6 in the two extreme upwelling treatments (Figure 7), but there was no conclusive difference in the slope between Singular and Recurring upwelling (p = 0.14).
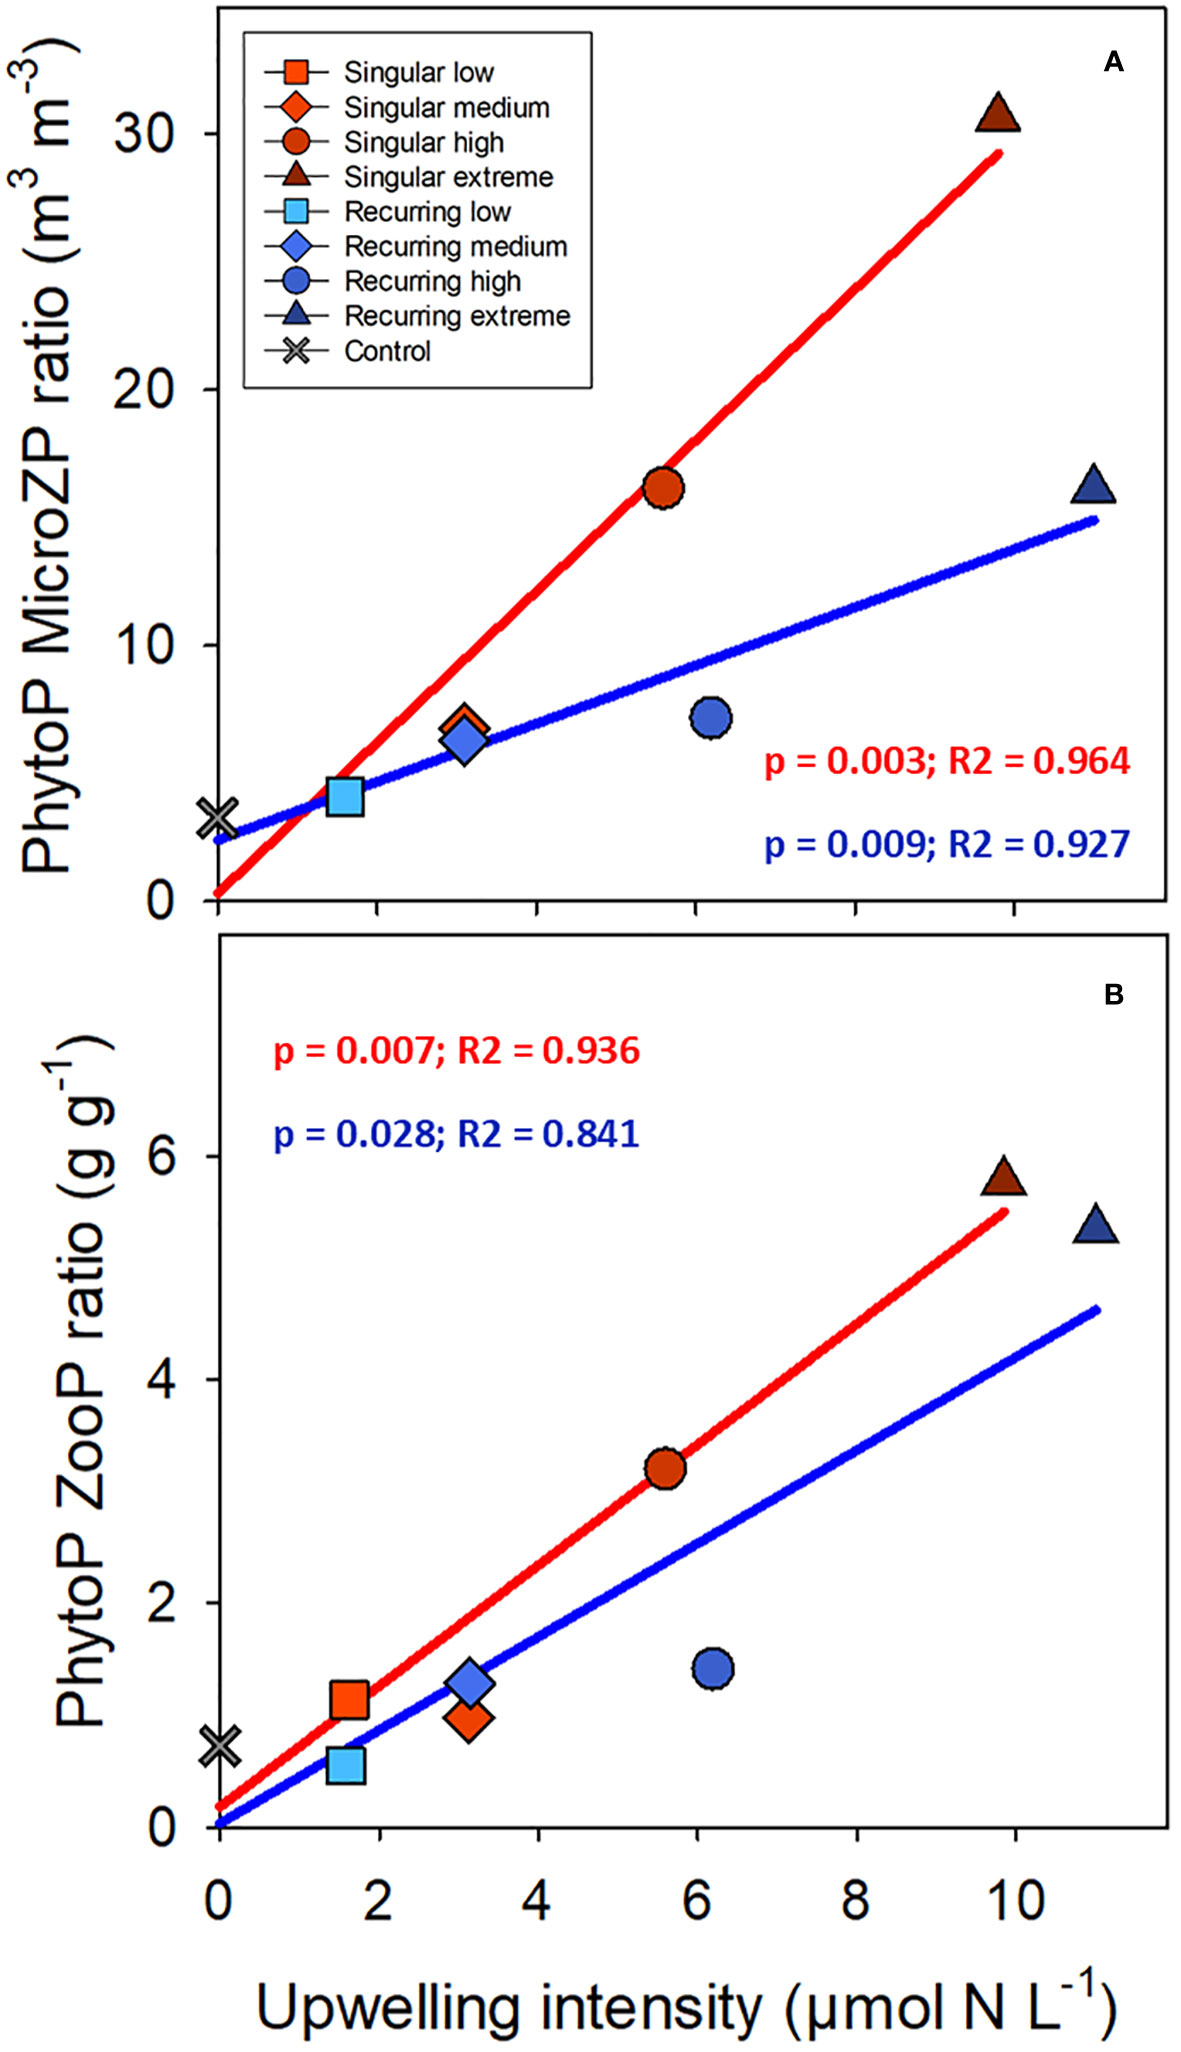
Figure 7 The average phytoplankton (PhytoP) to microzooplankton (MicroZP) ratio (biovolume; A), and phytoplankton to total zooplankton (ZooP = microzooplankton + mesozooplankton) ratio (weight; B) plotted against the deep-water additions. Linear regression statistics for Singular mode is in red and for Recurring mode in blue.
Grazing
The grazing rates of picoeukaryotes and nanophytoplankton increased after the addition of deep water in the Singular extreme and Recurring extreme treatments (Figures 8A, C). Grazing of Synechococcus-like cells were mostly present during the first half of the experiment. After this, grazing was not detectable apart from the very end of the experiment, in particular in the Recurring extreme treatment. Grazing rates of Synechococcus-like cells and picoeukaryotes had a higher peak in the Singular extreme compared with Recurring extreme treatment during the first half of the experiment. This was also taking place at the same time as a peak in large dinoflagellates (> 20 µm) in this treatment. Nanophytoplankton grazing was reaching the highest rates in the Recurring extreme treatment on day 7 at 0.7 d-1. For the rest of the experiment, grazing rates of nanophytoplankton were mostly between 0.2 to 0.6 d-1 in both treatments.
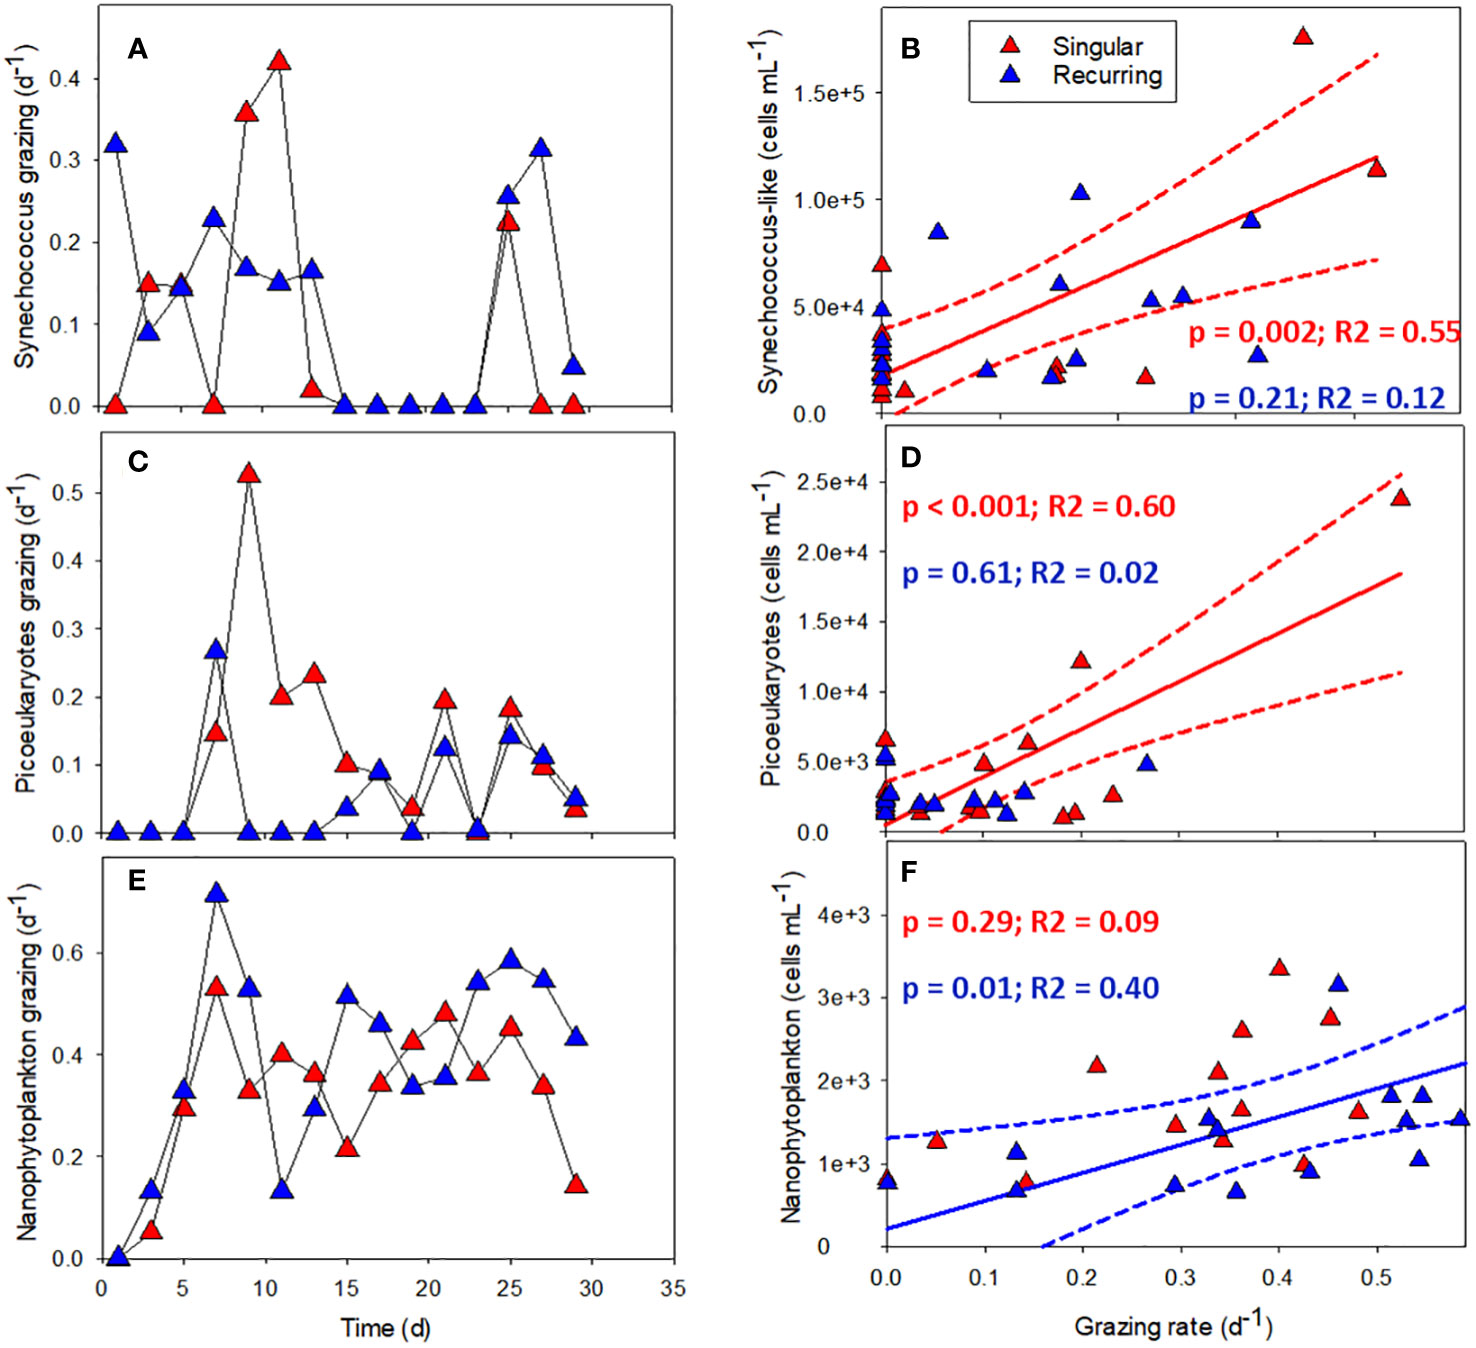
Figure 8 The grazing rates of Synechococcus-like (A), picoeukaryotes (C) and nanophytoplankton (E) plotted against time in Singular and Recurring extreme, and the corresponding grazing rate plotted against abundance for the same groups: Synechococcus-like (B), picoeukaryotes (D) and nanophytoplankton (F). The solid lines in (B, D, F) represent the significant (p <0.05) linear regression and dotted lines the 95% confidence interval. See Figure 1A for the timing of the deep-water addition.
There was a connection between abundance and grazing rates in the Singular and Recurring extreme treatments (Figures 8A–F). Comparing the grazing rates of the three smallest autotrophic groups with their abundance counts in the respective mesocosm, revealed a positive correlation between Synechococcus-like cells and picoeukaryote abundance and grazing rate in the Singular extreme treatment (Figures 8B, D). The same positive correlation was found between nanophytoplankton abundance and grazing rates in the Recurring extreme treatment (Figure 8F).
Discussion
There was an effect of both increasing addition of deep water and mode of addition on the microzooplankton community and biovolume. Spreading the amount of inorganic nutrients over time provided more time for the microzooplankton community to respond with higher biomass overall in the Recurring treatment, but the response was different for different groups of microzooplankton. The key microzooplankton groups consisted of ciliates, heterotrophic and mixotrophic dinoflagellates and radiolarians. This is consistent with the plankton community in the area, apart from the radiolarians that are not that commonly reported (e.g. Schmoker et al., 2014).
There was a clear shift in the community of ciliates and some taxa were more affected by added nutrients than others. For example, Strobilidium sp and Strobidium sp are known to have high growth rates under favorable conditions (Montagnes, 1996) something we also observed. Amphorides sp. and Dadayiella sp, also increased rapidly after the first addition of deep water but disappeared rapidly at the end of the bloom, which to a large extent was exported out of the system (Baumann et al., 2021). Different groups of tintinnids were the main biomass of ciliates that became dominant after the initial bloom in the Singular extreme and in the Recurring treatments. The ciliate biomass in the Recurring extreme was much lower than in the Recurring high, perhaps an indication of a non-linear relationship between deep water addition and ciliate biovolume but no conclusion can be made based on one data point.
For dinoflagellates, the pronounced peak in biovolume in the beginning of the experiment was likely a response in the auto- and mixotrophic dinoflagellates benefitting from the inorganic nutrients. This was e.g. the Gymnodinium spp and Scrippsiella sp, which had a similar timing of the abundance peak after deep water addition. In the latter half of the experiment, the biovolume of heterotrophic dinoflagellates such as Protoperidinium spp increased in particular in the Recurring addition mode. Heterotrophic dinoflagellates typically ingest relatively large prey items (Hansen, 1991), and there is a temporal delay between food items becoming available until reaching maximum growth potential (Anderson and Menden-Deuer, 2017). The higher biovolume in the Recurring treatments suggested the increased duration of the algal bloom provided more time for heterotrophic dinoflagellates to build up biomass.
Radiolarians had a relatively high peak in biovolume in some mesocosms but were not counted in the microscopy method that was independently done. It is known that acid Lugol’s solution does not work well with some microzooplankton groups as this fixative may affect both size and morphology (Stoecker et al., 1994), and the lack of microscopic counts suggest this preservation method does not work well with radiolarians. Radiolarians are well-known from the fossil records but surprisingly little is known about their ecology (Biard, 2022). Using imaging devices such as the FlowCam, that can be run without fixatives, could benefit the study of this group of protists. Interestingly, the radiolarian biomass was independent of deep-water additions. Some radiolarians are known to have photosymbionts (Decelle et al., 2015), and the driver for radiolarian growth in the mesocosms could be due to very specific grazing prey or relationships with symbionts deserving further study.
There was a clear effect of both the upwelling intensity and mode of upwelling on primary producers, and adding deep water with inorganic nutrients created a bloom of phytoplankton closely related to the concentration of nutrients added (see also Ortiz et al., 2022b). This bloom was dominated by diatoms for the first three weeks. This is not surprising as diatoms typically have an r-selected strategy with the ability to quickly take up inorganic nutrients and produce biomass under favorable conditions (e.g. Smayda and Reynolds, 2001). Making small but frequent additions of nutrients prolonged the phytoplankton bloom in comparison to adding all the nutrients at once in the beginning. In the last week of the experiment, a coccolithophore bloom was clearly visible inside the Recurring extreme mesocosm, with the water getting a milky tint. The biovolume presented for this group is likely a slight underestimation as most of the single-celled coccolithophores were not easily picked out in the FlowCam software and ended up in a group of unidentified <10 µm cells, but these would have contributed to the total biovolume.
The phytoplankton bloom that developed was also reflected in primary production, which positively correlated to nutrient additions and was higher in the Recurring treatment compared with the Singular treatment (Ortiz et al., 2022a). This difference was not detected in community respiration, suggesting that the autotrophs fixed more carbon with several smaller nutrient additions compared with the larger but shorter peak in primary production in the Singular treatments (Baños et al., 2022; Ortiz et al., 2022b).
The recorded grazing rates were in line with previous grazing rates for the coastal Atlantic Ocean (Schmoker et al., 2013), but what was a bit surprising was the sometimes low to absent grazing rates of the smaller phytoplankton groups: Synechococcus-like cells and picoeukaryotes. It was only the nanophytoplankton that were consistently grazed throughout the experiment. However, there was a positive correlation between grazing of Synechococcus-like cells and picoeukaryotes and their abundance in the Singular treatment, and nanophytoplankton grazing and its abundance in the Recurring treatment. This indicates that microzooplankton can regulate their grazing activity according to prey availability to some extent, but following low prey abundance, it might take some time for the grazers to start feeding on a particular food item again.
Dilution experiments are very elegant in theory but harder to carry out with several pitfalls when it comes to execution. Here we used relatively small volumes (about 5-orders of magnitude) compared with the mesocosms. It is clear that the conditions were not the same e.g. light, although we took steps to adjust e.g. the spectral composition of the light. We also did not have the option to place the incubation bottles on a plankton wheel and although there would be some advection due small changes in temperature in the flow-through pool where they were placed, larger non-motile organisms such as chain-forming diatoms were quickly settling to the bottom of the flasks. These were mostly >20 µm and too large for the flow cytometer to count and were not part of the nanophytoplankton group.
The diatom bloom was to a large extent exported after the inorganic nutrients were depleted (Baumann et al., 2021). Although microzooplankton did not effectively graze the diatom bloom that formed, some groups were positively correlation between deep-water addition suggesting that it was not a complete mismatch. Overall, the temporal difference in microzooplankton biomass was greater than the difference between Singular and Recurring treatments. However, the Recurring mode of addition produced higher microzooplankton biomass which gives an indication of this mode providing more time for microzooplankton to adjust to the phytoplankton food available and a better match between producers and microzooplankton consumers. There was likely also a top-down effect by mesozooplankton predation of microzooplankton. Spisla (2021) found higher trophic transfer to copepods in the Singular compared to the Recurring treatments based on 13C incorporation. There were examples of rapid declines in microzooplankton abundance that likely was due to top-down control. However, there was no overall difference in mesozooplankton biomass between Singular and Recurring treatments considering the average of the whole experiment suggesting that it was not large enough of a difference in the top-down control to make a measurable difference in mesozooplankton biomass.
Microzooplankton was particularly dominating the zooplankton biomass in the Recurring low and medium treatments suggesting it plays the biggest role under conditions with small and frequent additions of nutrients. Given additional time, microzooplankton might upgrade the food quality for larger crustacean mesozooplankton and increase the overall transfer to higher trophic levels (Campbell et al., 2009), but the experiment was too short to see any such effect here.
There are Some ocean models predict phytoplankton to zooplankton biomass ratio (P: Z ratio) in the range 0.1 – 10 with the highest values in nutrient-poor oligotrophic ecosystems that are bottom-up controlled, whereas lower ratios are found in more productive areas (Ward et al., 2012). However, other models point to an inverse relationship with the lowest P: Z ratio in less productive and increasing in more productive areas (ratio of 0.3 – 3.0; Negrete-Garcia et al., 2022). Our results are more in line with the latter in that the P: Z ratio increased with the nutrient input. The experiment was done in the oligotrophic ocean, and the duration was perhaps not enough to reach a new steady state. In other words, our high P: Z ratio in the high and extreme treatments could be a consequence of the initial mismatch between the phytoplankton and grazing communities.
Artificial upwelling would need to be done on a large scale to have any impact on ecosystem production, and bringing up such volumes of deep water would have other effects as well apart from fertilizing the surface ocean. The temperature of the upwelling water would be much lower than the surface water at low latitudes, and would itself have a cooling effect (Oschlies et al., 2010), which also affects gas solubility (Jürchott et al., 2023). Temperature was not something we addressed in this experiment, but could have practical implications for the community composition of both primary producers and zooplankton which have temperature optima that are species-specific. In addition, physiological responses are also greatly affected by temperature, and this should be studied further to understand what effect the lower temperature might have on the plankton community.
Conclusion
Grazing of the autotrophs by microzooplankton was consistent for nanophytoplankton but more variable for Synechococcus-like cells and picoeukaryotes, but there was a positive correlation between the abundance of these groups and grazing rates, suggesting a response in the microzooplankton community to prey availability. Some groups of microzooplankton biomass increased with deep-water addition, but the increasing P: Z ratio could be an indication that trophic transfer efficiency would be reduced with more nutrients added. Several smaller, recurring upwelling events increased the importance of microzooplankton compared with one large pulse of deep water. Our results demonstrate that microzooplankton would be an important component of trophic transfer if artificial upwelling would be carried out at scale in the oligotrophic ocean.
Data availability statement
The original contributions presented in the study are included in the article/Supplementary Material. Further inquiries can be directed to the corresponding author.
Ethics statement
The manuscript presents research on animals that do not require ethical approval for their study.
Author contributions
KS: Formal Analysis, Funding acquisition, Investigation, Methodology, Supervision, Writing – original draft. MM: Investigation, Writing – review & editing. MG: Investigation, Writing – review & editing. KGS: Formal Analysis, Investigation, Writing – review & editing. CS: Formal Analysis, Investigation, Writing – review & editing. MV: Investigation, Writing – review & editing. SUG: Formal Analysis, Investigation, Writing – review & editing. UR: Conceptualization, Funding acquisition, Investigation, Resources, Supervision, Writing – review & editing.
Funding
The author(s) declare financial support was received for the research, authorship, and/or publication of this article. This study was funded by an Advanced Grant of the European Research Council (ERC) to UR in the framework of the Ocean Artificial Upwelling project (Ocean artUp, No. 695094). Additional Transnational Access funds were provided by the EU project AQUACOSM (EU H2020-INFRAIA-project, No. 731065), which supported the participation of KS, MG and MV. KS and MV additionally got funding from Walter and Andreé de Nottbeck Foundation.
Acknowledgments
We would like to thank the Oceanic Platform of the Canary Islands (Plataforma Oceánica de Canarias, PLOCAN) and the Marine Science and Technology Park (Parque Cientiìfico Tecnoloìgico Marino, PCTM), from the University of Las Palmas (Universidad de Las Palmas de Gran Canaria, ULPGC), for support during this experiment. We are grateful for the KOSMOS team (GEOMAR) that took care of the logistics and technical work necessary to conduct the mesocosm experiment. We would also like to thank Riina Klais-Peets at EcoStat Ltd that helped with statistics and NMDS plots. This study utilized research infrastructure provided by the Finnish Marine Research Infrastructure (FINMARI) network.
Conflict of interest
The authors declare that the research was conducted in the absence of any commercial or financial relationships that could be construed as a potential conflict of interest.
The author(s) declared that they were an editorial board member of Frontiers, at the time of submission. This had no impact on the peer review process and the final decision.
Publisher’s note
All claims expressed in this article are solely those of the authors and do not necessarily represent those of their affiliated organizations, or those of the publisher, the editors and the reviewers. Any product that may be evaluated in this article, or claim that may be made by its manufacturer, is not guaranteed or endorsed by the publisher.
Supplementary material
The Supplementary Material for this article can be found online at: https://www.frontiersin.org/articles/10.3389/fmars.2023.1286899/full#supplementary-material
References
Anderson S. R., Menden-Deuer S. (2017). Growth, grazing, and starvation survival in three heterotrophic dinoflagellate species. J. Eukaryotic Microbiol. 64 (2), 213–225. doi: 10.1111/jeu.12353
Baños I., Arístegui J., Benavides M., Gomez-Letona M., Montero M. F., Ortiz J., et al. (2022). Response of plankton community respiration under variable simulated upwelling events. Front. Mar. Sci. 9, 1006010. doi: 10.3389/fmars.2022.1006010
Baumann M., Taucher J., Paul A. J., Heinemann M., Vanharanta M., Bach L. T., et al. (2021). Effect of intensity and mode of artificial upwelling on particle flux and carbon export. Front. Mar. Sci. 8, 742142. doi: 10.3389/fmars.2021.742142
Biard T. (2022). Diversity and ecology of Radiolaria in modern oceans. Environ. Microbiol. 24, 2179–2200. doi: 10.1111/1462-2920.16004
Bograd S. J., Jacox M. G., Hazen E. L., Lovecchio E., Montes I., Pozo Buil M., et al. (2023). Climate change impacts on eastern boundary upwelling systems. Annu. Rev. Mar. Sci. 15, 303–328. doi: 10.1146/annurev-marine-032122-021945
Calbet A. (2008). The trophic roles of microzooplankton in marine systems. ICES Journal of Marine Science. J. du Conseil 65, 325–331. doi: 10.1093/icesjms/fsn013
Campbell R. G., Sherr E. B., Ashjian C. J., Plourde S., Sherr B. F., Hill V., et al. (2009). Mesozooplankton prey preference and grazing impact in the western Arctic Ocean. Deep Sea Res. Part II: Topical Stud. Oceanography 56, 1274–1289. doi: 10.1016/j.dsr2.2008.10.027
Chavez F. P., Messié M. (2009). A comparison of eastern boundary upwelling ecosystems. Prog. Oceanography 83, 80–96. doi: 10.1016/j.pocean.2009.07.032
Decelle J., Colin S., Foster R. A. (2015). “Photosymbiosis in marine planktonic protists,” in Marine protists. Eds. Ohtsuka S., Suzaki T., Horiguchi T., Suzuki N., Not F. (Japan: Springer), 465–500. doi: 10.1007/978-4-431-55130-0
Eddy T. D., Bernhardt J. R., Blanchard J. L., Cheung W. W., Colléter M., Du Pontavice H., et al. (2021). Energy flow through marine ecosystems: confronting transfer efficiency. Trends Ecol. Evol. 36, 76–86. doi: 10.1016/j.tree.2020.09.006
FAO (2022). The state of world fisheries and aquaculture. Towards blue transformation (Rome: Food and Agriculture Organization of the United Nations).
Field C. B., Behrenfeld M. J., Randerson J. T., Falkowski. P. (1998). Primary production of the biosphere: integrating terrestrial and oceanic components. Science 281, 237–240. doi: 10.1126/science.281.5374.237
Guillard R. R. L., Ryther J. H. (1962). Studies of marine planktonic diatoms. I. Cyclotella nana Hustedt, and Detonula confervacea (Cleve) Gran. Can. J. Microbiol. 8, 229–239. doi: 10.1139/m62-029
Gupta M., Williams R. G., Lauderdale J. M., Jahn O., Hill C., Dutkiewicz S., et al. (2022). A nutrient relay sustains subtropical ocean productivity. Proc. Natl. Acad. Sci. 119, e2206504119. doi: 10.1073/pnas.2206504119
Hansen P. J. (1991). Quantitative importance and trophic role of heterotrophic dinoflagellates in a coastal pelagial food web. Mar. Ecol. Prog. Ser. 253–261.
Ianora A., Miralto A. (2010). Toxigenic effects of diatoms on grazers, phytoplankton and other microbes: a review. Ecotoxicology 19, 493–511. doi: 10.1007/s10646-009-0434-y
Jürchott M., Oschlies A., Koeve W. (2023). Artificial upwelling—A refined narrative. Geophysical Res. Lett. 50, e2022GL101870. doi: 10.1029/2022GL101870
Kirke B. (2003). Enhancing fish stocks with wave-powered artificial upwelling. Ocean Coast. Manage. 46, 901–915. doi: 10.1016/S0964-5691(03)00067-X
Landry M., Hassett R. (1982). Estimating the grazing impact of marine micro-zooplankton. Mar. Biol. 67, 283–288. doi: 10.1007/BF00397668
Marie D., Brussaard C. P., Thyrhaug R., Bratbak G., Vaulot. D. (1999). Enumeration of marine viruses in culture and natural samples by flow cytometry. Appl. Environ. Microbiol. 65, 45–52. doi: 10.1128/AEM.65.1.45-52.1999
Montagnes D. J. (1996). Growth responses of planktonic ciliates in the genera Strobilidium and Strombidium. Mar. Ecol. Prog. Ser. 130, 241–254. doi: 10.3354/meps130241
Moore J. K., Fu W., Primeau F., Britten G. L., Lindsay K., Long M., et al. (2018). Sustained climate warming drives declining marine biological productivity. Science 359, 1139–1143. doi: 10.1126/science.aao6379
Negrete-García G., Luo J. Y., Long M. C., Lindsay K., Levy M., Barton A. D. (2022). Plankton energy flows using a global size-structured and trait-based model. Prog. Oceanogr. 209, 102898. doi: 10.1016/j.pocean.2022.102898
Oksanen J., Simpson G. L., Blanchet F. G., Kindt R., Legendre P., Minchin P. R., et al. (2022) R Package ‘vegan’: Community ecology package. Available at: https://cran.r-project.org/web/packages/vegan/vegan.pdf.
Ortiz J., Arístegui J., Hernández-Hernández N., Fernández-Méndez M., Riebesell. U. (2022a). Oligotrophic phytoplankton community effectively adjusts to artificial upwelling regardless of intensity, but differently among upwelling modes. Front. Mar. Sci. 9, 880550. doi: 10.3389/fmars.2022.880550
Ortiz J., Arístegui J., Taucher J., Riebesell U. (2022b). Artificial upwelling in singular and recurring mode: Consequences for net community production and metabolic balance. Front. Mar. Sci. 8, 743105. doi: 10.3389/fmars.2021.743105
Oschlies A., Pahlow M., Yool A., Matear R. J. (2010). Climate engineering by artificial ocean upwelling: Channelling the sorcerer's apprentice. Geophysical Res. Lett. 37, L04701. doi: 10.1029/2009GL041961
Putt M., Stoecker D. K. (1989). An experimentally determined carbon: volume ratio for marine “oligotrichous”. ciliates Estuar. Coast. waters. Limnology oceanography 34, 1097–1103. doi: 10.4319/lo.1989.34.6.1097
Riebesell U., Czerny J., v. Bröckel K., Boxhammer T., Büdenbender J., Deckelnick M., et al. (2013). Technical Note: A mobile sea-going mesocosm system–new opportunities for ocean change research. Biogeosciences 10, 1835–1847. doi: 10.5194/bg-10-1835-2013
Schmoker C., Hernández-León S., Calbet A. (2013). Microzooplankton grazing in the oceans: impacts, data variability, knowledge gaps and future directions. J. Plankton Res. 35 (4), 691–706. doi: 10.1093/plankt/fbt023
Schmoker C., Ojeda A., Hernández-León S. (2014). Patterns of plankton communities in subtropical waters off the Canary Islands during the late winter bloom. J. Sea Res. 85, 155–161. doi: 10.1016/j.seares.2013.05.002
Smayda T. J., Reynolds C. S. (2001). Community assembly in marine phytoplankton: application of recent models to harmful dinoflagellate blooms. J. Plankton Res. 23, 447–461. doi: 10.1093/plankt/23.5.447
Sommer U., Stibor H., Katechakis A., Sommer F., Hansen T. (2002). Pelagic food web configurations at different levels of nutrient richness and their implications for the ratio fish production: primary production. Hydrobiologia 484, 11–20. doi: 10.1023/A:1021340601986
Spilling K., Olli K., Lehtoranta J., Kremp A., Tedesco L., Tamelander T., et al. (2018). Shifting diatom-dinoflagellate dominance during spring bloom in the Baltic Sea and its potential effects on biogeochemical cycling. Front. Mar. Sci. 5, 327. doi: 10.3389/fmars.2018.00327
Spisla C. (2021). Marine zooplankton community responses to anthropogenic influences. PhD thesis. (Kiel University). Available at: https://oceanrep.geomar.de/id/eprint/57680/. 162 pp.
Stoecker D. K., Gifford D. J., Putt M. (1994). Preservation of marine planktonic ciliates: losses and cell shrinkage during fixation. Mar. Ecol. Prog. Ser. 110, 293–299. doi: 10.3354/meps110293
Taucher J., Bach L. T., Boxhammer T., Nauendorf A., Consortium G. C. K., Achterberg E. P., et al. (2017). Influence of ocean acidification and deep water upwelling on oligotrophic plankton communities in the subtropical North Atlantic: insights from an in situ mesocosm study. Front. Mar. Sci. 4, 85. doi: 10.3389/fmars.2017.00085
Thomas P. K., Kunze C., Van de Waal D. B., Hillebrand H., Striebel. M. (2022). Elemental and biochemical nutrient limitation of zooplankton: A meta-analysis. Ecol. Lett. 25, 2776–2792. doi: 10.1111/ele.14125
Varela R., Álvarez I., Santos F., DeCastro M., Gómez-Gesteira M. (2015). Has upwelling strengthened along worldwide coasts over 1982-2010? Sci. Rep. 5 (1), 10016. doi: 10.1038/srep10016
Keywords: Atlantic Ocean, ciliates, tintinnids, dinoflagellates, radiolarians, dilution experiment
Citation: Spilling K, Arellano San Martín M, Granlund M, Schulz KG, Spisla C, Vanharanta M, Goldenberg SU and Riebesell U (2023) Microzooplankton communities and their grazing of phytoplankton under artificial upwelling in the oligotrophic ocean. Front. Mar. Sci. 10:1286899. doi: 10.3389/fmars.2023.1286899
Received: 01 September 2023; Accepted: 02 November 2023;
Published: 22 November 2023.
Edited by:
Alex J. Poulton, Heriot-Watt University, United StatesReviewed by:
Tron Frede Thingstad, University of Bergen, NorwayEmilio Maranon, University of Vigo, Spain
Copyright © 2023 Spilling, Arellano San Martín, Granlund, Schulz, Spisla, Vanharanta, Goldenberg and Riebesell. This is an open-access article distributed under the terms of the Creative Commons Attribution License (CC BY). The use, distribution or reproduction in other forums is permitted, provided the original author(s) and the copyright owner(s) are credited and that the original publication in this journal is cited, in accordance with accepted academic practice. No use, distribution or reproduction is permitted which does not comply with these terms.
*Correspondence: Kristian Spilling, a3Jpc3RpYW4uc3BpbGxpbmdAc3lrZS5maQ==