 Diego Pereiro1*
 Oleg Belyaev2
 Martha B. Dunbar2
 Andrew Conway1
 Tomasz Dabrowski1
 Inger Graves3
 Gabriel Navarro2Glenn Nolan1
 Jay Pearlman4
 Pauline Simpson5
 Caroline Cusack1
- 1Ocean Climate and Information Services, Marine Institute, Oranmore, County Galway, Ireland
- 2Instituto de Ciencias Marinas de Andalucía - Consejo Superior de Investigaciones Científicas (ICMAN-CSIC), Puerto Real, Cádiz, Spain
- 3Ocean & Coastal Business, Xylem-Aanderaa Data Instruments A/S, Godvik, Norway
- 4Institute of Electrical and Electronics Engineers France Section, Paris, France
- 5Intergovernmental Oceanographic Commission of the United Nations Educational, Scientific and Cultural Organization (UNESCO/IOC) Project Office for International Oceanographic Data and Information Exchange (IODE), InnovOcean Campus, Oostende, Belgium
This work presents the steps followed in the design and implementation of a marine observatory that provides the current state and forecast of oceanic conditions relevant to the aquaculture sector. Examples of successful implementation of these guidelines are presented in the framework of the EuroSea project (H2020 grant agreement No. 862626) for two aquaculture sites: Deenish Island in Ireland and El Campello in Spain. In-situ essential ocean measurements, remote-sensing observations and modelled forecasts are jointly provided to the aquaculture end users. The process begins with stakeholder interaction to understand their main needs and concerns, followed by software architecture design and development to facilitate data acquisition, post-processing and visualization on an open-access web platform. User input regarding the development of the observatory and web platform content and frequent feedback are of paramount importance during the whole process to ensure that the services offered match the needs of the aquaculture sector.
1 Introduction
Ocean observation is of paramount importance to understand the ocean and the impacts of climate change on marine economic activities, such as tourism, fisheries, or aquaculture. Coordinated and complementary monitoring programmes are required for a comprehensive understanding of the ocean’s processes. In this regards, marine research infrastructures constitute large-scale tools for understanding the ocean complexities, heterogeneities, and interrelationships via multi-interdisciplinary approaches (Dañobeitia et al., 2023). Examples of such comprehensive and interdisciplinary observatories are the Civitavecchia Coastal Environment Monitoring System (C-CEMS), which integrates in-situ measurements, numerical models and satellite imagery for water-quality monitoring in the coastal area of Citavecchia, Italy (Bonamano et al., 2016; Zappalà et al., 2016); and the ODYSSEA (Operating Network of Integrated Observatory Systems in the Mediterranean Sea) service, which provides multi-platform network of observation and forecasting systems across the Mediterranean Sea (Majidi Nezhad et al., 2022).
This work presents a new marine observatory developed specifically to address the needs of the aquaculture sector at two pilot sites: Deenish Island (Ireland) and El Campello (Spain). Following the same multi-interdisciplinary approach of other marine research infrastructures, as described in Dañobeitia et al. (2023), this platform also combines in-situ observations with model forecasts and satellite imagery. The most innovative characteristic of this work is the fact that this observatory has been co-created with the stakeholders from the aquaculture industry, and as such incorporates different meteorological warnings based on end users’ needs. These warnings include extreme temperature events, which trigger stress responses in aquaculture fish (Islam et al., 2020; Islam et al., 2022), and high wave conditions threatening the integrity of aquaculture installations.
This manuscript describes the procedures to develop the marine observatory for aquaculture. First, the areas of study and the Materials and Equipment deployed at each pilot site are described. Then, the Methods section describes the procedures followed to develop the observatory, including the Steps for Implementation, Data Required, Tools, Models and Software used, International Standards, Quality Control, Implementation Challenges or Issues, Visualization Tools and User Feedback Mechanisms available. This is the structure recommended by the Ocean Best Practices System for ocean applications (Ocean Best Practices System, 2023). Finally, results and discussion are provided.
2 Materials and equipment
Two monitoring stations were deployed in aquaculture farms under the framework of the H2020 EuroSea project: Deenish Island, Ireland, and El Campello, Spain. These are pilot sites where the methodologies and guidelines described here were applied.
A. Deenish Island. The Deenish Island salmon farm is operated by Mowi Ireland and is located on the south-western coast of Ireland at the mouth of Kenmare Bay. A monitoring station was deployed at 51.743°N 10.212°W in April 2022. The Atlantic Salmon (Salmo salar) is the most important species grown at the farm. Since salmon requires cold waters (< 17°C) for healthy growth and development, the main concern of farmers in this area is related to ocean warming and the expected increasing occurrence of marine heat waves. The ocean data buoy sensors at this site monitor winds, currents, temperature, salinity, pH, dissolved oxygen saturation and relative fluorescence of chlorophyll-a (Table 1). In order to provide a broader picture of the oceanographic conditions affecting the farm, remote-sensing data and numerically modelled particle-tracking predictions of the coastal circulation were provided for an area spanning from 50.0°N, 11.6°W to 52.8°N, 8.0°W (Figure 1A).
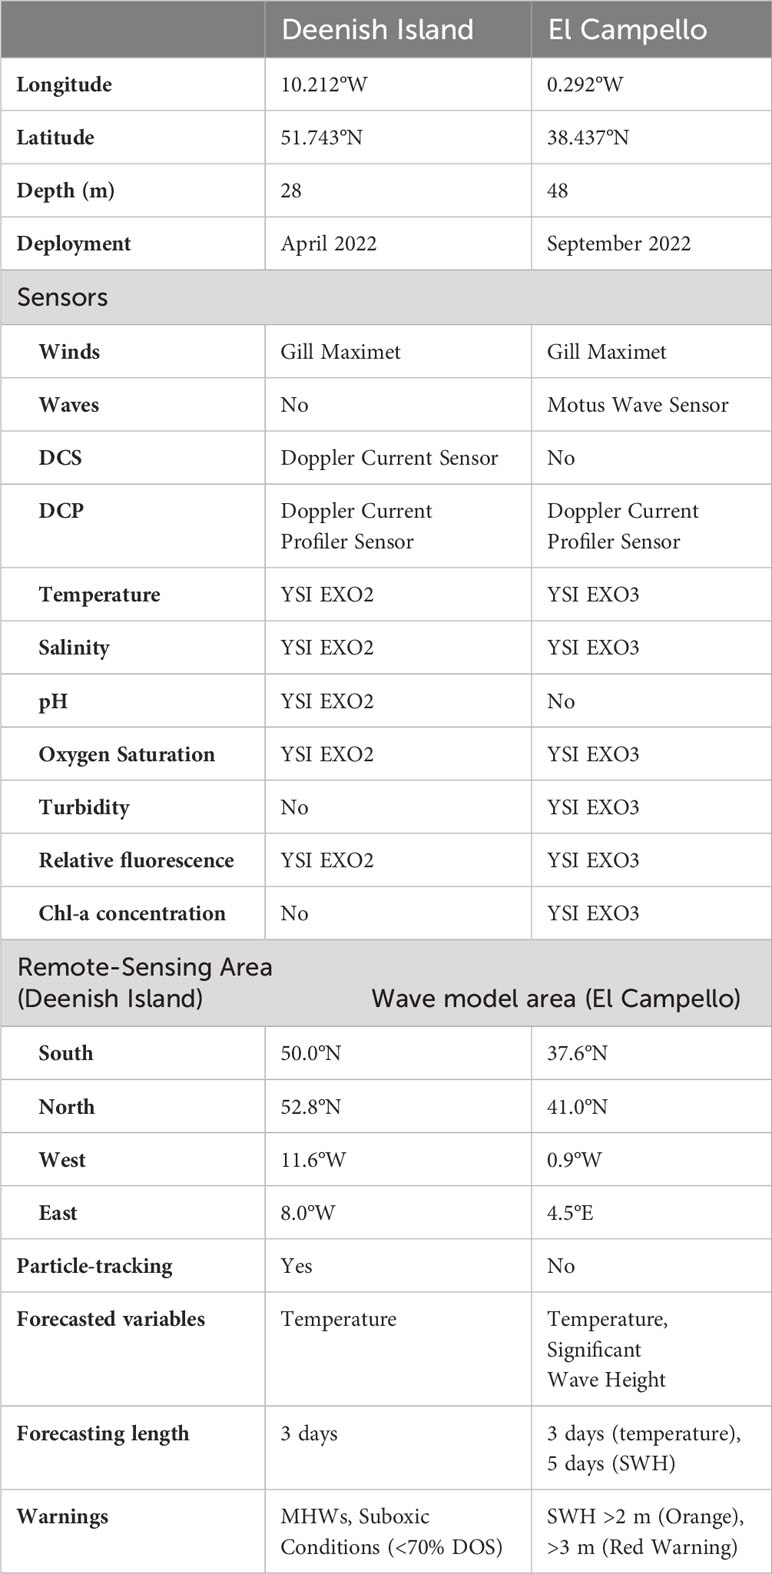
Table 1 Overview of the application sites.
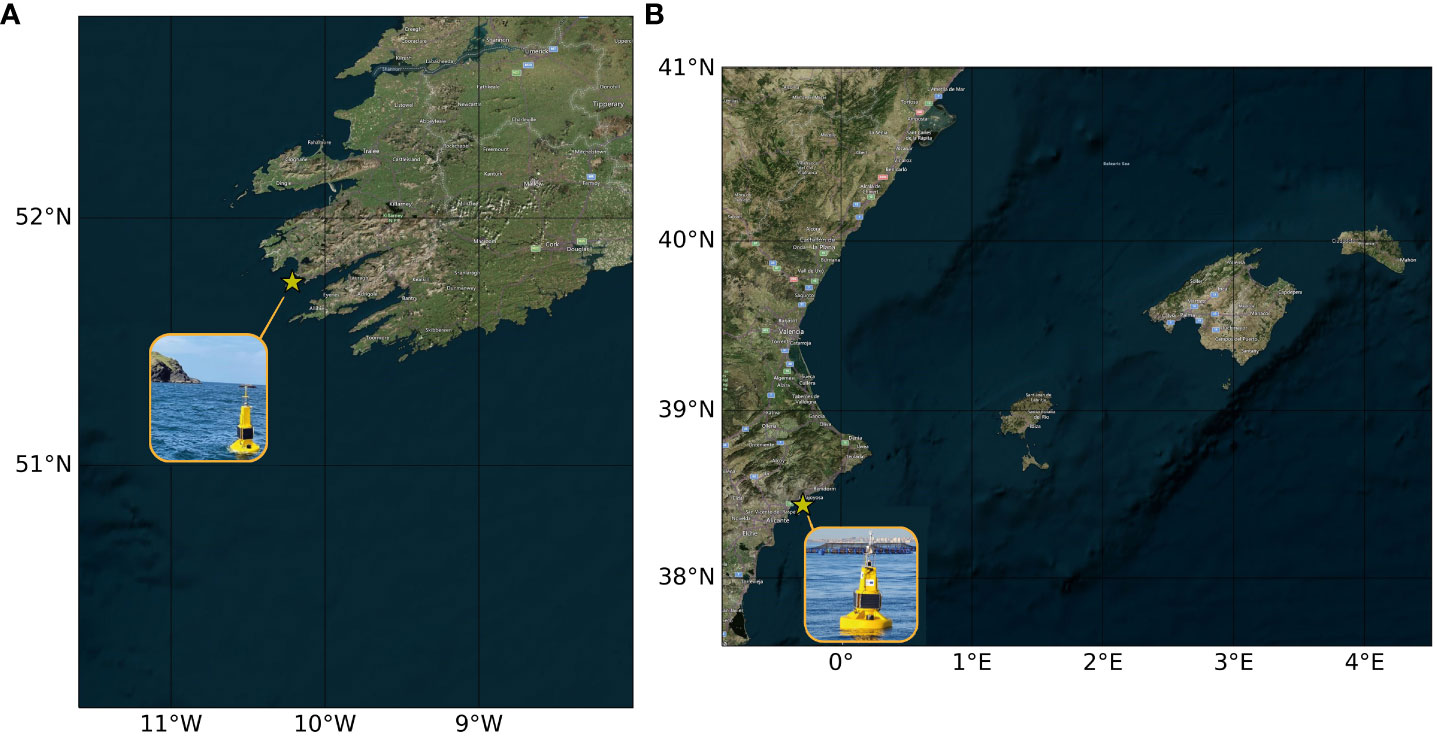
Figure 1 Pilot study areas where (A) is Deenish Island site and broader area for satellite remote-sensing data and particle-tracking predictions; (B) is El Campello site and broader area for wave model. The yellow star on each map indicates the location of the farm.
B. El Campello. El Campello fish farm is operated by AVRAMAR and is located in the Mediterranean at 38.437°N 0.292°W, where a monitoring station was deployed in October 2022. Different fish species are grown at El Campello, including the European bass (Dicentrarchus labrax) and the gilt-head bream (Sparus aurata). The farmers are mostly interested in obtaining predictions and warnings of bad weather conditions affecting the working operations at the farm. The ocean data buoy sensors at this site monitor winds, waves, currents, temperature, salinity, turbidity, dissolved oxygen saturation, relative fluorescence of chlorophyll-a and chlorophyll concentration (Table 1). Again, to provide information on a larger scale, remote-sensing data are provided for an area spanning from 37.6°N, 0.9°W to 41.0°N, 1.4°E (Figure 1B).
3 Methods
The information is accessible to the user through an open-access portal at eurosea.marine.ie. The information in this portal is being continuously updated as part of an iterative process where feedback from stakeholders is of paramount importance. This means that the current appearance of the portal may differ to what is presented in this manuscript. However, the primary purpose of this manuscript is to assist other operators on the overall approach on how to set up a marine observatory web portal. The software architecture of the website portal follows a multi-container approach, where four different pre-processing containers communicate with the web application container through a shared folder or shared volume (Figure 2). These four pre-processing containers are responsible for downloading, processing and formatting all data in a format that is understood by the web application. The output data are then shared with the web application through the shared volume. All data processes are set to run periodically to ensure the website portal is frequently updated with new data.
A. site: First, the sensors, manufactured by Xylem-Aanderaa, deliver new measurements of seawater properties every ten minutes as.xml files. These files are first released into the Xylem-Aanderaa data cloud infrastructure, and generates a user interface with real-time information that is already available to the farmers. However, unlike the application presented in this work, which merges in-situ data with model forecasts and remote-sensing observations, this preliminary interface consists of just in-situ measurements from the buoys. Next, the.xml files are incorporated into the Copernicus Marine Service in-situ Thematic Assembly Centre (INS TAC), where different Real-Time Quality-Control tests are applied to the original data. As a result, Quality Control flags are associated with each individual observation. These Quality Control flags are 1 (Good Data), 2 (Probably Good Data), 4 (Bad Data) and 9 (Missing Data). Real-Time Quality-Control tests are based on the natural behaviour of the time series and check different aspects of the data. For example, natural minimum and maximum thresholds should not be exceeded for seawater temperature and salinity. Detailed information on the meaning of the Quality-Control flags and testing procedures are provided at Wehde et al. (2021). Finally, every ten minutes, the site container downloads the observations from the Copernicus Marine Service INS TAC. The data flow from the buoys to the site container and web application is shown in Figure 3.
B. model: The model container runs once a day to download numerical ocean model forecasts from the Copernicus Marine Service.
C. rs (Remote Sensing): The rs container runs once a day to download the satellite remote sensing datasets.
D. lptm (Langrangian Particle Tracking Model): The lptm container runs the particle-tracking model once a day.
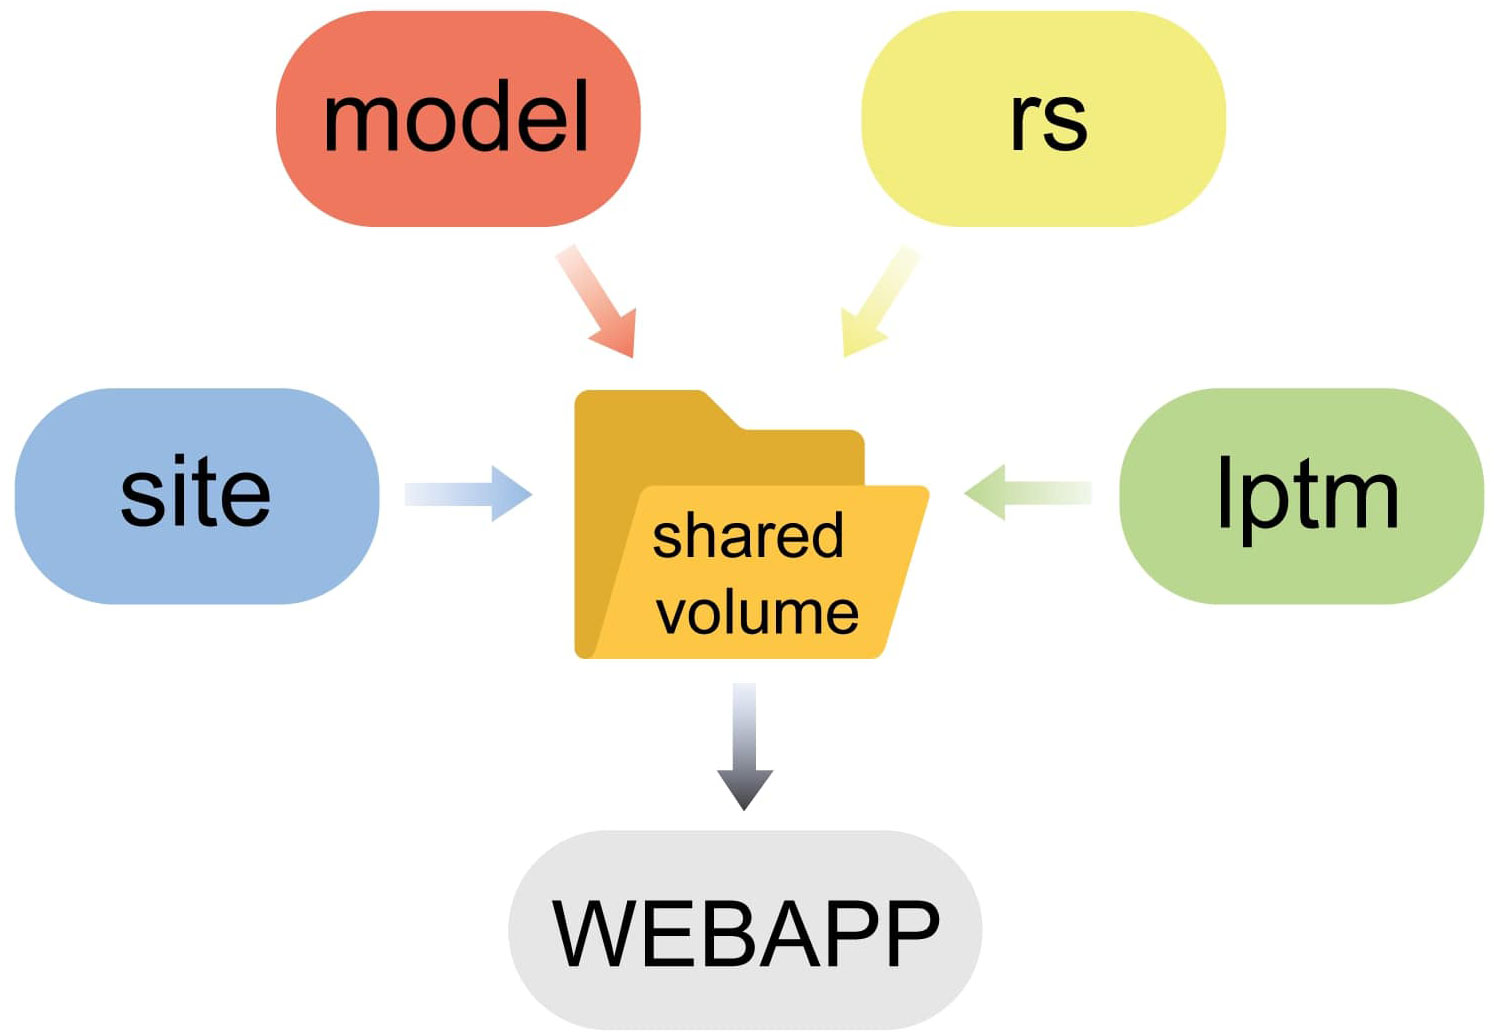
Figure 2 Scheme of the multi-container approach for deploying the website. The containers are site (in-situ data operations), model (model forecast operations), rs (remote sensing operations), lptm (Lagrangian Particle-Tracking Model operations), and webapp (web application container).
All the output data are then accessed and graphically represented by the webapp container whenever a user accesses the website portal. The webapp container is also responsible for producing output data files (*.CSV) for download, a requested service from the aquaculture industry based on user feedback to facilitate historical data requests in an easy-to-use format by the industry. The sub-processes outlined in this section are expanded in detail in Section 3.1 below. Once the data product services are developed at one ocean observatory, the pre-processing containers described above (a-d) can be duplicated to set up the data product web services for a new ocean observatory. Each container has a configuration file that can be regarded as a template. There, the user sets the application-specific parameters, such as the mooring coordinates or the remote sensing coverage area Figure 3.
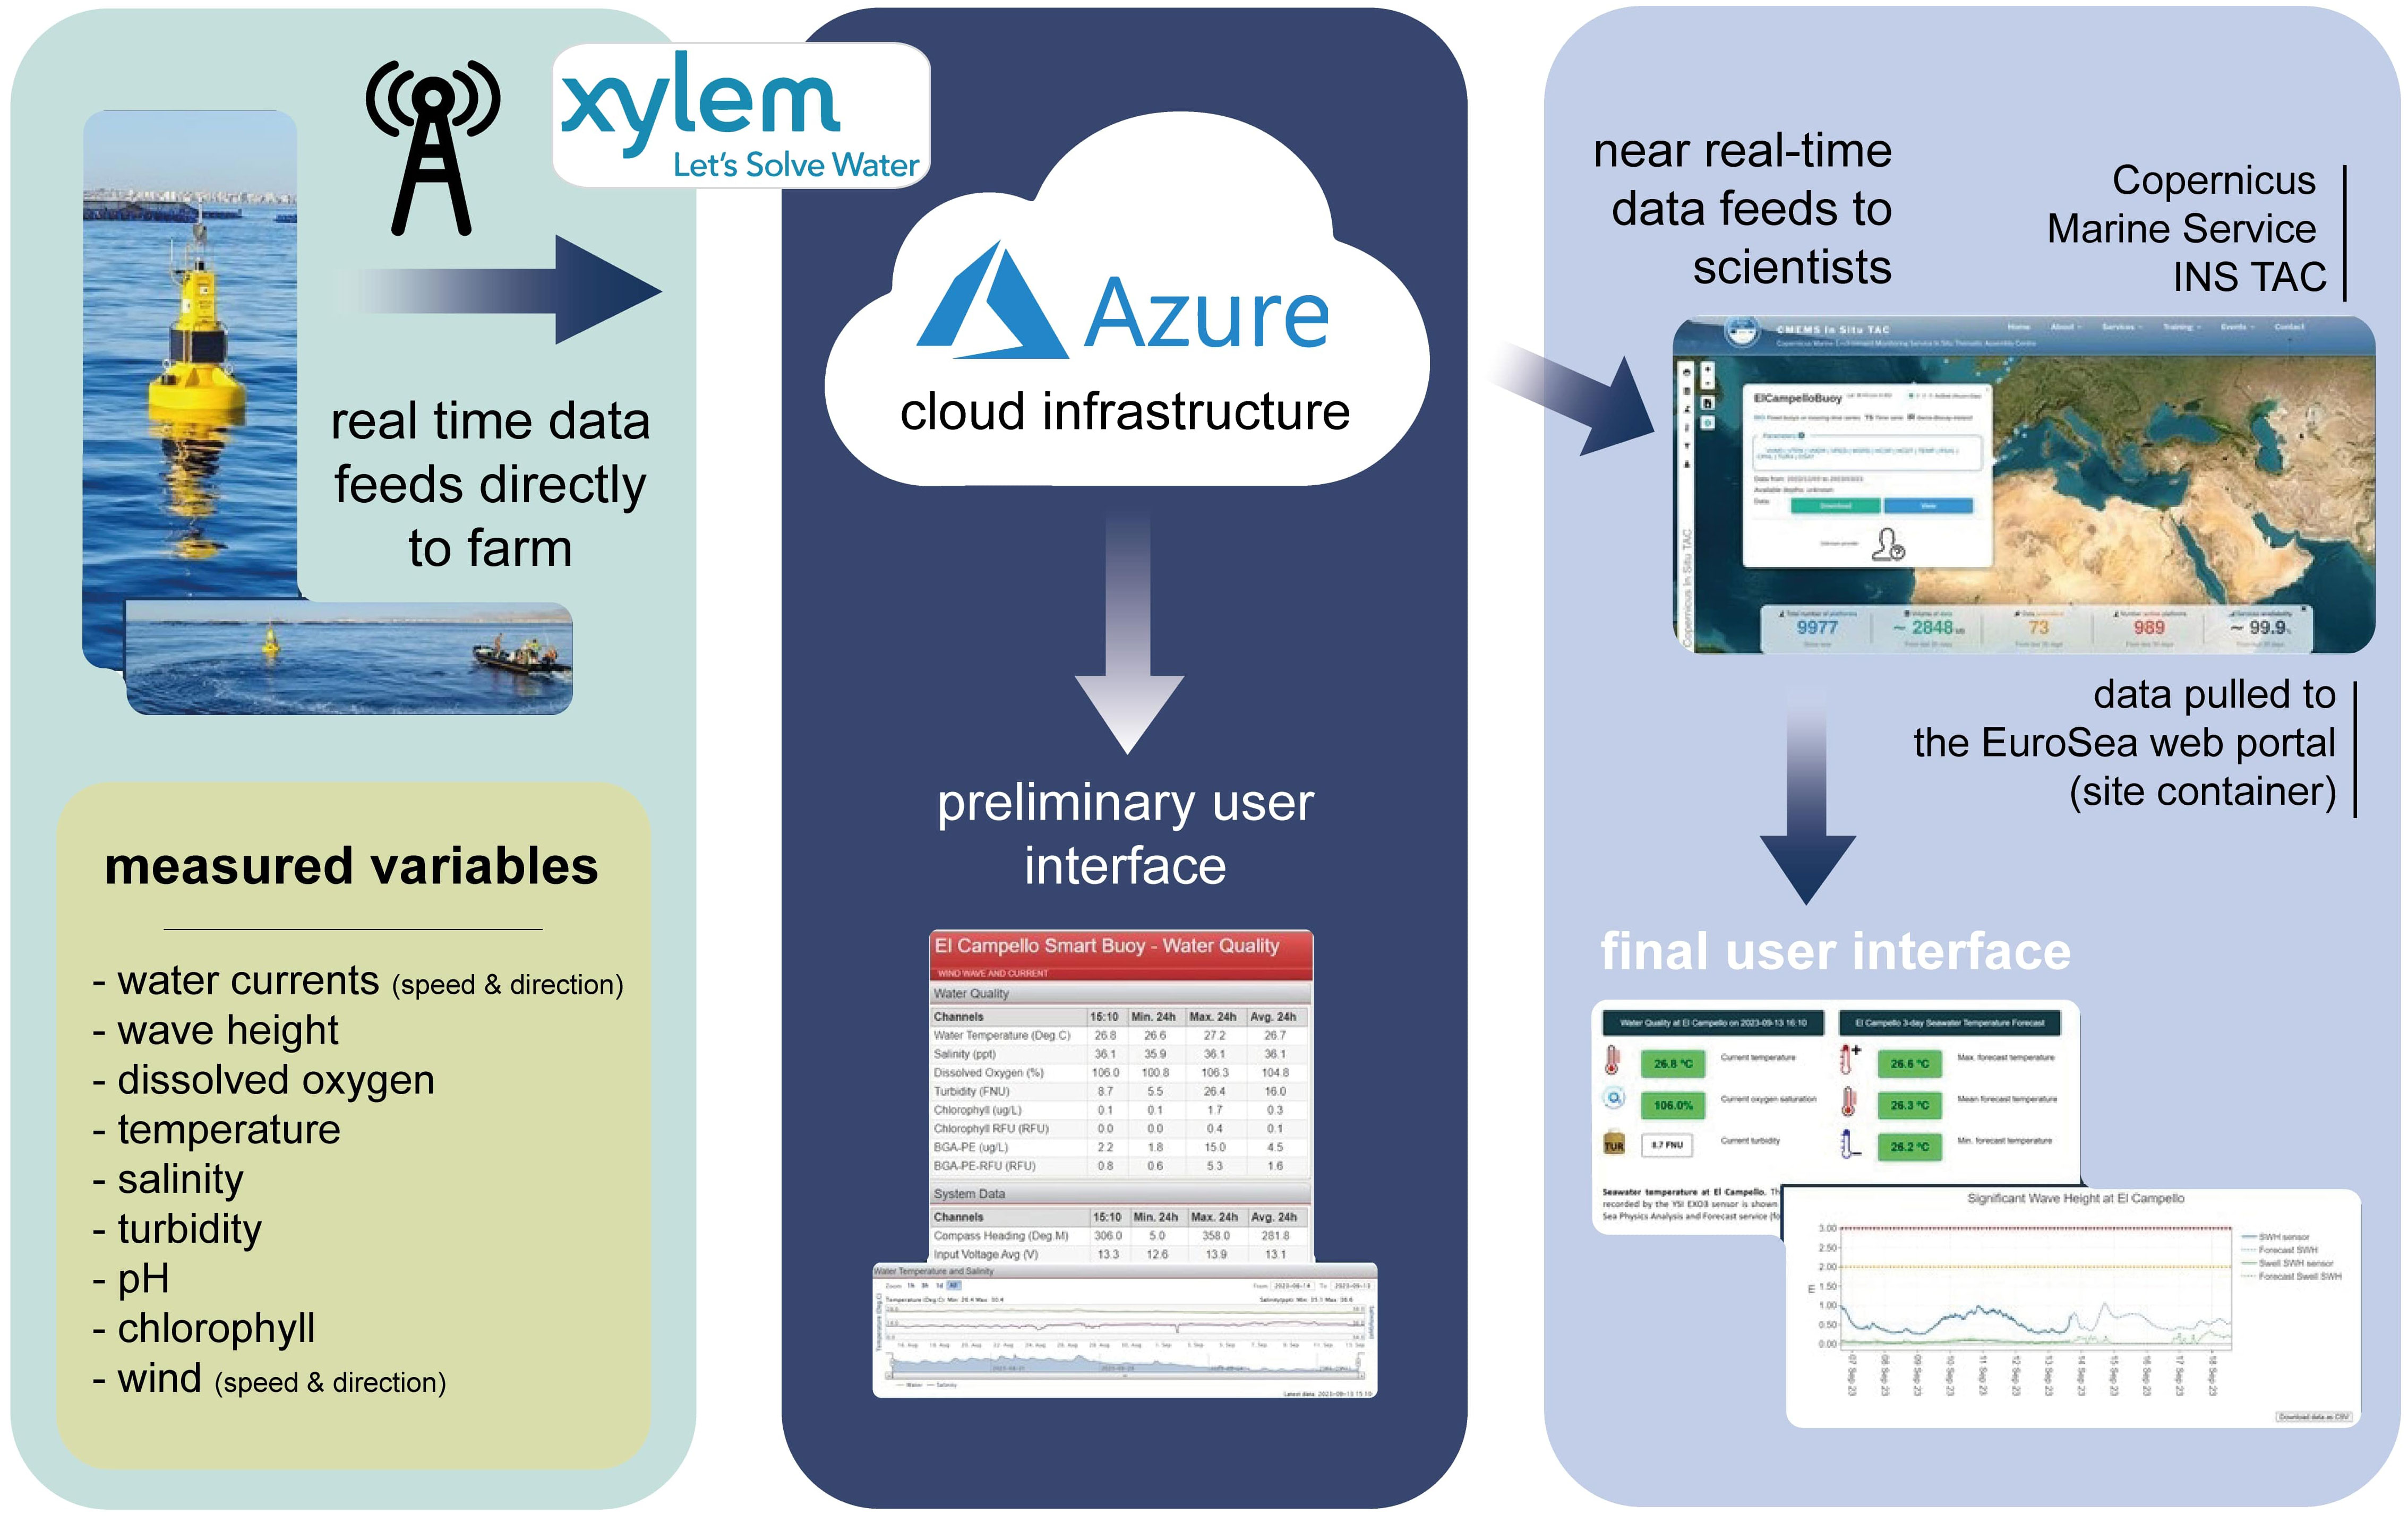
Figure 3 Data flow from the Xylem-Aanderaa instruments and cloud infrastructure, where a preliminary user interface is generated, to the Copernicus Marine Service INS TAC and to the EuroSea web portal described in this work.
3.1 Steps for implementation
Each of the sub-processes enumerated above are described in this section in detail, listing the different steps involved in a sequential manner, so that the guidelines described here can be replicated elsewhere.
3.1.1 In-situ data operations: the site container
The in-situ data operations consist of accessing and downloading the.xml files delivered by the Xylem-Aanderaa instruments, reading and storing locally the oceanic parameters of interest, and sending the data to the shared volume to be displayed on the website. This is described in the flowchart in Figure 4A.
A. The in-situ operations are set to run every ten minutes since this is the frequency at which new files are released by the monitoring station. The first step involves reading a configuration file containing the application-specific parameters. This is a plain text file where the following variables have to be defined: (1) ndays: the number of days back from today that will be displayed on the website, regarding time series graphics; (2) SUR, MID, BOT: these are the Doppler Current Profiler cell indexes corresponding to the surface, mid-water and seabed measurements, and depend on the local water depth and the ADCP configuration; (3) host, user, pswd, folder: these are the credentials needed to access the buoy.xml files in a remote SFTP server, and the location of the database within the server; (4) clim_site: a local file providing sea surface temperature seasonal cycle and 90th percentile at the farming site. These time series are displayed on the website and used to determine the occurrence of marine heat waves. They can be derived from a local, long-term SST record (e.g., from remote-sensing historical data) using the methodologies described in Hobday et al. (2016).
B. Once the configuration of the application has been determined, the next step is to produce a list of the.xml files already available in a local directory. These files would have been downloaded during previous executions of the application and contain the recordings of different oceanic parameters from the monitoring station sensors. This is a local database that grows over time as more and more files are downloaded during each program’s execution.
C. The credentials specified in the configuration file are now used to establish an SFTP connection with the remote server to which the monitoring station is sending the in-situ data. Any.xml file located on the remote server that is not available locally is now downloaded. Normally, except for the first execution, only the file corresponding to the latest recording will have to be downloaded.
D. The.xml files contain a considerable amount of redundant information of no interest to the stakeholders. For this reason, some filtering is applied on the raw instrumental data to separate the relevant oceanographic parameters to be displayed on the website. For a later ease of access by the web application, this relevant information is organized as a data structure, or dictionary, and saved to a local file that is updated during every program execution (see step g. below). Here, this local dictionary is loaded into the memory. If it does not exist yet (e.g., first execution), an empty data structure is initialized.
E. The new file(s) downloaded in step c. above are read to retrieve the oceanographic data that, based on previous interactions with the stakeholders, have been deemed relevant to be displayed on the web portal.
F. The local dictionary loaded in step d. above is now updated with the new data.
G. At this moment, all the historical records from the time when the buoy started transmitting data until the present are being handled by the application. This will be useful for the historical data selection tool (see Section 3.1.5). However, for the sake of clarity, it is usually better that, in the forecasting & warnings website, the stakeholders are provided not with the whole historical record but only with the oceanographic conditions during the last days. In this step, the number of days back from today specified in the configuration file is subset for all the oceanic parameters, except for the directional data, such as winds, waves and currents (see step i. below). It is suggested that only the last two weeks of data should be displayed on the portal, but this needs to be discussed with the stakeholders.
H. Now, the site climatology specified in the configuration file is read from a local file that has to be produced for every application. These data are independent of the monitoring station recordings.
I. Directional data are subset from the historical records, albeit only for the last 24 hours, ignoring whatever had been stated in the configuration file. This is because directional data have a different graphical representation, not as a time series, but as a wind rose histogram. For the sake of clarity, only 24 hours are represented on the portal to avoid an unclear histogram.
J. Finally, any warning statuses are determined, and all the information gathered throughout the process is sent to the shared volume, where it can be accessed by the web application. Warning statuses refer to the occurrence of marine heat waves, storm events and hypoxic conditions. Warning definitions must be agreed upon with the stakeholders depending on their needs concerning healthy fish growth and development and/or safe working conditions at sea.
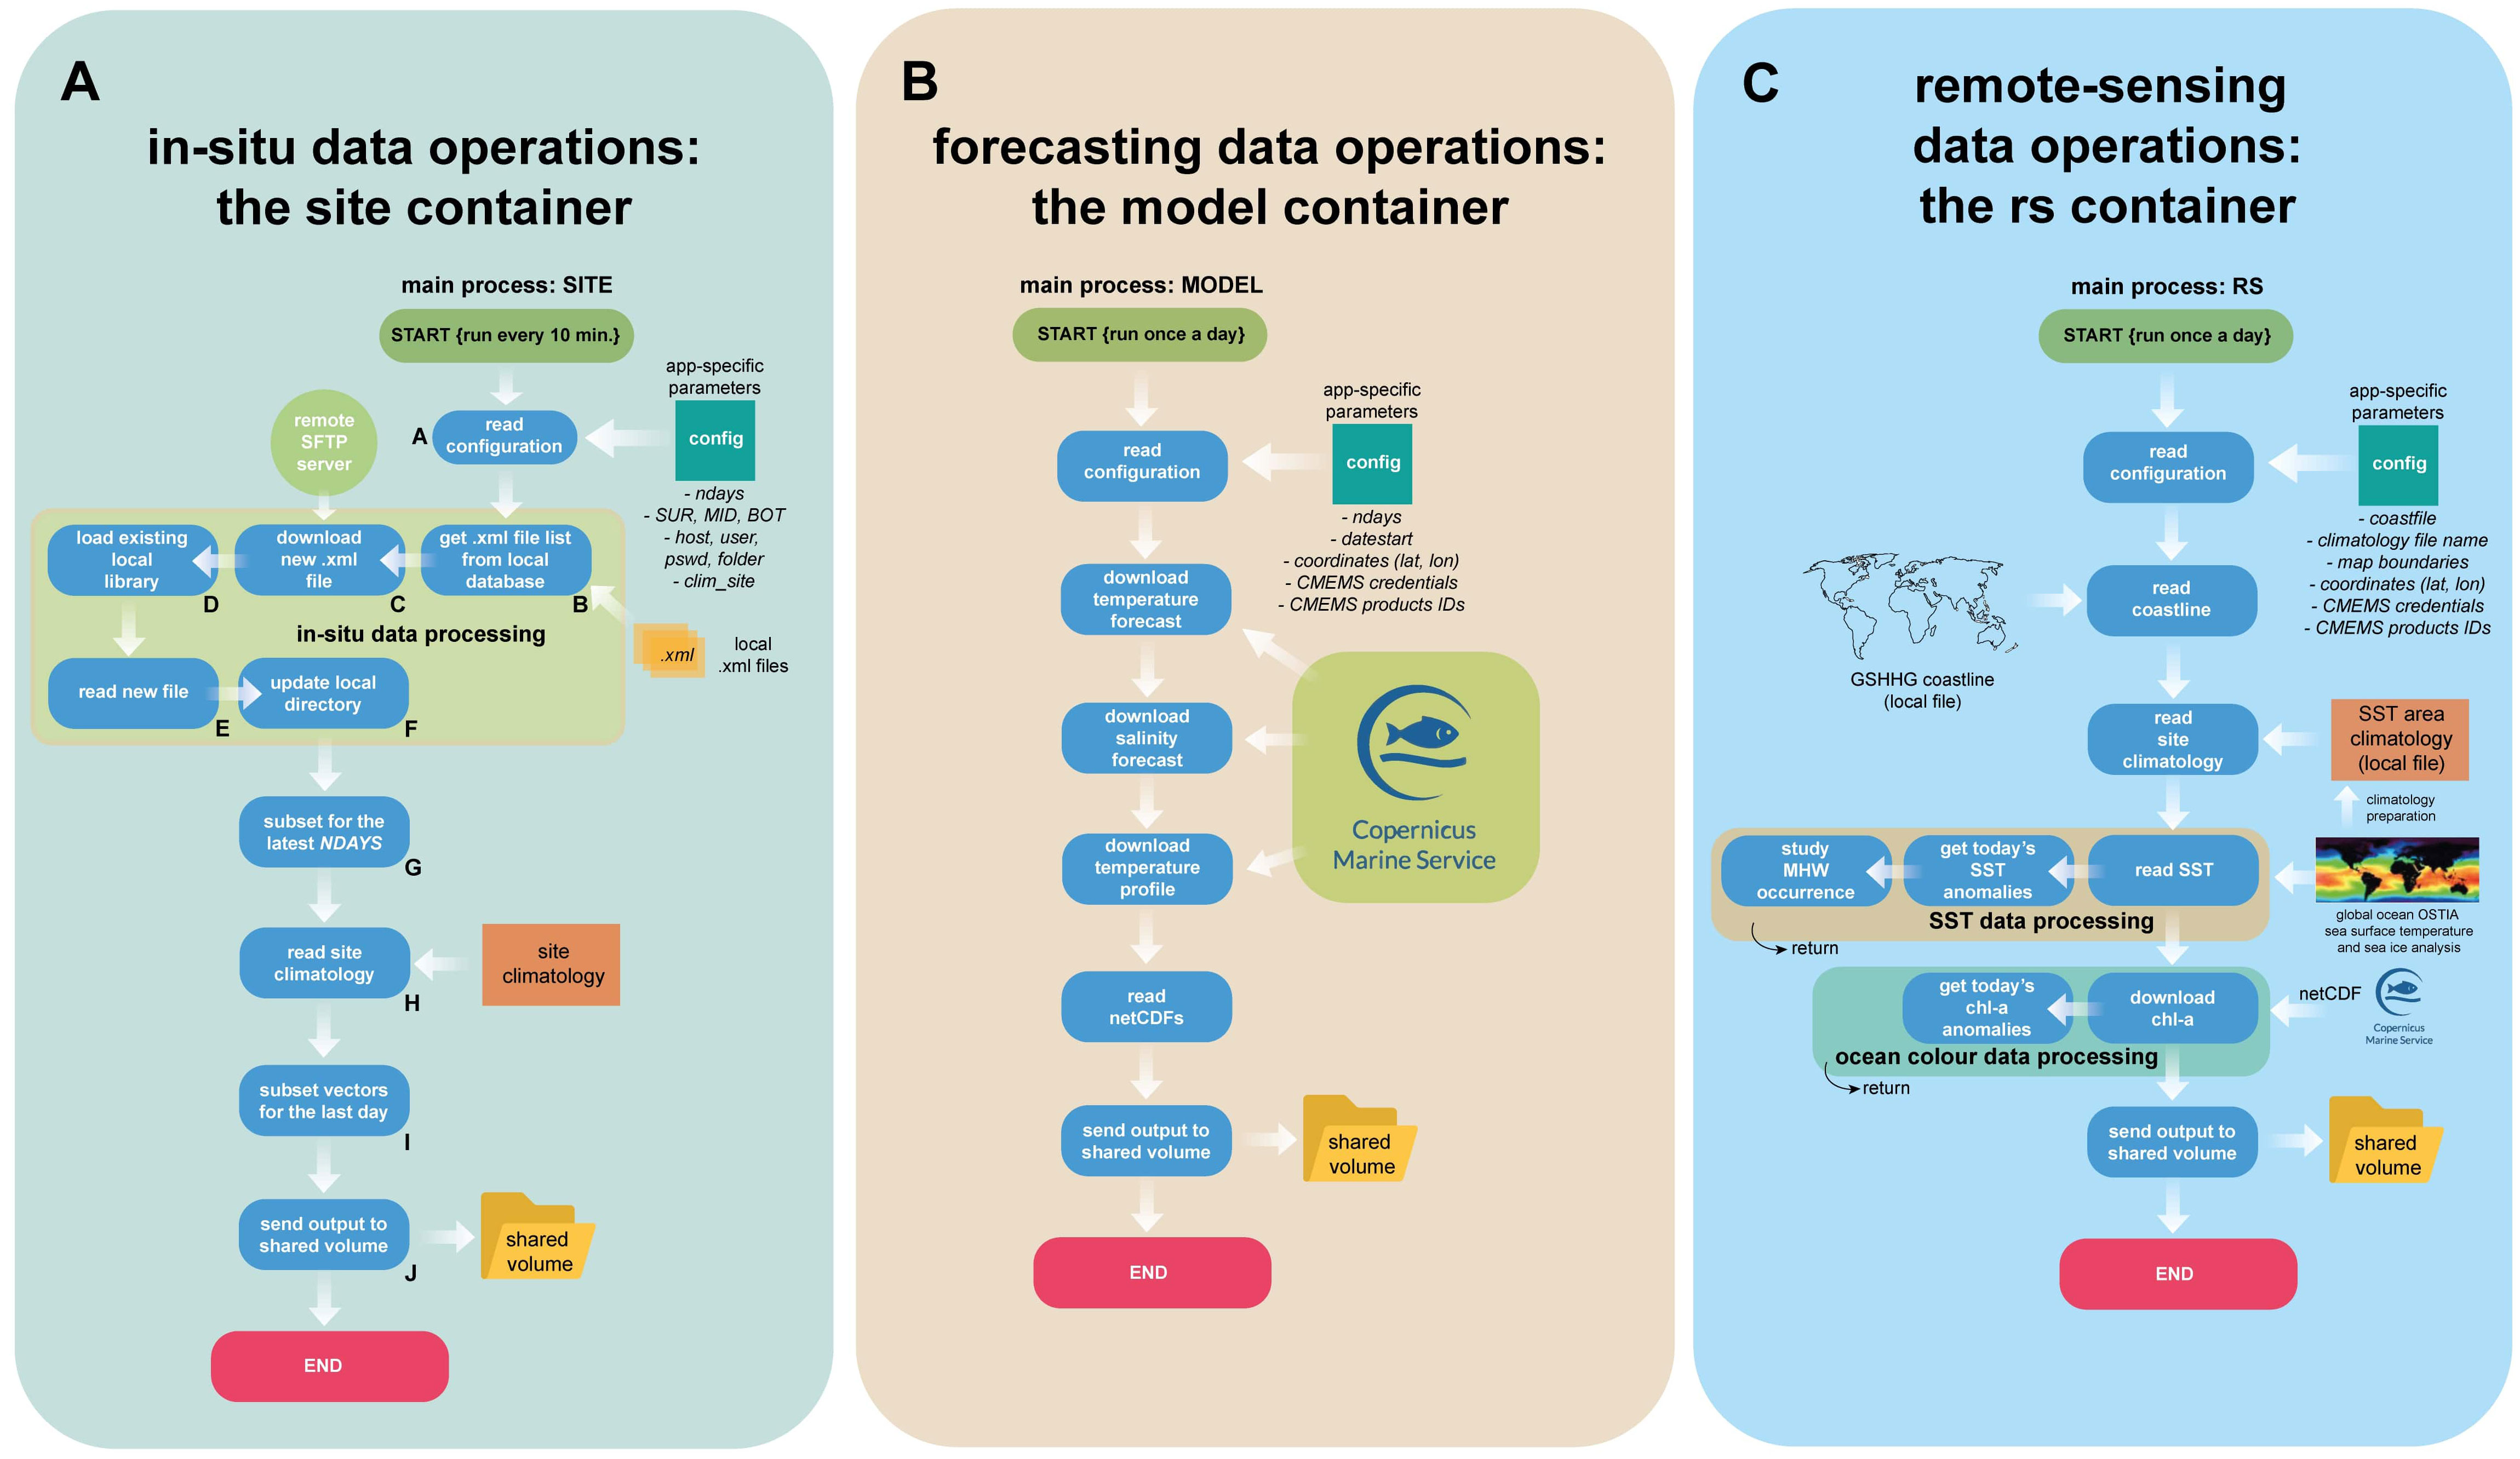
Figure 4 (A) Flowchart describing the in-situ data operations. (B) Flowchart describing the model data operations. (C) Flowchart describing the remote-sensing data operations.
3.1.2 Forecasting data operations: the model container
The model operations basically consist of downloading the required datasets from the Copernicus Marine Service as NetCDF files, and then sending the data to the shared volume to be accessed by the web application (Figure 4B). This process is set to run once a day. The required datasets are the forecasts (temperature and salinity) and the temperature profile. Stakeholders from Deenish Island have shown interest in having information on the seawater temperature distribution along the water column and, since this is not provided by the sensors in the monitoring stations, the temperature profile is derived from hydrodynamic model products available from the Copernicus Marine Service.
Again, the first step is to read a configuration file, where different variables are defined, including: (1) the number of days back from today that will be displayed on the website for the seawater temperature profile, (2) the starting time to download a historical record of the seawater temperature profile, (3) the geographical coordinates of the mooring, (4) the Copernicus Marine Service username and password, and (5) the Copernicus Marine Service IDs of the desired products and services.
For Deenish Island, the Atlantic - European Northwest Shelf - Ocean Physics Analysis and Forecast service (DOI:10.48670/moi-00054) is used. This service is a 1.5-km horizontal resolution NEMO application, forced by the ECMWF Numerical Weather Prediction model and assimilating SST, temperature and salinity profiles and remote-sensing sea level anomaly data. The service provides 6-day forecasts, thus making it suitable for predicting the occurrence of marine heat waves in advance.
For El Campello, the Mediterranean Sea Physics Analysis and Forecast service (DOI:10.25423/CMCC/MEDSEA_ANALYSISFORECAST_PHY_006_013_EAS7) is used, a NEMO-based coupled hydrodynamic-wave model in a 1/24° horizontal resolution grid, with data assimilation of temperature and salinity profiles and remote-sensing sea level anomaly data. The service provides 3-day forecasts. In addition, wave forecasts are derived from the Mediterranean Sea Waves Analysis and Forecast (DOI:10.25423/cmcc/medsea_analysisforecast_wav_006_017_medwam4), and 5-day Significant Wave Height forecasts (SWH) are provided on the web portal, with orange warnings activated when the SWH exceeds two meters, and red warnings activated when the SWH exceeds three meters.
Surface temperature and salinity forecasts, together with seawater temperature profiles, are downloaded daily from the Copernicus Marine Service using the python-motuclient. Data are downloaded, in NetCDF format, only for the nearest node to the mooring deployment. Finally, the data is read and sent as a data structure, or dictionary, to the shared volume, where it can be accessed by the web application.
The Copernicus Marine Service periodically publishes Quality Information Documents (QUID), providing a detailed assessment of the performance of the numerical models. This assessment is based on the comparison between model outputs and measurements from different observational platforms. This quantitative assessment is expressed as Estimated Accuracy Numbers (EANs). Some examples of QUID’s are Tonani et al. (2022) for the Atlantic - European Northwest Shelf - Ocean Physics Analysis and Forecast service, Goglio et al. (2022) for the Mediterranean Sea Physics Analysis and Forecast service, and Oikonomou et al. (2022) for the Mediterranean Sea Waves Analysis and Forecast.
The pilot sites in this study are in shallow waters (Table 1) and thus large-scale, coarse numerical models may not be appropriate for these sites. Nevertheless, the Quality Information Documents of each of the products listed above show a good model performance –in terms of the level of agreement between observations and predictions– even at coastal sites. Finally, and as a general advice, once enough in-situ data is collected at the site, it is highly recommended to validate the numerical models used in the observatory with the measurements collected on site. To increase the reliability of modelled forecasts, a decision should then be made regarding the need to either (a) develop a downscaled numerical model or (b) switch to a local model, if available.
3.1.3 Remote-sensing data operations: the rs container
The remote-sensing operations consist of the following steps: (1) download the latest SST map for the area of interest, (2) using an SST climatology, calculate the SST anomaly and analyse the occurrence of marine heat waves, (3) download the chlorophyll-a distribution from ocean colour observations, (4) determine the chlorophyll-a anomaly, (5) send the data to the shared volume to be accessed by the web application (Figure 4C). Remote-sensing products complement the in-situ measurements by providing a wider picture of the surface temperature and chlorophyll-a distribution. This is of interest to the aquaculture sector to be able to anticipate the occurrence of extreme marine events at the farm, such as marine heat waves or harmful algal blooms.
Like the processes described above, the remote-sensing operations start with the configuration options, where the geographical boundaries (West, East, South, North) of the area of interest are entered. Moreover, the mooring coordinates, Copernicus Marine Service credentials and IDs of the desired products and services need to be specified. Additional input files are required and have to be prepared before the process runs for the first time. These are a coastline file and an SST climatology file.
The coastline, used later to display the maps on the website, can be derived from the GSHHG (Global Self-consistent, Hierarchical, High-resolution Geography) database (Wessel and Smith, 1996), which provides worldwide coverage of the global coastlines at five different resolutions.
The SST climatology is required to calculate the SST anomaly and to determine the occurrence of marine heat waves. It consists of a NetCDF file providing, for each calendar day, the expected SST distribution (i.e., the climatological values), and the 90th percentile values for temperature across the area of interest. This is in agreement with the methodology described in Hobday et al. (2016), which has been followed here, where a marine heat wave is defined as any event characterized by a seawater temperature anomaly exceeding the 90th percentile threshold for at least five consecutive days. A suitable SST product needs to be selected. Here, the Global Ocean OSTIA Sea Surface Temperature and Sea Ice Analysis product (Good et al., 2020) has been selected due to its global coverage of the world ocean, which makes it suitable for standardization and applications of these best practices in other parts of the world. However, different SST products may be preferred. In any case, the selected product should be used both for preparing the climatology and for displaying the daily SST on the website application (Figure 4C), because then the SST anomaly can be easily calculated by subtracting the SST climatology from the actual SST distribution.
Chlorophyll-a concentration is derived from satellite imagery. The distribution of chlorophyll-a concentration is downloaded from ocean colour products available at the Copernicus Marine Service. Then, chlorophyll-a anomaly is determined as the difference between the actual chlorophyll-a concentration and a 60-day running median, ending two weeks before the current image (Tomlinson et al., 2004). Tomlinson et al. (2004) used a 60-day running mean to calculate chlorophyll-a anomalies and investigate the occurrence of Karenia brevis HABs in the Gulf of Mexico. The same procedure is followed here but using a 60-day running median instead, since the median, being less affected by outliers and skewness, is a more robust measure of central tendency and should be preferred when dealing with non-symmetrical distributions.
3.1.4 Lagrangian particle-tracking operations: the lptm container
Lagrangian particle-tracking models simulate the advection of water under the influence of oceanic currents. This is useful for a better understanding of ocean circulation and can be used for tracking passive tracers in the ocean. More complicated behaviours can be introduced to simulate windage, flotation and degradation, which has applications in the tracking of oil spills, marine litter or floating bodies. Here, particle-tracking modelling is used to track the circulation along the coast to provide insight into the advection of potential Harmful Algal Bloom outbreaks along the southwest coast of Ireland. Some examples of previous research in the scientific literature where particle-tracking modelling was used to study the effects of Harmful Algal Blooms are Aleynik et al. (2016); Bedington et al. (2022); Cusack et al. (2016) and Pinto et al. (2016).
The OpenDrift (Dagestad et al., 2018) particle-tracking model is used. Particles are seeded along four transects on the southwest coast of Ireland (Figure 5A): the Kenmare transect, along the mouth of the Kenmare Bay where the farm is located, and three transects perpendicular to the coastline, from west to east: Dursey, Mizen and Toe. A total of 250 particles are released every minute along each transect for one day, and each particle is tracked for three days. An animation showing the motion of the particles is shown on the portal.
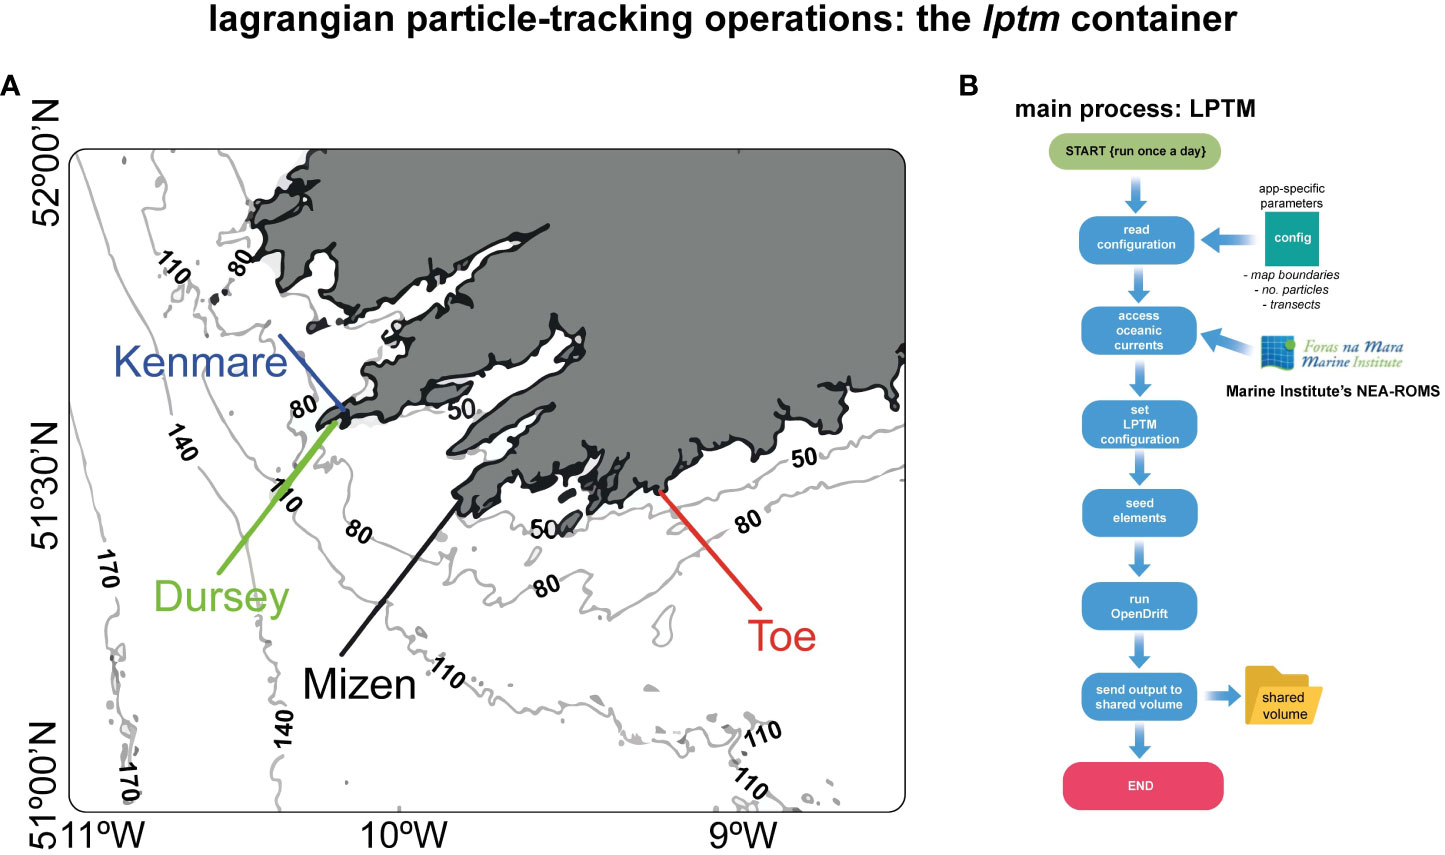
Figure 5 (A) Location of the four transects around the SW coast of Ireland: Kenmare (blue), Dursey (green), Mizen (black), Toe (red). Particles are released along these transects for the Lagrangian particle-tracking simulations. (B) Flowchart describing the Lagrangian Particle-Tracking Model operations.
In this process (Figure 5B), the configuration settings include the specification of the map boundaries (West, East, South, North), the number of particles released per transect and the location of the transects. After reading the configuration settings, the software accesses the 3-day forecasts of oceanic currents delivered by the Marine Institute’s Northeast Atlantic model (Dabrowski et al., 2014), a ROMS-based hydrodynamic model covering the waters around Ireland and Northeast Atlantic with 1.1-2.4 km of horizontal resolution. Hourly instantaneous outputs of this Northeast Atlantic model are freely accessible through a THREDDS server, which makes this product especially suited for this application. Different open-access, highly resolved hydrodynamic models would have to be selected for applications in other regions.
Additional configuration settings are then introduced in the model (e.g. particles are allowed to re-enter the water after hitting the coast). Then, particles are released along the transects and the OpenDrift model is run. Finally, the output is sent to the shared volume to be accessed by the web application.
3.1.5 Deploying the website: the webapp container
The web application provides two distinct functionalities: the Operational (Forecasting & Warnings) System, and the Historical Portal (Figure 6). The former provides the latest observations (in-situ and satellite), forecasts and warnings, and feeds on the information provided by the processes described in Sections 3.1.1-3.1.4 above. The Historical Portal provides a data selection tool for the inspection of older, observed data (in-situ and satellite). The user submits a request consisting of a starting date and an end date, and then the application retrieves the data corresponding to the requested time span. This involves accessing the historical in-situ data record prepared by the site process or downloading remote-sensing or modelled seawater temperature profile data from other sources, like the Copernicus Marine Service. The data that will be displayed on the website are wrapped in a Python dictionary, that is then sent to a Jinja2 template. Interactive Plotly graphics and other forms of interactivity are achieved using Javascript. Finally, the website is deployed as a uwsgi-nginx-flask application.
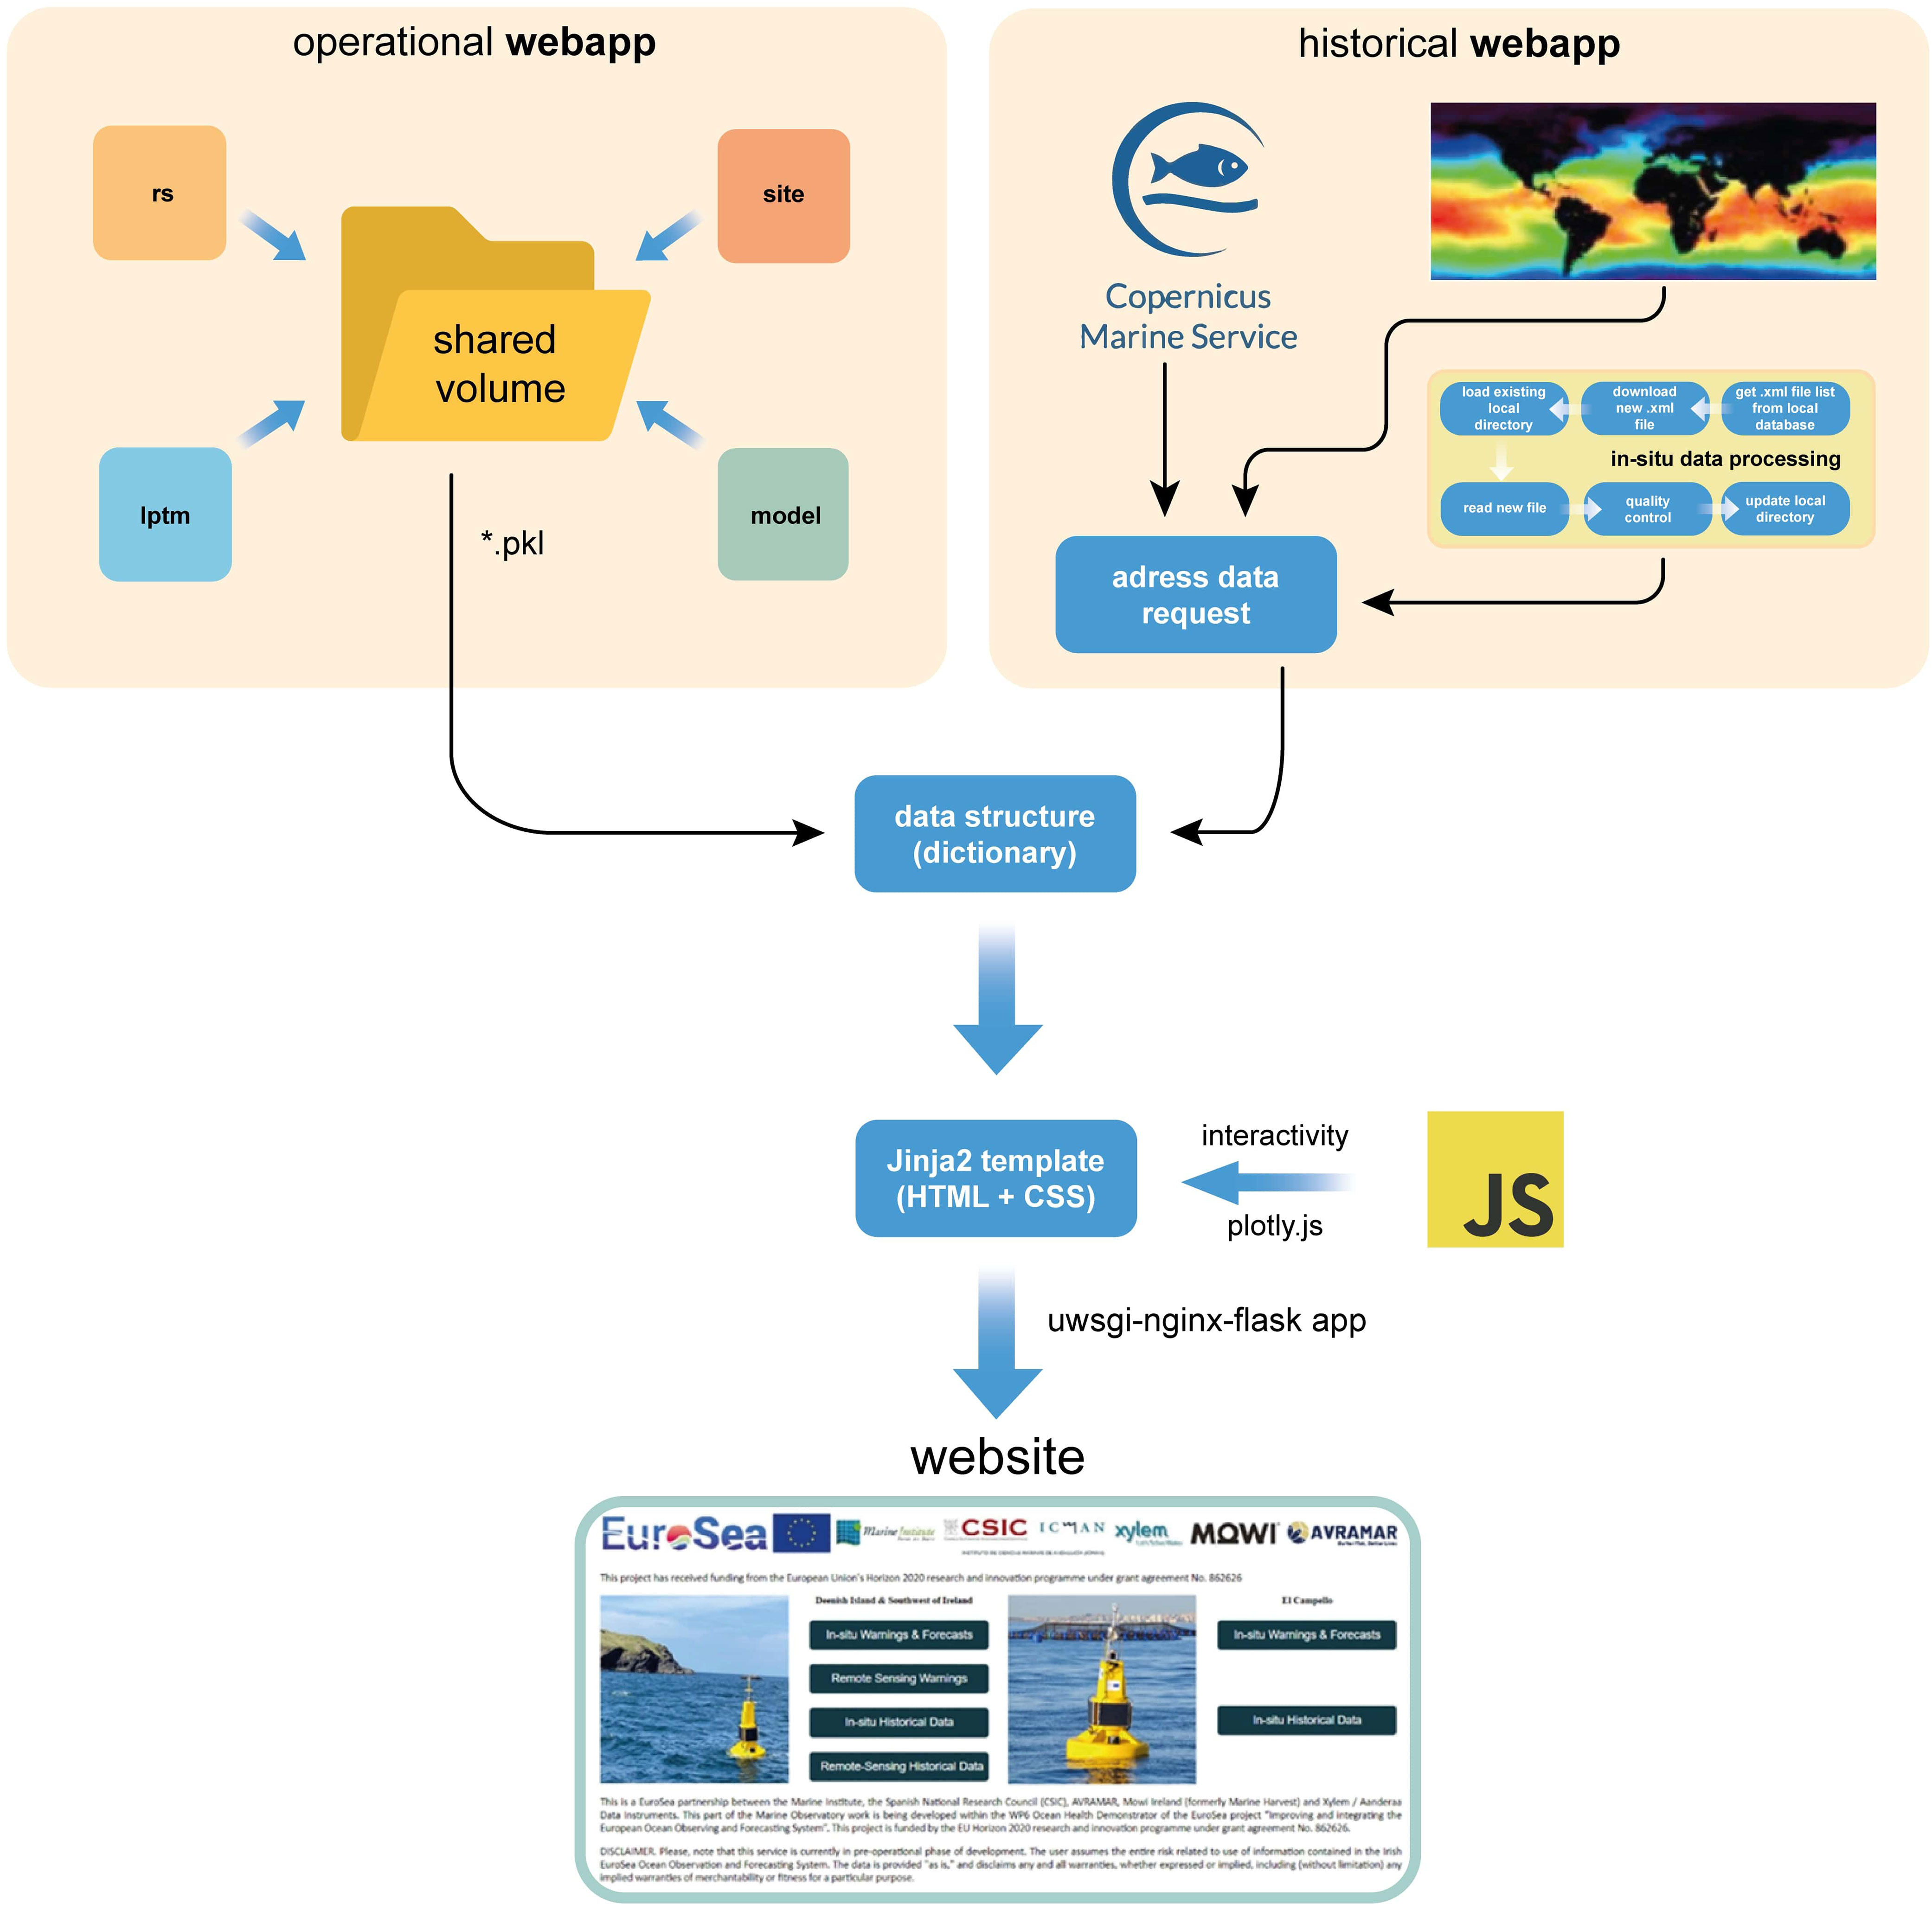
Figure 6 Flowchart schematizing the web application deployment.
3.2 Data required
The data required to deliver all the outputs available on the website can be listed as follows:
A. The most important dataset is the in-situ observations recorded by the monitoring station. For each site, this consists of a set of.xml files released every 10 minutes and delivered through an SFTP server hosted by enoc.puertos.es. These.xml files contain the readings of each of the sensors in the monitoring station, including the Motus Wave Sensor (significant wave height [m], wave peak direction [Deg.m], wave peak period [s]), the Doppler Current Sensor and Doppler Current Profiler Sensor (horizontal speed [cm/s] and direction [Deg.m]), the Gill Maximet (wind speed [m/s] and direction [Deg.m]), and the YSI EXO2 (Deenish) & YSI EXO3 (El Campello) sensors (temperature [degC], salinity [ppt], dissolved oxygen [%], turbidity [FNU], chlorophyll RFU and pH). The EuroSea partner Xylem-Aanderaa was the manufacturer and developer of the in-situ sensors, while the integration of data products and web portal were developed by the EuroSea partners Marine Institute and CSIC. The type of data products needed is determined by the end users in the aquaculture industry (Mowi and AVRAMAR).
B. Models providing forecasts. There are two types of forecasting models that might be considered here: (a) Numerical models. Hydrodynamic models approximate the mass, heat and momentum conservation equations of the ocean using finite difference methods and, with appropriate forcings (i.e., atmospheric and freshwater discharge) and adequate boundary conditions, can predict the evolution of the ocean starting from given initial conditions. Currently, hydrodynamic models provided by the Copernicus Marine Service are being used to provide forecasts and temperature profiles at the aquaculture sites: Met Office’s Atlantic – European Northwest Shelf – Ocean Physics Analysis and Forecast in Deenish Island; and the Euro-Mediterranean Centre on Climate Change’s (CMCC) Mediterranean Sea Physics Analysis and Forecast in El Campello. Wave forecasts are derived from the Mediterranean Sea Waves Analysis and Forecast (see Section 3.1.2 above) (b) Machine Learning models. In recent years, machine learning techniques, and more specifically neural networks, have shown significant results for time series forecasting, given their non-parametric nature, highlighting their ability to approximate continuous and nonlinear functions. Traditionally, models like ARIMA (Ho and Xie, 1998), moving averages or exponential smoothing were used to predict future values based on historical data. However, recurrent neural networks like Long Short-Term Memory, LSTM (Yu et al., 2019) or other newer models like Transformers (Wolf et al., 2020) are currently being implemented given their improvements in forecasting efficiency. For example, LSTM models are able to contextualize when working through input and output time series, i.e., understanding how past events condition the upcoming values. In this sense, multivariate time series results are especially interesting when predicting co-dependent oceanic variables, allowing neural networks to learn the relationships between them and thus be able to predict how they will covariate in the future. The application presented here does not use Machine Learning models for oceanic forecasting, but it is a promising field in continuous development.
C. Remote-Sensing. The aquaculture farmers may be concerned not only by local oceanic processes, but also by the wider oceanographic conditions in the area around the farm. An example is the occurrence of algal blooms that can originate in a remote location and then be advected by currents towards the farming area. Remote-sensing products are used to complement the local in-situ and model datasets, and to extend the capabilities of this service to a broader area, thus providing information on these wider oceanographic phenomena. Sea surface temperature (SST) and chlorophyll concentration products are being offered for areas covering from 50.0°N, 11.6°W to 52.8°N, 8.0°W for the Southwest of Ireland (Deenish Island) waters; and from 37.6°N, 0.9°W to 41.0°N, 1.4°E for the Levante (El Campello) waters. The SST product is the Global Ocean OSTIA Sea Surface Temperature and Sea Ice Analysis (Good et al., 2020). Chlorophyll concentration and anomalies for the North Atlantic are derived from ACRI’s Atlantic Ocean Colour (Copernicus-GlobColour), Bio-Geo-Chemical, L4 (daily interpolated) from Satellite Observations (Near Real Time) available from the Copernicus Marine Service.
D. Baseline climatology. A sea surface temperature baseline climatology has been determined from the 1982-2021 data from the Global Ocean OSTIA Sea Surface Temperature and Sea Ice Analysis (Good et al., 2020). The baseline climatology has been determined both for the farming sites (local climatology) and the wider remote-sensing areas (2-D climatology). These datasets are stored in static files that are later used for determining the occurrence of marine heat waves following the definition in Hobday et al. (2016). The local climatology is a Python pickle file containing the multi-year mean SST and 90th percentile for the farming site for each day of the year. The 2-D climatology is a NetCDF file providing the same information, but for a range of longitudes and latitudes covering the area of interest.
E. GSHHG coastline database, used for drawing the coastline in remote-sensing and particle-tracking maps. This is a public dataset (Wessel and Smith, 1996) that can be subset for any region of interest. In this application, the coastlines of Southwest of Ireland (Deenish Island) and Levante (El Campello) have been downloaded and saved as static Python pickle files that are accessed by the application.
F. The Marine Institute’s Northeast Atlantic model (Dabrowski et al., 2014) oceanic currents are used as input for the OpenDrift particle-tracking model in the Southwest of Ireland. Different choices of hydrodynamic models are, of course, possible, depending on the application site, but this needs to be conveniently set in the lptm container.
3.3 Tools, models and software used
The web server consists of a Flask web application in Python that runs with uWSGI and Nginx in a single Docker container. For the website containerization, the tiangolo/uwsgi-nginx-flask image has been used. Docker 20.10.18 version has been used in an Ubuntu 18.04.6 LTS (Bionic Beaver) machine. Python 3.8 version is used across all sub-containers. Graphics on the website are rendered with the latest version of Plotly.js. OpenDrift v.1.10.4 (Dagestad et al., 2018) model is used for particle-tracking modelling. The Copernicus Marine User Support Team’s motuclient v.1.8.4 is used to download model and remote-sensing data from the Copernicus Marine Service. In addition, the following Python packages are required: netCDF4 v.1.5.7, numpy, pandas, paramiko, pysftp, python-dateutil, pytz, WebOb. The code of this application can be accessed at https://github.com/IrishMarineInstitute/EuroSea.
The server runs in the EGI (FEDCOM) Infrastructure, a distributed computing platform designed to host containerized applications for scientific research. This platform is based on the European Grid Infrastructure (EGI) Federation, which provides a distributed computing infrastructure across Europe and beyond (Fernández-del-Castillo et al., 2015). The EGI (FEDCOM) Infrastructure is specifically designed to support containerized applications, which are self-contained packages that include all the necessary dependencies and configurations to run the application (Merkel, 2014).
The infrastructure is built on top of Kubernetes, a container orchestration platform that allows for easy management and scaling of containerized applications (Luksa, 2017). Kubernetes provides a flexible and robust infrastructure for deploying and managing containerized applications and allows for easy integration with other cloud services and tools.
In addition to its containerization capabilities, the EGI (FEDCOM) Infrastructure offers a range of other tools and services, including data management, workflow orchestration, and data analysis tools, all of which are designed to work seamlessly with the hosted containerized applications. These tools provide researchers with a comprehensive computing environment to streamline their work (Fernández-del-Castillo et al., 2015).
The use of Kubernetes, as well as other cloud services and tools, makes the EGI (FEDCOM) Infrastructure a powerful and scalable platform that provides researchers with a robust and dependable environment for their work. Additionally, its focus on containerization ensures that researchers can easily deploy and manage their applications without worrying about compatibility issues or dependencies, making it a natural choice for scientific research applications, as in this project.
3.4 International standards used
Data Management follows IODE Data Management Quality Framework practices. (Intergovernmental Oceanographic Commission of UNESCO, 2019).
3.5 Quality control
Real-Time Quality Control procedures are applied by the Copernicus Marine Service INS TAC (Wehde et al., 2021).
3.6 Implementation challenges or issues
Possible challenges or issues that may arise during the implementation of these best practice guidelines are:
A. Data transmission from the monitoring station is stopped. Oceanographic buoys are exposed to a wide range of weather conditions that may result in severe damage to the electronics and sensors. This will result in a data gap that the web application will have to handle until the instruments are repaired and re-deployed. Replacing missing records with a “NaN” value and displaying N/D on the web portal indicates the lack of measurements. Adding a warning message on the home page is advisable to keep users informed.
B. Unavailability of forecasting data for a particular site. Forecasts are derived from either hydrodynamic and biogeochemical models or using a Machine Learning approach. When none of these approaches are available, forecasting is not possible and so the portal only provides access to historical and current conditions.
C. Establishing a baseline climatology for sea surface temperature can be difficult due to either (1) a lack of a long-term record of sea surface temperature at the site, or (2) a lack of confidence in available sea surface temperature records. In the absence of long-term in-situ records, a common approach is to use remote-sensing SST products. However, biases between the SST record and the actual seawater temperature at the site need to be taken into consideration. Another subject that has been under debate in EuroSea (Annual Meeting 2022, Cádiz, Spain – Workshop 4A Marine heat waves – a cross-cutting indicator in EuroSea) is the record length used for the computation of the baseline climatology. Hobday et al. (2016) recommend at least a 30-year SST record. However, it has been argued that, since climate change is increasing seawater temperature worldwide, a long SST record could result in an outdated baseline climatology, not representative of the current climate. Changes in the choice of baseline climatology can have a strong impact on the number, duration and intensity of the marine heat wave warnings provided by this service.
D. Similar to above, lack of confidence in the forecasting products. No matter if numerical or statistical approaches are used for forecasting, thorough validation against actual observations is a must to ensure that good-quality forecasts and warnings are being provided.
3.7 Visualization tools
The information is accessible to the user through an open-access portal at eurosea.marine.ie. From the home page, the user can access the different products available for both sites: Deenish Island and El Campello. Available products are either in-situ or remote-sensing, and either operational (latest + forecast) or historical. The home page also provides access to the feedback reporting tool that is described in detail in Section 3.8. below. Dedicated portals exist for each site at eurosea.marine.ie/Deenish and eurosea.marine.ie/Campello.
In the in-situ operational portals, the latest recorded data and marine warnings are presented at the top of the page for quicker and more convenient access. Point data are displayed as time series, whereas 2-D data are displayed as coloured contour plots. Care has been taken to choose adequate colour palettes that are colour-blind friendly.
Graphics are rendered using Plotly.js because it provides useful interactive tools, such as the individual data display when hovering the mouse pointer over the time series and 2-D contour plots. For a more detailed examination of the data, downloading options are available to the user. When a download request is submitted, a CSV (Comma-Separated Values) file displaying the data is automatically downloaded to the user’s PC.
Further interactivity on the website is achieved with Javascript for (a) selecting the temperature profile layers that the user wishes to visualize, and (b) forward and backward moving along animations (e.g., Lagrangian particle-tracking simulation).
3.8 User feedback mechanisms
User feedback is of paramount importance throughout the whole process to ensure that the service addresses the stakeholders’ needs and concerns in relation to the aquaculture activities. User feedback is gathered through three different mechanisms:
A. Direct, periodic, and face-to-face interaction. This is achieved through periodic meetings (either in person or online) arranged at times that are convenient for both stakeholders and developers. The meetings should focus on the interests and needs of the farm, and how they have been addressed by the portal. Discussions may relate to different aspects of the service, such as:
A.1. What type of information is being displayed? What ocean parameters are of greater concern for the stakeholders? (e.g., seawater temperature, dissolved oxygen saturation, wave height, etc.) What type of products need to be considered? (In-situ data, remote-sensing, model forecasts, etc.). Example: the salmon farm at Deenish Island is mostly concerned about the occurrence of high seawater temperature events at the farm. Therefore, current and forecasted temperatures should be displayed at the top of the website. Not just the in-situ temperature measured by the buoy, but also the temperature profile across the water column is relevant in this application since the salmon cages spread several meters deep. A model is used to provide an estimation of the water temperature profile. Furthermore, remote-sensing SST is provided to inform about the seawater temperature distribution in a wider area covering the Southwest of Ireland. On the other hand, the aquaculture farm at El Campello is not concerned about seawater temperature since the farmed species are tolerant to the warm Mediterranean waters. Instead, their main concern is storm events making it difficult to work at sea, and thus the current and forecasted wave height must be displayed at the top of the website.
A.2. What is the most appropriate appearance of the graphics for a clear and understandable visualization? Aspects like font size, colour blind-friendly palettes or an adequate number of contours in 2-D colour maps need to be considered so that the information is clear to everybody.
A.3. What type of warnings are relevant to the farming activity? This largely depends on the stakeholder needs and the physiological requirements of the species grown on the farm. Are environmental conditions affecting fish health of greater concern? Is the species sensitive to rapidly changing environmental conditions or extreme marine events or is it tolerant to a wide range of oceanic conditions? Are storm events or other weather conditions affecting work and safety at sea the greatest concern?
A.4. What is the frequency at which the information should be updated on the website? Hourly? Daily?
User feedback collected during these meetings is then used to improve the service towards a new version that is closer to the stakeholders’ expectations and needs, and before a new meeting takes place. This process is repeated in an iterative manner until the final product is achieved.
B. Questionnaires. After the deployment of the service, end users are requested to complete questionnaires to allow the developers and users to reflect on their experiences interacting with the website. Key end-user topics to consider during this process include consulting their opinion on different aspects related to the usefulness, comprehensiveness and ease of use of the portal. These questionnaires are useful to determine the degree of stakeholder satisfaction with the service.
C. Helpdesk service and feedback reports. The website includes a free-text input field at https://eurosea.marine.ie/helpdesk to provide any feedback at any time on aspects related to the user experience. When the users click the “Submit” button, an email is sent to the developers, which is treated as a feedback report that is then considered for future improvements of the portal. This provides an easy and alternative mechanism for providing feedback on the service besides the meetings and questionnaires.
4 Results
This section presents the information and services delivered through the web portal. When the user accesses the web portal, different options are available. The user can access either the Operational Portal or the Historical Portal.
4.1 The operational portal
The Operational Portal is organized in different subsections for waves, currents, winds and water quality information. At the beginning of each of these subsections, the latest oceano-meteorological conditions as recorded by the buoy are provided, together with forecasts and warnings. Warnings are presented using a color-coded system, with green meaning “no warning”, orange meaning “moderate warning” and red meaning “severe warning”. When warnings are based on specific environmental variable thresholds, these have been agreed with stakeholders, following their expertise on fish health requirements and safety for work at the sea. Other warnings refer to the occurrence of extreme marine events, such as marine heatwaves.
Environmental data is presented as (a) time series, (b) wind rose histogram diagrams, (c) scatter plots and (d) 2-D contour plots (Figure 7) Besides the graphics, the user is given the possibility of downloading the data as a Comma-Separated Values file (CSV). These files provide the user with the actual data from the instruments and models, together with the corresponding Quality-Control flags.
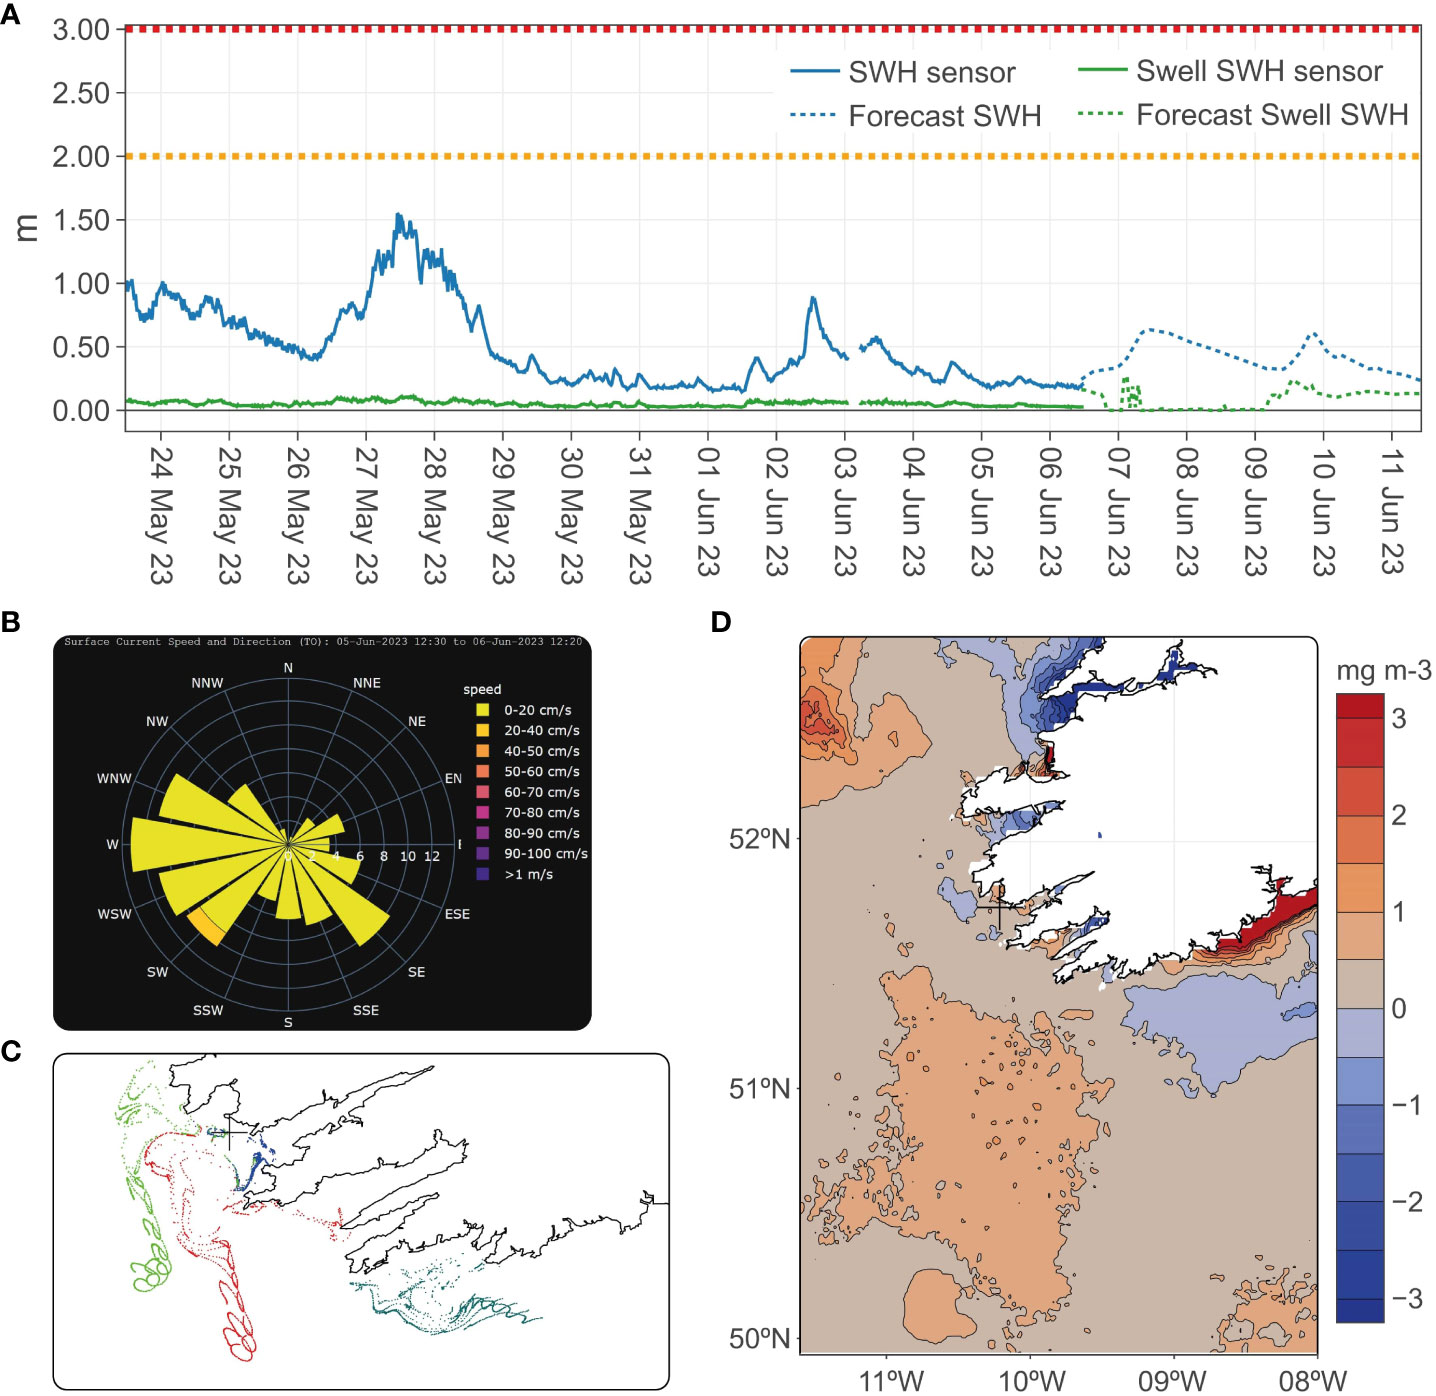
Figure 7 Different examples of environmental data as presented on the portal, resulting from the methodologies described in this work. (A) Significant Wave Height (SWH) at El Campello, showing the latest 14 days of observations from the Motus Wave Sensor, together with a 5-day forecast. The swell component is shown separately, as requested by the stakeholders. The orange (SWH > 2 m) and red (SWH > 3 m) warning levels are shown. (B) Wind rose histogram showing the distribution of surface current speed and direction for the last 24 hours at El Campello, as recorded by the Doppler Current Profiler Sensor. (C) Scatter plot showing the results from the Lagrangian Particle-Tracking Model, providing insight into the surface circulation around the SW coast of Ireland. (D) Chlorophyll-a anomaly (mg m-3) in the SW of Ireland waters determined from remote-sensing observations.
4.2 The historical portal
In the Historical Portal, the user can select a range of dates to retrieve the data corresponding to the desired time interval. After the request is submitted, the user is provided with the same type of information as in the Operational Portal, but for the selected time interval.
5 Discussion
The importance of the oceans can never be over emphasized. Oceans play a vital role in regulating the Earth’s climate system, hold an enormous amount of biodiversity, and constitute an essential source of food. Therefore, ocean observing is of great importance to improve our understanding of the challenges faced due to climate change and its impact on biodiversity, fisheries and aquaculture. However, due to the complexity of the marine environment, ocean monitoring poses multiple challenges, including the difficulty of access to remote and hostile environments, and the need of transnational agreements on well-defined methods on ocean observing. It is precisely the lack of standards in ocean observing methodologies what makes it of paramount importance the definition of Ocean Best Practices covering every aspect of ocean observing, including research, operations and products. In this regard, Ocean Best Practices are a key component in operational oceanographic services (Pearlman et al., 2019).
The present work contributes to the development of Ocean Best Practices in operational observing and forecasting applications to serve the aquaculture sector. As such, it should follow the chain of processes involved in any ocean observing application, addressing the following questions (Pearlman et al., 2019): (a) Why to observe? To provide the aquaculture sector with operational observations and forecasts of marine conditions affecting the fish health and farming operations, with particular focus on Extreme Marine Events such as marine heatwaves, which are expected to become increasingly frequent in a context of climate change. (b) What to observe? Here, the focus in on those oceanic parameters affecting fish health (e.g., stress-inducing seawater temperatures impairing fish growth and survival; tracking of potential Harmful Algal Blooms) or farming operations (strong winds or high waves). Warnings on the portal are oriented to these types of threats to the aquaculture industry. (c) How to observe? Here, this has been addressed through the combination of in-situ measurements delivered by the monitoring stations at both farms, remote-sensing observations providing a wider picture of the distribution of seawater temperature and chlorophyll-a concentration and anomalies, and models providing forecasts on the oceanic conditions and tracking of potential Harmful Algal Blooms. (d) How to integrate, use and disseminate observational outcomes and understand their impacts? Here, this is achieved through the development and implementation of the different procedures described in this manuscript, integrating observations and forecasts from different platforms using a multi-container approach, and disseminating the outcomes through a web portal. The assessment of the impacts of these observations is achieved thanks to the feedback provided by stakeholders through meetings and questionnaires.
There are limited number of other applications providing oceanographic observations and forecasts for the aquaculture sector, which constitute additional examples of Ocean Best Practices. One example is the Harmful Algal Bloom bulletin, which integrates remote sensing and in-situ ocean observations together with numerical hydrodynamic models to provide farmers with information on the impact of Harmful Algal Blooms in Ireland. The guidelines to produce these weekly reports are described in a Best Practices Description Document (Leadbetter et al., 2018), so that the procedures can be replicated in other regions.
Similarly, this work presents good practice guidelines to follow when creating an online, open-access marine observatory serving the needs of the aquaculture sector. In-situ observations, remote-sensing data and model forecasts with warnings can be rapidly retrieved through the application described here. This serves as an example that is easy to replicate for similar aquaculture applications in other parts of the world.
Data availability statement
The datasets presented in this study can be found in online repositories. The names of the repository/repositories and accession number(s) can be found below: https://eurosea.marine.ie https://github.com/IrishMarineInstitute/EuroSea.
Author contributions
DP: Methodology, Software, Writing – original draft, Writing – review & editing. OB: Writing – original draft. MD: Writing – review & editing. AC: Writing – original draft. TD: Writing – review & editing. IG: Writing – review & editing. GNa: Writing – review & editing. GNo: Writing – review & editing. JP: Writing – review & editing. PS: Writing – review & editing. CC: Writing – review & editing.
Funding
The author(s) declare financial support was received for the research, authorship, and/or publication of this article. This study was supported by the European Union’s Horizon 2020 research and innovation program under grant agreement No. 862626.
Acknowledgments
This work benefited from services and resources provided by the EuroSea project (receiving funding from the European Union’s Horizon 2020 research and innovation program under Grant Agreement no. 862626), with the dedicated support of WALTON-CLOUD. Part of this manuscript has been released as a EuroSea report at eurosea.eu, (Pereiro et al., 2023).
Conflict of interest
The authors declare that the research was conducted in the absence of any commercial or financial relationships that could be construed as a potential conflict of interest.
Publisher’s note
All claims expressed in this article are solely those of the authors and do not necessarily represent those of their affiliated organizations, or those of the publisher, the editors and the reviewers. Any product that may be evaluated in this article, or claim that may be made by its manufacturer, is not guaranteed or endorsed by the publisher.
References
Aleynik D., Dale A. C., Porter M., Davidson K. (2016). A high resolution hydrodynamic model system suitable for novel harmful algal bloom modelling in areas of complex coastline and topography. Harmful Algae 53, 102–117. doi: 10.1016/j.hal.2015.11.012
Bedington M., García-García L. M., Sourisseau M., Ruiz-Villarreal M. (2022). Assessing the performance and application of operational lagrangian transport HAB forecasting systems. Front. Mar. Sci. 9. doi: 10.3389/fmars.2022.749071
Bonamano S., Piermattei V., Madonia A., Paladini de Mendoza F., Pierattini A., Martellucci R., et al. (2016). The Civitavecchia Coastal Environment Monitoring System (C-CEMS): a new tool to analyze the conflicts between coastal pressures and sensitivity areas. Ocean Sci. 12 (1), 87–100. doi: 10.5194/os-12-87-2016
Cusack C., Dabrowski T., Lyons K., Berry A., Westbrook G., Salas R., et al. (2016). Harmful algal bloom forecast system for SW Ireland. Part II: Are operational oceanographic models useful in a HAB warning system? Harmful Algae 5, 86–101. doi: 10.1016/j.hal.2015.11.013
Dabrowski T., Lyons K., Berry A., Cusack C., Nolan G. D. (2014). An operational biogeochemical model of the North-East Atlantic: Model description and skill assessment. J. Mar. Syst. 129, 350–367. doi: 10.1016/j.jmarsys.2013.08.001
Dagestad K.-F., Röhrs J., Breivik Ø., Ådlandsvik B. (2018). OpenDrift v1.0: a generic framework for trajectory modelling. Geoscientific Model. Dev. 11, 1405–1420. doi: 10.5194/gmd-11-1405-2018
Dañobeitia J. J., Pouliquen S., Pade N., Arvanitidis C., Sanders R., Stanica A., et al. (2023). The role of the marine research infrastructures in the European marine observation landscape: present and future perspectives. Front. Mar. Sci. 10. doi: 10.3389/fmars.2023.1047251
Fernández-del-Castillo E., Scardaci D., López García Á. (2015). The EGI federated cloud e-infrastructure. Proc. Comput. Sci. 68, 196–205. doi: 10.1016/j.procs.2015.09.235
Goglio A. C., Clementi E., Grandi A., Mariani A., Giurato M., Aydogdu A., et al. (2022). Mediterranean sea production centre MEDSEA_ANALYSISFORECAST_PHY_006_013 (France: Copernicus Marine Service, Mercator Ocean International) 2.4, 1–59. doi: 10.25423/CMCC/MEDSEA_ANALYSISFORECAST_PHY_006_013_EAS8
Good S., Fiedler E., Mao C., Martin M. J., Maycock A., Reid R., et al. (2020). The current configuration of the OSTIA system for operational production of foundation sea surface temperature and ice concentration analyses. Remote Sens. 12, 720. doi: 10.1016/S0360-8352(98)00066-7
Ho S. L., Xie M. (1998). The use of ARIMA models for reliability forecasting and analysis. Comput. Industr. Engin. 35, 213–216. doi: 10.1016/S0360-8352(98)00066-7
Hobday A. J., Alexander L. V., Perkins S. E., Smale D. A., Straub S. C., Oliver E. C.J., et al. (2016). A hierarchical approach to defining marine heatwaves. Prog. Oceanography 141, 227–238. doi: 10.1016/j.pocean.2015.12.014
Intergovernmental Oceanographic Commission of UNESCO (2019). IODE Quality Management Framework for National Oceanographic Data Centres and Associate Data Units (Revised edition) (Paris, France: UNESCO). 34pp. (IOC Manuals and Guides 67, rev. ed.) (IOC/2013/MG/67Rev.). doi: 10.25607/OBP-1740
Islam M. J., Kunzmann A., Bögner M., Meyer A., Thiele R., Slater M. J. (2020). Metabolic and molecular stress responses of European seabass, Dicentrarchus labrax at low and high temperature extremes. Ecol. Indic. 112, 106118. doi: 10.1016/j.ecolind.2020.106118
Islam M. J., Kunzmann A., Slater M. J. (2022). Responses of aquaculture fish to climate change-induced extreme temperatures: A review. J. World Aquaculture Soc. 53, 314–366. doi: 10.1111/jwas.12853
Leadbetter A., Silke J., Cusack C. (2018). Creating a weekly Harmful Algal Bloom bulletin. Version 1 (Galway, Ireland: Marine Institute). p. 59. doi: 10.25607/OBP-13
Majidi Nezhad M., Neshat M., Piras G., Astiaso Garcia D., Sylaios G. (2022). Marine online platforms of services to public end-Users—The innovation of the ODYSSEA project. Remote Sens. 14 (3), 572. doi: 10.3390/rs14030572
Merkel D. (2014). Docker: lightweight linux containers for consistent development and deployment. Linux J. 2014 (239), 2.
Ocean Best Practices System (2023). Best Practices document template: ocean applications. Version 2023-06-26 (Oostende, Belgium: International Oceanographic Data and Information Exchange (IODE) for Ocean Best Practices System). 8pp. doi: 10.25607/OBP-761
Oikonomou C., Denaxa D., Korres G. (2022). Mediterranean production centre MEDSEA_ANALYSISFORECAST_WAV_006_017 (France: Copernicus Marine Service, Mercator Ocean International). doi: 10.25423/cmcc/medsea_analysisforecast_wav_006_017_medwam4
Pearlman J., Bushnell M., Coppola L., Karstensen J., Buttigieg P. L., Pearlman F., et al. (2019). Evolving and sustaining ocean best practices and standards for the next decade. Front. Mar. Sci. 6. doi: 10.3389/fmars.2019.00277
Pereiro D., Belyaev O., Dunbar M. B., Navarro G., Cusack C. (2023). “Best practice on creating “Extreme Marine Events“ Hazard maps & forecasts report,” in EuroSea: Improving and Integrating European Ocean Observaing and Forecasting Systems for Sustainable use of the Oceans. Available at: https://eurosea.eu/.
Pinto L., Mateus M., Silva A. (2016). Modeling the transport pathways of harmful algal blooms in the Iberian coast. Harmful Algae 53, 8–16. doi: 10.1016/j.hal.2015.12.001
Tomlinson M. C., Stumpf R. P., Ransibrahmanakul V., Truby E. W., Kirkpatrick G. J., Pederson B. A., et al. (2004). Evaluation of the use of SeaWiFS imagery for detecting Karenia brevis harmful algal blooms in the eastern Gulf of Mexico. Remote Sens. Environ. 91, 293–303. doi: 10.1016/j.rse.2004.02.014
Tonani M., Bruciaferri D., Pequignet C., King R., Sykes P., McConnell N., et al. (2022). North west european shelf production centre NORTHWESTSHELF_ANALYSIS_FORECAST_PHY_004_013 (France: Copernicus Marine Service, Mercator Ocean International). doi: 10.48670/moi-00054
Wehde H., Schuckmann K. V., Pouliquen S., Grouazel A., Bartolome T., Tintore J., et al. (2021) Quality information document (CMEMS-INS-QUID-013-030-036). Available at: https://catalogue.marine.copernicus.eu/documents/QUID/CMEMS-INS-QUID-013-030-036.pdf (Accessed 17 June 2022).
Wessel P., Smith W. H. F. (1996). A global, self-consistent, hierarchical, high-resolution shoreline database. J. Geophysical Res. 101, 8741–8743. doi: 10.1029/96JB00104
Wolf T., Debut L., Sanh V., Chaumond J., Delangue C., Moi A., et al. (2020). Transformers: state-of-the-art natural language processing. Proceedings of the 2020 Conference on Empirical Methods in Natural Language Processing: System Demonstrations (317 Sidney Baker Street S., Suite 400-134, Kerrville, TX 78028, USA: Association for Computational Linguistics). doi: 10.18653/v1/2020.emnlp-demos.6
Yu Y., Si X., Hu C., Zhang J. (2019). A review of recurrent neural networks: LSTM cells and network architectures. Neural Comput. 31, 1235–1270. doi: 10.1162/neco_a_01199
Keywords: marine observatory, aquaculture, extreme marine events, marine heatwaves, best practices
Citation: Pereiro D, Belyaev O, Dunbar MB, Conway A, Dabrowski T, Graves I, Navarro G, Nolan G, Pearlman J, Simpson P and Cusack C (2024) An observational and warning system for the aquaculture sector. Front. Mar. Sci. 10:1288610. doi: 10.3389/fmars.2023.1288610
Received: 04 September 2023; Accepted: 26 December 2023;
Published: 16 January 2024.
Edited by:
Morten Omholt Alver, Norwegian University of Science and Technology, NorwayReviewed by:
Marco Marcelli, University of Tuscia, ItalyAndrew M. Fischer, University of Tasmania, Australia
Copyright © 2024 Pereiro, Belyaev, Dunbar, Conway, Dabrowski, Graves, Navarro, Nolan, Pearlman, Simpson and Cusack. This is an open-access article distributed under the terms of the Creative Commons Attribution License (CC BY). The use, distribution or reproduction in other forums is permitted, provided the original author(s) and the copyright owner(s) are credited and that the original publication in this journal is cited, in accordance with accepted academic practice. No use, distribution or reproduction is permitted which does not comply with these terms.
*Correspondence: Diego Pereiro, ZGllZ28ucGVyZWlyb0BtYXJpbmUuaWU=