- 1Department of Civil and Disaster Prevention Engineering, National United University, Miaoli, Taiwan
- 2Department of Civil and Environmental Engineering, University of Wisconsin-Madison, Madison, WI, United States
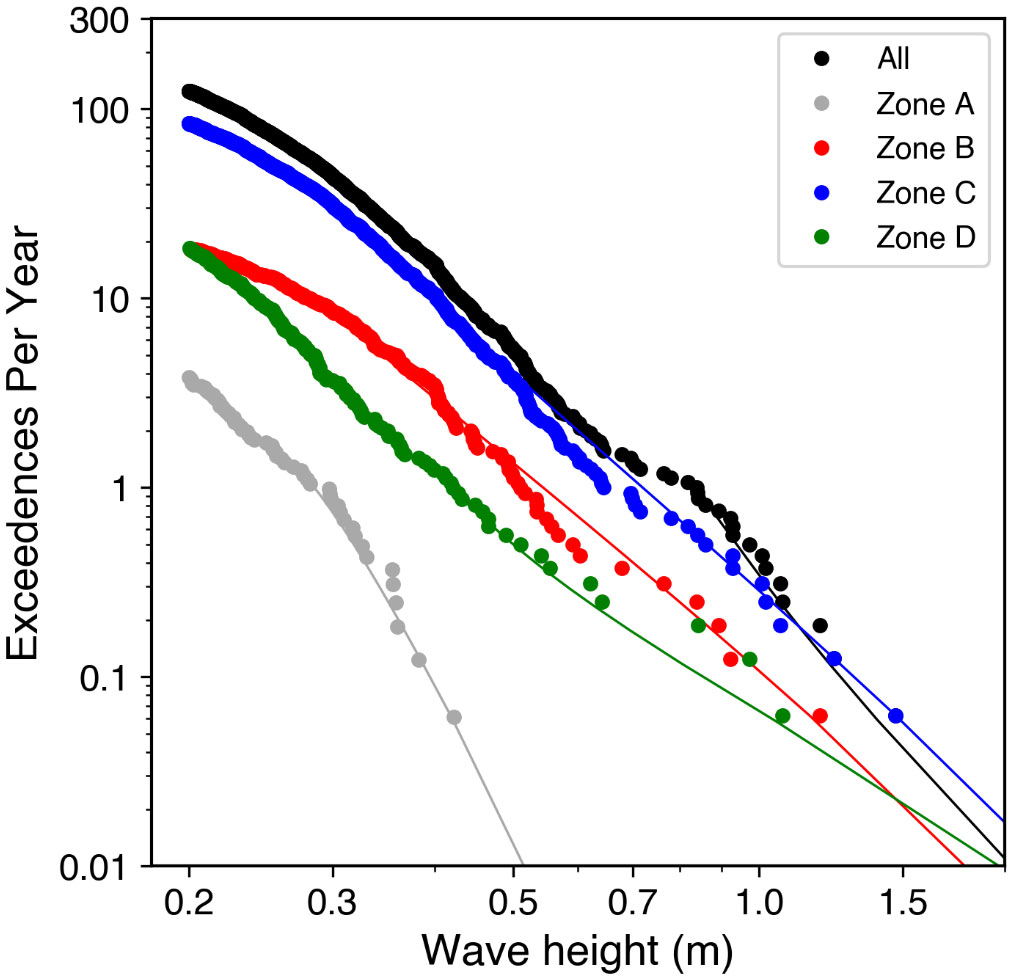
This study presents the meteotsunami behavior in response to different storm types in the coasts of southern Asia-Pacific Ocean from 16 years water level records. Through the size- frequency analysis, the dangerous meteotsunami, wave height exceeding 0.3 m, can occur up to 44 events per year. Notably, during the extreme waves of the 2007 event, wave heights reached approximately 0.9-1.5 m in the Taiwan Strait and the western coastal areas of Taiwan. We have classified storms into six types by radar reflectivity images and satellite-derived precipitation. Findings indicate that predicted wave heights caused by bows and typhoons could reach hazardous magnitude of exceeding 2 m in a 100-yr interval. Spatial and temporal analysis reveals that meteotsunami occurrences are most frequent in the western regions during the winter to early spring months (December to April). Of all meteotsunami occurrences, cluster storms are identified as the most prevalent atmospheric forcing, accounting for 60% of meteostunamis. Typhoons have a 20% association with meteotsunamis along the east coasts of Taiwan during late summer to autumn. On the east coasts, typhoon type-induced events may be attributed to the combination effect of meteotsunamis and infra-gravity waves. Overall, this study provides the first comprehensive examination of meteotsunami-storm characteristics and their associated hazard risks in the coastal areas of the southern Asia-Pacific Ocean.
1 Introduction
Meteotsunamis, which originate from a rapid movement of atmospheric disturbances, are long waves propagating with periods between 2 min to 2 h (Monserrat et al., 2006). The atmospheric pressure and wind disturbances, as observed through meteorological bad-weathers (e.g., derechos, frontal passages, and cyclones) or good-weathers (e.g., high altitude atmospheric gravity waves, pressure jumps, etc.) associated with meteotsunami occurrences, can extend over vast areas, spanning hundreds to even thousands of kilometers (Šepić et al., 2015c). The interaction between the fast moving of atmospheric forcings and sea surface is the primary mechanism that has the potential to amplify meteotsunamis, through a phenomenon known as Proudman resonance (Proudman, 1929). This resonance occurs when the atmospheric forcings travel closely with the speed of free oceanic waves. In the shallow waters, the combined resonant effects involved in meteotsunami generation can lead to devastating impacts in the coastal area (Monserrat et al., 2006; Rabinovich, 2009). For example, a historical highest 6 m meteotsunami on 21 June 1978 in the Vela Luka Bay of Croatia caused catastrophic damage and coastal flooding (Orlić, 1980; Orlić et al., 2010). A maximum wave height about 5 m meteotsunami wave on March 31, 1979 in Nagasaki Bay, Japan killed three people (Hibiya and Kajiura, 1982). A reported 3m meteotsunami wave that hit the US Chicago waterfront in 1954 swept people off piers, drowning seven (Ewing et al., 1954; Platzman, 1958). Extensive literature review for worldwide meteotsunami events and their associated damage have been summarized in Rabinovich (2020) and Gusiakov (2021). Nevertheless, a comprehensive characterization and reporting of the meteotsunami climatology and the association with atmospheric disturbances due to various weather systems remains relatively scarce.
Therefore, the weather system is the primary factor to correlate with meteotsunami events. It’s noted that weather system-induced meteotsunamis can be classified by two different approaches. First, meteotsunamis can be classified into good and bad weather events based on meteorological observations (Rabinovich, 2020). Findings showed that approximately 69% derived from the events documented by Rabinovich (2020) have associated with bad weather conditions, including frontal passages, cyclones, and convective systems (e.g., Monserrat et al., 2006; Wertman et al., 2014; Bechle et al., 2015; Pattiaratchi and Wijeratne, 2015; Bechle et al., 2016). Surprisingly, 25% of events was connected to good weather conditions, such as atmospheric gravity waves at high altitudes (e.g., Šepić et al., 2015c). However, it’s important to note that atmospheric gravity waves are often coincide with convective systems (Belušić et al., 2007; Šepić et al., 2009; Vilibić et al., 2014). Although the good-bad weather classification is based on subjective principles (Rabinovich, 2020), these principles are potentially used to forecast hazardous events in Croatia, Spain, and several other countries (cf. Vilibić et al., 2016). The first approach thus serves as a basic framework for understanding the relationship between weather systems and meteotsunami events.
The second approach links meteotsunamis to storm systems triggered by atmospheric convection. This approach classifies meteotsunamis based on storm structure (Bechle et al., 2015) and radar morphology (Williams et al., 2021), revealing similarities in storm patterns. For example, the linear, bow and frontal storm structures can be observed as the quasi-linear type on radar morphology. In addition, meteotsunamis can be associated with tropical cyclones (Heidarzadeh and Rabinovich, 2021; Medvedev et al., 2022; Smirnova and Medvedev, 2023) and their rainbands (Anarde et al., 2021; Shi et al., 2020; Lin and Wu, 2021). To date, characteristics and long-term statistics between meteotsunamis and tropical cyclones have not been conducted. In short, the second approach is valuable for establishing correlations between causative storm systems and meteotsunami events.
Across various regions of the World Ocean, the climatology of meteotsunamis, or long-term statistics of meteotsunami occurrences, have been conducted. Based on the findings of these extensive investigations, the primary focus is on the prevailing atmospheric forcings that contribute to meteotsunami generation during different seasons. For example, a global-scale investigation has revealed a strong association between seasonal variations of small nonseismic sea level oscillations with tsunami time scales (NSLOTTs) and mid-tropospheric jet streams (Vilibić and Šepić, 2017; Zemunik et al., 2022). In the Mediterranean, including the Adriatic Sea and the Balearic Islands, atmospheric gravity waves (Belušić et al., 2007; Šepić et al., 2012) and atmospheric disturbances associated with certain atmospheric systems (Šepić et al., 2015b) were found to contribute significantly during summertime. North Europe revealed a distinct pattern, where meteotsunamis were predominantly caused by intense winter cyclones (e.g., de Jong and Battjes, 2004; Pellikka et al., 2020; Williams et al., 2021; Pellikka et al., 2022). In the Gulf of Mexico region, significant meteotsunamis were caused by summer tropical cyclones (Dusek et al., 2019) and winter extra-tropical cyclones (Olabarrieta et al., 2017). Along the northeast U.S, strong atmospheric pressure disturbances, including squall lines and derechos, were the main forcings to generate high meteotsunami waves in the summer months (Geist et al., 2014).
In the northern Asia-Pacific Ocean, meteotsunmais predominantly occurred during the summer months of June to August in Longkou Harbor, East China Sea over a 23-year period (Wang et al., 1987). In the south region of Kyushu, Japan, meteotsunami occurrences were observed primarily from January to April, with the largest peak in March, accounting for approximately 50% of the total occurrences from 1961 to 2005. Statistical analyses were conducted using atmospheric data, including pressure patterns and weather fronts extracted from weather charts. Extreme wave heights exceeding 1 m were most prevalent during the passage of low-pressure systems moving from the East China Sea to the Pacific Ocean (Akamatsu, 1982; Shiga et al., 2007). In the eastern Yellow Sea, air pressure variations induced meteotsunami occurrences indicated the frequent peaks between March and June, accounting for 71% of total occurrences, from 2010 to 2019 (Kim et al., 2021a). Among these occurrences, air pressure fluctuations were attributed to three synoptic-scale systems. In the southern Asia-Pacific Ocean, Lin and Liang (2017) identified that 80% of meteotsunami occurrences along the northwest coasts of Taiwan associated with air pressure disturbances, particularly air pressure oscillations with periods ranging from 5 to 100 min. Overall, it was the evident that meteotsunamis and their extreme events were significantly affected by atmospheric disturbances during specific seasons. While the causality between storm systems and meteotsunamis has been well-established in the Great Lakes (Bechle et al., 2015) and Northwest Europe (Williams et al., 2021), the link in the Asia-Pacific Ocean remains unreported.
The aim of this study is to investigate the climatology of meteotsunamis, focusing on their spatial and temporal distribution in coastal regions of the southern Asia-Pacific Ocean. To achieve this, we analyze a 16-year dataset of water level records to assess meteotsunami statistics and their correlation with different storm systems. Detailed information regarding the study area, observation data, and analytical methods is provided in Section 2. Section 3 presents the outcomes of our analysis, while Section 4 is to discuss occurrences in the Asia-Pacific Ocean and their associated hazard risks. In Section 5, we offer a summary of the conclusions drawn from our findings.
2 Materials and methods
2.1 Study area
The study area encompasses the coastal regions of the southern Asia-Pacific Ocean, including the South China Sea, Taiwan Strait, and Taiwan. Figure 1 illustrates two distinct seafloor terrains in the region. The eastern coast of Taiwan features steep terrain with water depths reaching 1000 m within 10 km of the shoreline, while the Taiwan Strait has a wide continental shelf with an average width of 180 km and length of 350 km, where water depths are generally less than 100 m. The water depth along the coast of South China is relatively shallow, at approximately 10-20 m. In the middle of the Taiwan Strait, water depths range from 40 to 70 m, with Proudman resonant long wave speeds estimated to be between 20 and 26 m/s.
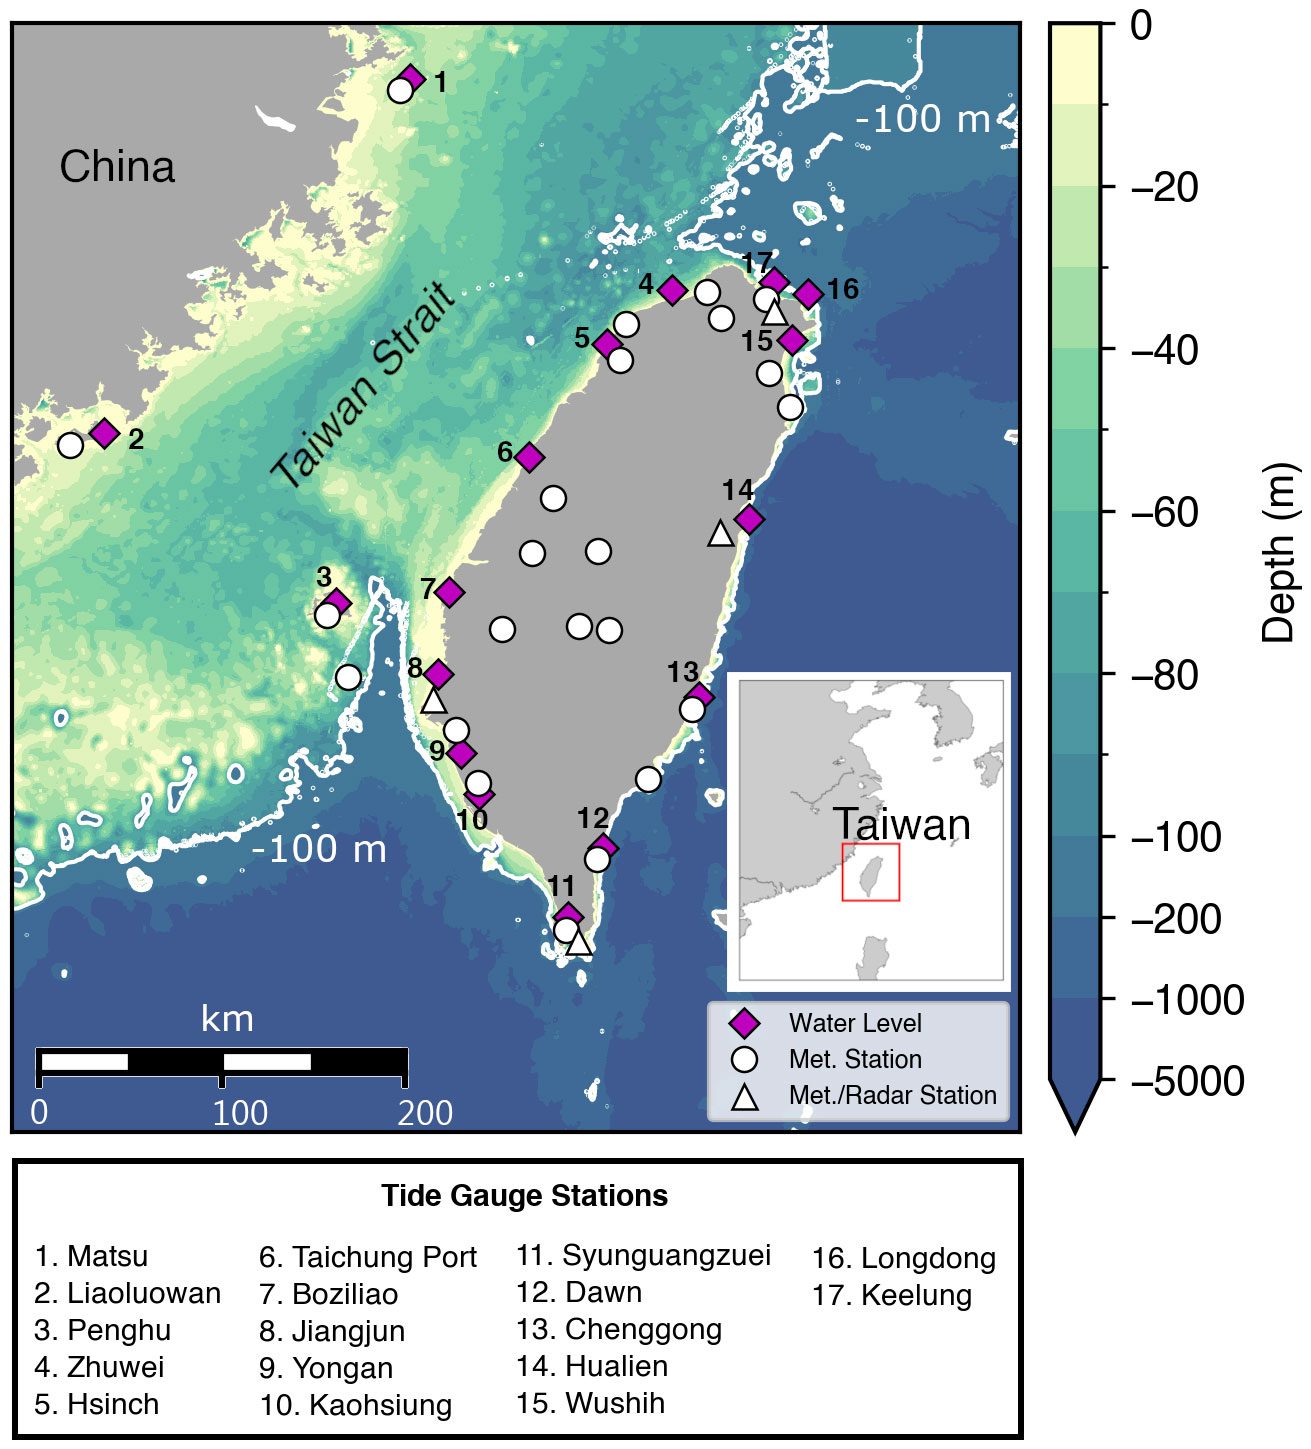
Figure 1 The study site is located at the southern Asia-Pacific region. A colormap depicts the water depth. Names of 17 tidal gauge stations are listed with locations shown in diamond symbols. There are 23 CWB weather stations (circles) with four co-located weather radar stations (triangles) for measuring radar reflectivity images. The contour of -100 m illustrates as a thick line.
2.2 Data sources
Four types of dataset in the southern Asia-Pacific Ocean were used during 16 years (2005-2020). First, 6-min water level data were from the Central Weather Administration (CWA), Taiwan (https://ocean.cwa.gov.tw/V2/data_interface/datasets) and the Water Resources Agency (WRA), Taiwan (https://www.wra.gov.tw). Water level was measured by pressure and acoustic sensors in the harbors. Second, 1-min atmospheric pressure, wind speed, and wind direction from 23 weather stations (circles in Figure 1) were obtained from the CWA. Third, 30-min composite radar reflectivity images were from four weather stations (triangles in Figure 1), provided by the Data Bank for Atmospheric Research and Hydrologic Research, Taiwan (https://dbar.pccu.edu.tw/). Lastly, Hourly precipitation intensity data with 0.1 x 0.1 degree resolution were retrieved from the Global Satellite Mapping of Precipitation (GSMaP), provided by the Japan Aerospace Exploration Agency (JAXA) (https://sharaku.eorc.jaxa.jp/GSMaP, Kubota et al., 2007). The precipitation was estimated from passive microwave and infrared data (Ushio et al., 2009).
In the northern Asia-Pacific Ocean, meteotsunami occurrences were collected from South Korea and Japan. Wave heights of meteotsunamis were from the west coasts of South Korea during 2010-2019, as reported in Kim et al. (2021a). Wave heights obtained from 70 stations around the coast of Japan during 2009-2020 have been processed by the Japan Meteorological Agency (JMA) (https://www.data.jma.go.jp/gmd/kaiyou/db/tide/gaikyo/index.php). The Japan dataset with a 1-min interval, locally called secondary undulations (Kowalik and Murty, 1993; Rabinovich, 2009; Heidarzadeh and Rabinovich, 2021), has similar features to NSLOTTs. Pressure disturbances associated with the South Korea meteotsunami events were recorded by Kim et al. (2021). 10-min meteorological data around Japan were available from JMA (https://www.data.jma.go.jp/stats/etrn/index.php) since 2009. Radar reflectivity images from South Korea and Japan during the time span of maximum events were obtained from four articles (Kim et al., 2019; Kim et al., 2021a; Kim et al., 2021b; Kim et al., 2022) and the Research Institute for Sustainable Humanosphere of Kyoto University (https://database.rish.kyoto-u.ac.jp/arch/jmadata/synthetic-original.html), respectively.
2.3 Storm systems classification
Radar reflectivity imagery and satellite-derived precipitation data were used to classify weather storm systems into six categories: cluster, complex, bow, linear, frontal, and typhoon (Figure 2). The first four storm structures followed the definition by of Workoff et al. (2012) and Bechle et al. (2015). Main features of frontal and typhoon structures were summarized from our literature review. All storm structures are described as follows.

Figure 2 Schematics of storm types associated with meteotsunamis: (A) cluster, (B) complex, (C) linear, (B) bow, (E) frontal, and (F) typhoon. Former four types use the upper scale of colorbar for radar reflectivity and the latter two use the bottom scale of colorbar for rainfall intensity. Scale of rainfall intensity between dBZ and mm/hr is referred to Stull (2000).
Cluster: Unorganized convection with isolated peaks of >40-45 dBZ reflectivity in small areas (<40 km2) surrounded by larger areas of<35 dBZ reflectivity.
Complex: Organized convection and nonlinear structures with reflectivity of >45 dBZ in an area of larger than 500 km2.
Linear: Organized linear-shaped convection with a line width less than 50 km and a length-width ratio of at least 3:1 (Fowle and Roebber, 2003). The line area has the reflectivity of >45 dBZ.
Bow: Organized convective bow-shaped line with a separated length of less than 100 km. The leading edge of bow has the reflectivity of >45 dBZ.
Frontal: Cold and Mei-Yu fronts with extensive rain belts and heavy rainfalls (Chien and Kuo, 2006). Rainband areas, with the horizontal scale greater than 100 km, have orientated convective lines for the reflectivity of >35 dBZ or the precipitation rate of >6 mm/hr (Meng et al., 2019).
Typhoon: A structure consisting of a primary eyewall and spiral-shaped rainbands in the inner and outer regions (Hence and Houze, 2012; Xiao et al., 2019). In the outer region, the rainband complex has a broken line of convective cells spiraling around the cyclone (Houze, 2010). Areas of convective cells range from 35 to 45 dBZ reflectivity or from 6 to 24 mm/hr covering a horizontal scale of hundreds of kilometers.
2.4 Identification of meteotsunamis
Meteotsunamis were identified using the following steps described in Bechle et al. (2015). First, a high-pass Butterworth filter (Williams et al., 2021) with a cut-off of 6 h was applied to remove tides. In the case of storm surges, we applied a 2 h high-passed filter to retain the desired signals. Second, the zero-crossing method was used to calculate maximum and mean heights and mean periods of waves. Third, georeferenced radar reflectivity imagery and satellite derived precipitation product were used to detect storm systems, as described in the previous section. At last, a meteotsunami event was identified if it met the following three criteria: (i) mean wave periods less than to 2 h (Monserrat et al., 2006), (ii) maximum wave heights exceeding 0.2 m, a site-specific threshold in this study, and (iii) associated with a detected storm structure within 3 h (Bechle et al., 2015). A wave height 0.2 m is among the thresholds used in other studies: 0.1 m in the Laurentian Great Lakes (Bechle et al., 2016), 0.2 m along the U.S. East Coast (Dusek et al., 2019), and 0.25 m across Northwest Europe (Williams et al., 2021).
2.5 Cumulative frequency analysis
To assess annual meteotsunami exceedance, we used cumulative frequency analysis with the Peaks-Over-Threshold method (Bechle et al., 2015) and then we fit the identified meteotsunami occurrences to two distributions. First, the Pareto Type I distribution is used in the Laurentian Great Lakes (Bechle et al., 2016) and the survival function is given by:
where x is a meteotsunami wave height, xm is the threshold parameter, and β is the shape parameter. Second, the survivor function for the Generalized Pareto Distribution (GPD), successfully characterizing extreme significant wind wave height statistics (Anderson et al., 2015), and extreme meteotsunamis in Lake Michigan (Bechle et al., 2015) and U.S. Northeast Coast (Geist et al., 2014), is expressed as
where xm is the threshold parameter, σ is the scale parameter, and ξ is the shape parameter. To establish xm, a failure-to-reject method was employed by sorting the wave heights and deleting the lowest values until the distribution is no longer rejected by the one-sided Anderson-Darling goodness of fit test (Choulakian and Stephens, 2001; Bechle et al., 2015). To assess the fitness of the distributions, we used root-mean-square error (RMSE) and the probability plot correlation coefficient (PPCC) value calculated as the Pearson correlation coefficient of the quantile-quantile plots (Filliben, 1975). Given a specified wave height, x, the annual meteotsunami exceedance (AME) (Equation 3) is expressed as
where Φ(x) is the survival function which can be obtained from the cumulative distribution function, i.e., Equations 1, 2, and Nevent and Nyear are the number of identified events and years of the whole data, respectively.
2.6 Co-occurrence analysis
Co-occurrence analysis is used to assess the spatial scale of meteotsunamis by estimating the number of storm-induced meteotsunami events that occur at affected stations within a 12-h time span (Bechle et al., 2015). For example, one co-occurrence indicates that a meteotsunami occurs at a single station, while co-occurrences greater than 2 indicates that multiple stations, at least two, are caused by the same storm-induced meteotsunami event. Previous studies of storm-induced meteotsunamis have found that the spatial scale of storm systems can reach hundreds of kilometers, allowing a single storm to generate meteotsunami waves that propagate to multiple stations (Šepić et al., 2009; Bechle et al., 2015; Bechle et al., 2016).
3 Results
3.1 An extreme meteotsunami event
Figure 3 illustrates an extreme meteotsunami event on 2 April 2007. Filtered water level oscillations (Figure 3A), and nearby air pressure (Figure 3B) and wind speed observations (Figure 3C) were observed from four stations. The results show that water level oscillations closely follow air pressure and wind disturbances, consistent with the traveling bow storm. The bow storm originated off the coast of South China and rapidly propagated toward the west coast of Taiwan. The corresponding radar reflectivity imagery can be found in Wang et al. (2022), and is omitted here for brevity. During the storm, a 6 hPa air pressure drop was first observed at St. 2, followed by a pressure spike that occurred at St. 3 to St. 8 and 9 within 3 h. High winds also occurred in the time span of 18:00-21:00. At the Jiangjun Harbor (St. 8), the onset of meteotsunamis was at 18:06 and lasted for 1.5 h, with a maximum wave height of approximately 1.5 m. A sudden increase in air pressure of 3.2 hPa occurred between 19:00 and 19:28, accompanied by an average wind speed of 8.0 m/s at 19:25. Additionally, a gust of 20.3 m/s was observed at St. 10 as reported by Wang et al. (2022). These air pressure and wind disturbances suggest that they are likely a potential forcing for generating meteotsunamis. Therefore, such water level oscillations at four stations meet the identification criteria and are identified as a meteotsunami. This demonstration primarily describes the approach to meteotsunami identification and establishes the relationship between the identified storm and meteotsunmai event.
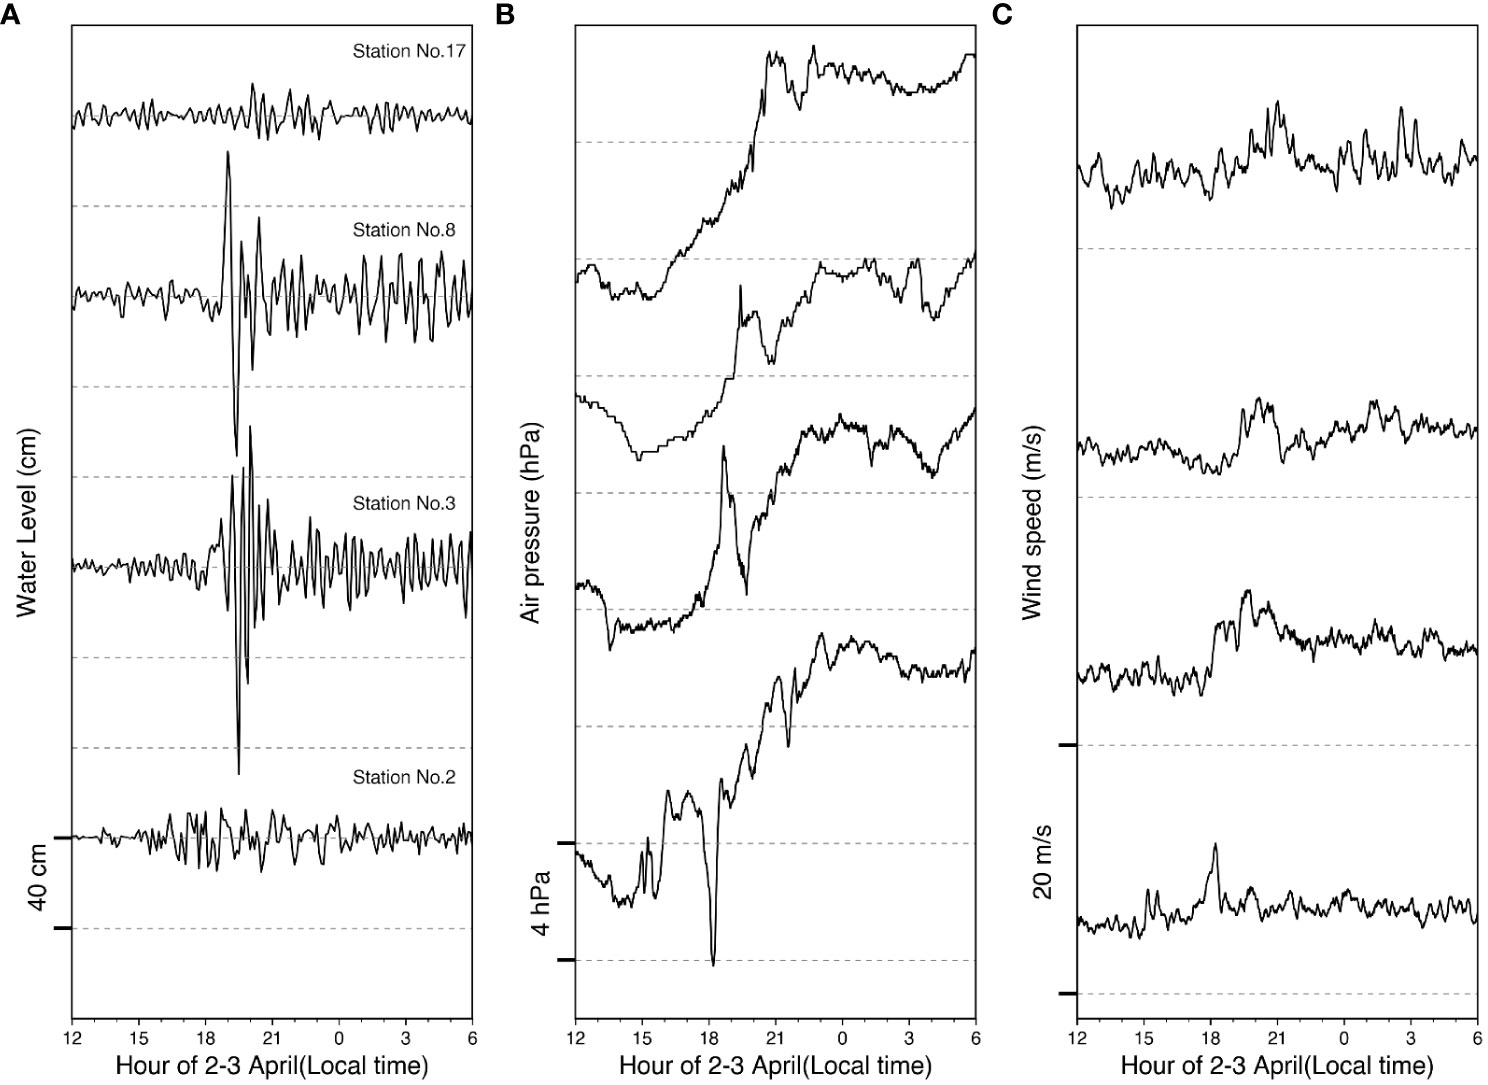
Figure 3 Observations of a meteotsunami event at the Jiangjun Harbor on 2 April 2007 with water level (A), air pressure (B) and average winds (C). Pressure and winds are arranged by the same station order of (A). Dashed lines at (C) present the zero winds.
3.2 Statistics of meteotsunami occurrences
Meteotsunami events are identified at 17 tidal stations in the coastal areas of Southern Asia-Pacific Ocean over a 16-year period, with a total of 1994 occurrences. For this study, we divide the study area into four zones: Zone A (coast of South China, St. 1-2), Zone B (Taiwan Strait, St. 3), Zone C (western coast of Taiwan, St.4-11), and Zone D (eastern coast of Taiwan, St. 12-17), as shown in Figure 4A. In Figure 4A, the spatial distribution shows that three stations, St. 3, 4, and 8, account for approximately half of all meteotsunami occurrences. Zone A, along the coast of South China, has only 62 meteotsunami events, while St. 10 and 11 in Zone C, and St. 13, 14, and 16 in Zone D, have less than 70 events each. In Zone B and C, it is observed that meteotsunami occurrences may be rare, yet the impact can be catastrophic. Specifically, meteotsunamis with a maximum wave height exceeding 1.0 m are documented at St.7, 9, and 16. Figure 4B shows the 872 co-occurrences of meteotsunamis. Nearly 50% meteotsunami events occur at a single station, and the other half occur at 2 to 7 co-occurring stations. In addition, four events are associated with 10 and 11 co-occurring stations. The spatial distribution of co-occurring events at each station is shown in Figure 4C. Co-occurring stations are grouped into two regions: Zone B-C and Zone D (northeast coast of Taiwan). The first region has frequent events across 2 to 7 co-occurring stations, especially between St. 3 and St. 8. The second region, between St. 15 and 17, has fewer events. Six stations, St. 1, 2, 10, 11, 13, and 14, in Zones A, C, and D have the lowest meteotsunami co-occurrences. Over 50 single-station events are found at St. 3, 4, and 12 each. In other words, stations in the Taiwan Strait and on the west coast of Taiwan are frequently affected by meteotsunami co-occurrences than those on the east coast of Taiwan, while events in the South China area are weakly correlated. Findings reveal that the spatial scale of meteotsunamis can reach tens to hundreds of kilometers, along the west coast to the northeast coast of Taiwan.
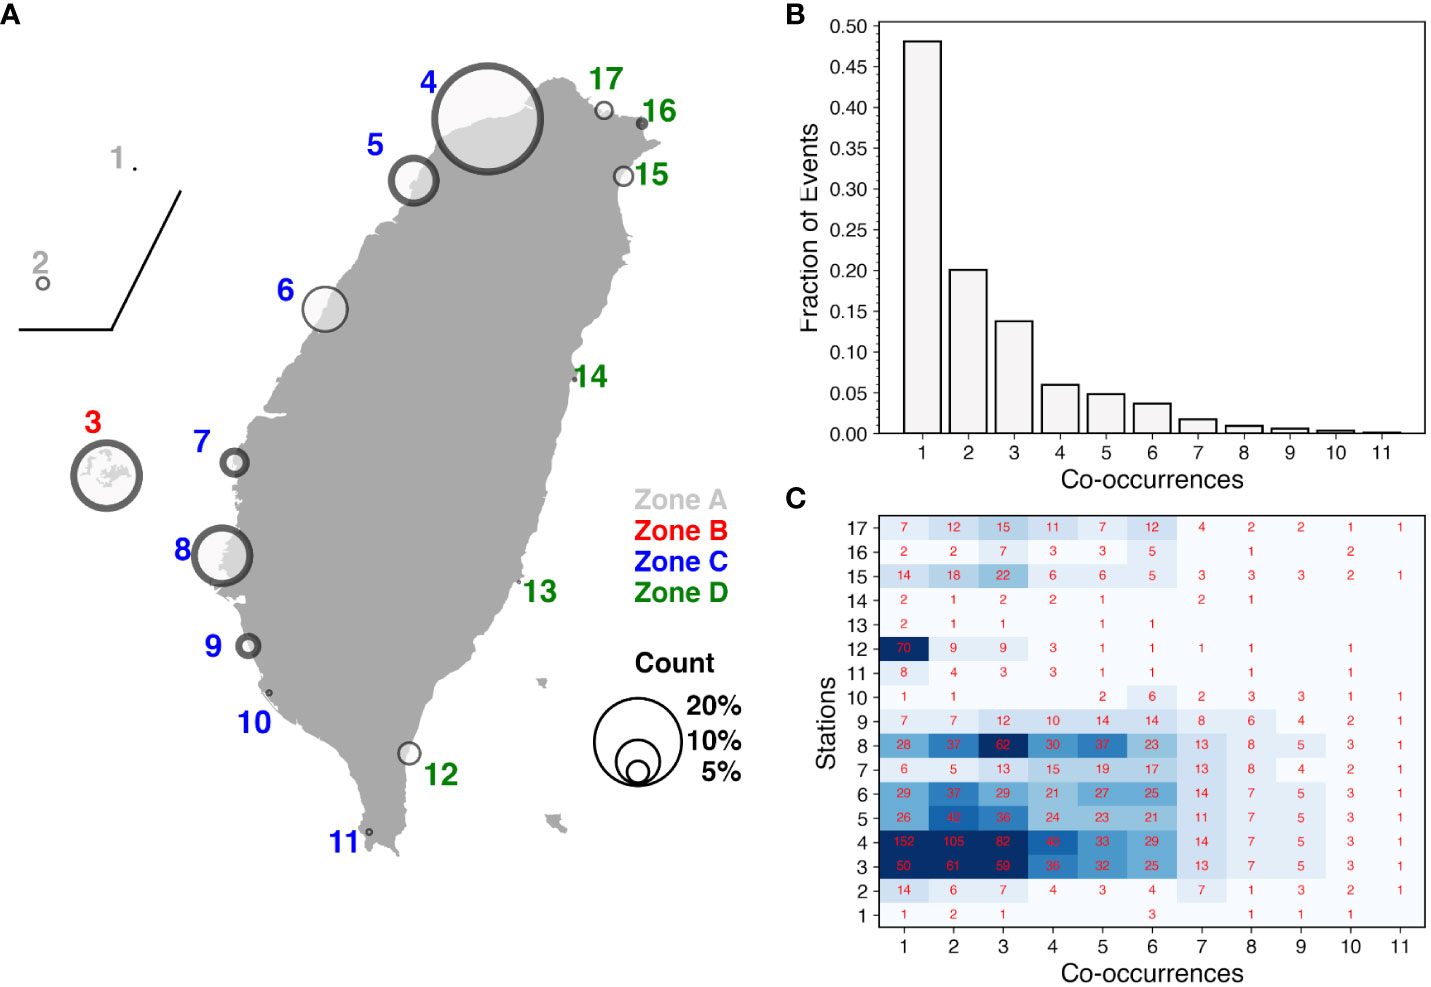
Figure 4 Meteotsunami statistics. (A) The frequency of events is indicated by open circles and stations are color-coded according to the four zones: A-grey, B-red, C-blue, and D-green. Wave height of maximum meteotsunamis exceeding 1.0 m illustrates as thick circles. (B) Co-occurrences of meteotsunamis. (C) Spatial distribution of co-occurring events, with darker blue shades representing higher values of co-occurrences. The numbers of co-occurring events at each station are highlighted.
3.3 Statistics of storm-induced meteotsunamis
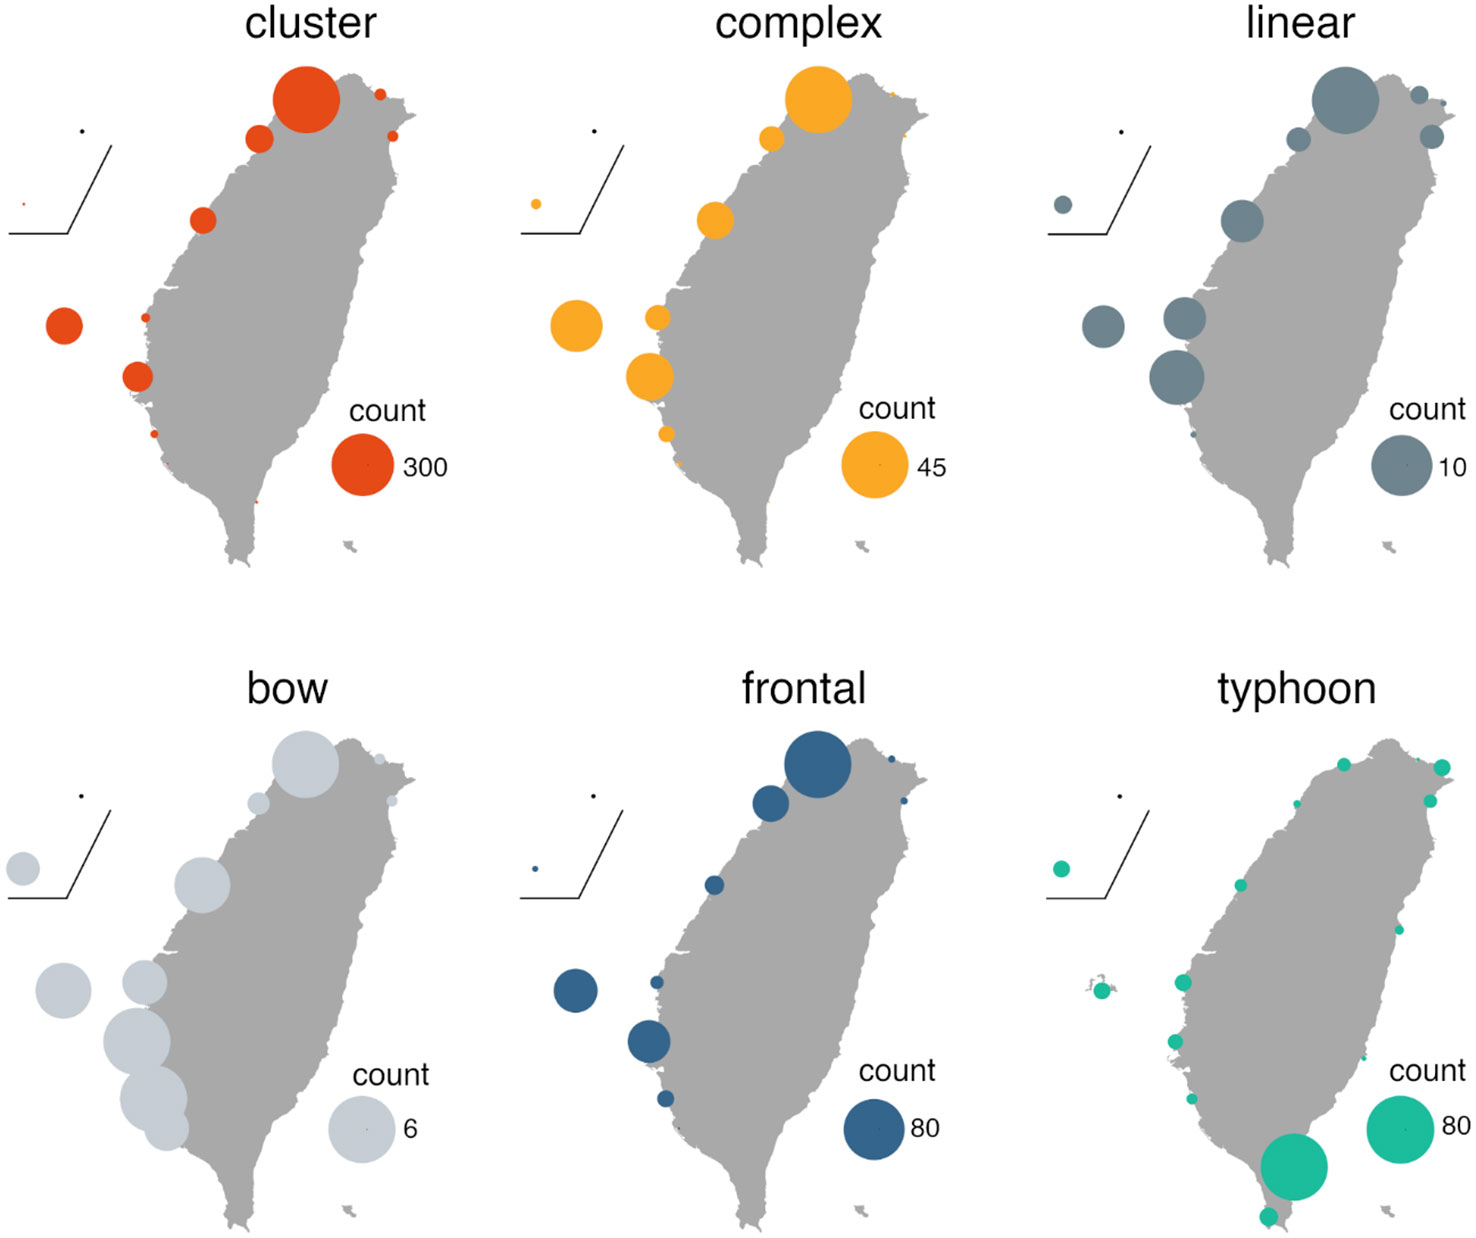
Figure 5 shows the map of six storm types associated with meteotsunami occurrences. Three major findings are drawn upon here. First, meteotsunami occurrences are more frequent on the west coast than the east coast, with a ratio as high as 5.5. Cluster storms primarily dominate the generation of meteotsunamis on the west coast, specifically at St. 3 in Zone B and St.4, 5, 6 and 8 in Zone C. While complex, linear, bow, and frontal storms exhibit similar spatial distributions, their combined occurrences account for less than 50% of those induced by cluster storms. Second, frontal and complex storm-induced meteotsunamis are about four times more common than those caused by linear and bow storms. Third, typhoons can generate meteotsunamis in all four zones. Of notice is that St. 12 on the southeast coast has close to 80 meteotsunami occurrences, equivalent to an average of 5 events per year. Figure 6 displays the distribution of storm-induced meteotsunami events aggregated in the four zones. In Zones B and C, over 60% of meteostunamis are generated by cluster storms, with an additional 20% being induced by complex and frontal storms. In addition, approximately 50% of meteotsunamis are caused by typhoons in Zones A and D. Overall, cluster, typhoons, complex, and frontal storms account for 57.2%, 18.1%, 9.8%, and 10.2% of meteotsunami occurrences, respectively. Linear and bow storms are responsible for less than 5% of meteotsunamis.
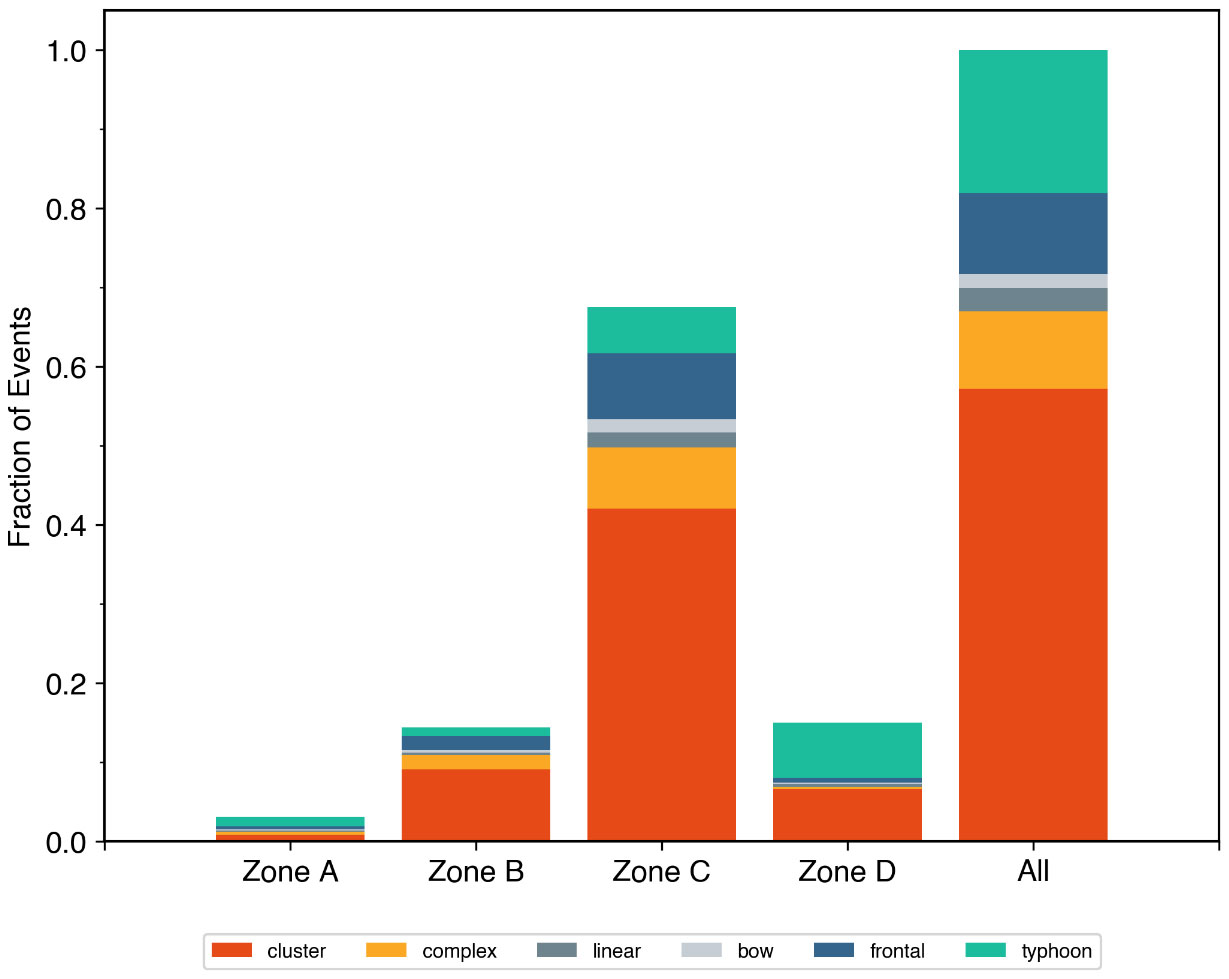
Figure 6 Fractions of meteotsunami events caused by the six storm types in the four zones and overall.
3.4 Diurnal, monthly, and annual distributions of meteotsunami occurrences
Figure 7 illustrates three temporal distributions of meteotsunami occurrences varied with six storm types in the four zones. In Figure 7A, the diurnal distributions of meteotsunamis in Zones A, B, and D are varied randomly. Interestingly, Zone C shows a diurnal pattern with a peak at midnight (00:00) and a drop in the afternoon (16:00) by a factor of three. It may be likely linked to the diurnal conditions that give rise to weather storms, e.g., the local land–sea breeze and the large-scale diurnal circulation changes (Kerns et al., 2010; Huang and Chang, 2018). Figure 7B depicts the monthly distribution results. Across all four zones, the highest fractions of meteotsunamis occur from winter to early spring (December to April). Cluster storms account for more than 60% of identified meteotsunami occurrences during these months. In Zone D, the fraction of cluster storm-induced meteotsunamis reaches up to 50%. During late summer to autumn (July to October), the fractions are relatively low and typhoon-induced meteotsunamis are more prevalent in Zones A and D. Figure 7C shows that the annual meteotsunami occurrences display a slight declining trend from 2005 to 2011 in all four zones. In Zones A and C, there is an increasing trend from 2011 to 2019. Before 2011, meteotsunami occurrences are mainly associated with typhoon impacts in Zone A. In Zone B, there is a declining trend for cluster storm-induced meteostuanmis from 2016 to 2020. In Zone D, annual meteotsunami occurrences are strongly correlated with typhoon events throughout the study period, except for the year 2020. Notably, during 2020-2022, Taiwan has experienced a 56-year period without any typhoon making landfall for the first time (Narvaez et al., 2022).
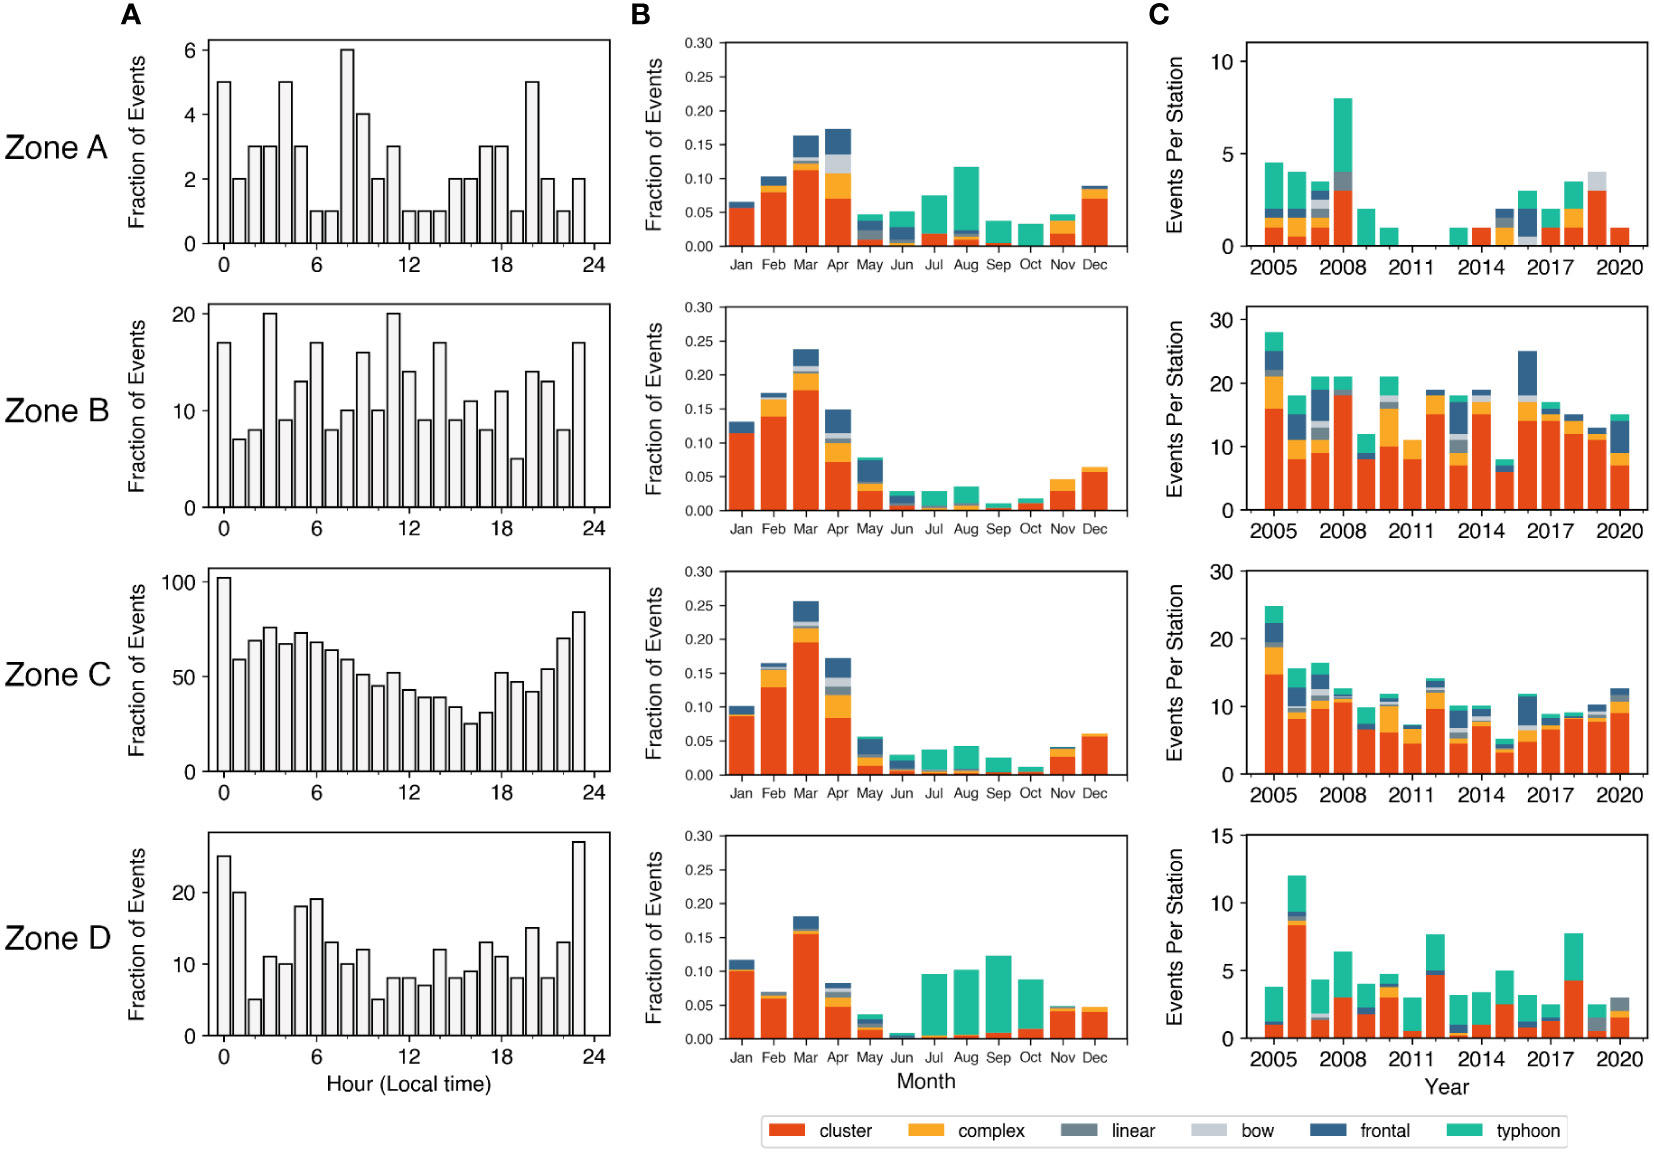
Figure 7 The (A) diurnal, (B) monthly, (C) annual distributions of storm-induced meteotsunamis in the four zones.
3.5 Annual meteotsunami exceedances
Wave heights corresponding to annual meteotsunami exceedances in the four zones are examined here. Table 1 lists the fitted parameters with RMSE and PPCC for the Pareto Type I distribution and GPD. All PPCC values are close to 1, indicating good linear relationships between observations and two distributions. Based upon the smallest RMSE, we select the Pareto Type I distribution to fit meteotsunami wave heights at the study site. In comparison, the Pareto Type I distribution has been successfully applied in the Laurentian Great Lakes (Bechle et al., 2016), while the GPD has effectively represented meteotsunamis in the US East Coast (Dusek et al., 2019) and the eastern coast of Japan (Lin and Wu, 2021). Figure 8 shows the annual exceedances of meteotsunami wave heights in the four zones, each fitted with the Pareto Type I distribution (color lines). Three key points are highlighted here. First, in Zone A, the meteotsunami occurrences are not significant, as the 1-yr predicted wave height, equivalent to one event per year, is less than 0.3 m. Second, in the Zone B, C and D, 1-yr predicted wave height ranges from 0.44 to 0.72 m, approximately 1.5-2.6 times that in Zone A. Third, in the same three zones, the predicted wave height of > 1.0 m may be expected to occur more than once in a 3-yr interval. In summary, our findings indicate that the dangerous meteotsunami, wave height exceeding 0.3 m (Bechle et al., 2016), can occur up to 44 events per year. This highlights a potential risk in the Taiwan Strait and along the coasts of Taiwan. Therefore, heightened attention to meteotsunami risk in the coasts of southern Asia-Pacific Ocean is essential.
3.6 Annual exceedances of storm type-induced meteotsunamis
Figure 9 presents identical findings to those shown in Figure 8, but with a focus on storm-induced occurrences. In all storm types, the maximum wave heights exceed 0.5 m and reach the dangerous magnitude. For cluster, complex, linear and frontal storm types, the predicted wave heights in a 100-yr interval remain below 1.2 m. However, for bows and typhoons, the wave heights could exceed 2.0 m. Based on these results, it’s expected that typhoons have the potential to trigger meteotsunami waves to the greatest extent, especially along the east coast of Taiwan, owing to their high intensity in terms of pressure and wind disturbances. Studies conducted by Lin and Wu (2021) and Shi et al. (2020) suggest that triggered meteotsunamis are primarily affected by the outer and inner spiral rainbands of cyclones. As reported by Houze (2004), the vertical structure of convective and stratiform features (Marks, 1985; Marks and Houze, 1987) within the rainbands plays a crucial role in the evolution of cyclone systems, indicating their potential to disturb the sea surface. Furthermore, typhoon-induced infra-gravity waves typically exhibit periods less than 300 s (e.g., Herbers et al., 1994; Herbers et al., 1995), which partly overlap with the oscillation periods of meteotsunamis. However, the meteotsunamis identified in this study may face limitations in separating two components due to aliasing effects caused by a 6-min sampling rate in water level. As a result, typhoon-induced sea level oscillations may arise from the combined effect of infra-gravity waves and meteotsunamis (Medvedev et al., 2022). As for the bow storms, although the number of meteotsunami events is the lowest, the extreme waves, such as the 2007 event, are likely to be triggered by a strong rear inflow jet (Wang et al., 2022). This phenomenon leads to damaging downflow wind on the sea surface, suggesting that Proudman resonance is likely to occur in the rear of the bow structure around the Taiwan Strait.
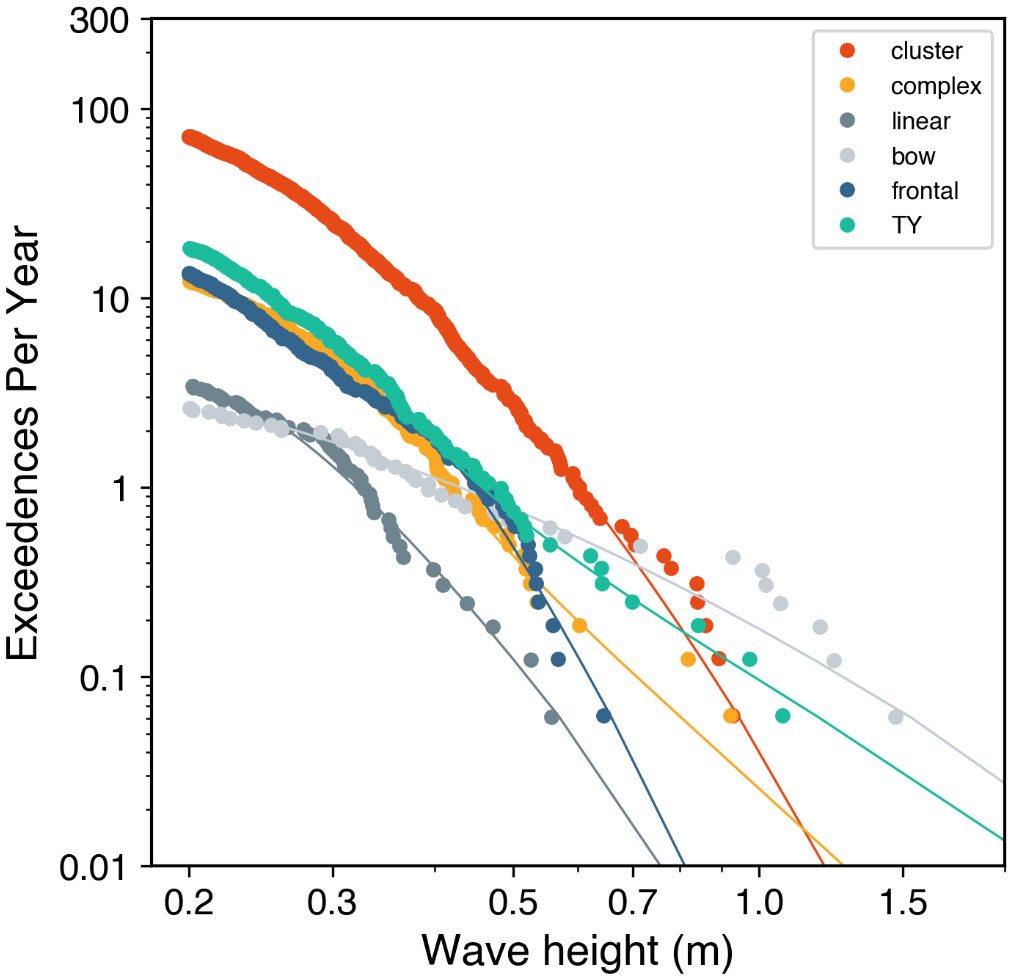
Figure 9 Same as Figure 8 but for causative storm types.
4 Discussion
4.1 Meteotsunami hazards and vulnerabilities
Figure 10 provides insights into the impact of meteotsunami on the coastal areas. Hazardous levels are determined by the annual average of 125 meteotsunami events occurred at the wave height >0.2 m, and the observed fractions of storm types at each station. The results prominently highlight that meteotsunamis can have a substantial impact with the highest occurrence of 29 events per year observed at St. 4 near Taipei City, the capital of Taiwan, which has approximately 6.8 million residents. In regions with lower population density but a high concentration of aquaculture industries, such as St. 3, 8, and 9 in the southwest regions, the risk level ranges from 13 to 16 events per year. In contrast, the east coastal areas of Taiwan, characterized by lower population density, exhibit a significantly lower potential risk. However, the sparsely populated northeast regions, with a low risk of approximately 5 events per year, may still be vulnerable to accidents, such as meteotsunami-induced rip currents (Linares et al., 2019; Liu and Wu, 2022). Typhoon-induced meteotsunamis show a similar risk level but are confined to St. 12.

Figure 10 Map of meteotsunami-storm during 2005-2020 with the population density. The annual average event associated with storm types at each station is illustrated as vertical bars.
Given these meteotsunami outcomes, we have identified an instance of boat damage in the northern Taiwan (Lin and Liang, 2017). Interestingly, even during the most significant meteotsunami occurrence in 2007, no damage linked to it was documented in newspaper articles or social media reports. This underscores the need for further investigations to enhance our understanding of the hazard risks posed by meteotsunamis.
4.2 Meteotsunamis in Asia-Pacific Ocean
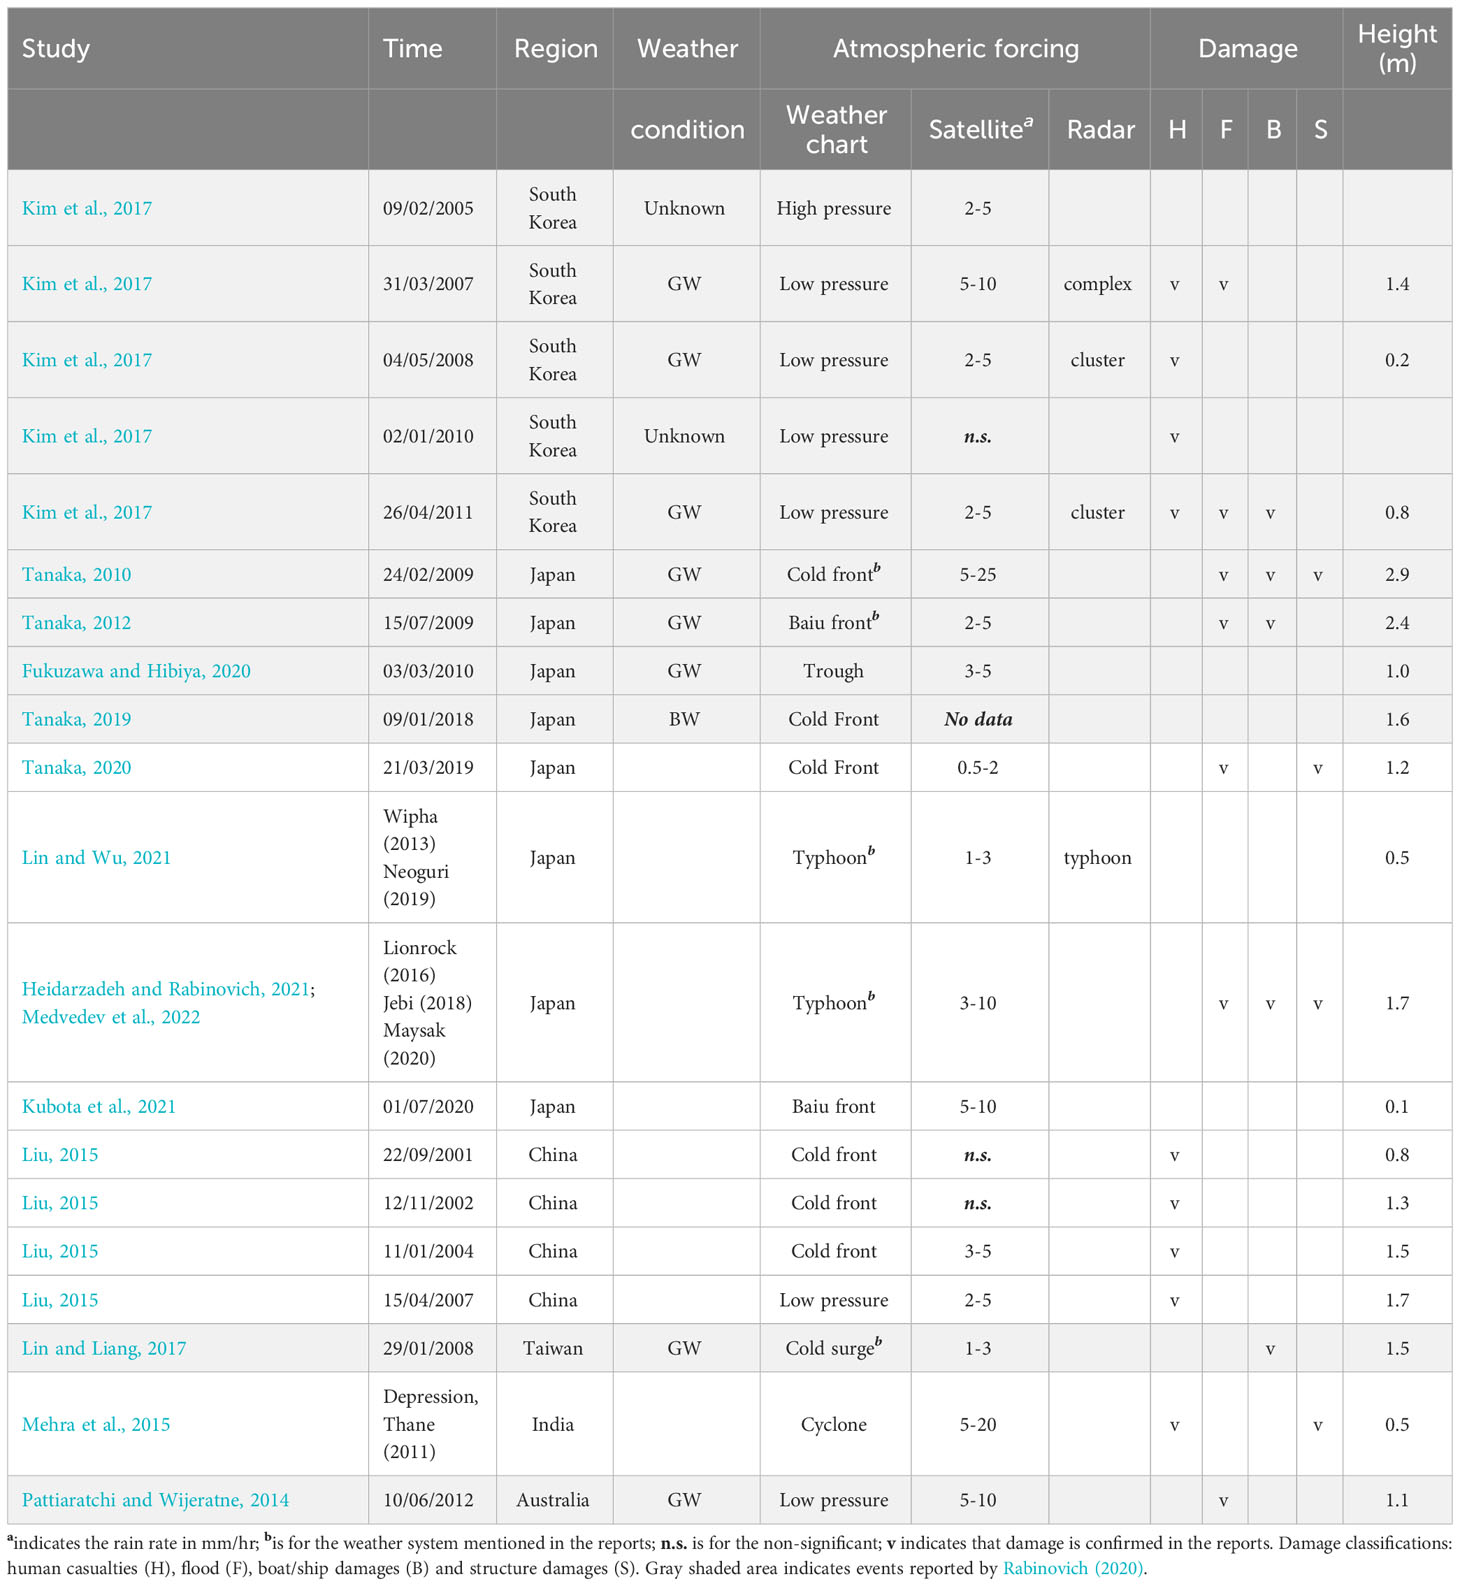
In the context of the Asia-Pacific Ocean (APO), our study is divided into two main parts. First, we provide a summary of meteotsunami occurrences, associated hazards, and their connection to weather conditions and atmospheric factors. For this, we’ve collected data from published literature, including individual events reported by Rabinovich (2020), as well as papers sourced from the Web of Science database. We present these findings in Table 2.
Over the past decades, there have been instances of strong meteotsunamis resulting in destructive damage and human casualties, notably in Longkou Harbor, China (Wang et al., 1987), and Nagasaki Bay, Japan (Hibiya and Kajiura, 1982). In recent years, our data includes 17 reports from South Korea, Japan, and China, with three reports collected from Taiwan, India, and Australia, respectively. We analyze the weather conditions and atmospheric forcings that contribute to meteotsunamis, and retrieve information regarding the damages and wave heights from event reports. In Table 2, weather conditions are categorized as “good weather (GW)” and “bad weather (BW),” referring to calm ocean conditions and stormy weather as defined by Rabinovich (2020). The atmospheric forcings in Table 2 are examined through the analysis of synoptic-scale patterns observed from CWA weather charts, the extraction of rain rates from satellite data (GSMaP), and the determination of storm types based on reported radar reflectivity images.
The findings reveal that 8 GW meteotsunami events were related to specific weather systems and light-to-moderate rains, challenging the notion that GW conditions are always “calm” on the ground. Additionally, it’s observed that the atmospheric disturbances are likely to be associated with the resulting meteotsunamis. However, the classification of storm types based on radar reflectivity imagery remains limited in these reports, indicating that the relationship between meteotsunamis and specific storm types has not been firmly established.
Furthermore, two events with wave heights ranging from 1.4 to 1.7 m resulted in high human casualties, notably along the coast of Jiangsu Province, China, and the southwest coast of South Korea. This suggests that unexpected and overlooked meteotsunamis could be responsible for drowning accidents, even in GW conditions, underscoring the potential danger they pose. It’s important to note that wave heights exceeding 0.5 m can also lead to other forms of damage.
In the second part of our study, we illustrate the maximum meteotsunamis associated with different storm types in Figure 11. We apply the proposed methodology to identify meteotsunamis and classify storm types in South Korea and Japan. Along the east coast of Taiwan, Japan, and certain Pacific islands, high waves induced by typhoons can reach heights of up to 2.1 m. On the west coast of South Korea, Kyushu Island in Japan, and Taiwan, meteotsunamis are associated with cluster, frontal, and bow types, respectively, with wave heights ranging from 1.0 to 1.6 m. Along the west coast of Japan, few meteotsunamis exceed a wave height of 1.0 m.
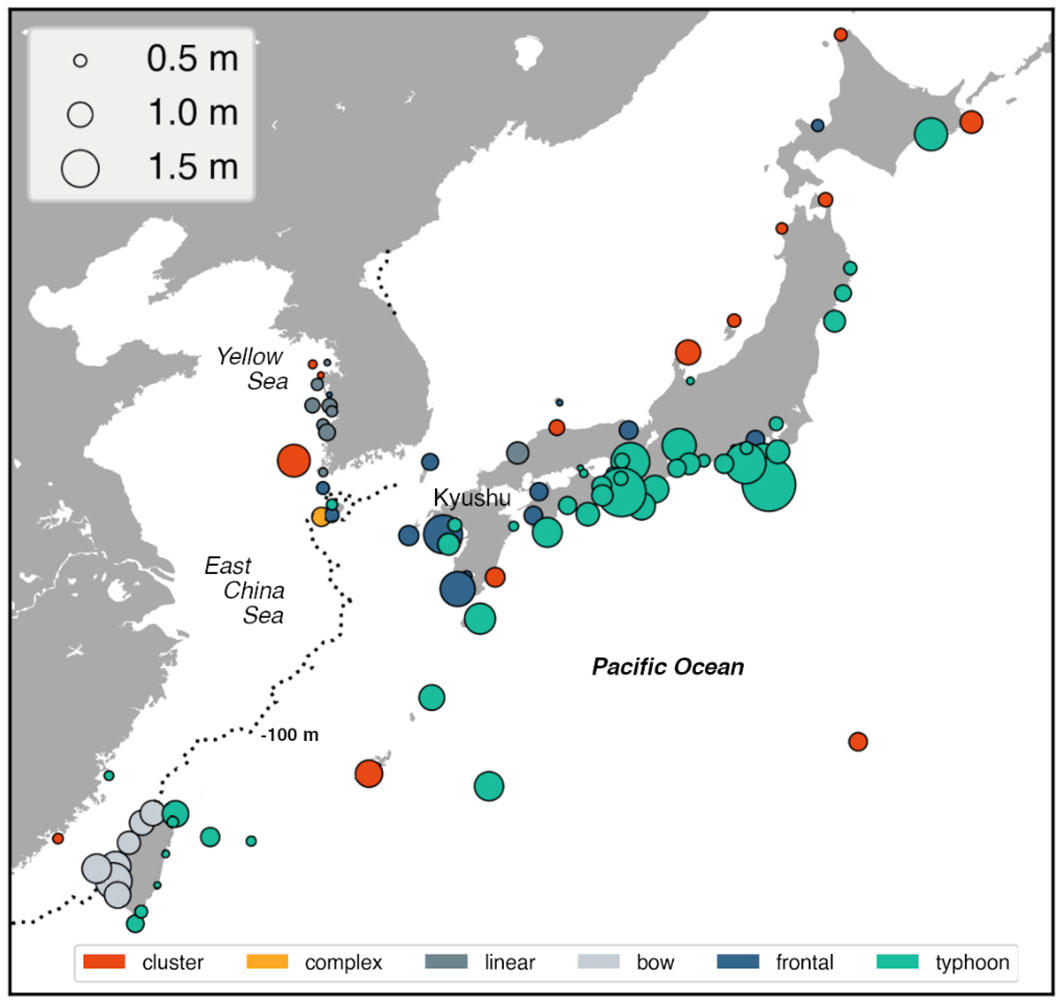
Figure 11 Map of extreme meteotsunamis associated with storms in the Asia-Pacific Ocean. The contour of -100 m illustrates as a dotted line.
Based upon the spatial patterns, extreme meteotsunamis are likely to originate in the Taiwan Strait, East China Sea, and Yellow Sea, particularly in areas with water depths within 100 m. In these regions, the resonance of meteotsunamis may be attributed to the specific storm types, benefiting from favorable water-depth conditions (Hibiya and Kajiura, 1982; Bechle et al., 2015; Šepić et al., 2015a).
Overall, the extreme meteotsunamis in the APO are posed by different storms. In the Japan area, typhoons are significant drivers of meteotsunamis and infra-gravity waves, potentially causing destructive impacts on shorelines and structures (Heidarzadeh and Rabinovich, 2021). Along the west coast of APO, high waves triggered by various storm types are comparable to those generated by typhoons. However, studies focusing on the mechanisms behind meteotsunamis resulting from diverse atmospheric forcings have received limited attention (Tanaka, 2010; Vilibić et al., 2014; Bechle et al., 2015; Williams et al., 2021), especially around the APO. Given that these storm patterns have been linked to mesoscale convective systems (MCSs), the frequent and intense MCSs occurring between subtropical and mid-latitude regions (Schumacher and Rasmussen, 2020) may contribute to the atmospheric disturbances for triggering meteotsunamis. This is exemplified by the spatial correlation between meteotsunamis and winds at the 500-hPa level in the same regions (Vilibić and Šepić, 2017).
5 Conclusions
In this study, we have conducted a comprehensive analysis of meteotsunami climatology and its connection to atmospheric influences from six distinct storm systems. Meteotsunami events have been identified at 17 water level stations across the Southern Asia-Pacific region during the period from 2005 to 2020. We have fitted annual exceedances of meteotsunami wave heights using the Pareto Type I distribution. Our findings reveal that the 1-yr predicted wave heights range from 0.44 to 0.72 m in the waters surrounding Taiwan. In the same areas, wave heights exceeding 1.0 meter are anticipated to occur more than once in a 3-yr interval. For all meteotsunami events, our results demonstrate that hazardous meteotsunamis (wave heights> 0.3 m) can occur up to 44 events per year. The spatial and temporal characteristics provide a better understanding of the relationship between meteotsunamis and various storm types.
During the period from December to April, intense and frequent meteotsunamis are strongly associated with cluster storms, primarily in the western regions of Taiwan. Typhoon-induced meteotsunamis are more prevalent in the seasons between July and October along the east coasts of Taiwan. In the waters of western Taiwan, our findings suggest that causative storms passing through the Taiwan Strait have the potential to trigger the Proudman resonance, resulting in the generation of meteotsunamis, particularly in water-depth favorable conditions ranging from 40 to 70 m, with estimated meteotsunami wave speeds of 20-26 m/s. In eastern Taiwan, typhoons serve as the primary drivers of meteotsunamis and infra-gravity waves simultaneously. Additionally, high waves triggered by three storm types—cluster, complex, and bow storms—are comparable to those posed by typhoons. For typhoon and bow types, the predicted wave heights in a 100-year interval could exceed 2.0 m, emphasizing the need for risk management and safety preparations to mitigate the potential hazardous impact on coastal communities. Furthermore, our findings also highlight the potential impact of meteotsunamis in the northwest regions, including Taipei City, the capital city of Taiwan, which has approximately 6.8 million people. In the northeast regions, while the meteotsunami risk is relatively low, the possibility of unexpected meteotsunamis cannot be disregarded, particularly considering the active marine recreations.
In summary, this study represents the first comprehensive examination of meteotsunami-storm characteristics and their resulting hazard risks in the coastal areas of the Southern Asia-Pacific Ocean. The identified relationships between meteotsunamis and their associations with atmospheric influences, pressure/wind disturbances, and storm types can be useful for early meteotsunami detection. We believe that our findings hold significant implications for risk management in coastal regions and can provide valuable data and insights for decision-makers. Finally, the approach proposed in this study can be extended to the coastal areas across the entire Asia-Pacific Ocean, offering enhanced understanding on meteotsunami behavior.
Data availability statement
The original contributions presented in the study are included in the article/supplementary material. Further inquiries can be directed to the corresponding author.
Author contributions
L-CL: Conceptualization, Formal Analysis, Investigation, Methodology, Validation, Visualization, Writing – original draft, Writing – review & editing. W-CL: Conceptualization, Supervision, Writing – review & editing. CW: Conceptualization, Writing – review & editing.
Funding
The author(s) declare that no financial support was received for the research, authorship, and/or publication of this article.
Conflict of interest
The authors declare that the research was conducted in the absence of any commercial or financial relationships that could be construed as a potential conflict of interest.
Publisher’s note
All claims expressed in this article are solely those of the authors and do not necessarily represent those of their affiliated organizations, or those of the publisher, the editors and the reviewers. Any product that may be evaluated in this article, or claim that may be made by its manufacturer, is not guaranteed or endorsed by the publisher.
References
Akamatsu H. (1982). On seiches in Nagasaki Bay. Pap. Meteorol. Geophys. 33 (2), 95–115. doi: 10.2467/mripapers.33.95
Anarde K., Cheng W., Tissier M., Figlus J., Horrillo J. (2021). Meteotsunamis accompanying tropical cyclone rainbands during Hurricane Harvey. J. Geophys. Res. Oceans. 126 (1), e2020JC016347. doi: 10.1029/2020JC016347
Anderson J. D., Wu C. H., Schwab D. J. (2015). Wave climatology in the apostle islands, Lake Superior. J. Geophys. Res. Oceans. 120, 4869–4890. doi: 10.1002/2014JC010278
Bechle A. J., Kristovich D. A. R., Wu C. H. (2015). Meteotsunami occurrences and causes in Lake Michigan. J. Geophys. Res. Oceans. 120, 8422–8438. doi: 10.1002/2015JC011317
Bechle A. J., Wu C. H., Kristovich D. A., Anderson E. J., Schwab D. J., Rabinovich A. B. (2016). Meteotsunamis in the Laurentian Great Lakes. Sci. Rep. 6, 37832. doi: 10.1038/srep37832
Belušić D., Grisogono B., Klaić Z. B. (2007). Atmospheric origin of the devastating coupled air-sea event in the east Adriatic. J. Geophys. Res. Atmos. 112, D17111. doi: 10.1029/2006JD008204
Chien F.-C., Kuo Y.-H. (2006). Topographic effects on a wintertime cold front in Taiwan. Mon. Weather Rev. 134, 3297–3316. doi: 10.1175/MWR3255.1
Choulakian V., Stephens M. (2001). Goodness-of-fit test for the generalized Pareto distribution. Technometrics. 43, 478–485. doi: 10.1198/00401700152672573
de Jong M. P. C., Battjes J. A. (2004). Low-frequency sea waves generated by atmospheric convection cells. J. Geophys. Res. Oceans. 109, 2003JC001931. doi: 10.1029/2003JC001931
Dusek G., DiVeglio C., Licate L., Heilman L., Kirk K., Paternostro C., et al. (2019). A meteotsunami climatology along the US East Coast. Bull. Am. Meteorol. Soc 100, 1329–1345. doi: 10.1175/BAMS-D-18-0206.1
Ewing M., Press F., Donn W. J. (1954). An explanation of the Lake Michigan wave of 26 June 1954. Science. 120, 684–686. doi: 10.1126/science.120.3122.684
Filliben J. J. (1975). The Probability Plot Correlation Coefficient Test for Normality. Technometrics. 17, 111–117. doi: 10.1080/00401706.1975.10489279
Fowle M. A., Roebber P. J. (2003). Short-range (0–48 h) numerical prediction of convective occurrence, mode, and location. Weather Forecast. 18, 782–794. doi: 10.1175/1520-0434(2003)018<0782:SHNPOC>2.0.CO;2
Fukuzawa K., Hibiya T. (2020). The amplification mechanism of a meteo-tsunami originating off the western coast of Kyushu Island of Japan in the winter of 2010. J. Oceanogr. 76, 169–182. doi: 10.1007/s10872-019-00536-3
Geist E. L., Ten Brink U. S., Gove M. (2014). A framework for the probabilistic analysis of meteotsunamis. Nat. Hazards. 74, 123–142. doi: 10.1007/s11069-014-1294-1
Gusiakov V. K. (2021). Meteotsunamis at global scale: problems of event identification, parameterization and cataloguing. Nat. Hazards. 106, 1105–1123. doi: 10.1007/s11069-020-04230-2
Heidarzadeh M., Rabinovich A. B. (2021). Combined hazard of typhoon-generated meteorological tsunamis and storm surges along the coast of Japan. Nat. Hazards. 106, 1639–1672. doi: 10.1007/s11069-020-04448-0
Hence D. A., Houze R. A. (2012). Vertical structure of tropical cyclone rainbands as seen by the TRMM Precipitation Radar. J. Atmospheric Sci. 69, 2644–2661. doi: 10.1175/JAS-D-11-0323.1
Herbers T. H. C., Elgar S., Guza R. T. (1994). Infragravity-frequency (0.005-0.05 Hz) motions on the shelf, part I, forced waves. J. Phys. Oceanogr. 24 (5), 917–927. doi: 10.1175/1520-0485(1994)024<0917:IFHMOT>2.0.CO;2
Herbers T. H. C., Elgar S., Guza R. T. (1995). Generation and propagation of infragravity waves. J. Geophys. Res. 100 (C12), 24963–24872. doi: 10.1029/95JC02680
Hibiya T., Kajiura K. (1982). Origin of the Abiki phenomenon (a kind of seiche) in Nagasaki Bay. J. Oceanogr. Soc Jpn. 38, 172–182. doi: 10.1007/BF02110288
Houze R. A. Jr (2004). Mesoscale convective systems. Rev. Geophys. 42 (4), RG4003. doi: 10.1029/2004RG000150
Houze R. A. Jr (2010). Clouds in tropical cyclones. Mon. Weather Rev. 138 (2), 293–344. doi: 10.1175/2009MWR2989.1
Huang W. R., Chang Y. H. (2018). Characteristics and mechanisms of the diurnal variation of winter precipitation in Taiwan. Int. J. Climatol. 38 (7), 3058–3068. doi: 10.1002/joc.5482
Kerns B. W. J., Chen Y. L., Chang M. Y. (2010). The diurnal cycle of winds, rain, and clouds over Taiwan during the mei-yu, summer, and autumn rainfall regimes. Mon. Weather Rev. 138 (2), 497–516. doi: 10.1175/2009MWR3031.1
Kim M.-S., Kim H., Eom H.-M., Yoo S.-H., Woo S.-B. (2019). Occurrence of hazardous meteotsunamis coupled with pressure disturbance traveling in the Yellow Sea, Korea. J. Coast. Res. 91, 71–75. doi: 10.2112/SI91-015.1
Kim M. S., Kim H., Kim Y. K., Yoo S. H., Eom H. M., Woo S. B. (2017). Determination of accurate arrival time of meteotsunami event in Yellow Sea. J. Coast. Res. 79), 149–153. doi: 10.2112/SI79-031.1
Kim M. S., Woo S. B., Eom H., You S. H. (2021a). Occurrence of pressure-forced meteotsunami events in the eastern Yellow Sea during 2010–2019. Nat. Hazards Earth Syst. Sci. 21 (11), 3323–3337. doi: 10.5194/nhess-21-3323-2021
Kim M. S., Woo S. B., Eom H., You S. H. (2021b). Progress report on addressing meteotsunami risk in the eastern Yellow Sea. Environ. Res. Lett. 17 (1), 014009. doi: 10.1088/1748-9326/ac3e21
Kim M. S., Woo S. B., Eom H., You S. H., Lee H. M. (2022). Towards observation-and atmospheric model-based early warning systems for meteotsunami mitigation: A case study of Korea. Weather Clim. Extrem. 37, 100463. doi: 10.1016/j.wace.2022.100463
Kubota T., Saito T., Chikasada N. Y., Sandanbata O. (2021). Meteotsunami Observed by the Deep-Ocean Seafloor Pressure Gauge Network Off Northeastern Japan. Geophys. Res. Lett. 48, e2021GL094255. doi: 10.1029/2021GL094255
Kubota T., Shige S., Hashizume H., Aonashi K., Takahashi N., Seto S., et al. (2007). Global precipitation map using satellite-borne microwave radiometers by the GSMaP project: Production and validation. IEEE Trans. Geosci. Remote Sens. 45, 2259–2275. doi: 10.1109/TGRS.2007.895337
Lin L. C., Liang M. C. (2017). Meteotsunamis produced by high frequency atmospheric pressure forcing. Terr. Atmos. Ocean Sci. 28, 1033–1040. doi: 10.3319/TAO.2017.03.20.01
Lin L. C., Wu C. H. (2021). Unexpected meteotsunamis prior to typhoon Wipha and typhoon Neoguri. Nat. Hazards. 106, 1673–1686. doi: 10.1007/s11069-020-04313-0
Linares Á., Wu C. H., Bechle A. J., Anderson E. J., Kristovich D. A. (2019). Unexpected rip currents induced by a meteotsunami. Sci. Rep. 9, 2105. doi: 10.1038/s41598-019-38716-2
Liu F. (2015). Strange tide in the northern Jiangsu shoal: Research on disaster monitoring and early warning technology. (China: Ocean Press (in Chinese)). Available at: http://www.oceanpress.com.cn/front/book/detail?book_id=2172 (Accessed November 6, 2023).
Liu Y., Wu C. H. (2022). Drowning incidents and conditions due to hidden flash rips in Lake Michigan. Sci. Total Environ. 827, 154314. doi: 10.1016/j.scitotenv.2022.154314
Marks F. D. (1985). Evolution of the structure of precipitation in Hurricane Allen, 1980). Mon. Weather Rev. 113, 909–930. doi: 10.1175/1520-0493(1985)113<0909:EOTSOP>2.0.CO;2
Marks F. D., Houze R. A. (1987). Inner core structure of Hurricane Alicia from airborne Doppler radar observations. J. Atmospheric Sci. 44, 1296–1317. doi: 10.1175/1520-0469(1987)044<1296:ICSOHA>2.0.CO;2
Medvedev I. P., Rabinovich A. B., Šepić J. (2022). Destructive coastal sea level oscillations generated by Typhoon Maysak in the Sea of Japan in September 2020. Sci. Rep. 12, 8463. doi: 10.1038/s41598-022-12189-2
Mehra P., Soumya M., Vethamony P., Vijaykumar K., Balakrishnan Nair T. M., Agarvadekar Y., et al. (2015). Coastal sea level response to the tropical cyclonic forcing in the northern Indian Ocean. Ocean Sci. 11, 159–173. doi: 10.5194/os-11-159-2015
Meng Z., Zhang F., Luo D., Tan Z., Fang J., Sun J., et al. (2019). Review of Chinese atmospheric science research over the past 70 years. Synoptic meteorology. Sci. China Earth Sci. 62, 1946–1991. doi: 10.1007/s11430-019-9534-6
Monserrat S., Vilibić I., Rabinovich A. B. (2006). Meteotsunamis: atmospherically induced destructive ocean waves in the tsunami frequency band. Nat. Hazards Earth Syst. Sci. 6, 1035–1051. doi: 10.5194/nhess-6-1035-2006
Narvaez L., Janzen S., Eberle C., Sebesvari Z. (2022) Technical Report: Taiwan drought. Available at: https://reliefweb.int/report/china-taiwan-province/technical-report-taiwan-drought-interconnected-disaster-risks-20212022 (Accessed November 2, 2023).
Olabarrieta M., Valle-Levinson A., Martinez C. J., Pattiaratchi C., Shi L. (2017). Meteotsunamis in the northeastern Gulf of Mexico and their possible link to El Niño Southern Oscillation. Nat. Hazards. 88, 1325–1346. doi: 10.1007/s11069-017-2922-3
Orlić M. (1980). About a possible occurrence of the Proudman resonance in the Adriatic. Thalass. Jugosl. 16, 79–88.
Orlić M., Belušić D., Janeković I., Pasarić M. (2010). Fresh evidence relating the great Adriatic surge of 21 June 1978 to mesoscale atmospheric forcing. J. Geophys. Res. Oceans. 115, 79–88. doi: 10.1029/2009JC005777
Pattiaratchi C., Wijeratne E. M. S. (2014). Observations of meteorological tsunamis along the south-west Australian coast. Nat. Hazards. 74, 281–303. doi: 10.1007/s11069-014-1263-8
Pattiaratchi C. B., Wijeratne E. M. S. (2015). Are meteotsunamis an underrated hazard? Philos. Trans. R. Soc Math. Phys. Eng. Sci. 373, 20140377. doi: 10.1098/rsta.2014.0377
Pellikka H., Laurila T. K., Boman H., Karjalainen A., Björkqvist J.-V., Kahma K. K. (2020). Meteotsunami occurrence in the Gulf of Finland over the past century. Nat. Hazards Earth Syst. Sci. 20, 2535–2546. doi: 10.5194/nhess-20-2535-2020
Pellikka H., Šepić J., Lehtonen I., Vilibić I. (2022). Meteotsunamis in the northern Baltic Sea and their relation to synoptic patterns. Weather Clim. Extrem. 38, 100527. doi: 10.1016/j.wace.2022.100527
Platzman G. W. (1958). A numerical computation of the surge of 26 June 1954 on Lake. Michigan. Geophysica. 6 (1), 407–438.
Proudman J. (1929). The effects on the sea of changes in atmospheric pressure. Geophys. Suppl. Mon. Not. R. Astron. Soc 2, 197–209. doi: 10.1111/j.1365-246X.1929.tb05408.x
Rabinovich A. B. (2009). “Seiches and harbor oscillations,” in Handbook of Coastal and Ocean Engineering. Ed. Kim Y. C. (Singapore: World Sci. Publ. Co), 193–236.
Rabinovich A. B. (2020). Twenty-seven years of progress in the science of meteorological tsunamis following the 1992 Daytona Beach event. Pure Appl. Geophys. 177, 1193–1230. doi: 10.1007/s00024-019-02349-3
Schumacher R. S., Rasmussen K. L. (2020). The formation, character and changing nature of mesoscale convective systems. Nat. Rev. Earth Environ. 1, 300–314. doi: 10.1038/s43017-020-0057-7
Šepić J., Vilibić I., Fine I. (2015a). Northern Adriatic meteorological tsunamis: Assessment of their potential through ocean modeling experiments. J. Geophys. Res. Oceans. 120, 2993–3010. doi: 10.1002/2015JC010795
Šepić J., Vilibić I., Lafon A., Macheboeuf L., Ivanović Z. (2015b). High-frequency sea level oscillations in the Mediterranean and their connection to synoptic patterns. Prog. Oceanogr. 137, 284–298. doi: 10.1016/j.pocean.2015.07.005
Šepić J., Vilibić I., Monserrat S. (2009). Teleconnections between the Adriatic and the Balearic meteotsunamis. Phys. Chem. Earth Parts ABC. 34, 928–937. doi: 10.1016/J.PCE.2009.08.007
Šepić J., Vilibić I., Rabinovich A. B., Monserrat S. (2015c). Widespread tsunami-like waves of 23-27 June in the Mediterranean and Black Seas generated by high-altitude atmospheric forcing. Sci. Rep. 5, 11682. doi: 10.1038/srep11682
Šepić J., Vilibić I., Strelec Mahović N. (2012). Northern Adriatic meteorological tsunamis: Observations, link to the atmosphere, and predictability. J. Geophys. Res. Oceans. 117, C02002. doi: 10.1029/2011JC007608
Shi L., Olabarrieta M., Nolan D. S., Warner J. C. (2020). Tropical cyclone rainbands can trigger meteotsunamis. Nat. Commun. 11, 678. doi: 10.1029/2020JC016347
Shiga T., Ichikawa M., Kusumoto K., Suzuki H. (2007). A statistical study on seiche around Kyushu and Satsunan Islands. Pap. Meteor. Geophys. 74, S139–S162.
Smirnova D. A., Medvedev I. P. (2023). Extreme sea level variations in the Sea of Japan caused by the passage of typhoons Maysak and Haishen in September 2020. Oceanology. 63 (5), 623–636. doi: 10.1134/S0001437023050168
Tanaka K. (2010). Atmospheric pressure-wave bands around a cold front resulted in a meteotsunami in the East China Sea in February 2009. Nat. Hazards Earth Syst. Sci. 10, 2599–2610. doi: 10.5194/nhess-10-2599-2010
Tanaka K. (2012). On meteotsunamis around Tsushima Strait generated by the Baiu front. Nat. Hazards. 63, 805–822. doi: 10.1007/s11069-012-0186-5
Tanaka K. (2019). “Meteotsunamis propagating along continental slope in the northwestern Pacific Ocean: a case study of the January 2018 event in Shikoku area,” in The First World Conference on Meteotsunamis (Split, Croatia: Institute of Oceanography and Fisheries), 8–11.
Tanaka K. (2020). Inundation by meteotsunami in Nagasaki urban area on March 21, 2019. J. Jpn. Soc Nat. Disaster Sci. 38, 433–447. doi: 10.24762/jndsj.38.4_433
Ushio T., Kubota T., Shige S., Okamoto K., Aonashi K., Inoue T., et al. (2009). A Kalman filter approach to the Global Satellite Mapping of Precipitation (GSMaP) from combined passive microwave and infrared radiometric data. J. Meteorol. Soc Japan 87A, 137–151. doi: 10.2151/jmsj.87A.137
Vilibić I., Mihanović H., Charrayre F. (2014). Assessing meteotsunami potential of high-frequency air pressure oscillations observed in the middle Adriatic. Nat. Hazards. 74, 217–232. doi: 10.1007/s11069-013-0865-x
Vilibić I., Šepić J. (2017). Global mapping of nonseismic sea level oscillations at tsunami timescales. Sci. Rep. 7, 40818. doi: 10.1038/srep40818
Vilibić I., Šepić J., Rabinovich A., Monserrat S. (2016). Modern approaches in meteotsunami research and early warning. Front. Mar. Sci. 3 (57). doi: 10.3389/fmars.2016.00057
Wang C.-C., Hou J.-P., Tseng C.-H., Chang P.-L., Lee D.-I. (2022). Study of an Asymmetric and Anticyclonic Bow Echo Near Taiwan. Atmosphere. 13, 331. doi: 10.3390/atmos13020331
Wang X., Li K., Yu Z., Wu J. (1987). Statistical characteristics of seiches in Longkou Harbour. J. Phys. Oceanogr. 17, 1063–1065. doi: 10.1175/1520-0485(1987)017<1063:SCOSIL>2.0.CO;2
Wertman C. A., Yablonsky R. M., Shen Y., Merrill J., Kincaid C. R., Pockalny R. A. (2014). Mesoscale convective system surface pressure anomalies responsible for meteotsunamis along the US East Coast on June 13t. Sci. Rep. 4, 7143. doi: 10.1038/srep07143
Williams D. A., Schultz D. M., Horsburgh K. J., Hughes C. W. (2021). An 8-yr meteotsunami climatology across northwest Europe: 2010–17. J. Phys. Oceanogr. 51, 1145–1161. doi: 10.1175/JPO-D-20-0175.1
Workoff T. E., Kristovich D. A., Laird N. F., LaPlante R., Leins D. (2012). Influence of the Lake Erie overlake boundary layer on deep convective storm evolution. Weather Forecast. 27, 1279–1289. doi: 10.1175/WAF-D-11-00076.1
Xiao J., Tan Z.-M., Chow K.-C. (2019). Structure and formation of convection of secondary rainbands in a simulated typhoon Jangmi, (2008). Meteorol. Atmospheric Phys. 131, 713–737. doi: 10.1007/s00703-018-0599-0
Keywords: meteotsunamis, climatology, Asia-Pacific Ocean, convective storms, hazard risks
Citation: Lin L-C, Liu W-C and Wu CH (2024) A 16-year meteotsunami climatology in the coastal areas of southern Asia-Pacific Ocean. Front. Mar. Sci. 10:1333843. doi: 10.3389/fmars.2023.1333843
Received: 06 November 2023; Accepted: 20 December 2023;
Published: 23 January 2024.
Edited by:
Ivica Vilibic, Rudjer Boskovic Institute, CroatiaReviewed by:
Alexander B. Rabinovich, P.P. Shirshov Institute of Oceanology (RAS), RussiaMyung-Seok Kim, Korea Polar Research Institute, Republic of Korea
Copyright © 2024 Lin, Liu and Wu. This is an open-access article distributed under the terms of the Creative Commons Attribution License (CC BY). The use, distribution or reproduction in other forums is permitted, provided the original author(s) and the copyright owner(s) are credited and that the original publication in this journal is cited, in accordance with accepted academic practice. No use, distribution or reproduction is permitted which does not comply with these terms.
*Correspondence: Wen-Cheng Liu, d2NsaXVAbnV1LmVkdS50dw==
 Li-Ching Lin
 Wen-Cheng Liu
 Chin H. Wu2