 Tiantian Sun1,2
 Jun Cao1,2*
 Haijun Qiu1
 Piaoer Fu1,2
 Hailong Lu3
 Zijie Ning1,2Daohua Chen1,2
 Yinan Deng1,2*Shengxiong Yang1
- 1Key Laboratory of Marine Mineral Resources, Ministry of Natural Resources, Guangzhou Marine Geological Survey, China Geological Survey, Guangzhou, China
- 2National Engineering Research Center for Gas Hydrate Exploration and Development, Guangzhou, China
- 3Beijing International Center for Gas Hydrate, School of Earth and Space Sciences, Peking University, Beijing, China
In this study, optimization of the methane purification method by gas chromatography (GC) is described for the determination of methane clumped isotope compositions of natural gas. Methane was purified under the carrying of helium on the assembly line composed of a vacuum apparatus and two-column gas chromatography. Once methane was detected by the passive thermal conductivity detector (TCD) on the GC, it was collected through a silica trap immersed in liquid nitrogen. Optimum conditions of chromatographic column diameter (1/4 inch outside diameter), temperature (25 °C), and flow rate (50.8 ml min-1) have been determined. When N2/CH4 (by volume) is<8.7%, the purification experiment can be undertaken once, while a double purification experiment is required when natural gas samples have an N2/CH4 of 8.7-78.0%. The purification method yielded a purity of 98.4-98.8% with a recovery of 97.3-98.7% on purified methane samples verified by GC determination. N2 was the main source that contributed to the loss of the purity, however, the N-bearing isobaric interferences (14 and 14) in purified samples presented<1‰ intensity compared to the methane isotopologues (13 and 13CH3D+), thus we concluded that these interferences have no impact on clumped isotope determinations. The conventional δ13CVPDB and δDVSMOW values of purified methane samples were consistent with those of pure methane. A preliminary measurement of Δ13CH3D (working gas) of purified samples revealed differences of -0.27‰, which was within the internal precision of the measurement. The entire process of a single purification can be completed within two hours. Our proposed method could be used for the clumped isotope purification of natural gas with higher than ~50% methane.
1 Introduction
Methane is an important energy source and greenhouse gas that is generated by natural and anthropogenic processes. It attracts great attentions due to it relates to the fields of energy exploration and development, the greenhouse effect, the global carbon cycle, and climate change (Kirschke et al., 2013; Nisbet et al., 2014; Schaefer et al., 2016; Schwietzke et al., 2016; Wang et al., 2021). Identifying the source and migration process of methane is of important for understanding the formation mechanism of natural gas, which facilitates the sustainable development of energy resources. Past to present, conventional stable isotope measurements have long been used to track sources and processes associated with naturally occurring methane. Such as δ13C and δD were widely employed to identifying abiotic, biogenic, and thermogenic methane (Schoell, 1980; Etiope and Sherwood Lollar, 2013; Douglas et al., 2017; Sherwood et al., 2017; Milkov and Etiope, 2018; Thiagarajan et al., 2020). In recent years, the newly-developed methane clumped isotope techniques have aided the study of the origin and migration of natural gas (Douglas et al., 2016; Young et al., 2017; Stolper et al., 2018; Giunta et al., 2019; Xie et al., 2021), particularly, considering the overlap of conventional stable isotope compositions (δ13C and δD) of natural gas of different genesis (Douglas et al., 2017; Milkov and Etiope, 2018; Dong et al., 2020). The application of this technique focuses on the abundances of the doubly substituted isotopologues (13CH3D and 12CH2D2) relative to the stochastic distribution (Young et al., 2016; Young et al., 2017; Douglas et al., 2017). When Δ13CH3D and Δ12CH2D2 values of methane samples are consistent with thermodynamic equilibrium, the formation (or equilibration) temperature can be estimated. The calculated temperature places further constraints on the genesis of natural gas (thermogenesis, biogenesis, or mixture of sources). Departure from equilibrium can also provide information of kinetic processes such as mixing, migration, oxidation, and bond re-ordering due to isotope exchange processes (Wang et al., 2015; Young et al., 2017; Giunta et al., 2019; Labidi et al., 2020; Warr et al., 2021; Giunta et al., 2021). These kinetic processes may alter the isotopic signatures of methane, providing new constraints on environmental and chemical mechanisms of natural gas formation.
Precise determination of methane clumped isotope compositions (Δ13CH3D and Δ 12CH2D2) has been promoted by the development of methane purification techniques and instrument testing technology.
The early study of Ono et al. (2014) reported the 13CH3D+ analysis by tunable infrared laser direct absorption spectrometry (TILDAS). A subsequent study on the precise measurement of 12CH2 isotopologue on TILDAS was proposed by Gonzalez et al. (2019). Shen et al. (2016) reported the measurement of 13CH3D+ and 12CH2 isotopologues by cavity ringdown spectroscopy. Except for the spectroscopy method, high-resolution IRMS determinations has been promoted by other laboratories. Stolper et al. (2014a) reported the Δ18 (a combination of 13CH3D+ and 12CH2 ) data performed on a prototype version of the Thermo Scientific Ultra HR-IRMS (Ultra), which has a mass resolution of 25000. Methane isotopologues 13CH3D+ and 12CH2 were also separated and measured by Nu Panorama at a mass resolution power of >40000 (Young et al., 2017), which can also be realized with the production model of the Thermo Scientific Ultra HR-IRMS (Eldridge et al., 2019; Dong et al., 2020; Zhang et al., 2021). Despite different instrument models, dual inlet gas source system is a fixed configuration installed in the IRMS instruments. It employs multiple comparisons between samples and working reference gases under the same testing conditions, still put forward high requirements on purity of methane samples, typically >99% (Stolper et al., 2014a). In this context, the pretreatment of methane is an important part of high-precision methane clumped isotopic analysis.
The methane extraction methods for methane clumped isotope determinations are based on two methods: By using cryogenic (Stolper et al., 2014a; Stolper et al., 2014b; Douglas et al., 2016; Shuai et al., 2018; Eldridge et al., 2019; Douglas et al., 2020; Dong et al., 2021; Xie et al., 2021) or gas chromatography approaches (Wang et al., 2015; Young et al., 2017; Giunta et al., 2019; Labidi et al., 2020; Taenzer et al., 2020; Zhang et al., 2021). The cryogenic approaches separate and collect methane according to the specific vapor pressure of the components in natural gas. As the gas sample is frozen in a liquid helium-cooled cryostat, H2, N2, O2, and He are removed by pumping at a low vapor pressure at a temperature of 20 K. Methane is released at 70 K, and ethane and larger hydrocarbons are retained at lower vapor pressures. This method provides methane purities of >99.8% with negligible isotopic fractionation during pumping. However, the pumping or collecting time of each stage during purification largely depends on the experimenters’ experience. Meanwhile, the GC method was also proved to be effective in widespread applications of methane purification cases. Young et al. (2017) first reported the GC method for methane clumped isotope analysis by an ultra-high vacuum apparatus combined with two-column (1/8 inch OD) GC packing with 5A molecular sieve and HayeSep D porous polymer. Nevertheless, the proposed method lacks recovery and purity data. Subsequently, the GC approach has been widely adopted with little modification (Giunta et al., 2019; Labidi et al., 2020; Taenzer et al., 2020). Zhang et al. (2021) used a double-column GC method with two HayeSep Q columns, with a recovery of ~100%. Negligible isotopic deviations on Δ13CH3D were revealed (0.05 ± 0.22‰). However, it is noteworthy that methane recovery and purity estimates were predominately using gas pressure gauges with lacking compositional analysis in the previous study. This means that other components in natural gas may not have been fully removed, leading to a compensated value evaluated by the gas pressure gauge. So far, a systematic study of gas purification protocols by GC has not been reported in the context of methane clumped isotope measurements.
In this paper, we further optimized the methane separation protocol based on the characteristics (column diameter, oven temperature, and carrier gas pressure) of the GC conditions. We proposed systematic verification by GC on the purity and recovery of purified methane. The visual monitoring of methane signals by GC realized the complete, controllable and reliable methane collection. We first investigated the number of purification tests that were required when dealing with gases with varying compositions. The effectiveness and reliability of the purification method were confirmed by the preliminary determination of conventional carbon (δ13CVPDB), and hydrogen (δDVSMOW) isotope compositions on Thermo Finnigan MAT 253 (MAT 253) instrument and δ13C, δD, Δ13CH3D(wg) compositions on Thermo Scientific Ultra (Ultra) instrument. Our purification process provides available approach and method for the optimization of pretreatment techniques of methane clumped isotope determinations.
2 Materials and methods
2.1 Instruments and reagents
Here we designed a purification line to purify methane. The purification consists of two major components: vacuum apparatus and GC instrument. The vacuum apparatus utilizes a hydrocarbon-free mechanical pump and turbomolecular pump to ensure high vacuum. The vacuum line includes VCR face-seal fittings (Swagelok) and CF (ConFlat) flanges. The U-shaped cold trap is densely packed with silica gel at the bottom. A GC-1310 (Thermo Scientific) with a TCD detector is installed on the purification line for real-time monitoring of gas signals and collecting gas. Conventional carbon (δ13CVPDB) and hydrogen (δDVSMOW) isotope analyses were carried out on a Thermo Finnigan MAT 253 isotope ratio mass spectrometer connected with a GC-Trace ultra through a ConFlo IV. The determinations of δ13C, δD, and Δ13CH3D(wg) values were performed on a Thermo Scientific Ultra high resolution isotope ratio mass spectrometer. CH4, C2H6, C3H8, O2, N2, CO, CO2, and H2 standard gases of ultra-high purity (>99.999%) were used for condition experiments.
2.2 Purification methods
Two columns installed in GC were used in series for methane purification: a 3 m 1/4 inch outside diameter (OD) column packed with 5A molecular sieve was used for the separation of H2, O2, N2, CO, and CxHx. A 1.5 m 1/4 inch OD column packed with HayeSep D porous polymer was used for the separation of hydrocarbon gases. The temperature of the purification line was set at 25 °C. Helium (>99.999% pure) carrier-gas pressure was 150 kPa with a flow rate of 50.8 ml min–1 (see Table 1). The comparison of GC parameters with other laboratories is shown in Table 2.
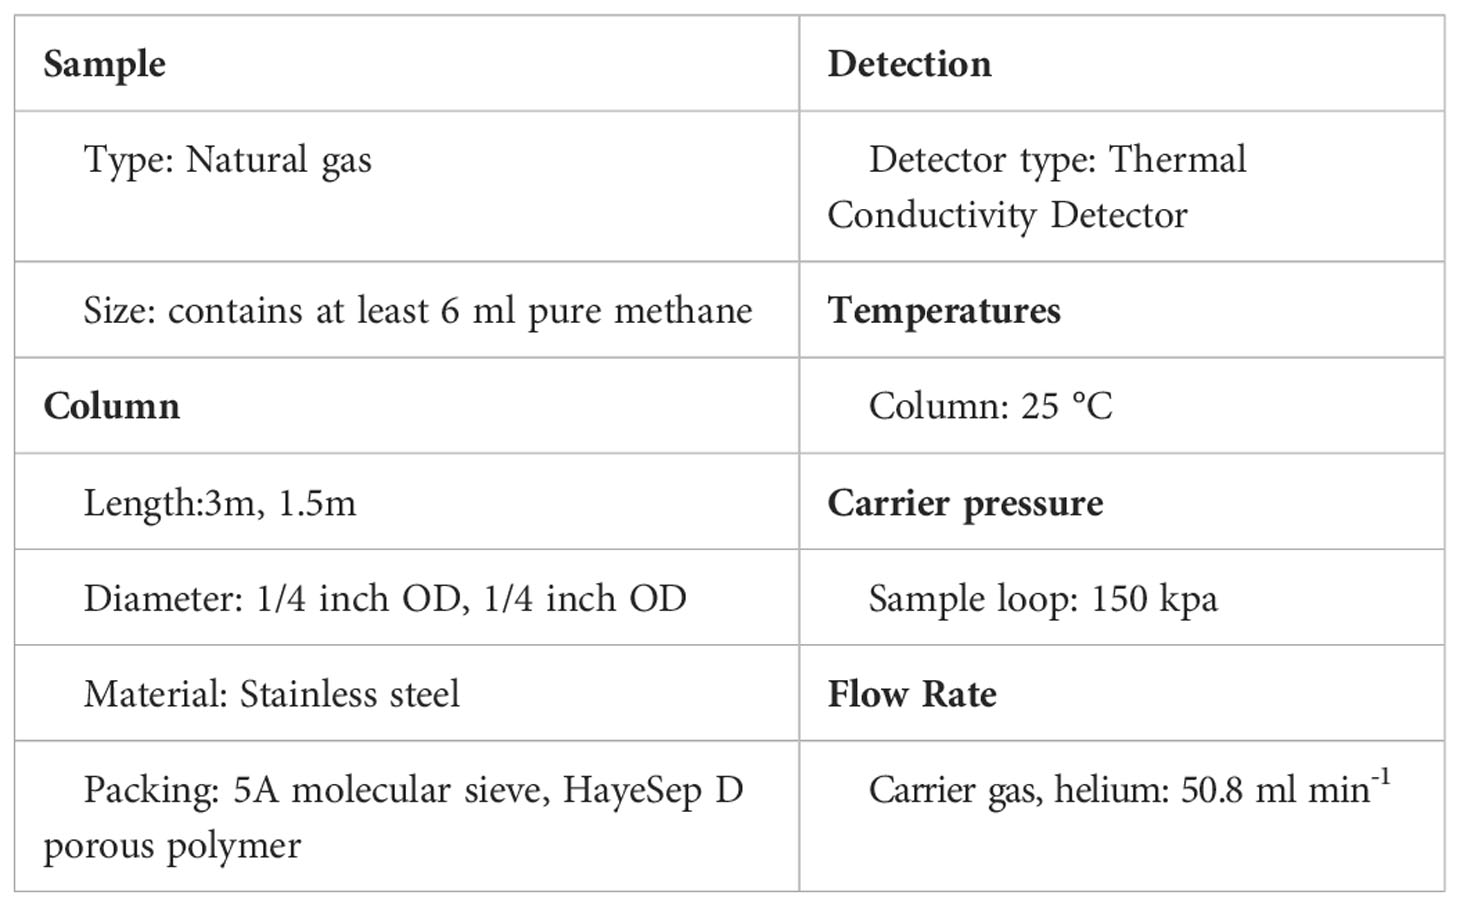
Table 1 Chromatography conditions on purification system.
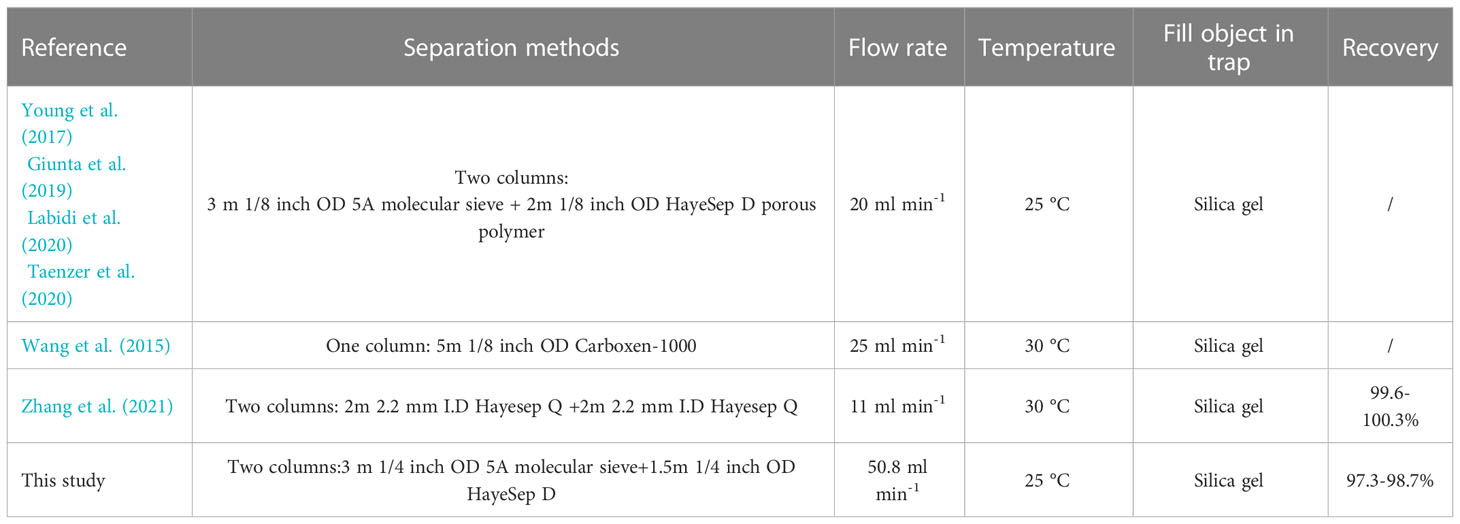
Table 2 Technique parameters of various GC-based methane purification methods.
Our purification presented here is a five-step process involving: (1) sample inlet and pressure monitor, (2) gas freezing adsorption and heating release, (3) passing to GC, (4) GC identification, and (5) pumping away impurities and methane collection. A schematic diagram of the methane purification process is shown in Figure 1. A detailed purification process is as follows. (1) Confirm the purification is performed under an optimum vacuum (<10–3 mbar) pumping by the mechanical pump and molecular pump. (2) Two injection methods are adopted here: CH4 is extracted from the aluminum-polymer gas collection bag by a gas-tight syringe and injected into the vacuum line. Or introduce it into the system by crushing the sealed gas tube. (3) An appropriate and sufficient pressure is recorded by the pressure gauge. Then, the gas sample is trapped in cold trap T1, filled with silica gel at liquid-nitrogen (LN2) temperature (77 K). Once all the components are absorbed (except H2) in the trap T1, the pressure dropped to<10–3 mbar, and V4 is closed for the next gas-releasing step. (4) The silica gel absorbent trap T1 is heated at 30°C and kept for 10 minutes by heating strips to release gas. Components in natural gas are fully released except H2O and CO2 at this step. (5) GC parameters are set up and activated. The sample gas is transported to the GC by helium carrier by opening the four-way valve A (VA) at a specific time recorded on GC. (6) When the methane is identified by GC, cold trap T2 (filled with silica gel) is immediately cooled with LN2 to collect methane with a 35 min collection time. (7) The He carrier gas is then pumped away by evacuating the vacuum to 10–3 mbar with VA and VB simultaneously closed and V4, V5, V6, V7, V8, or V9 open. Cold trap T2 is heated to 30 °C for 10 minutes to release the captured methane. (8) Methane is transferred to an evacuated sample tube filled with silica gel (immersed in LN2) through opening V5 and sealed in the tube by flame. The sample tube is then attached to the dual inlet of the Ultra for methane clumped isotope analysis. After the collection of methane, the GC is baked at 200 °C for one hour to remove other impurities (CO, C2-C5, etc.), which are retained in the columns, and the traps are also heated at 100 °C to eliminate contaminants. The background contributions of O2 and N2 are 12 µl and 36 µl on the purification line, respectively.
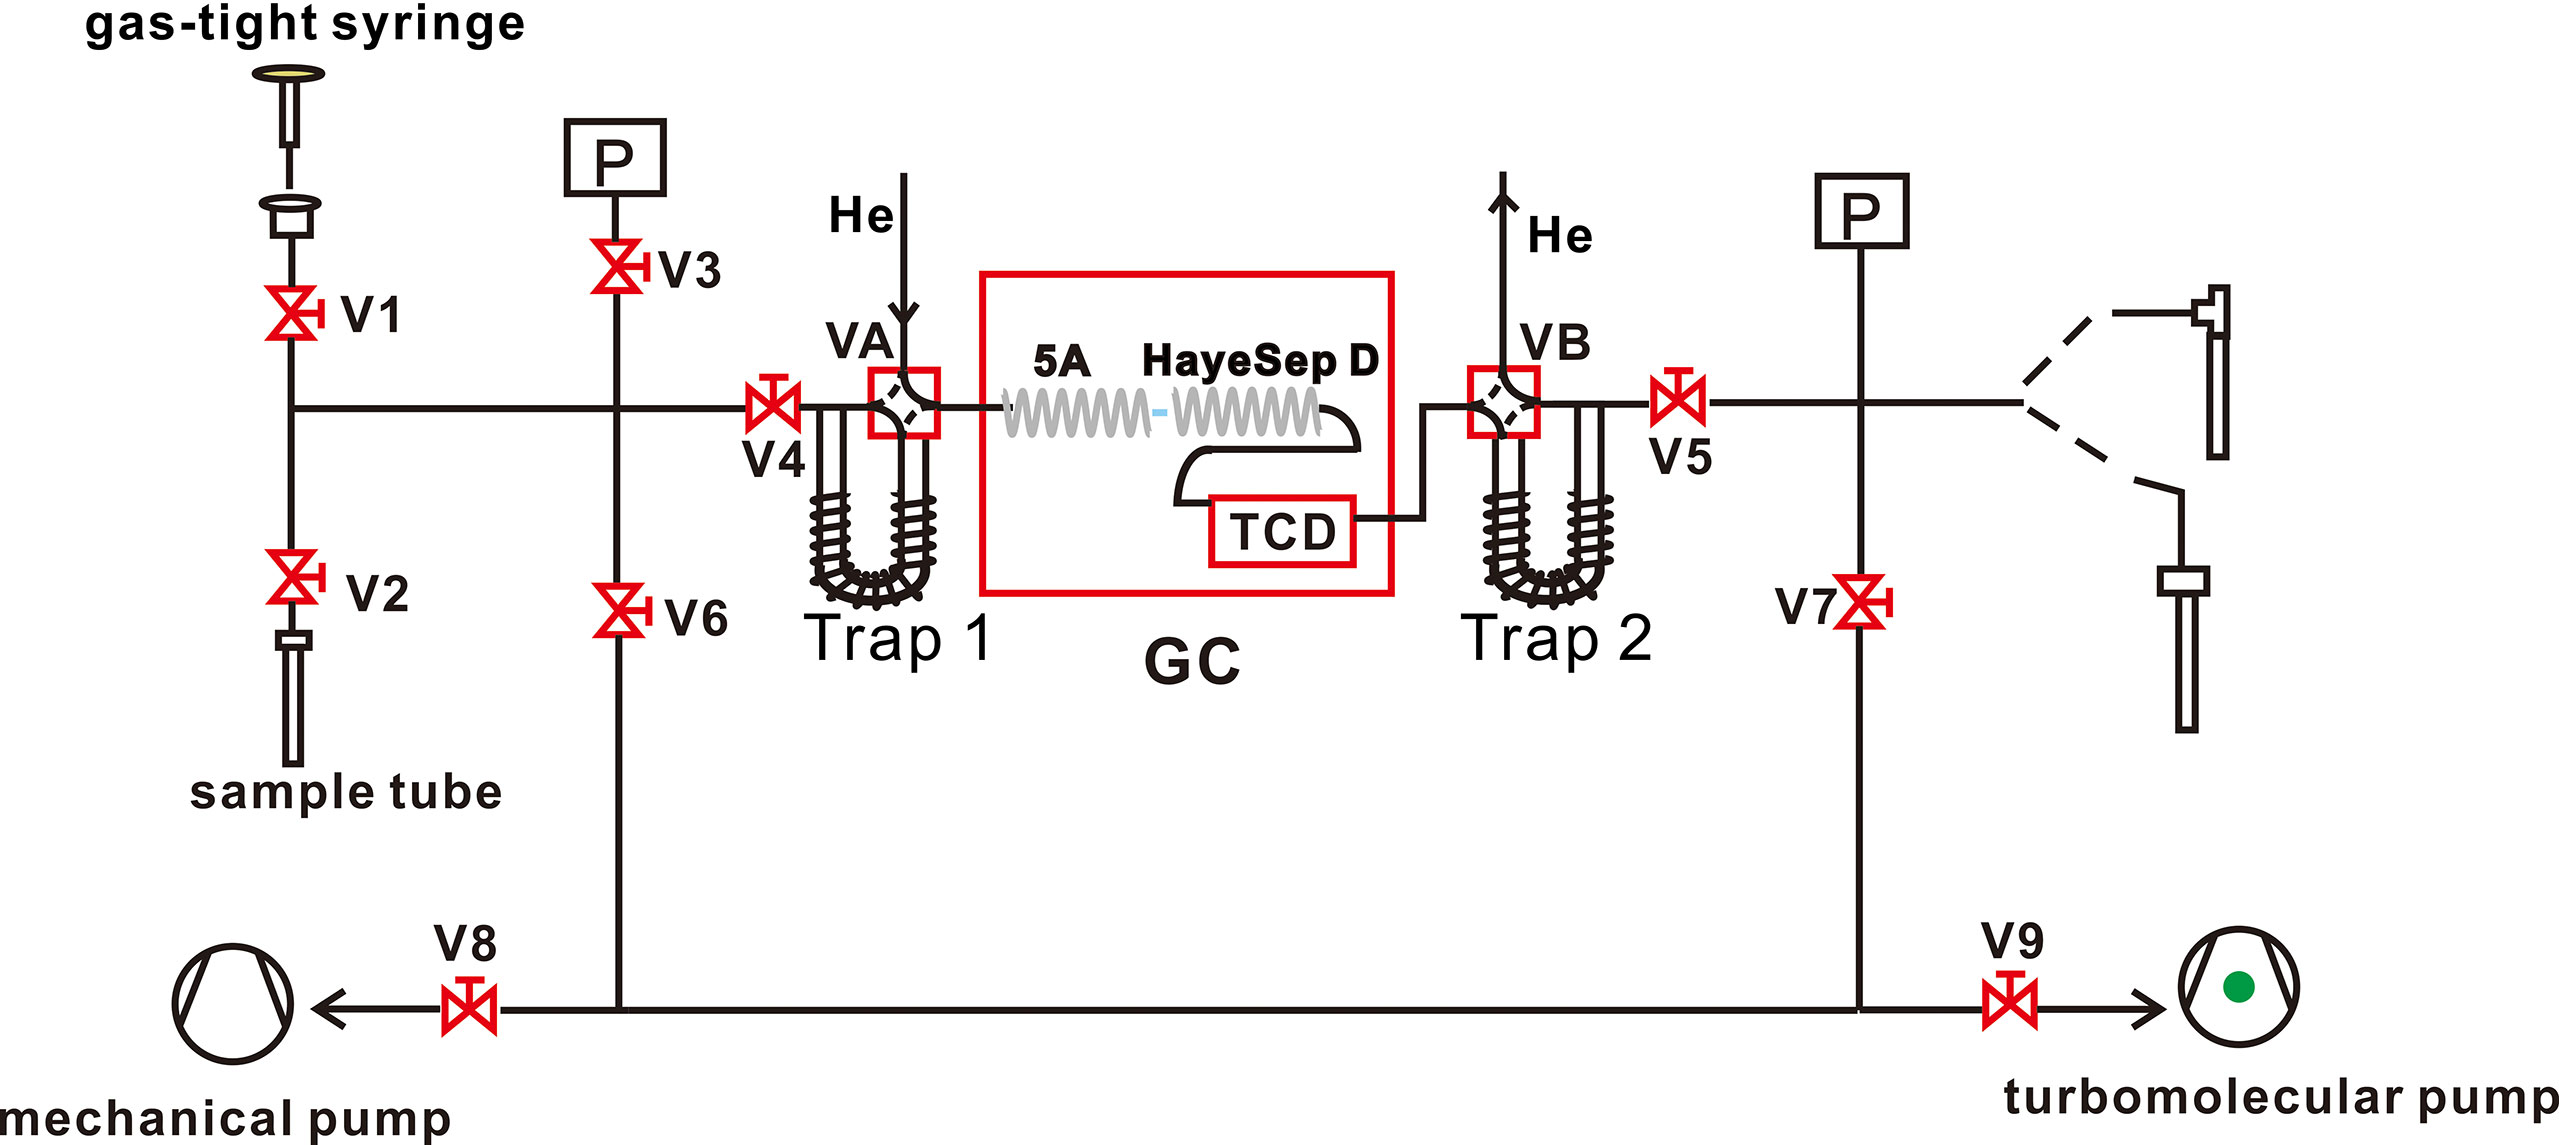
Figure 1 Schematic diagram of the purification system. The alphabet P represents pressure-vacuum gauge. The alphabet V represents valve, for example, V1 represents a two-way valve numbered 1; VA represents a four-way numbered A. The GC represents gas chromatography. The TCD represents thermal conductivity detector. The 5A represents 5A molecular sieve. The HayeSep D represents HayeSep D porous polymer. The black lines wrapped Trap represent heating strips.
2.3 Mass spectrometry
2.3.1 Measurements of conventional stable isotope compositions (δ13CVPDB and δDVSMOW)
The conventional stable isotopes (δ13CVPDB and δDVSMOW) were analyzed by a Finnigan MAT 253 instrument installed in Guangzhou Marine Geological Survey (GMGS). A Trace Ultra gas chromatography coupled to a combustion furnace (or an HTC furnace) with GC Isolink Interface was connected with the MAT 253. Samples were injected with a split ratio of 1:50 onto an HP-PLOT Q capillary column (30 m × 0.32 mm, 20.0 μm coating; J&M, USA). The GC temperature program was kept at 70°C. The separated analytes were converted into CO2 in a combustion furnace at 980 °C for δ13CVPDB isotopic analyses and were converted into H2 in an HTC furnace at 1400 °C for δDVSMOW isotopic analyses. For carbon dioxide isotope analyses, m/z 44,45,46 ions and the m/z 45/44 ratio were determined. For hydrogen isotope analyses, m/z 3,2,1 ions and the m/z 2/1 ratio were determined. The δ13CVPDB and δDVSMOW values of high-purity CO2 and H2 reference gases were determined using calibrated values for standard methane gas. The δ13CVPDB (relative to the VPDB, Vienna Pee Dee Belemnite) and δDVSMOW (relative to the VSMOW, Vienna Standard Mean Ocean Water) values were defined as the Eqs (1) and (2) as below:
2.3.2 Measurements of δ13C, δD, and Δ 13CH3D(wg)
Methane isotopologue analyses were performed using the Ultra instrument at GMGS. The instrument has a dual-inlet system which is composed of 4 variable volumes bellows (bellow A, B, C, D). All measurements have been performed relative to the “working gas” (99.999% pure methane, from Guangzhou Beiqi Gas Co., Ltd). Different from the conventional stable isotope measurements, methane is the direct testing object in clumped isotope analysis. δ13C and δD values are determined by 13/12 and 12CH3D+/12 . By definition, δ13C, δD, and δ13CH3D values can be expressed in the following formulas,
Due to the lack of sufficient heated gas data, Δ13CH3D values were reported in the working gas reference frame instead of the stochastic distribution, which is named Δ13CH3D(wg). Our reported Δ13CH3D(wg) compositions were calculated from the equations presented in Eldridge et al. (2019).
A fragment(frag), i.e. 12CH2D is included in the denominator, and thus the isotopologue ratio is expressed as 12CH3D(frag)R. F represents the fragmentation rate of removing a hydrogen or deuterium from a methane isotopologue during ionization in the mass spectrometer, and is measured as the [13CH3]/[13CH4] ratio.
Below is the specific mass spectrometry method, and our method followed those reported in Eldridge et al. (2019) and Dong et al. (2020) with some optimizations.
δ13C and δ13CH3D were determined simultaneously. Isotopic analyses were performed at a high-resolution mode with a mass-resolving power of about 27,000. The mass-16 ion beam (12 +13 +12CH2D+) was collected on an L4 Faraday cup equipped with a 3 × 10⁸ Ω amplifier, with a count rate of ~1.3 × 10¹⁰ cps/s. The mass-17 ion beam comprised 13 and was collected on the L1 Faraday cup equipped with a 1 × 10¹² Ω amplifier, with a signal intensity of ~1.3 × 10⁸ cps. The mass-18 ion beam included 13CH3D+ and was analyzed on H3 CDD employing a 1 × 10¹² Ω amplifier, with a count of ~7000 cps. The setting time was 8 s, and the integration time was 16.78 s. The peak center was set first, and the L4 cup was used for pressure adjustment. Background testing was undertaken three times for each block with the total measurement comprising 20 blocks of 8 cycles. A single measurement took 7 hours. The mass scan is shown in Figure 2A.
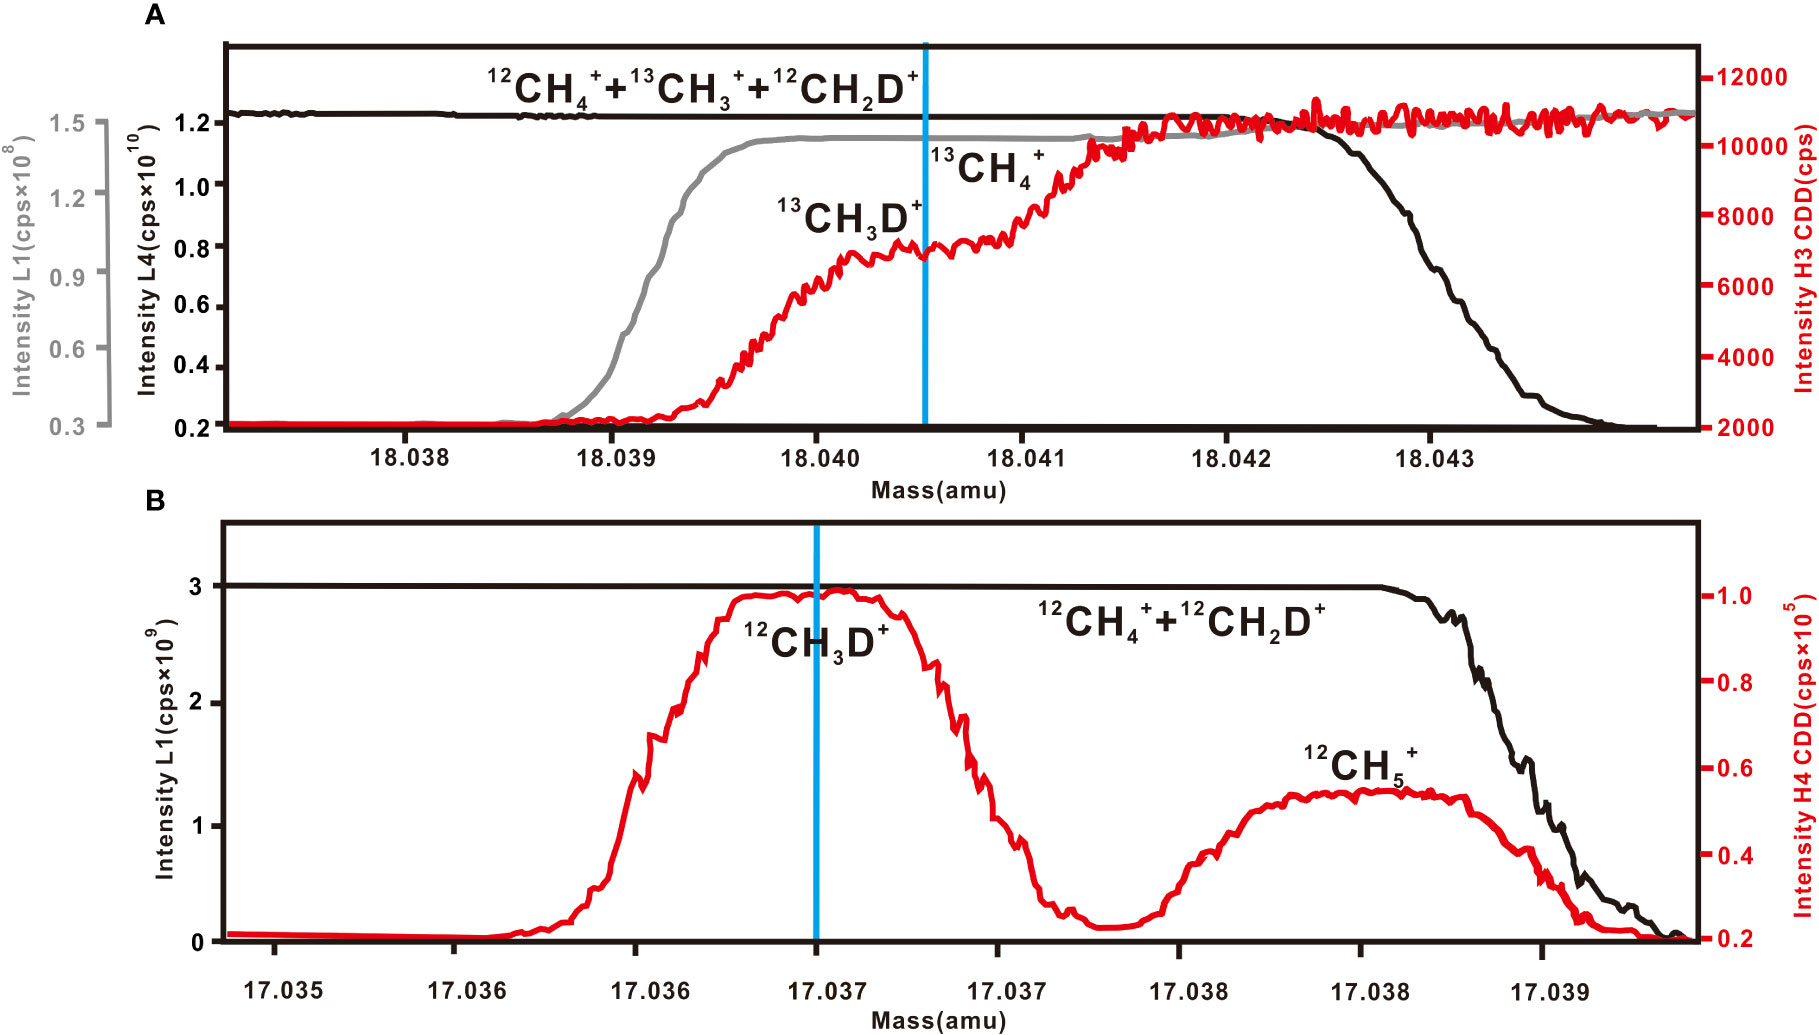
Figure 2 Mass scan for (A) 12 +13 +12CH2D+,13 , and 13CH3D+ and (B) 12 +12CH2D+ and 12CH3D+. Blue line represents the analytical position for the targeted isotopologue. (cps = counts per second).
The determination of δD was performed at medium resolution using a high-resolution aperture and a mass resolution power of 30000. The mass-16 beam consists of 12+12CH2D+ and was collected on the L1 Faraday cup equipped with a 1 × 10⁹ Ω amplifier, with an intensity of ~3 × 10⁹ cps. The mass-17 beam includes 12CH3D+ and was registered on the H4 CDD equipped with a 1 × 10¹² Ω amplifier, with a signal intensity of ~1.1 × 10⁵ cps (this cup is a high-resolution cup with a width of 40 μm, and can separate 12CH3D+ from 12). The setting time was 8 seconds with an integration time of 32.55 seconds. The L1 cup was used for pressure adjustment before the background was determined, and each block was tested three times on background values. The overall measurement included 20 blocks of 8 cycles, with analysis requiring ~9 h. The mass scan is shown in Figure 2B.
3 Results and discussion
3.1 Optimization of length and OD of GC columns by investigating on separating effect, efficiency, and recovery purity of purified methane
In analytical gas chromatography, columns diverse in length and diameter would affect the performance by separating individual components in the natural gas. Considering that the volume of methane required for clumped isotope analysis is at least 6 ml at Standard Temperature and Pressure (STP), three different packed column assemblages were examined. This examination includes: (1) A 3 m 1/8 OD 5A molecular sieve column followed by a 2 m 1/8 OD HayeSep D column (3,2,1/8 columns), (2) a 6 m 1/8 OD 5A molecular sieve column followed by a 2 m 1/8 OD HayeSep D column (6,2,1/8 columns), and (3) a 3 m 1/4 OD 5A molecular sieve column followed by a 1.5 m 1/4 OD HayeSep D column (3,1.5,1/4 columns). Firstly, an all-components mixed gas consisting of H2, O2, N2, CO2, CO, H2O, CH4, C2H6, and C3H8 was introduced into the system for chromatographic analysis. In the view of chromatographic data, the peak of H2, O2, and N2 appeared before CH4 while CO and C2-C5 appeared after CH4 (see Figure 3). In addition, H2O and CO2 were removed before entering GC. Besides, CO2 did not show a chromatographic peak as being absorbed in 5A molecular sieve column. This means that CH4-neighbored O2 and N2 greatly affect the methane purification result. Subsequently, a methane/air mixture (90%/10%) was introduced into the purification system to examine the separated effect of the three columns. The comparison unfolded in the following aspects:(1) The symmetry of chromatographic peaks. The flow rate tested by flow meter was 18.5 ml min–1 on 3,2,1/8 columns and 6,2,1/8 columns under 25 °C oven temperature and 250 kPa carrier gas pressure. The enlarged diameter improved the capacity of the gas. As for the 3,1.5,1/4 columns, the expansion of diameter increased the flow rate to 50.8 ml min–1 under a temperature condition of 25 °C and carrier pressure of 150 kpa. As seen from the chromatographic data, the resultant peak shapes were asymmetrical under 3,2,1/8 columns and 6,2,1/8 columns (see Figure 4). The chromatography of the methane peak rose quickly, which made it difficult for technicians to quickly respond and collect. In contrast, 3,1.5,1/4 columns presented symmetrical peak shapes. (2) The separation degree of N2 and CH4. N2 and CH4 were well separated by 6,2,1/8 columns and 3,1.5,1/4 columns with a separation degree greater than 1.7 and 2.1, respectively. Conversely, a decreased separation degree of 1.1 was performed under 3,2,1/8 columns. Especially, when separating low-content CH4 samples (50% methane/50% air) by 3,2,1/8 columns, N2 presents severe peak tailing on CH4 which causes unfeasible collection (see Figure 5). (3) Efficiency. Efficiency is one of the important aspects of chromatography purification performance. The longer the column, the greater the analytical time required. In experiments, the collection begins as soon as the methane signal is detected by the TCD detector. The collection ends as the peak area of methane does not increase. As can be seen from the chromatogram, the methane peak appeared at 21 minutes, 50 minutes, and 31.5 minutes under 3,2,1/8 columns, 6,2,1/8 columns, and 3,1.5,1/4 columns (Figure 4), with a collection time of 30 minutes, 45 minutes and 35 minutes, respectively (Figure 6). Once the collection is completed, the components (CO, C2-C5) remaining in the column need to be removed by baking. Judging by the retention time of C2H6 (170 min) and C3H8 (> 240 min), the baking time is supposed to be set over two hours under 6,2,1/8 columns (see Figure 7). Comparatively, the baking time was greatly shortened under 3,1.5,1/4 columns, see Figure 3. Note: GC can be direct heat up to 200 °C for baking after collecting the methane, while GC was slowly heated up in this study (to distinguish the individual components). (4) Recovery and purity of purified methane. After a single purification, methane detected by the TCD was frozen in the cold trap T2; however, it was then released and re-absorbed in cold trap T1 for the following GC verification of recovery and purity instead of collecting immediately. Detailed data are shown in Table 3. The area normalization method (area ratio of each component to the total component) was used to calculate methane purity. The relative correction factors (by volume) for O2, N2, and CH4 are 2.50, 2.38, and 2.80, respectively (The data are from Sparkman et al. (1997)). The recovery was defined using the ratio of methane peak areas of purified methane to initial gas. The experiment results showed that similar recoveries were obtained after a single purification under 3,2,1/8 columns (98.1-98.8%) and 3,1.5,1/4 columns (98.2-98.7%) which were slightly higher than 97.4-98.1% recovery under 6,2,1/8 columns. Furthermore, the separation results toward the purity of purified methane vary with chromatographic columns. Three parallel purifications under 3,1.5,1/4 columns presented 98.5%-98.6% purity, which was slightly better than 97.7-97.9% on 6,2,1/8 columns and 97.0-97.5% on 3,2,1/8 columns. In summary, a 3 m 1/4 OD 5A molecular sieve column followed by a 1.5 m 1/4 OD HayeSep D column (3,1.5,1/4 columns) achieved better performance on the separation effect, efficiency, and purity of collected methane.
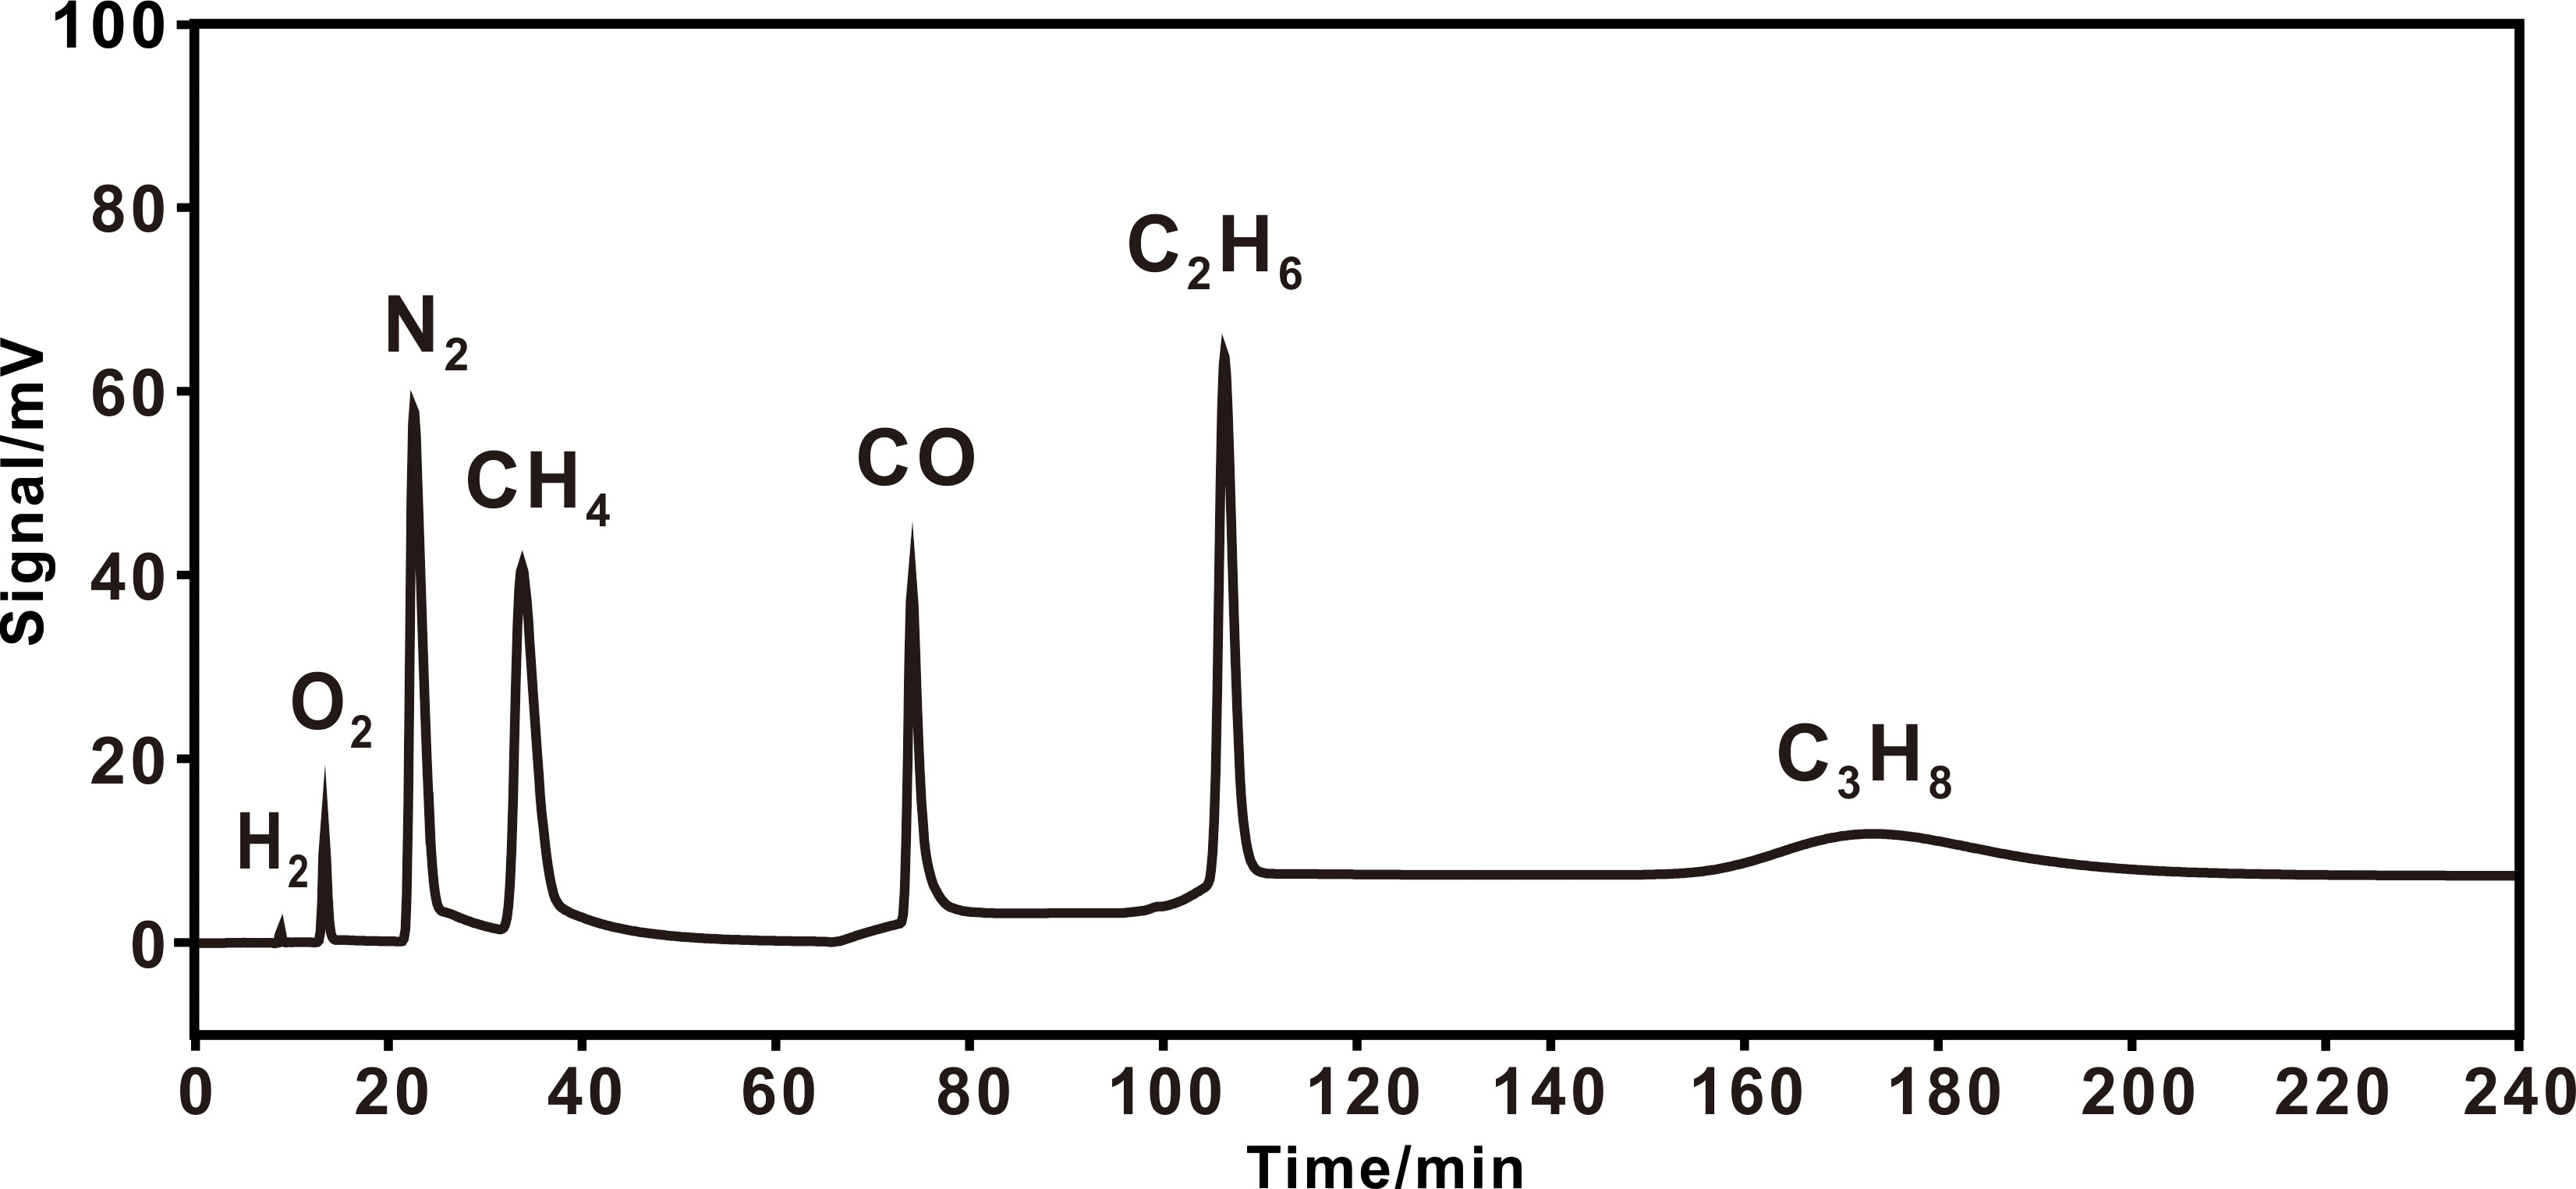
Figure 3 Typical chromatogram of a natural gas under 3,1.5,1/4 columns. A heating procedure was adopted with an initial temperature of 25 °C (65 min), heating at 10 °C min–1 to 120 °C (20 min), then to 200 °C.
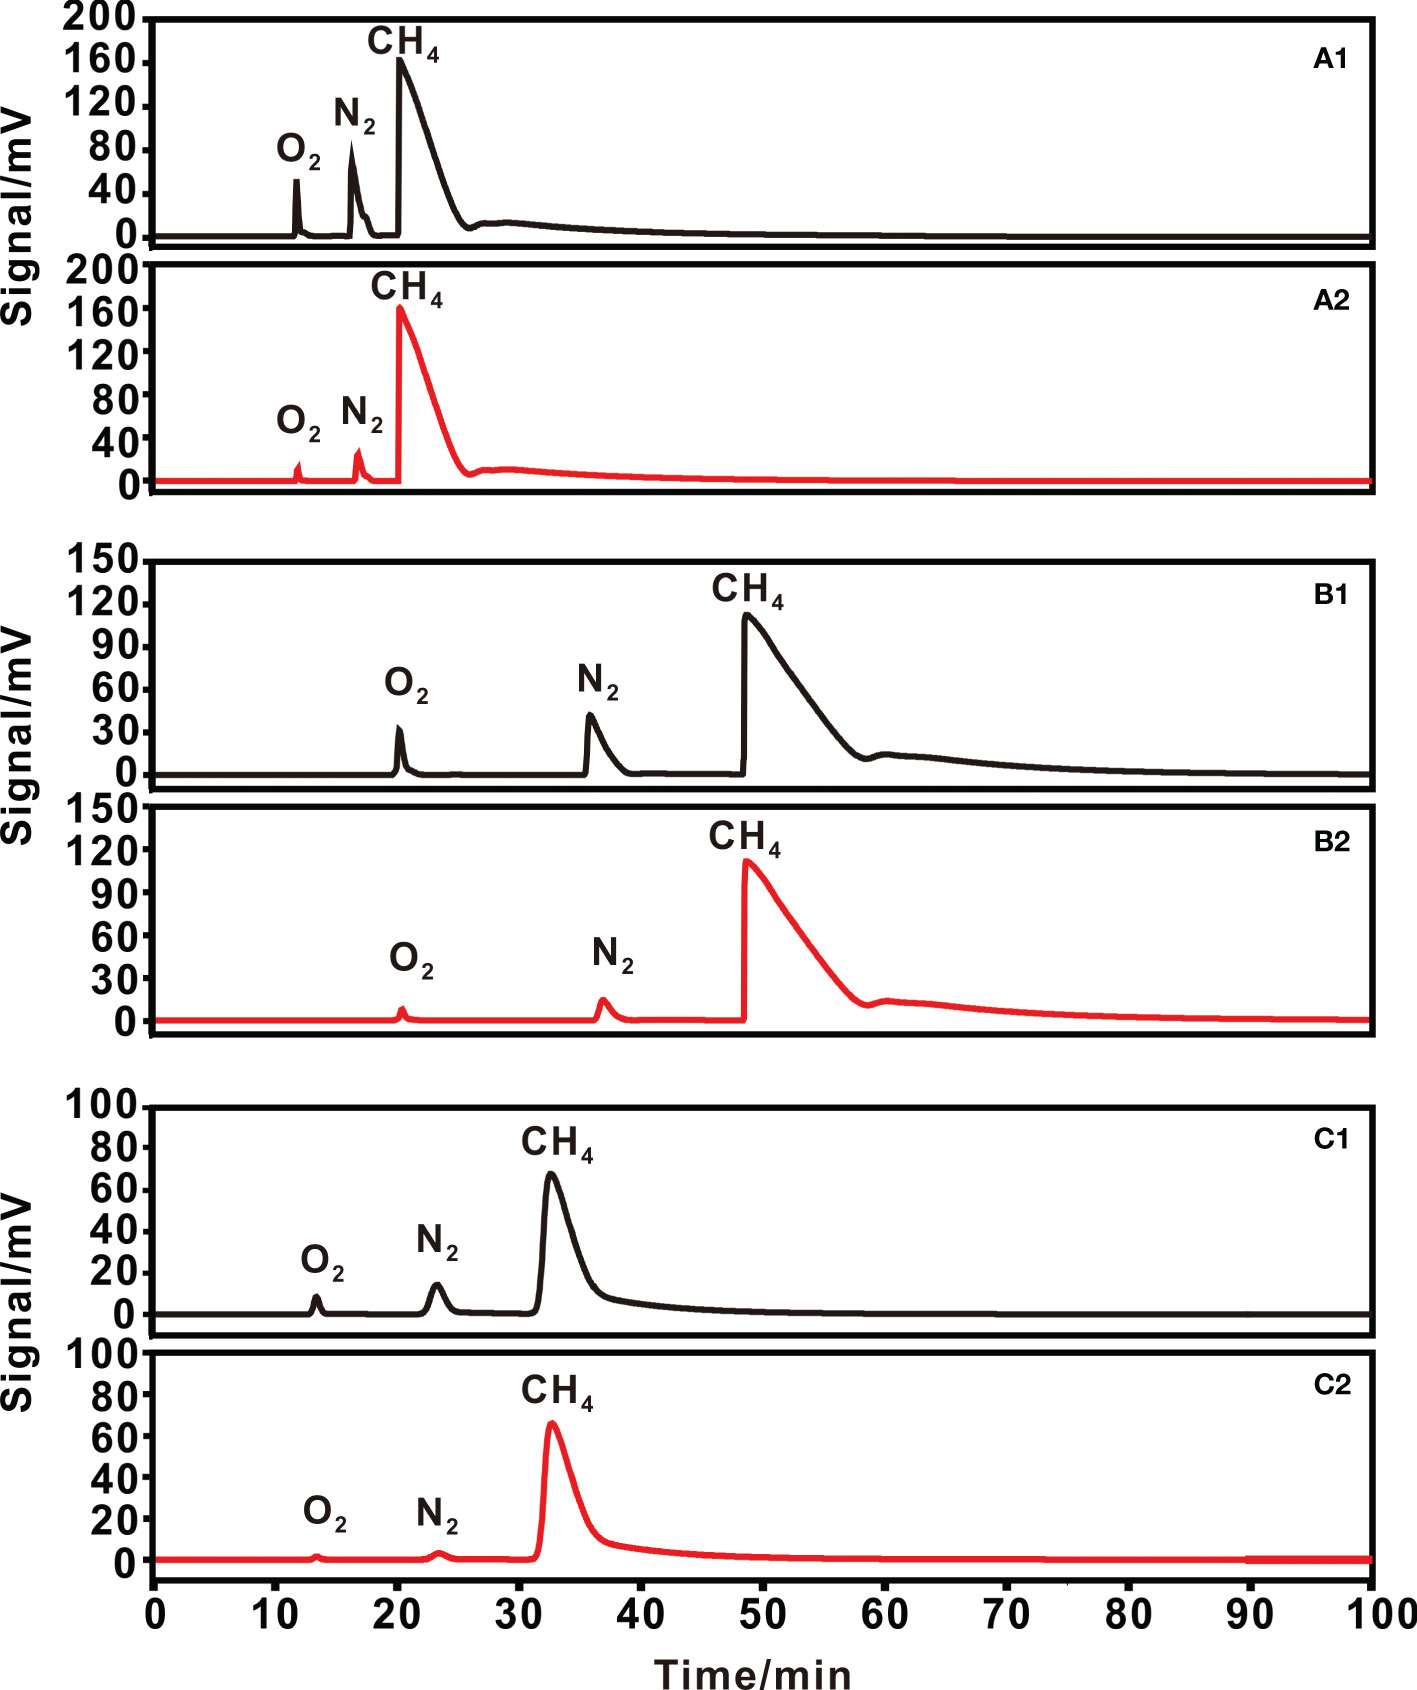
Figure 4 Chromatograms of 90% methane +10% air, for (1) initial gas and (2) purified gas on (A) 3,2,1/8 columns; (B) 6,2,1/8 columns and (C) 3,1.5,1/4 columns.
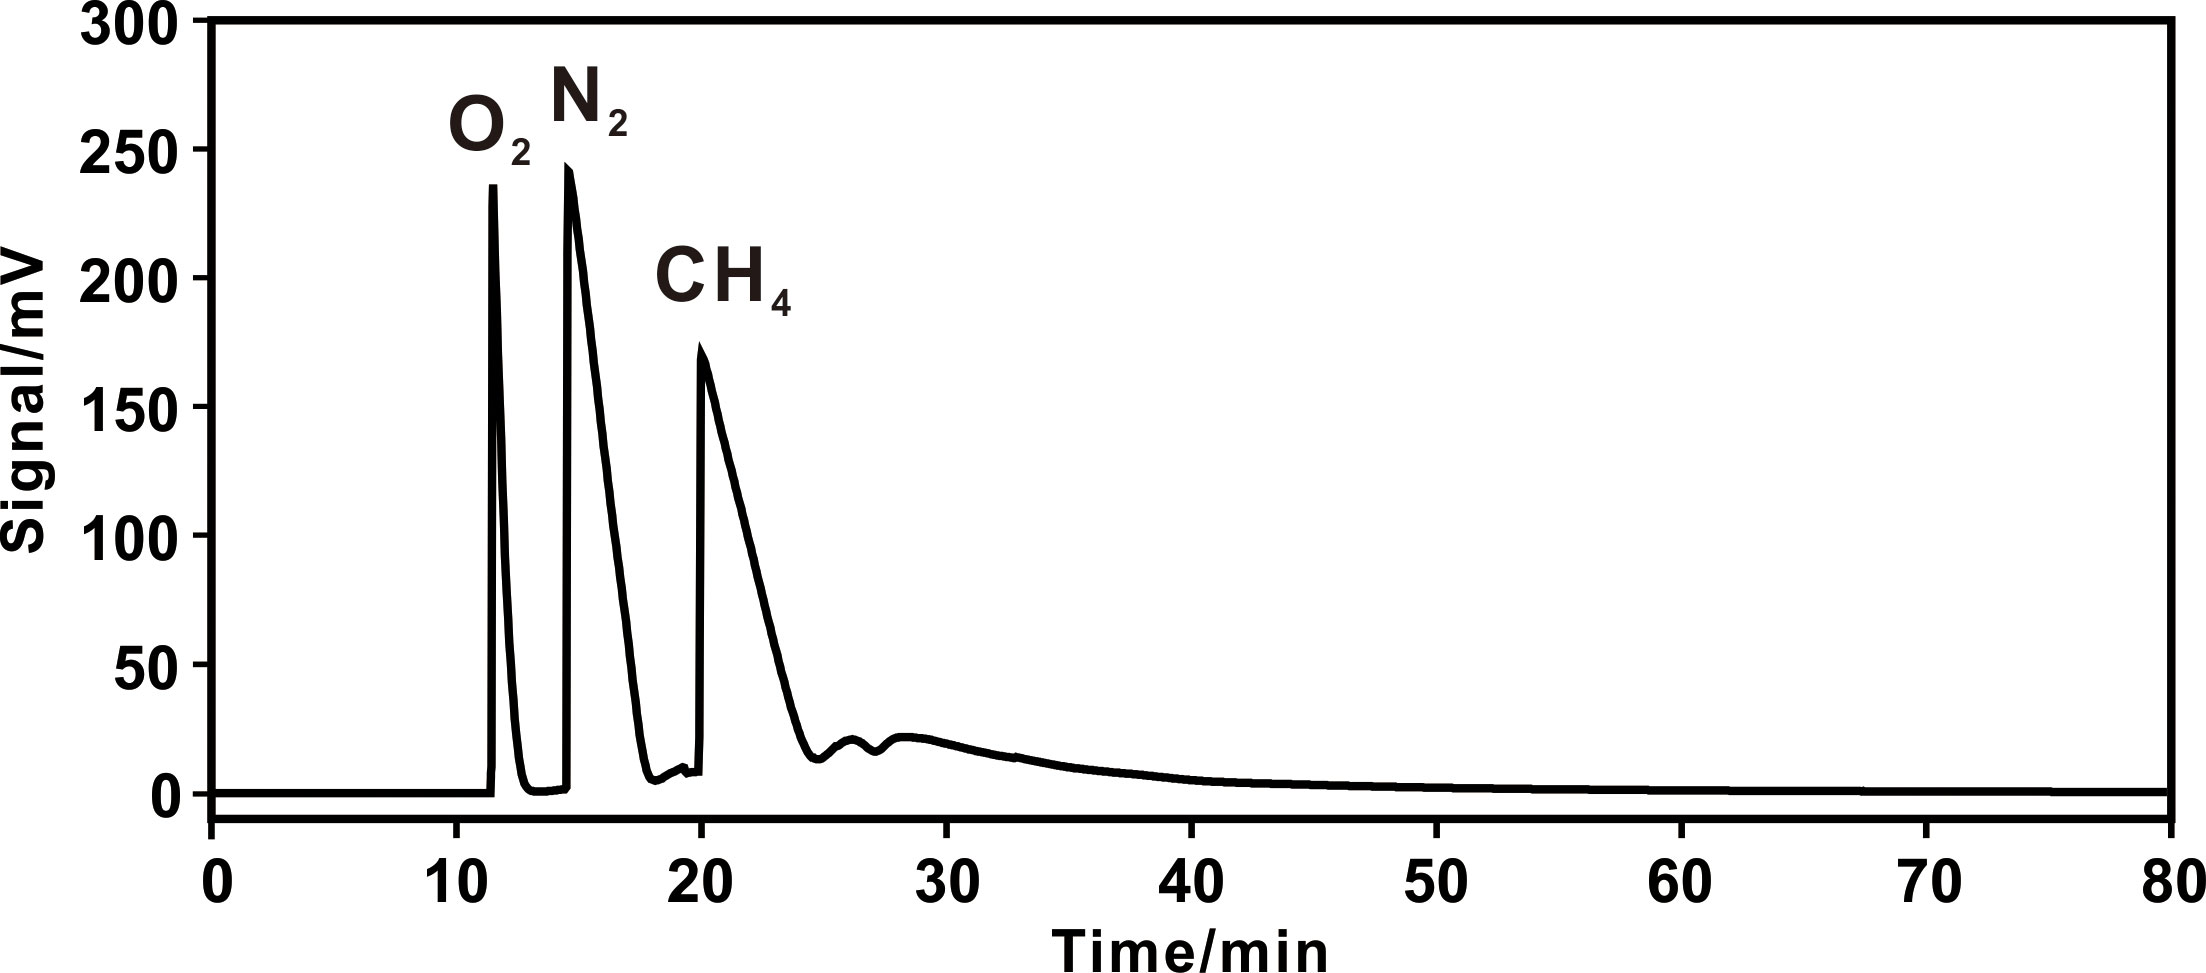
Figure 5 Chromatogram of 50% methane+50% air on 3,2,1/8 columns. A constant temperature procedure of 25 °C was adopted.
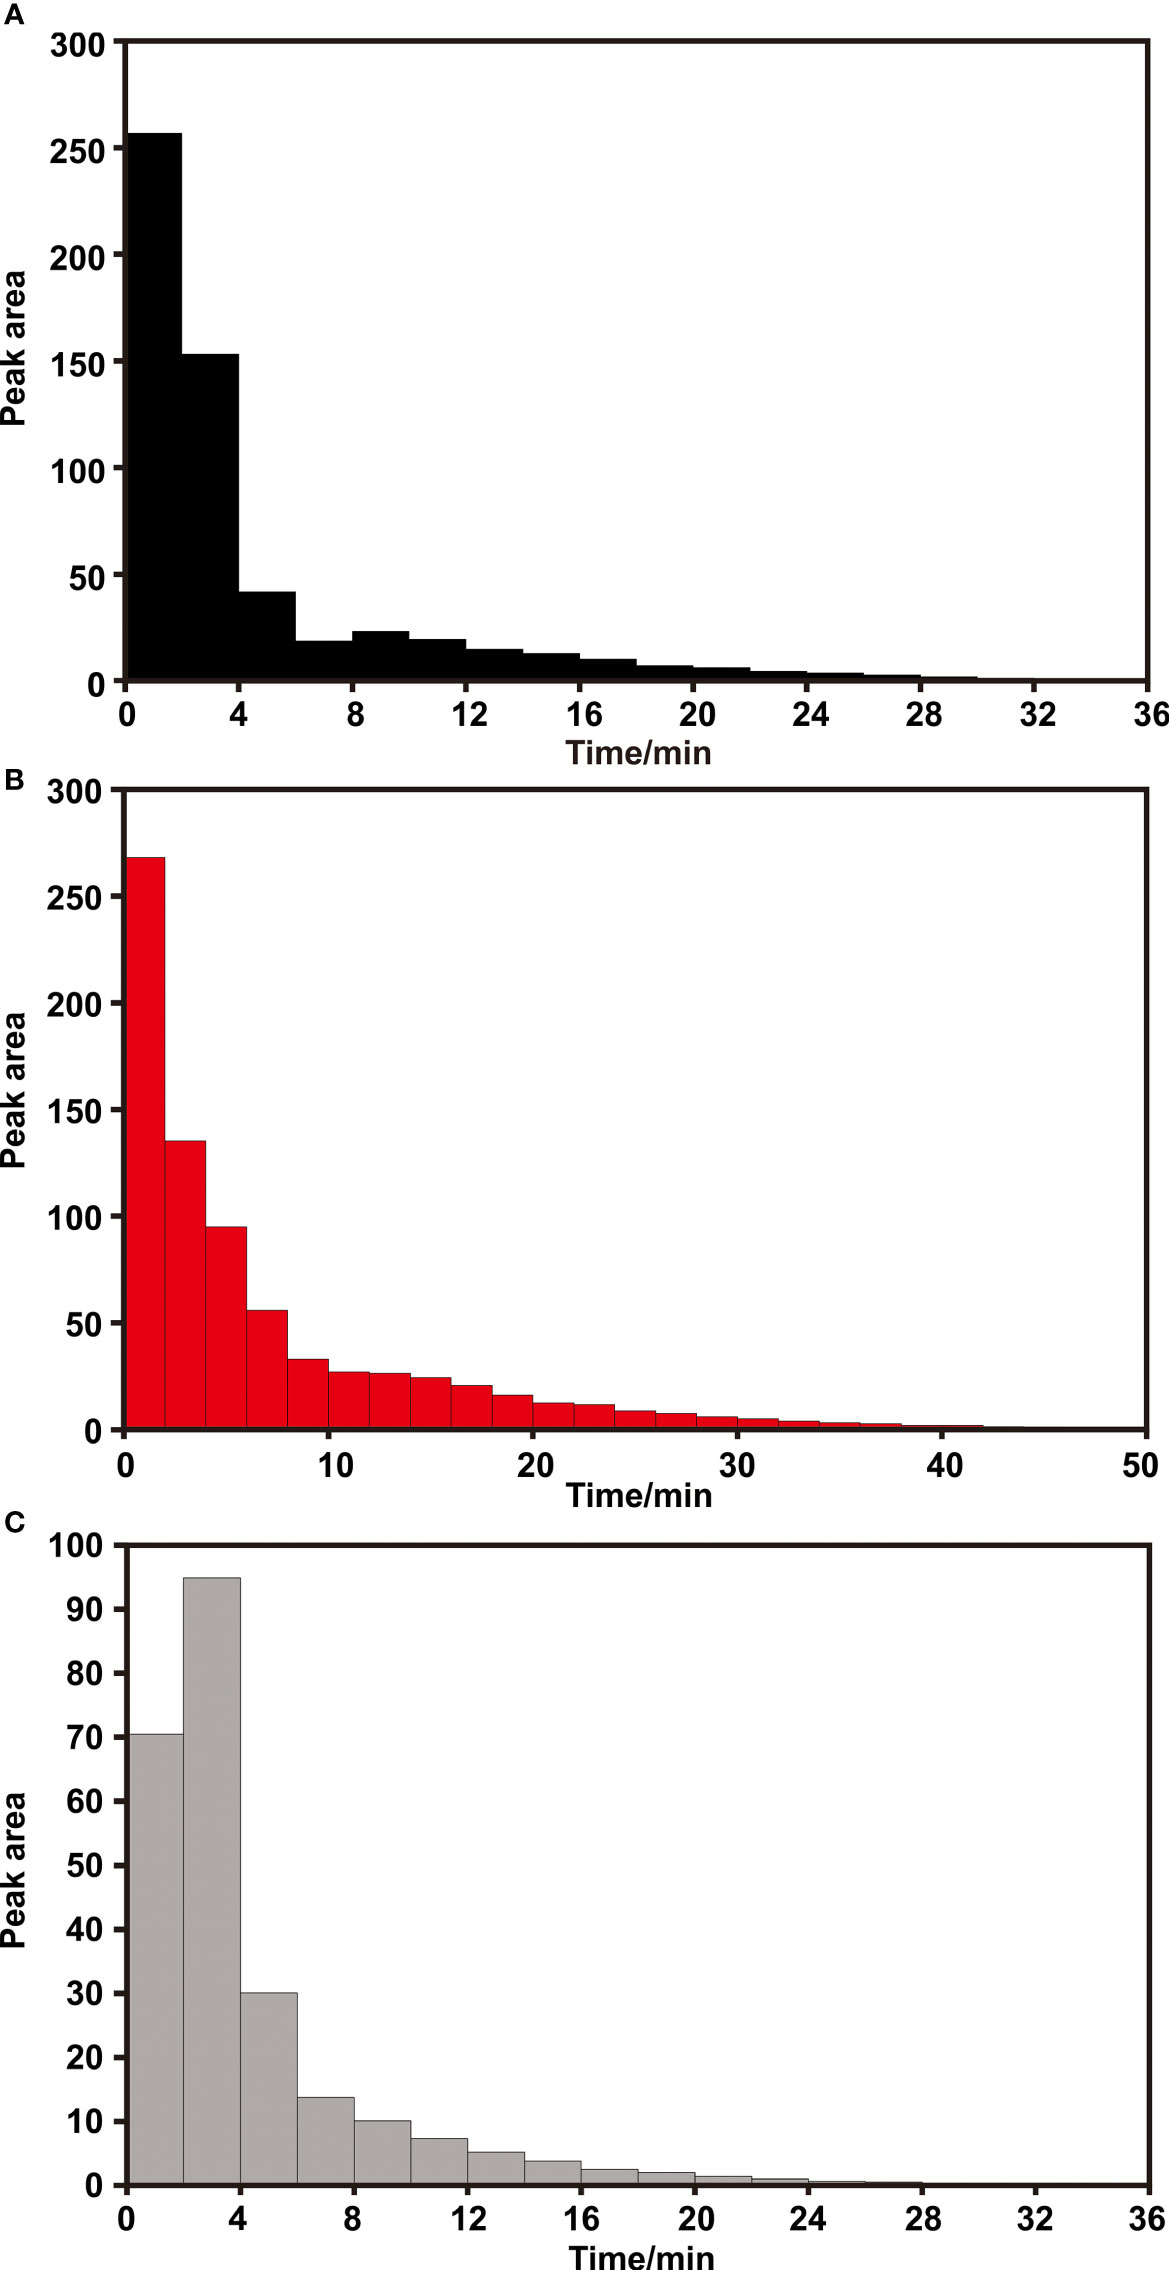
Figure 6 The peak area of methane per 2 min since methane signal appears under (A) 3,2,1/8 columns; (B) 6,2,1/8 columns and (C) 3,1.5,1/4 columns.
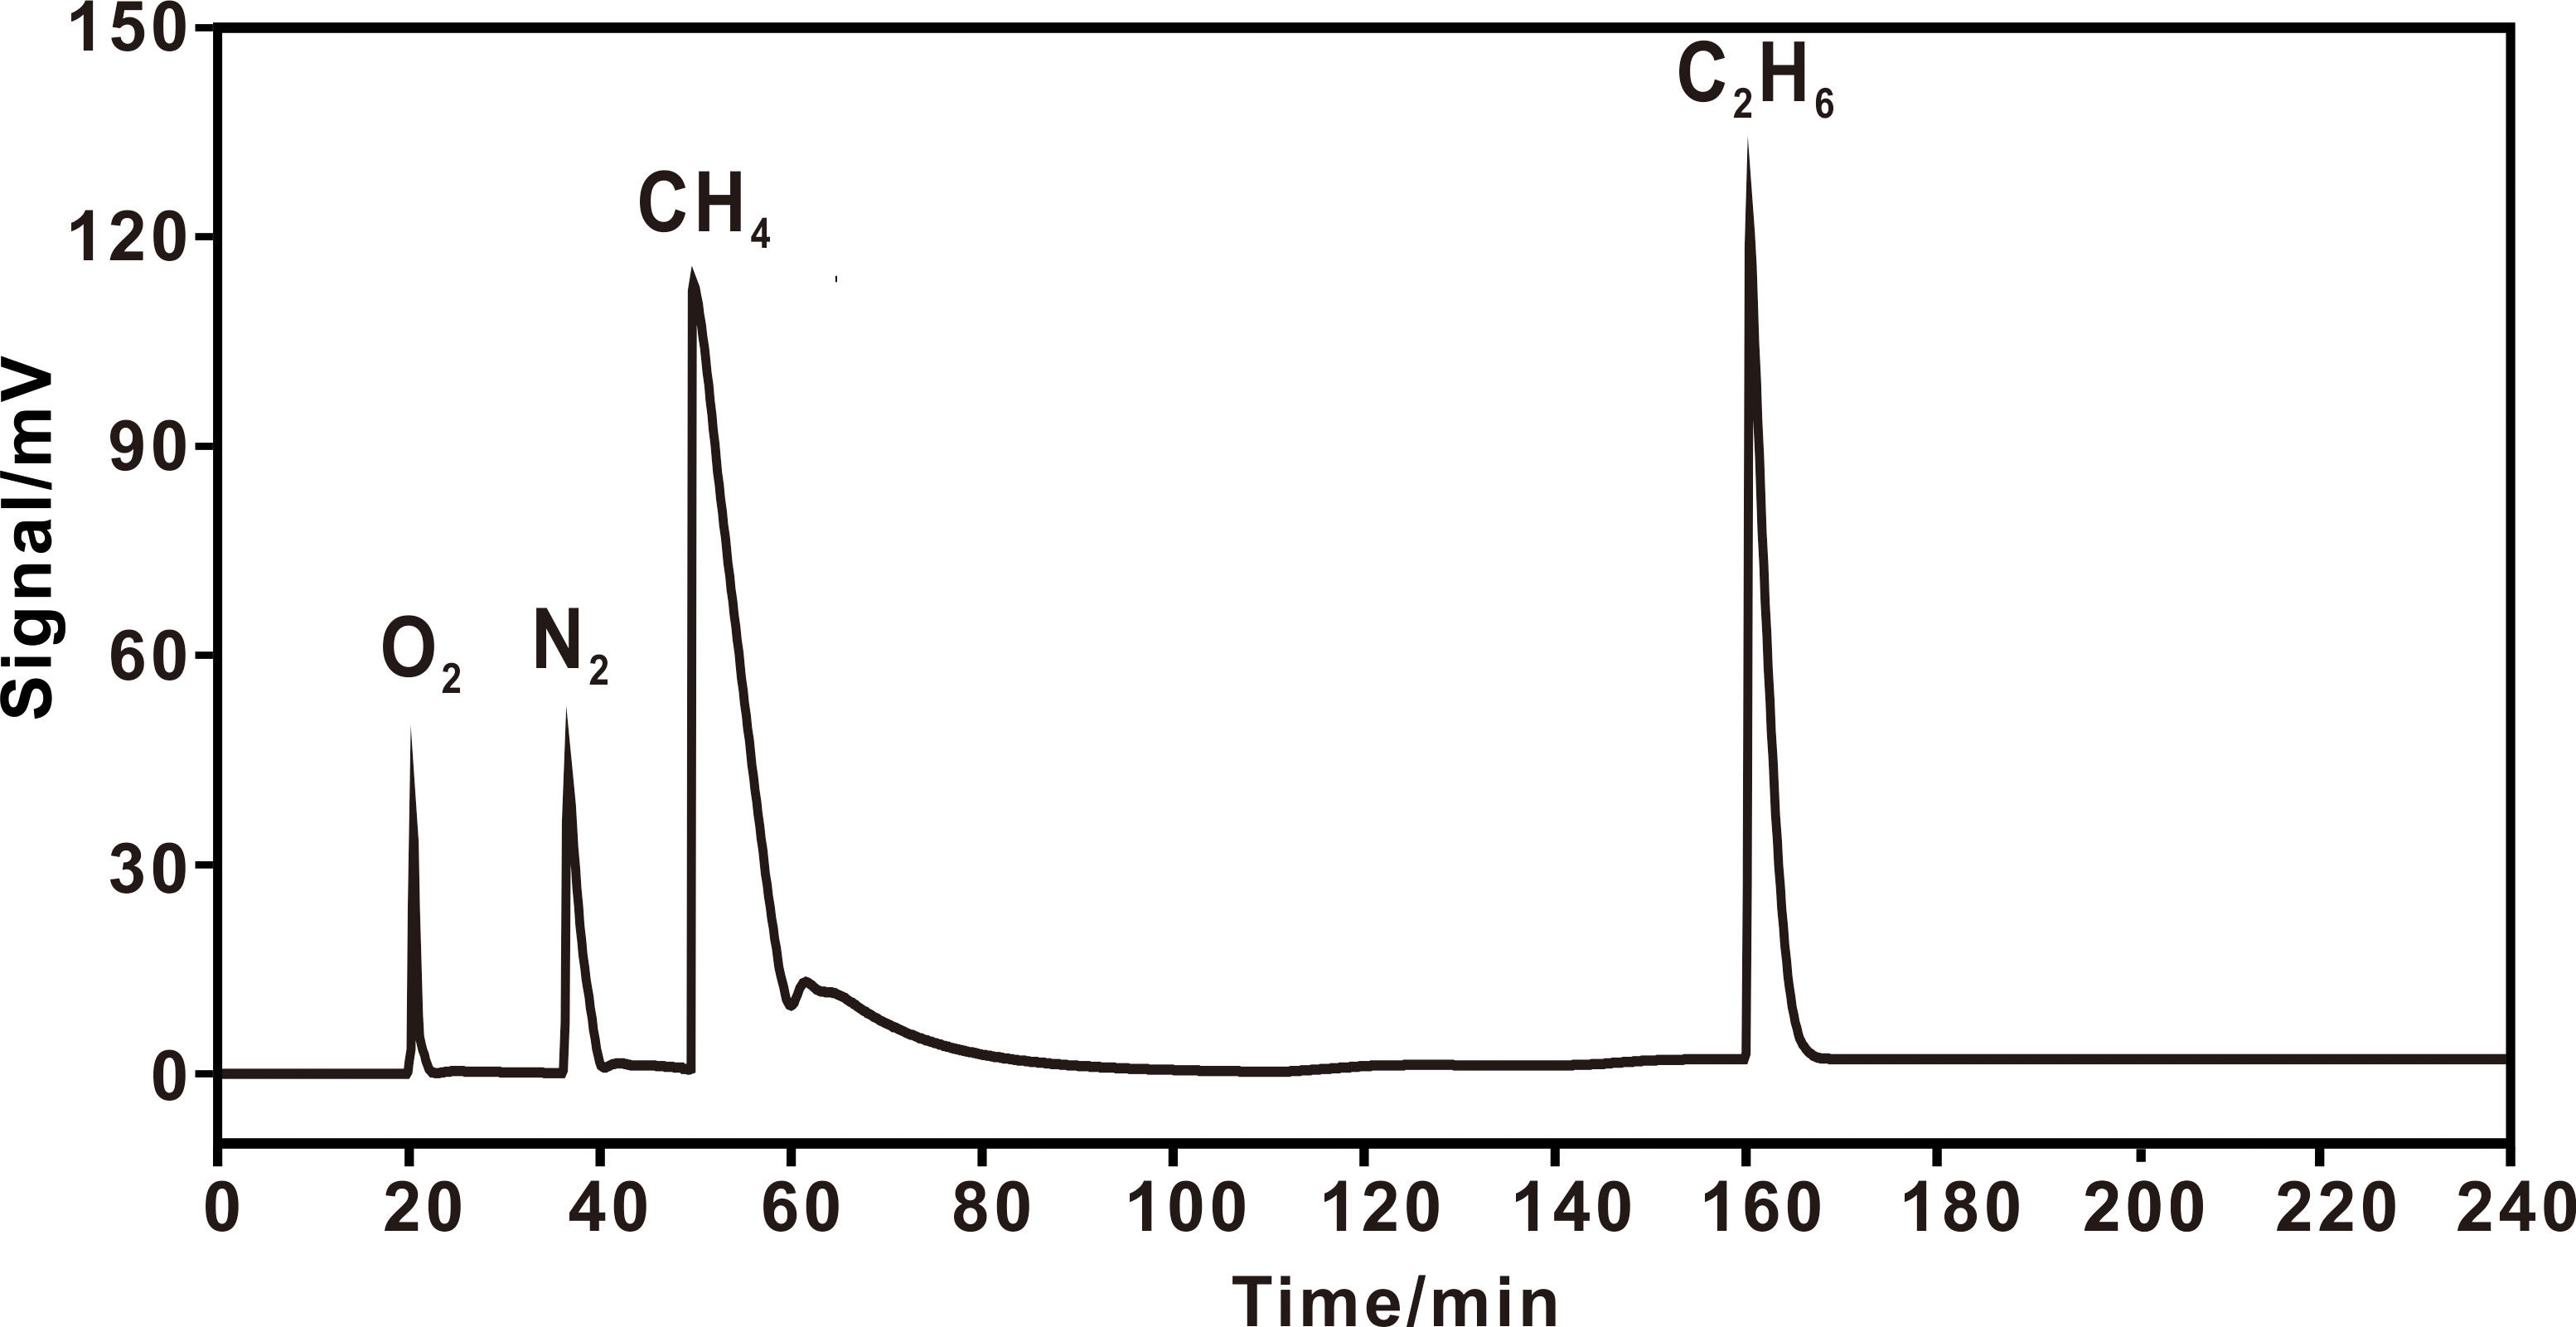
Figure 7 Chromatograms of air + C1–C3 hydrocarbons on 6,2,1/8 columns. A heating procedure was adopted with an initial temperature of 25 °C (110 min), and heating at 10 °C min–1 to 120 °C (20 min), then to 200 °C. C3H8 didn’t appear within 240 min.
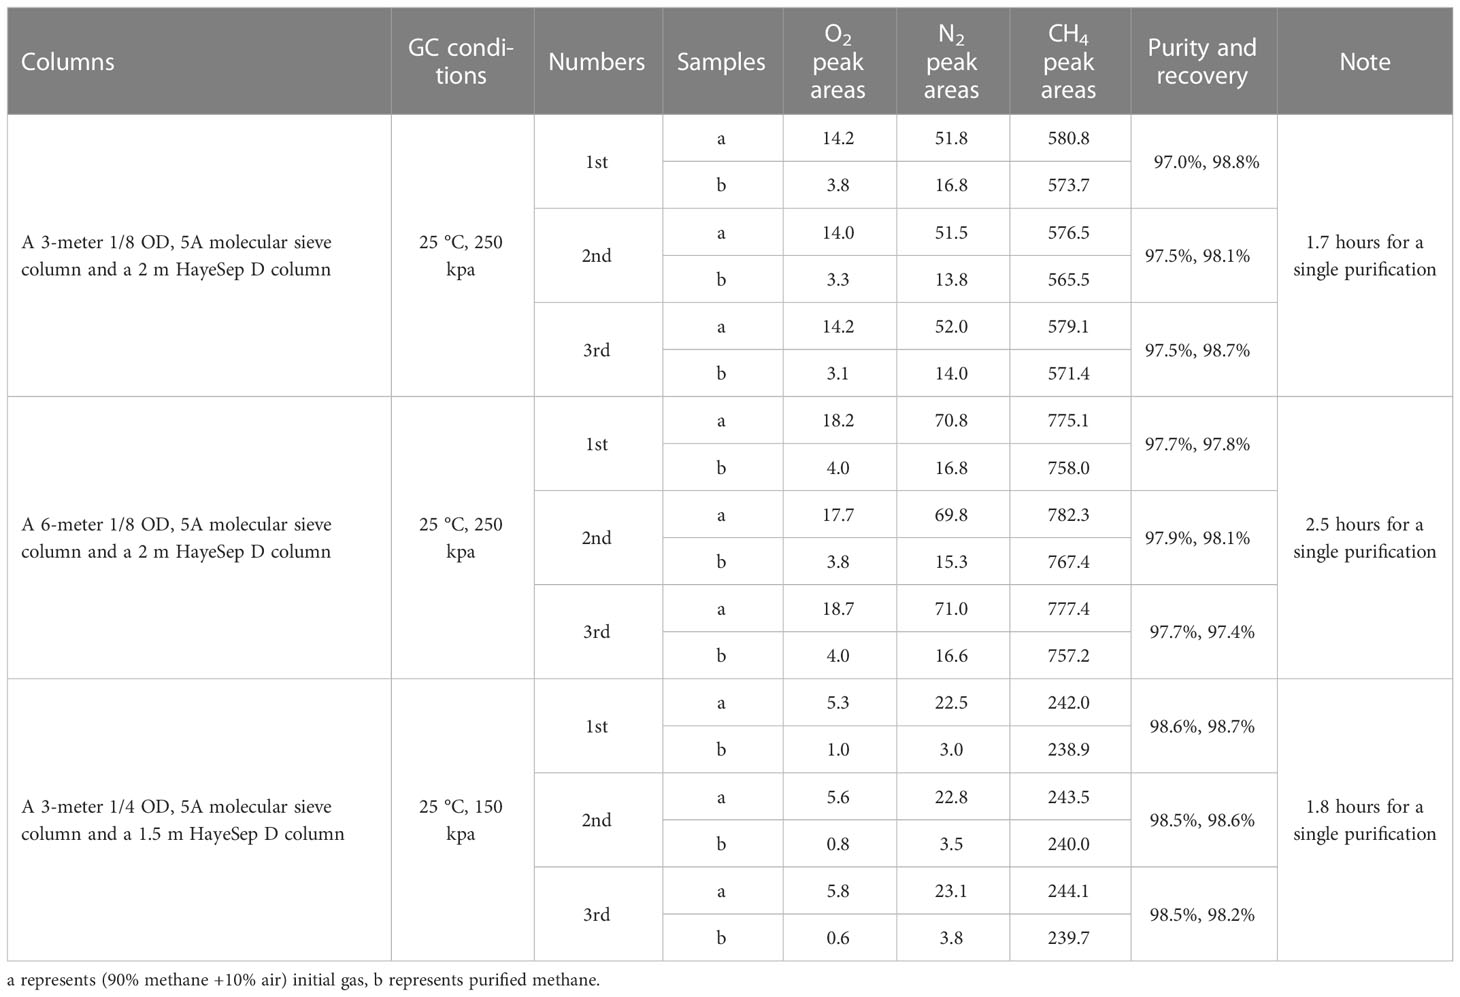
Table 3 Comparison of purification results with different GC columns.
3.2 The optimization of oven temperature and carrier gas pressure on GC for separation of N2 and CH4
Based on preliminary experiments, oven temperature and carrier gas pressure were further adjusted to optimize the separation degree of CH4 and N2. Purification experiments were undertaken with methane/air (90%/10%) mixtures under four different GC parameters as follows:(1) Oven temperature and carrier gas pressure were set at 25 °C and 150 kPa with a flow rate of 50.8 ml min–1. (2) 25 °C oven temperature and 200 kPa carrier gas pressure with a flow rate of 76.0 ml min–1. (3) 30 °C oven temperature and 150 kPa carrier gas pressure with a flow rate of 50.0 ml min–1. (4) 30 °C oven temperature and 200 kPa carrier gas pressure with a flow rate of 74.8 ml min–1 (Figure 8). Three parallel experiments were conducted under each group of temperature and pressure parameters with good reproducibility. All the results are shown in Table 4.
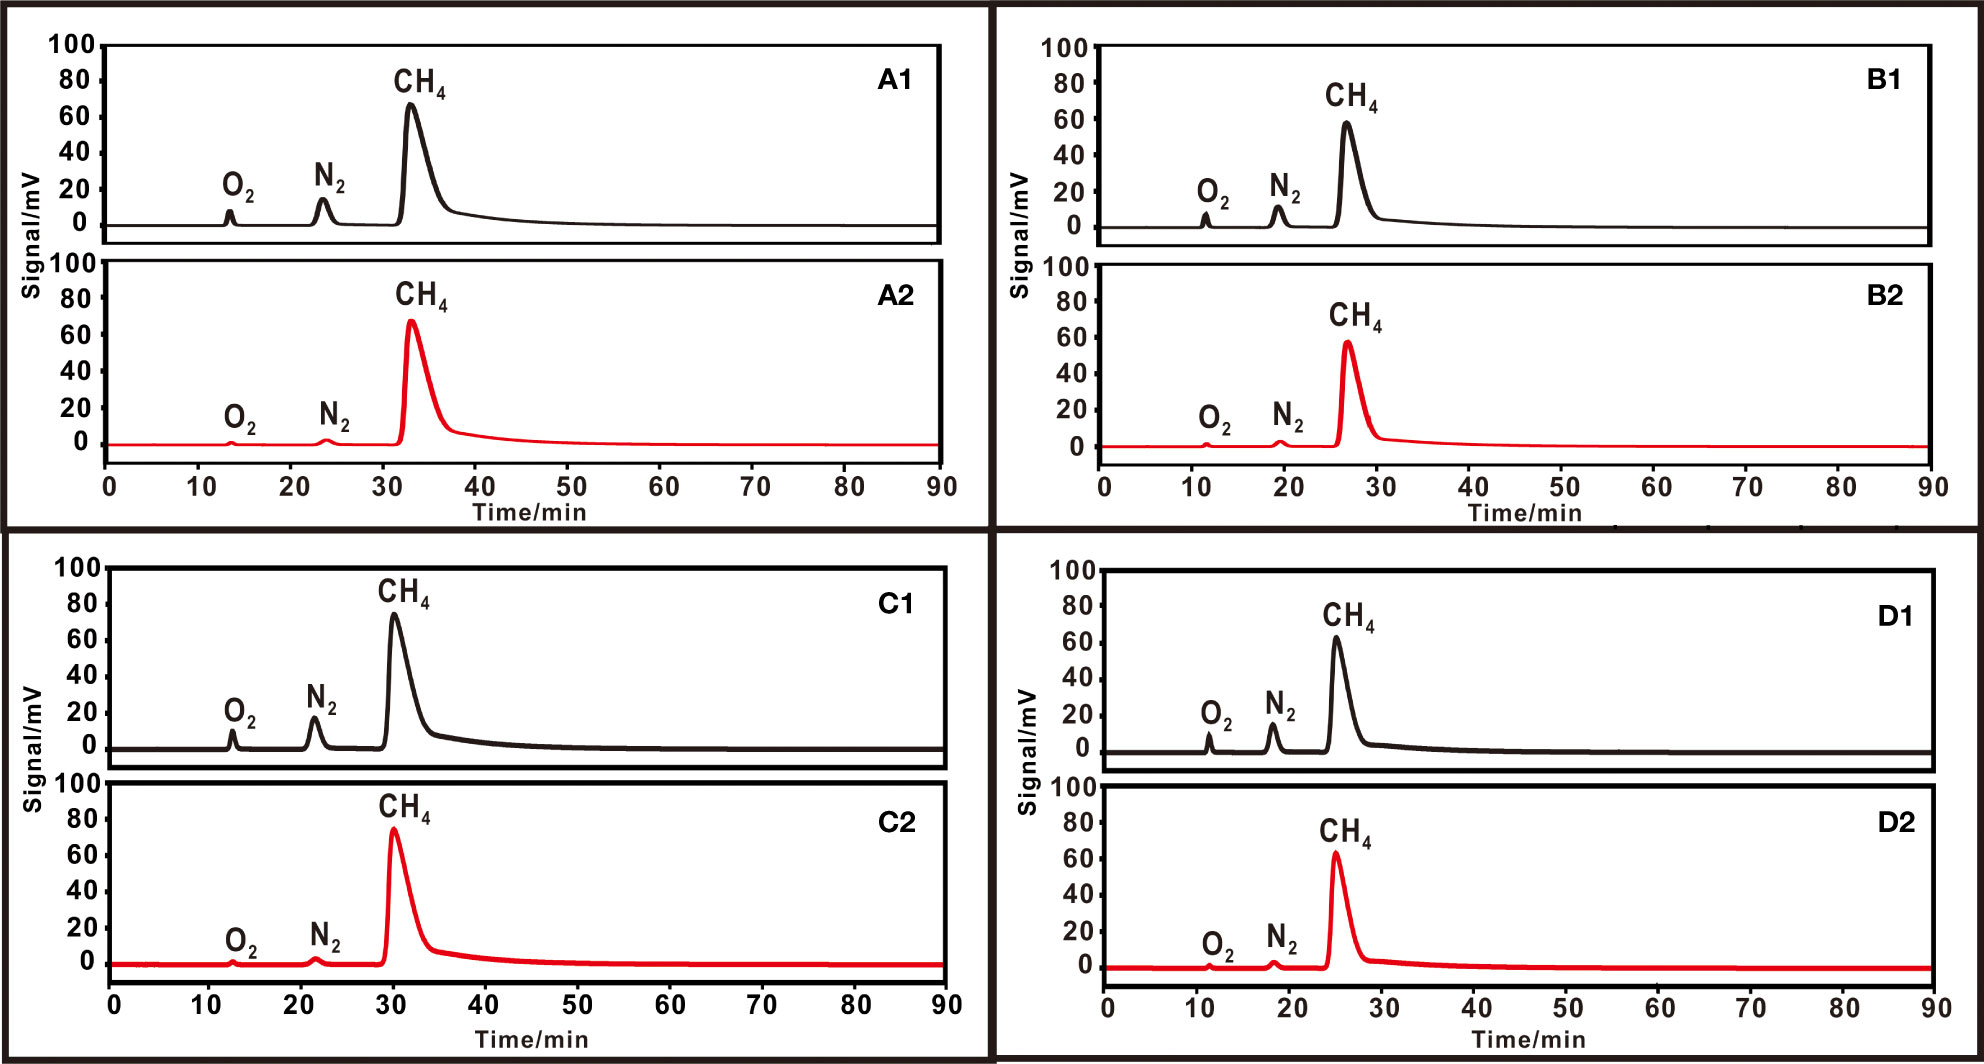
Figure 8 Chromatograms of 90% methane +10% air under different chromatography conditions. (A) Oven temperature 25 °C, carrier pressure 150 kPa, and flow rate 50.8 ml min–1 for (1) initial gas and (2) purified gas. (B) Oven temperature 25 °C, carrier pressure 200 kPa, and flow rate 76.0 ml min–1. (C) Oven temperature 30 °C, carrier pressure 150 kPa, and flow rate 50.0 ml min–1. (D) Oven temperature 30 °C, carrier pressure 200 kPa, and flow rate 74.8 ml min–1.
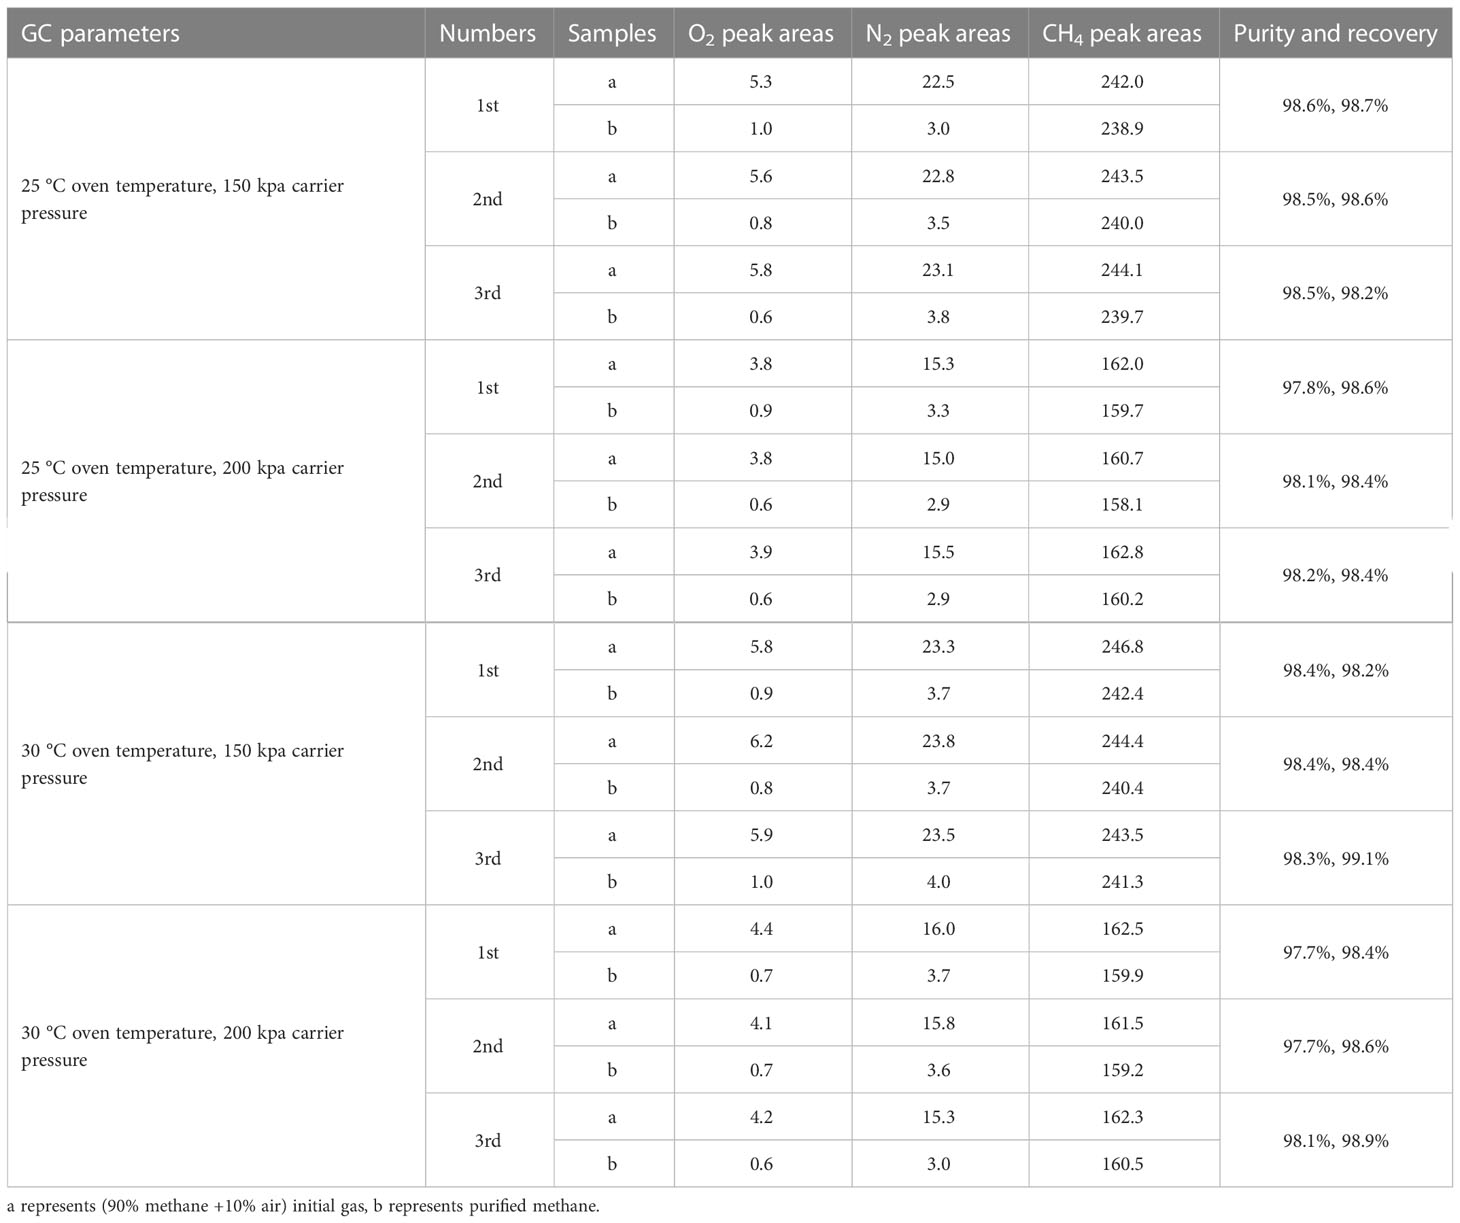
Table 4 Comparison of methane purification results under different conditions of chromatography.
The result showed that the purity and recovery data were slightly different under four GC parameters. The recoveries were (1) 98.2 to 98.7‰, (2) 98.4 to 98.6‰, (3) 98.2 to 99.1‰, and (4) 98.4 to 98.9‰ under four different parameters of temperature and gas pressure. All of them achieved a similar methane recovery of ~99‰. A slightly higher purity (98.2 to 99.1‰) of purified methane was achieved under GC parameters of 150 kpa. This can be explained by a lower pressure that causes a longer retention time of gases and thus reduces the contamination of O2 and N2 on CH4. For optimum separation of CH4 and N2, an oven temperature of 25 °C, carrier gas pressure of 150 kPa, and flow rate of 50.8 ml min–1 are recommended. These optimum conditions have advantages for the purification of nitrogen-rich samples to reduce nitrogen contamination on methane.
3.3 A determination of purification times of samples with different N2/CH4 (by vol)
Plenty of methane mixed with air was introduced to the system to evaluate the purification times of samples with varying content of methane. Usually, natural gas samples have relatively low oxygen content. In GC analysis, oxygen peaks occur earlier than nitrogen peaks. Nitrogen content is the key factor affecting the effect and efficiency of methane purification. Therefore, the N2/CH4 ratios of samples were used to evaluate the number of purification tests were required.
With a 75%/25% methane/air mixture, the peak areas of O2, N2, and CH4 for the unpurified gas, single-purified gas, and double-purified gas are shown in Table 5. After the first purification, the methane has a purity of 96.4 - 96.8% and a recovery of 98.8 - 99.2%. The recovery of 97.3 - 97.5% and purity of 98.6 - 98.8% were achieved after the second purification. The chromatogram is shown in Figure 9A.
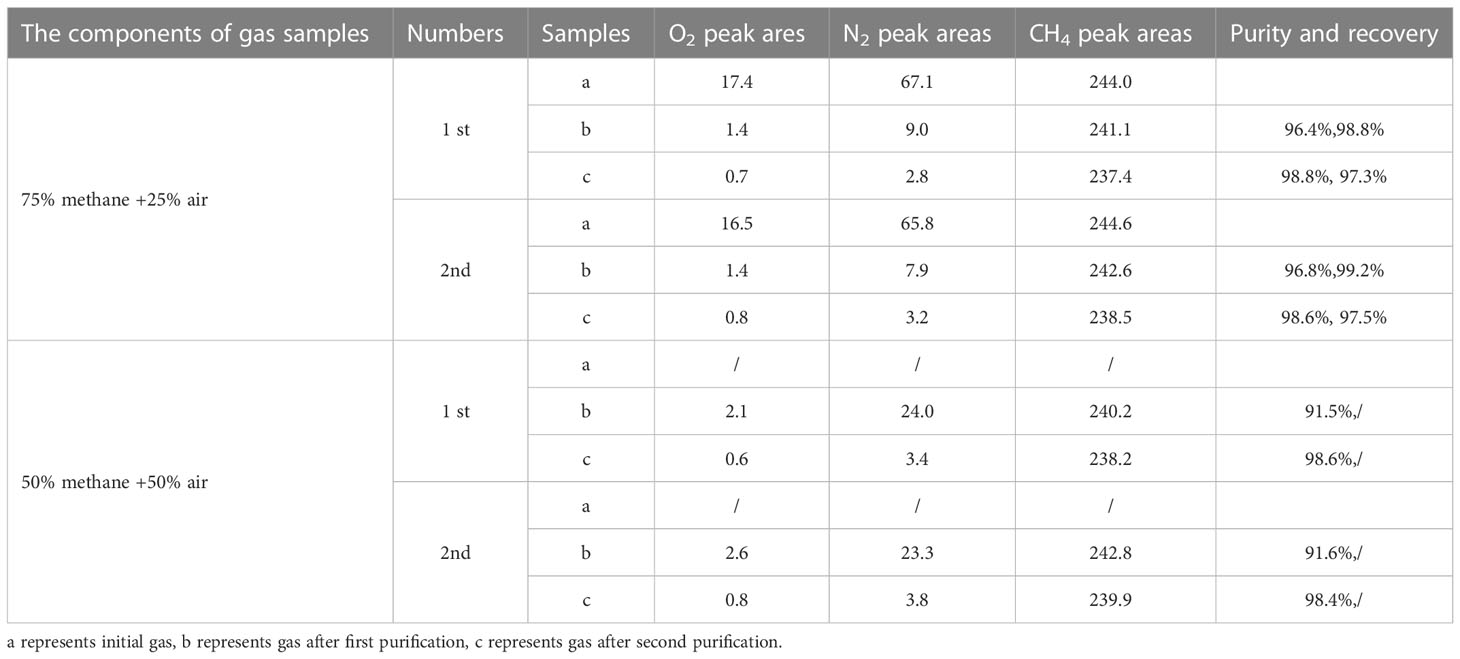
Table 5 Purification results of gases with different air contents.
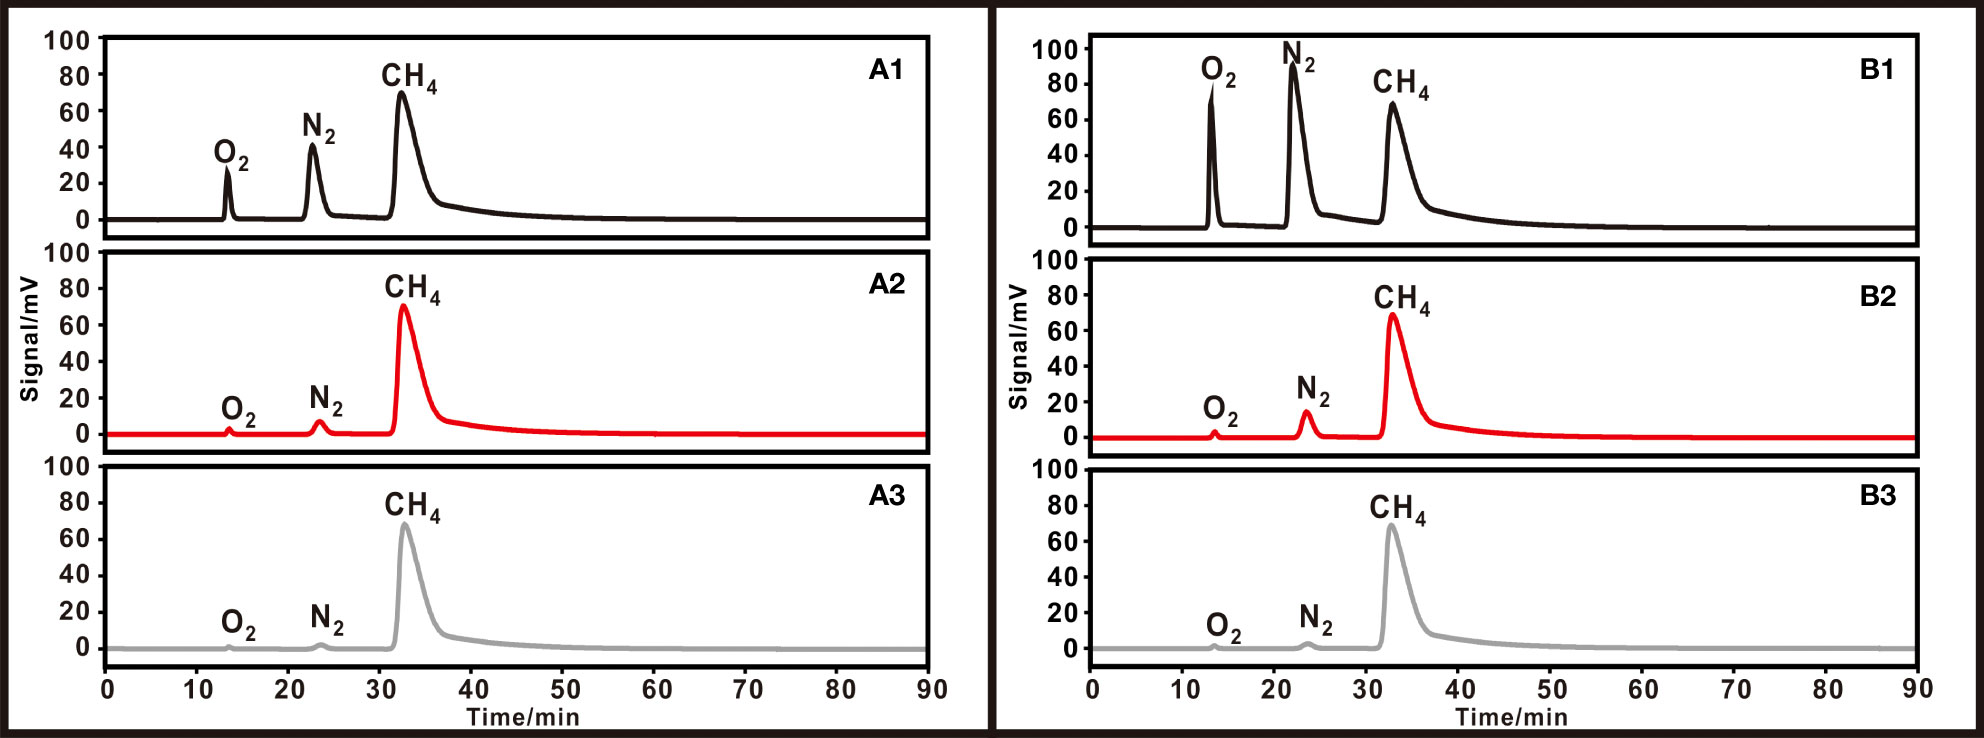
Figure 9 Chromatograms of gases with different air contents. (A) 75% methane + 25% air for (1) initial gas (2) single, and (3) double purification. (B) 50% methane + 50% air for (1) initial gas (2) single, and (3) double purification.
With a 50%/50% methane/air mixture the first time passing through the GC column, the peaks were not separated. Methane was collected based on the experience time (31.5 minutes) of the appearing peak. After the first purification, the methane has a purity of 91.5 - 91.6%. After the second purification, a purity of 98.4 - 98.6% was obtained (see Table 5). The chromatogram is shown in Figure 9B. In addition, we found that when the air content is greater than 50%, the purification results are unsatisfying. Consequently, purifications of low-content methane (< 50%) samples are not recommended.
The average nitrogen volume fraction in the air (78%) was used to estimate the added volume of nitrogen in experiments. When N2/CH4 (by vol) is<8.7% (calculate by 90%/10% methane/air single-purified experiments), a single purification is enough. When the ratio is 8.7%–78.0% (78.0% estimates from 50%/50% methane/air double-purified experiments), the gas should be purified twice. Recovery will slightly decrease after a single purification due to little amounts of gas absorbed in the packed columns. This also can be inferred from the decrease of peak area on CH4 through every single purification. Accordingly, it is not recommended to purify gas samples more than twice. To ensure high recovery within two-time purification, the N2/CH4 should be<78.0% in natural gas. In fact, most natural gas samples can match the sample criteria and be purified and analyzed for clumped isotope compositions. Here three different types of natural gas samples collected from the Eastern Pearl River Mouth Basin, Tarim Basin, and Qiongdongnan basin in China (see Table 6) were purified to verify the reliability of the method. In GC detection of the three gases, only the O2 peak and N2 peak were detected before the CH4 peak. The O2/CH4 (by vol) was in the range of 1.1%-8.0%, and N2/CH4 was in the range of 4.1%-40.5%. The purities were 98.4-98.8% with 97.5-99.2% recovery on extracted methane, which was largely consistent with mixture gas. N2 was the main source contributing to the impurity.
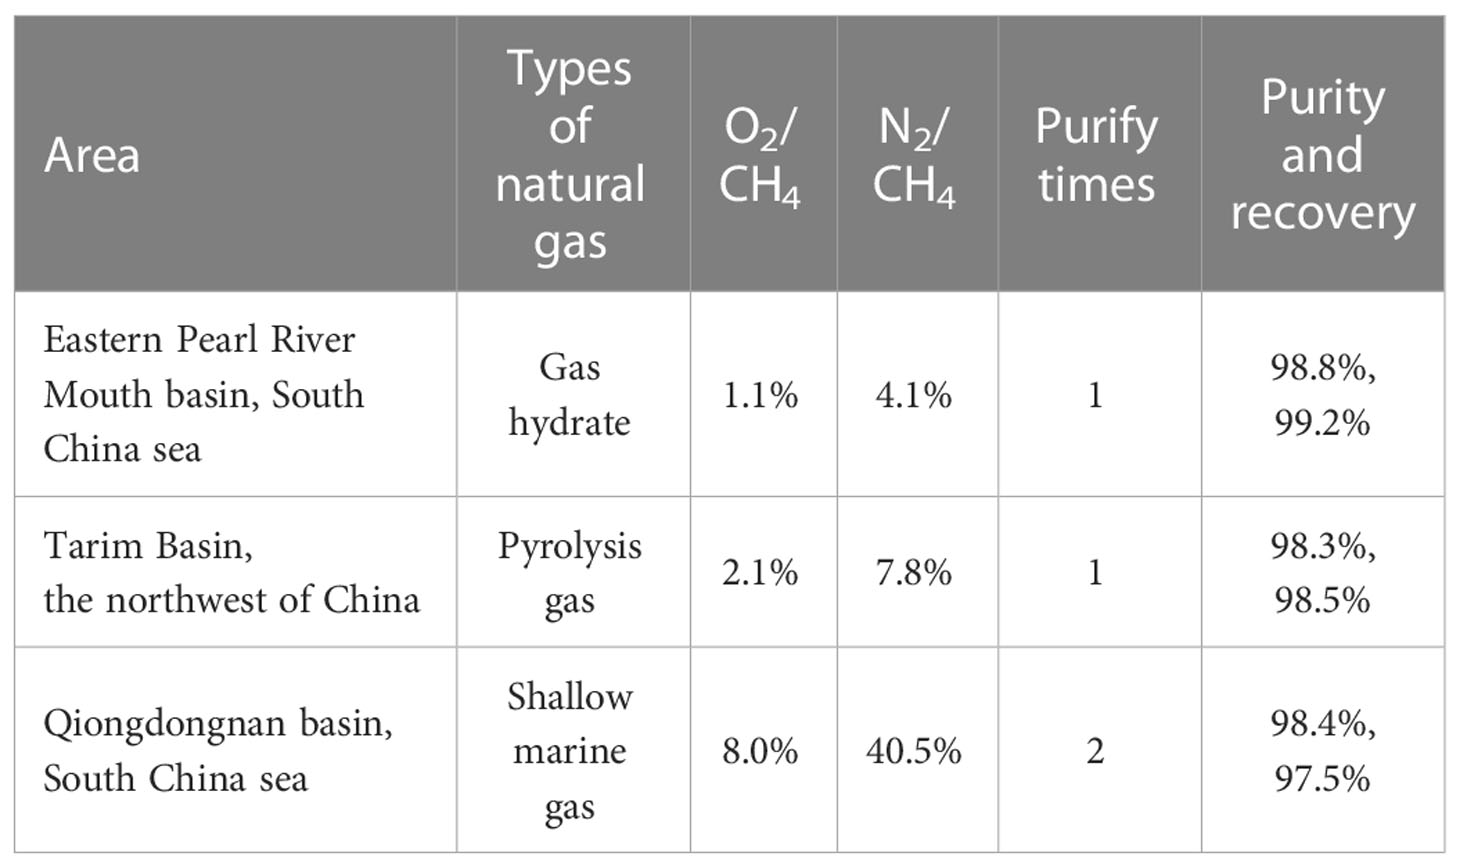
Table 6 Purification results of different types of natural gas.
3.4 N-bearing species contribute to methane isotopologues analysis?
Methane isotopologues, 12,13, 12CH3D+, and 13CH3D+ were measured using the high mass-resolving power of the instrument to distinguish interference ions from the targeted ones. As purified gas was found to contain a small amount of N2 (typically<2%), the impact of N-bearing species on methane isotopologues during testing should be taken into account. Thus,14 and 14 were scanned to check whether they contribute to 13 and 13CH3D+. 14 and 14 ions were first scanned under the high-resolution mode by employing H4 CDD high-resolution cup. The instrument background of 14 ions is ~150 cps. When analyzing purified methane samples, the 14 ions exhibited ~1000 cps on the CDD detector which was 1‰ intensity of 13 (Figure 10). An offset of 0.008 amu on mass between 14 and 13 was revealed with a high-resolution of ~30000. Besides, 14 ions did not show visible peak tailing. The 14 ions did not contribute to the analysis of 13 indicated. The 14 ions were also scanned under the parameter of δ13CH4 analysis using an L1 faraday cup. However, no peak was detected. Beyond that, 14 ions were not detected through mass scans (neither through H4 CDD high-resolution cup or measurement condition cup-H3 CDD). Therefore, we consider that methane isotopologues can be determined irrespective of N-bearing species by our machine.

Figure 10 Full peak separation for 14 and 13 at mass 17 in high resolution mode by H4 CDD.
3.5 Results of δ13CVPDB, δDVSMOW, and δ13C, δD, Δ13CH3D(wg) comparing pure in-house standard methane and purified methane
In this study, in-house standard methane samples (pure methane) were tested first to evaluate the stability of instrumental measurement, and also establish a reference for the purified gas. The conventional carbon and hydrogen isotopes (δ13CVPDB and δDVSMOW) determinations were executed (Table 7). In-house standard methane had a δ13CVPDB of -41.6‰ to -42.1‰ with a mean value of -41.9 ± 0.3‰ (1SD, n=3). The δDVSMOW values ranging from -176.9‰ to -178.2‰ yielded a mean value of -177.5 ± 0.7‰ (1SD, n=3). For methane isotopologues analysis, the internal precision (1 s.e.) of δ13C, δD, and δ13CH3D can reach ±0.01‰, ±0.09‰ and ±0.37‰. These reported precisions can be comparable to the data reported by other Ultra HR-IRMS laboratories, e.g. University of California, Berkeley, Tokyo Institute of Technology, and California Institute of Technology (Table 8). The average values were -0.01 ± 0.07‰ (1SD, n=5) for δ13C, 0.06 ± 0.25‰ (1SD, n=5) for δD, and 0.21 ± 0.57‰ (1SD, n=5) for δ13CH3D (see Table 9). An average Δ13CH3D(wg) of 0.16 ± 0.52‰ (1SD, n=5) was displayed on in-house standard methane during seven months of measurement. Due to the arrangement of other experiments, such as heated gas, and natural gas samples analysis, the quantity of Δ13CH3D(wg) data on in-house standard methane is not sufficient. The external precision ( ± 0.52‰) of Δ13CH3D(wg) was larger than the data ( ± 0.35 - ± 0.41‰) reported by other laboratories (Table 8). However, because our instrument was affected by the unstable temperature and humidity in our laboratory, its resolution power was compromised, which probably overwhelm the effect of the improvement of the measurement precision of δ13C, δD, and δ13CH3D. Nevertheless, the precision would have potential to be improved if the resolution power could be further well-controlled in the future.
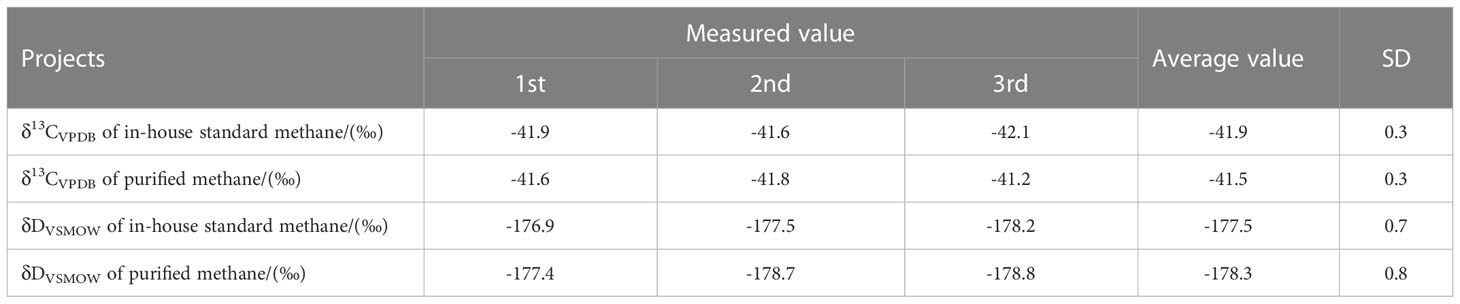
Table 7 Conventional stable isotope compositions (δ13CVPDB and δDVSMOW) of in-house standard methane and purified methane.
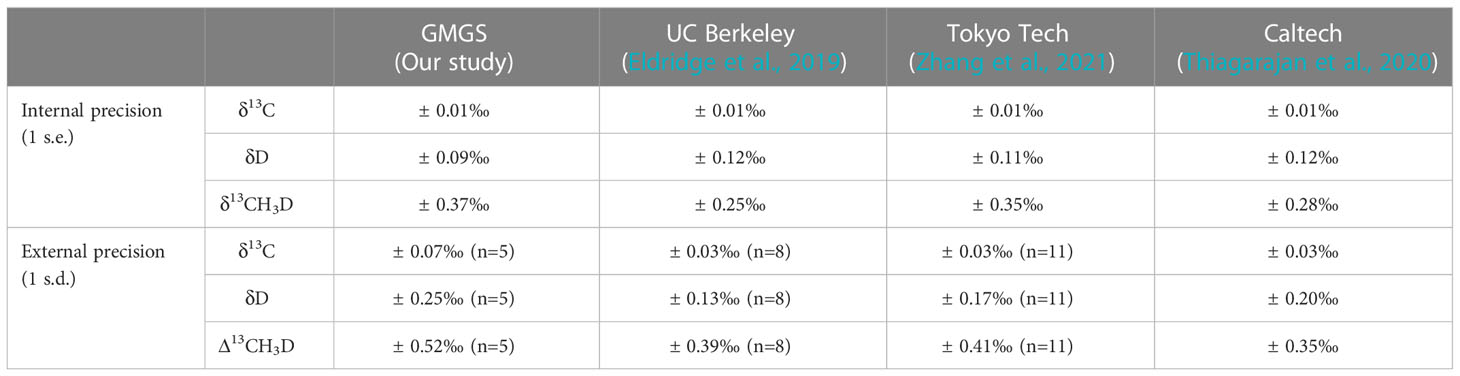
Table 8 Comparison of internal and external precision of in-house standards with other Ultra HR-IRMS laboratories.
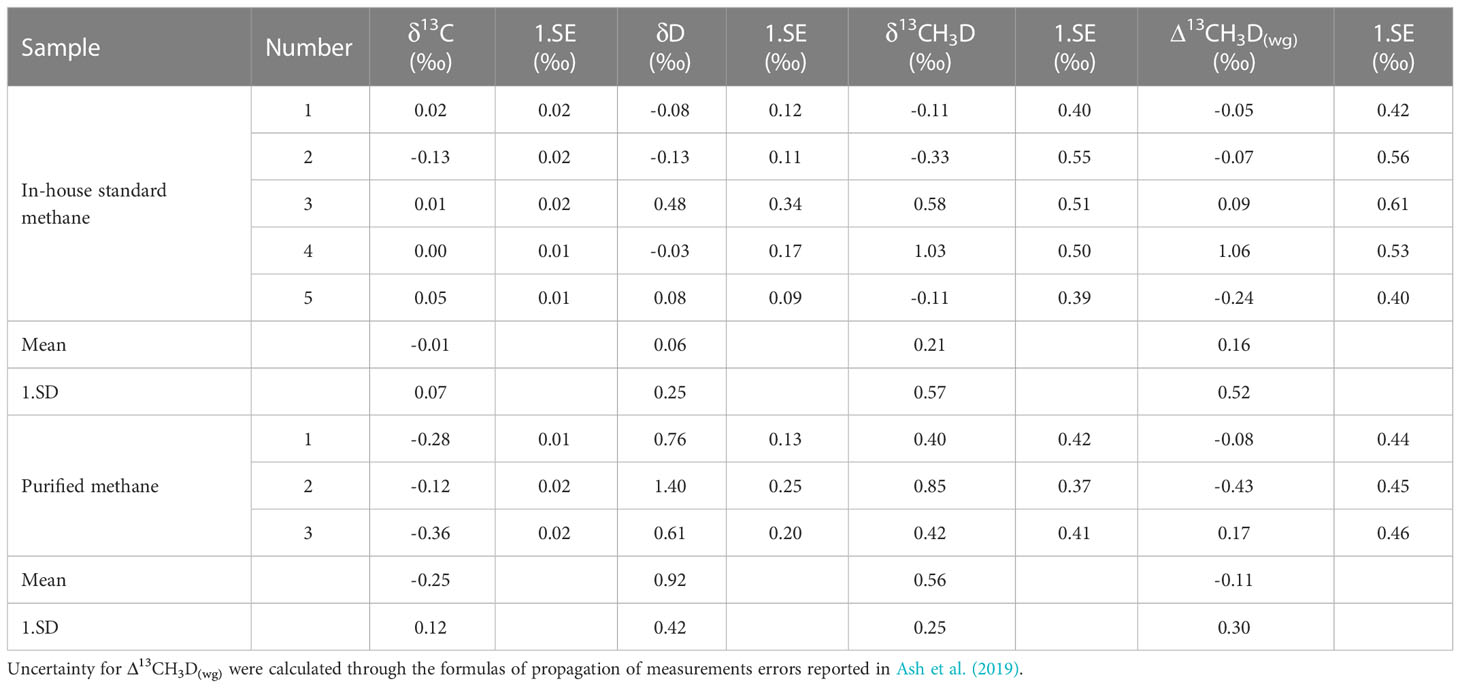
Table 9 Measurements of in-house standard methane and purified methane on clumped isotope determination by Ultra.
Attempting to examine the reliability of the purification method, purified methane samples were analyzed. ~6ml in-house standard methane mixed with 0.5ml air were introduced into the purification system. After purification, isotope measurements were carried out. Three completely independent purification experiments and tests were performed. δ13CVPDB and δDVSMOW values were -41.5 ± 0.3‰ (n=3) and -178.3 ± 0.8‰ (n=3), respectively (Table 7). The discrepancies were 0.4 and 0.8 compared to the in-house standard methane, which was well within the experimental uncertainty. As discussed above, the carbon and hydrogen isotope data of purified methane are consistent with pure methane. Besides, the average values were -0.25 ± 0.12‰ (1SD, n=3) for δ13C, 0.92 ± 0.42‰ (1SD, n=3) for δD, 0.56 ± 0.25‰ (1SD, n=3) for δ13CH3D of purified methane. The values of δ13C and δD can be comparable to the typical errors of conventional δ13CVPDB and δDVSMOW values. The average Δ13CH3D(wg) was -0.11 ± 0.30‰ on purified methane. Figure 11 shows the individual data spot of Δ13CH3D(wg) on in-house standard methane versus purified methane. A deviation of -0.27‰ was revealed. However, we consider this offset negligible, as it is lower than the internal and external precision of measured Δ13CH3D(wg) on our in-house standard methane.
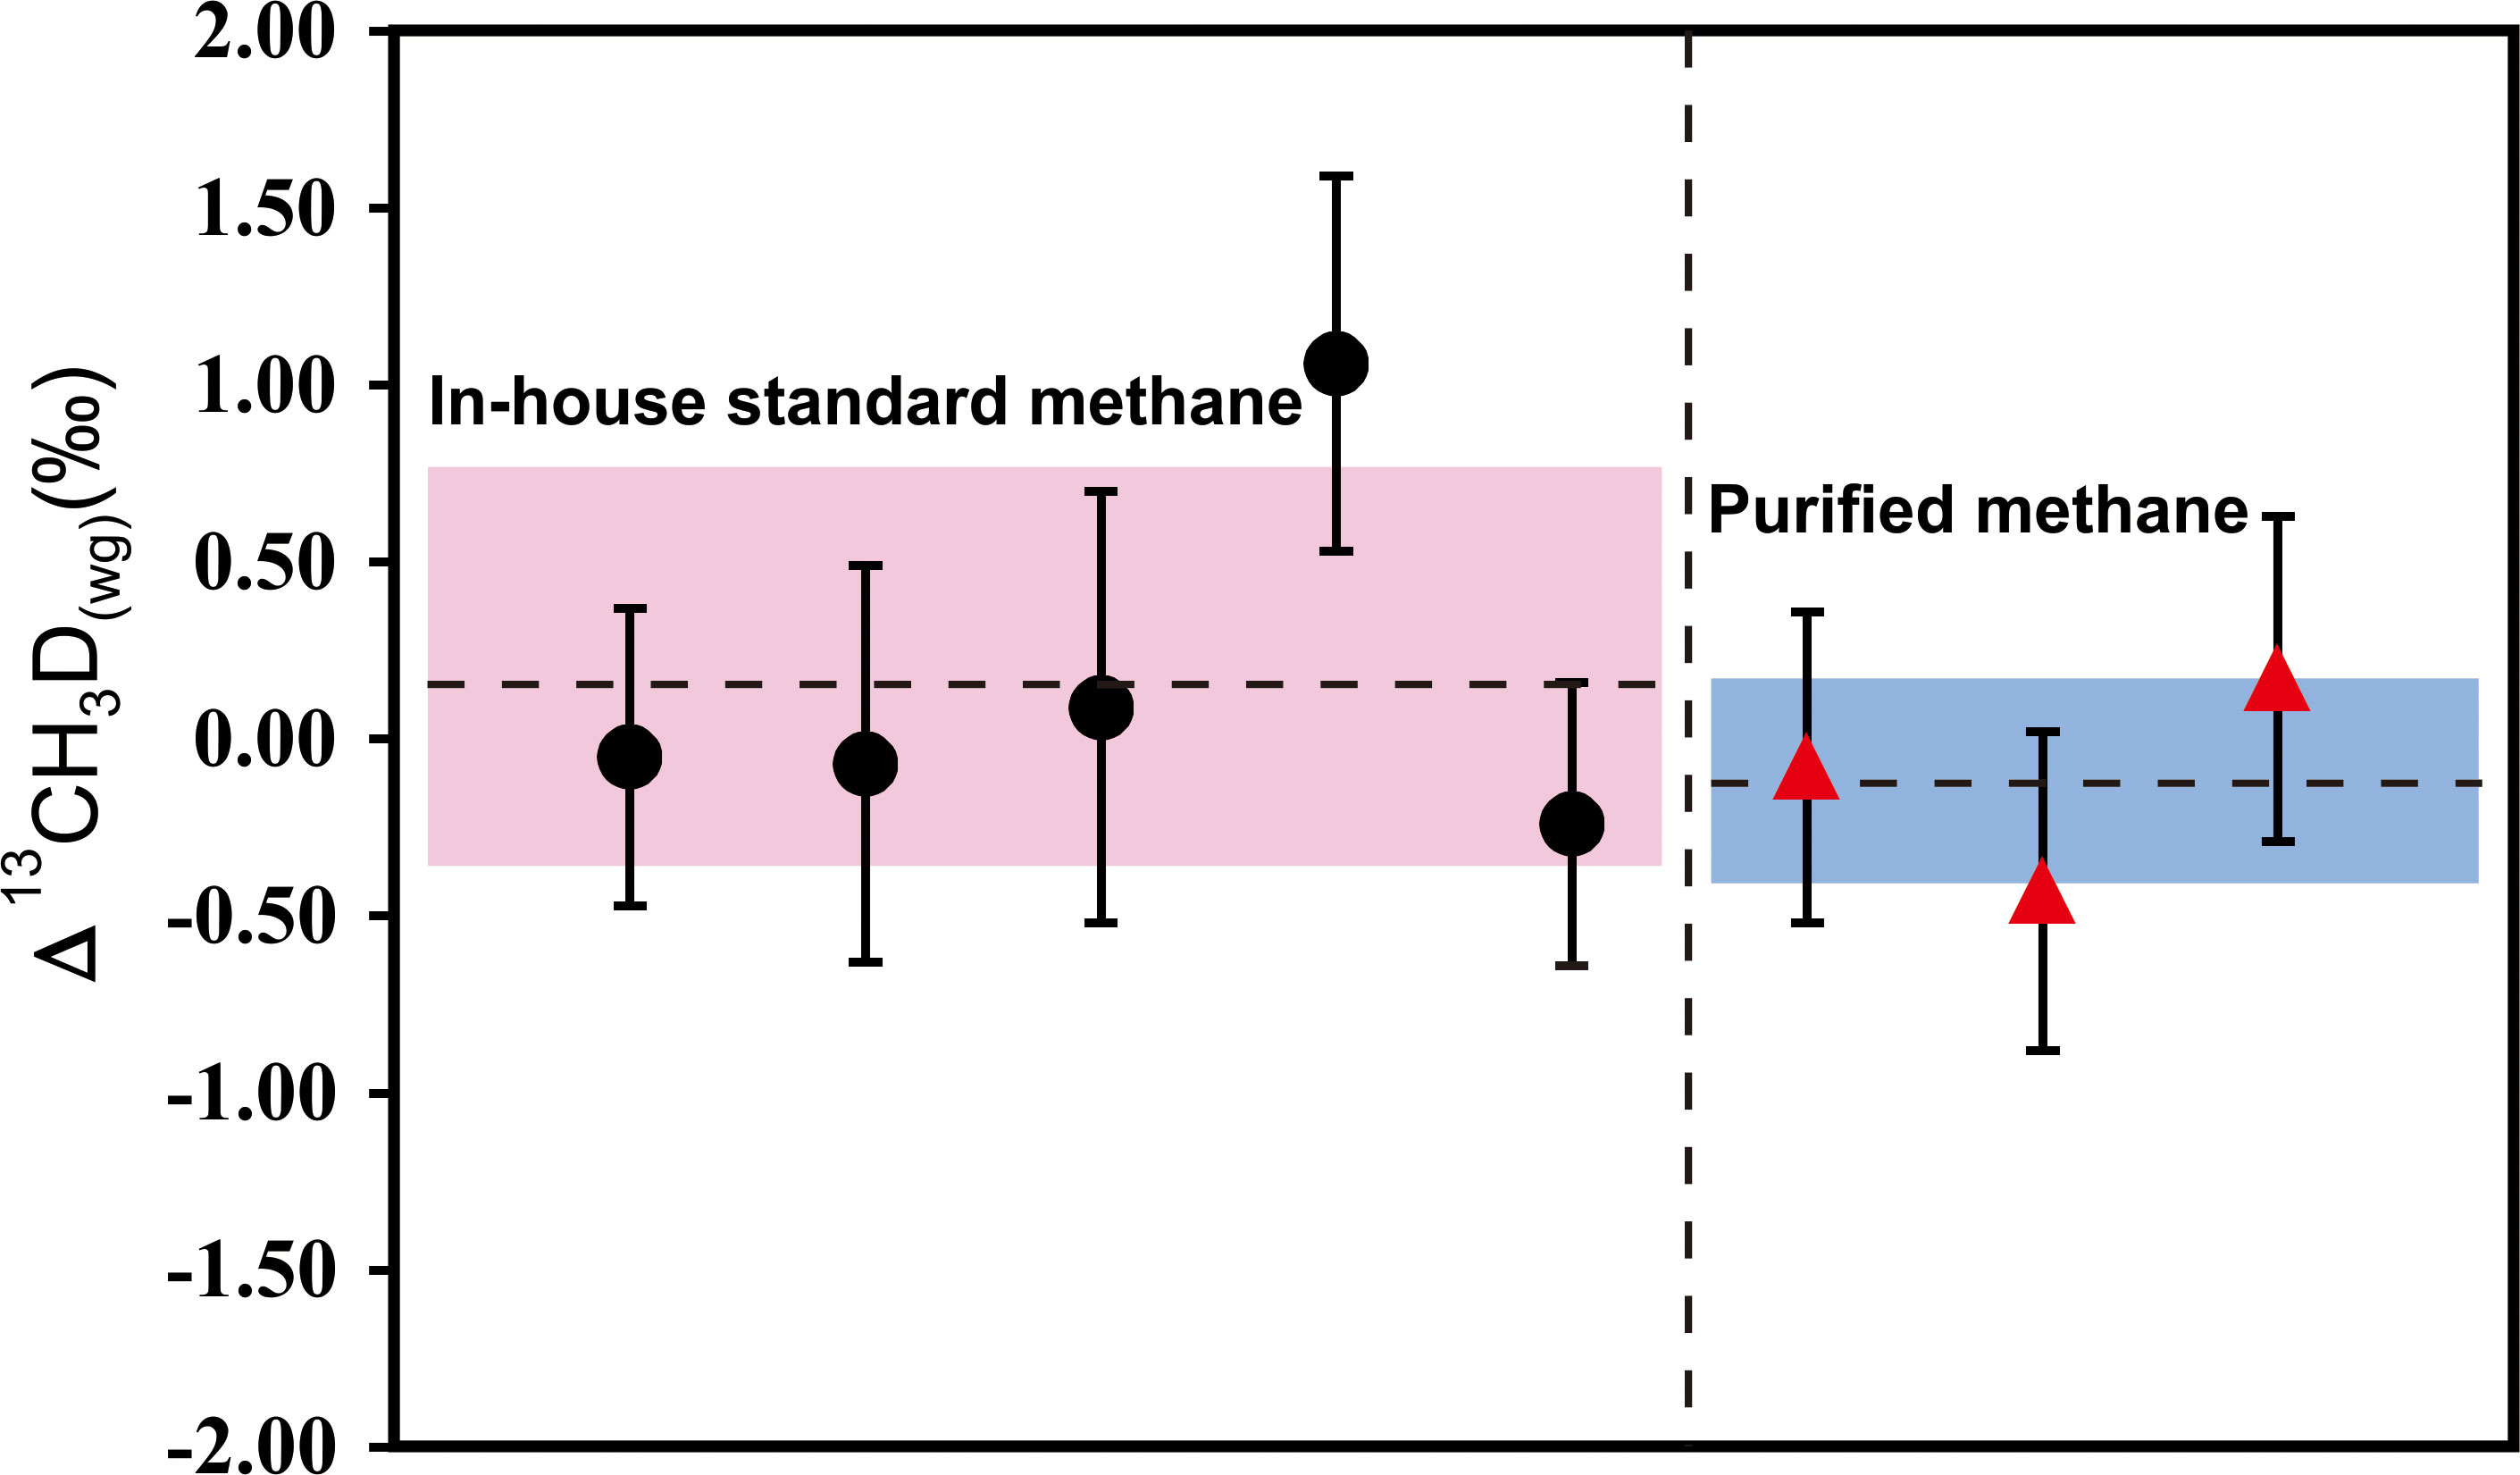
Figure 11 Δ13CH3D(wg) of in-house standard methane versus purified methane. All error bars represent ±1 s.e. for a single measurement. The dashed line represents the average of the measured data with pink area and blue area marking 2SD.
4 Conclusion
An experimental scheme for the separation and purification of methane in natural gas is described, based on a GC method. Multiple factors (separation degree of individual components, experiment efficiency, and purity, recovery of purified methane) are considered when determining the experiment parameter, e.g. diameter of the columns, temperature, and flow rate. We summarize the conclusions of this study as follows:(1) The comparative experiments of different type 5A molecular sieve columns indicate that 1/4 inch OD columns could provide better performance on the separation effect, efficiency, and purity of collected methane. (2) N2 separation from CH4 was optimal with an oven temperature of 25 °C, carrier gas pressure of 150 kPa, and flow rate of 50.8 ml min–1. (3) The purified samples may have N2 contamination, which is no more than ~2%. N2-bearing species do not affect clumped isotope analysis, further corrections are not required. (4) The GC-based purification method is suitable for samples containing<78.0% N2/CH4. Samples containing<8.7% N2/CH4 can be purified once. Double purification is required for the concentration of 8.7 - 78.0% N2/CH4.
Our proposed method of purified methane can realize a purity of 98.8% with a recovery of 98.7%. The δ13CVPDB and δDVSMOW values of purified methane are consistent with those of pure methane. Δ13CH3D(wg) of purified methane is -0.11 ± 0.30‰ (1SD, n=3), indicating negligible deviation compared to the 0.16 ± 0.52‰ (1SD, n=3) of pure in-house standard methane. Our proposed method first provides detailed reference material to study the GC-based methane extraction method for methane clumped isotope determination.
Data availability statement
The original contributions presented in the study are included in the article/supplementary material. Further inquiries can be directed to the corresponding authors.
Author contributions
TS, JC, and YD designed the research and experiment. TS performed the experiment and wrote the paper after discussions with JC, HQ, PF, HL, ZN, DC, YD, and SY. All authors contributed to the article and approved the submitted version.
Funding
This study was financially supported by the Key Research and Development Project of Guangdong Province (Grant: 2020B1111510001), Guangdong Basic and Applied Basic Research Foundation (NO. 2020A1515110405), National Natural Science Foundation of China (NO. 41803026,42276087,42276083), Key Special Project for Introduced Talents Team of Southern Marine Science and Engineering Guangdong Laboratory (Guangzhou) (NO. GML2019ZD0506), the Marine Geological Survey Program of China Geological Survey (No. DD20221706), the Major Program of Guangdong Basic and Applied Research (Grant: 2019B030302004).
Acknowledgments
We would like to thank Nina Albrecht (Thermo Fisher Scientific) and Yourong Tian (Thermo Fisher Scientific) for their helpful support in establishing the clumped isotope analytical method. We benefited greatly from discussions concerning instrument commissioning with Zhiyong Pang (Tianjin University) and Hao Xie (California Institute of Technology). The authors deeply appreciate Dr. Biao Chang and Tian Liang for reviewing this manuscript.
Conflict of interest
The authors declare that the research was conducted in the absence of any commercial or financial relationships that could be construed as a potential conflict of interest.
Publisher’s note
All claims expressed in this article are solely those of the authors and do not necessarily represent those of their affiliated organizations, or those of the publisher, the editors and the reviewers. Any product that may be evaluated in this article, or claim that may be made by its manufacturer, is not guaranteed or endorsed by the publisher.
References
Ash J. L., Egger M., Treude T., Kohl I., Cragg B., Parkes R. J., et al. (2019). Exchange catalysis during anaerobic methanotrophy revealed by 12CH2D2 and 13CH3D in methane. Geochem. Perspect. Lett. 10, 26–30. doi: 10.7185/geochemlet.1910
Dong G., Xie H., Eiler J., Zhang N., Mayuko N., Yoshida N., et al. (2020). “Clumped isotope analysis of methane using HR-IRMS: New insights into origin and formation mechanisms of natural gases and a potential geothermometer,” in Thermo scientific white PaperWP30767.
Dong G., Xie H., Formolo M., Lawson M., Sessions A., Eiler J. (2021). Clumped isotope effects of thermogenic methane formation: Insights from pyrolysis of hydrocarbons. Geochim. Cosmochim. Ac. 303, 159–183. doi: 10.1016/j.gca.2021.03.009
Douglas P. M. J., Moguel R. G., Anthony K. M. W., Wik M., Crill P. M., Dawson K. S., et al. (2020). Clumped isotopes link older carbon substrates with slower rates of methanogenesis in northern lakes. Geophys. Res. Lett. 47, e2019GL086756. doi: 10.1029/2019GL086756
Douglas P. M. J., Stolper D. A., Eiler J. M., Sessions A. L., Lawson M., Shuai Y. H., et al. (2017). Methane clumped isotopes: Progress and potential for a new isotopic tracer. Org. Geochem. 113, 262–282. doi: 10.1016/j.orggeochem.2017.07.016
Douglas P. M. J., Stolper D. A., Smith D. A., Anthony K. M. W., Paull C. K., Dallimore S., et al. (2016). Diverse origins of Arctic and subarctic methane point source emissions identified with multiply-substituted isotopologues. Geochim. Cosmochim. Ac. 188, 163–188. doi: 10.1016/j.gca.2016.05.031
Eldridge D. L., Korol R., Lloyd M. K., Turner A. C., Webb M. A., Miller T. F., et al. (2019). Comparison of experimental vs theoretical abundances of 13CH3D and 12CH2D2 for isotopically equilibrated systems from 1 to 500 °C. ACS Earth Space Chem. 3, 2747–2764. doi: 10.1021/acsearthspacechem.9b00244
Etiope G., Sherwood Lollar B. (2013). Abiotic methane on earth. Rev. Geophys. 51, 276–299. doi: 10.1002/rog.20011
Giunta T., Labidi J., Kohl I. E., Ruffine L., Donval J. P., Geli L., et al. (2021). Evidence for methane isotopic bond re-ordering in gas reservoirs sourcing cold seeps from the Sea of marmara. Earth Planet. Sci. Lett. 553, 116619. doi: 10.1016/j.epsl.2020.116619
Giunta T., Young E. D., Warr O., Kohl I., Ash J. L., Martini A., et al. (2019). Methane sources and sinks in continental sedimentary systems: New insights from paired clumped isotopologues 13CH3D and 12CH2D2. Geochim. Cosmochim. Ac. 245, 327–351. doi: 10.1016/j.gca.2018.10.030
Gonzalez Y., Nelson D. D., Shorter J. H., McManus J. B., Dyroff C., Formolo M., et al. (2019). Precise measurements of 12CH2D2 by tunable infrared laser direct absorption spectroscopy. Anal. Chem. 91, 14967–14974. doi: 10.1021/acs.analchem.9b03412
Kirschke S., Bousquet P., Ciais P., Saunois M., Canadell J. G., Dlugokencky E. J., et al. (2013). Three decades of global methane sources and sinks. Nat. Geosci. 6, 813–823. doi: 10.1038/NGEO1955
Labidi J., Young E. D., Giunta T., Kohl I. E., Seewald J., Tang H., et al. (2020). Methane thermometry in deep-sea hydrothermal systems: Evidence for re-ordering of doubly-substituted isotopologues during fluid cooling. Geochim. Cosmochim. Ac. 288, 248–261. doi: 10.1016/j.gca.2020.08.013
Milkov A. V., Etiope G. (2018). Revised genetic diagrams for natural gases based on a global dataset of >20,000 samples. Org. Geochem. 125, 109–120. doi: 10.1016/j.orggeochem.2018.09.002
Nisbet E. G., Dlugokencky E. J., Bousquet P. (2014). Methane on the rise-again. Science 343, 493–495. doi: 10.1126/science.1247828
Ono S., Wang D. T., Gruen D. S., Sherwood-Lollar B., Zahniser M. S., McManus B. J., et al. (2014). Measurement of a doubly substituted methane isotopologue, 13CH3D, by tunable infrared laser direct absorption spectroscopy. Anal.Chem. 86, 6487–6494. doi: 10.1021/ac5010579
Schaefer H., Fletcher S. E. M., Veidt C., Lassey K. R., Brailsford G. W., BromLey T. M., et al. (2016). A 21st-century shift from fossil-fuel to biogenic methane emissions indicated by 13CH4. Science 352, 80–84. doi: 10.1126/science.aad2705
Schoell M. (1980). The hydrogen and carbon isotopic composition of methane from natural gases of various origins. Geochim. Cosmochim. Acta 44, 649–661. doi: 10.1016/0016-7037(80)90155-6
Schwietzke S., Sherwood O. A., Bruhwiler L. M., Miller J. B., Etiope G., Dlugokencky E. J., et al. (2016). Upward revision of global fossil fuel methane emissions based on isotope database. Nature 538, 88–91. doi: 10.1038/nature19797
Shen L., Bui T. Q., Okumura M. (2016). “Measurements doubly-substituted methane isotopologue (13CH3D and 12CH2D2) abundance using frequency stabilized mid-ir cavity ringdown spectroscopy,” in 71 st International Symposium on Molecular Spectroscopy.
Sherwood O. A., Schwietzke S., Arling V. A., Etiope G. (2017). Global inventory of gas geochemistry data from fossil fuel, microbial and burning sources. Earth Syst. Sci. 9, 639–656. doi: 10.5194/essd-9-639-2017
Shuai Y., Douglas P. M. J., Zhang S., Stolper D. A., Ellis G. S., Lawson M., et al. (2018). Equilibrium and nonequilibrium controls on the abundances of clumped isotopologues of methane during thermogenic formation in laboratory experiments: implications for the chemistry of pyrolysis and the origins of natural gases. Geochim. Cosmochim. Ac. 223, 159–174. doi: 10.1016/j.gca.2017.11.024
Sparkman O. D., Penton Z. E., Kitson F. G., Larsen B. S., Mcewen N. C. (1997). Gas chromatography and mass spectrometry: a practical guide Vol. 381 (berlin: Academic press, inc).
Stolper D. A., Lawson M., Davis C. L., Ferreira A. A., Neto E. V. S., Ellis G. S., et al. (2014b). Formation temperatures of thermogenic and biogenic methane. Science 344 (6191), 1500–1503. doi: 10.1126/science.1254509
Stolper D. A., Lawson M., Formolo M. J., Davis C. L., Douglas P. M. J., Eiler J. M. (2018). The utility of methane clumped isotopes to constrain the origins of methane in natural gas accumulations. Geol. Soc. Lond. Special Publ. 468, 23–52. doi: 10.1144/SP468.3
Stolper D. A., Sessions A. L., Ferreira A. A., Neto E. V. S., Schimmelmann A., Shusta S. S., et al. (2014a). Combined 13C-d and d-d clumping in methane: Methods and preliminary results. Geochim. Cosmochim. Ac. 126, 169–191. doi: 10.1016/j.gca.2013.10.045
Taenzer L., Labidi J., Masterson A. L., Feng X. H., Rumble D., Young E. D., et al. (2020). Low Δ12CH2D2 values in microbialgenic methane result from combinatorial isotope effects. Geochim. Cosmochim. Ac. 285, 225–236. doi: 10.1016/j.gca.2020.06.026
Thiagarajan N., Kitchen N., Xie H., Ponton C., Lawson M., Formolo M., et al. (2020). Identifying thermogenic and microbial methane in deep water gulf of Mexico reservoirs. Geochim. Cosmochim. Acta 275, 188–208. doi: 10.1016/j.gca.2020.02.016
Wang D. T., Gruen D. S., Sherwood-Lollar B., Hinrichs K. U., Stewart L. C., Holden J. F., et al. (2015). Non equilibrium clumped isotope signals in microbial methane. Science 348, 428–431. doi: 10.1126/science.aaa4326
Wang Y., Guo C. H., Chen X. J., Jia L. Q., Guo X. N., Chen R. S., et al. (2021). Carbon peak and carbon neutrality in China: Goals, implementation path and prospects. China Geol. 4, 720–746. doi: 10.1016/j.gca.2020.12.002
Warr O., Young E. D., Giunta T., Kohl I. E., Ash J. L., Sherwood-Lollar B.. (2021). High-resolution, long-term isotopic and isotopologue variation identifies the sources and sinks of methane in a deep subsurface carbon cycle. Geochim. Cosmochim. Ac. 294, 315–334. doi: 10.1016/j.gca.2020.12.002
Xie H., Dong G., Formolo M., Lawson M., Liu J., Cong F., et al. (2021). The evolution of intra-and inter-molecular isotope equilibria in natural gases with thermal maturation. Geochim. Cosmochim. Ac. 307, 22–41. doi: 10.1016/j.gca.2021.05.012
Young E. D., Rumble D., Freedman P., Mills M.. (2016). A large-radius high-mass-resolution multiple-collector isotope ratio mass spectrometer for analysis of rare isotopologues of O2, N2, CH4 and other gases. Int. J. Mass Spectrom. 401, 1–10. doi: 10.1016/j.ijms.2016.01.006
Young E. D., Kohl I. E., Sherwood-Lollar B., Etiope G., Rumble D., Li S., et al. (2017). The relative abundances of resolved 13CH3D and 12CH2D2 and mechanisms controlling isotopic bond ordering in abiotic and biotic methane gases. Geochim. Cosmochim. Ac. 203, 235–264. doi: 10.1016/j.gca.2016.12.041
Zhang N., Snyder G. T., Lin M., Nakagawa M., Sekine Y. (2021). Doubly substituted isotopologues of methane hydrate (13CH3D and 12CH2D2): implications for methane clumped isotope effects, source apportionments and global hydrate reservoirs. Geochim. Cosmochim. Ac. 315, 127–151. doi: 10.1016/j.gca.2021.08.027
Keywords: purification method, natural gas, gas chromatography, purity and recovery, methane clumped isotopes
Citation: Sun T, Cao J, Qiu H, Fu P, Lu H, Ning Z, Chen D, Deng Y and Yang S (2023) Investigation and optimization of methane purification method for natural gas by two-column gas chromatography: A preliminary test for doubly substituted isotopologue (13CH3D) measurements. Front. Mar. Sci. 10:969567. doi: 10.3389/fmars.2023.969567
Received: 15 June 2022; Accepted: 16 January 2023;
Published: 08 February 2023.
Edited by:
Mingyu Zhao, Institute of Geology and Geophysics, Chinese Academy of Sciences, ChinaReviewed by:
Mang Lin, Guangzhou Institute of Geochemistry, Chinese Academy of Sciences (CAS), ChinaLaiming Zhang, China University of Geosciences (Beijing), China
Copyright © 2023 Sun, Cao, Qiu, Fu, Lu, Ning, Chen, Deng and Yang. This is an open-access article distributed under the terms of the Creative Commons Attribution License (CC BY). The use, distribution or reproduction in other forums is permitted, provided the original author(s) and the copyright owner(s) are credited and that the original publication in this journal is cited, in accordance with accepted academic practice. No use, distribution or reproduction is permitted which does not comply with these terms.
*Correspondence: Jun Cao, Y2FvanVuXzAzMTA1MUAxMjYuY29t; Yinan Deng, ZGVuZ3lpbmFuQDEyNi5jb20=