 Emma Lee Beck
 Jennifer Ruesink
 Stena Troyer
 Michael Behrens
- 1University of Washington, Biology Department, Seattle, WA, United States
- 2Harbor WildWatch, Gig Harbor, WA, United States
- 3Pacific Lutheran University, Biology Department, Tacoma, WA, United States
Marine heatwaves have altered ecosystems globally, including changing community composition and facilitating the spread of invasive species. In south Puget Sound, Washington (USA), non-native Pacific oysters (Magallana gigas) have been farmed extensively for almost a century and grown in enhancement sites, however, they have only recently recruited in the wild. This study explores how the appearance of Pacific oysters was related spatially (eight sites) and temporally (decade) to warmer summer water temperatures in south Puget Sound and compares oyster persistence across five sites where recruitment occurred. The largest recruitment event from 2012-2020 was in the summer of 2015, in the middle of the east Pacific Blob marine heatwave which led to warm water temperatures off the west coast of North America. Throughout the study period, the number of oyster recruits each year was positively correlated with warmer water temperatures. Oyster population densities differed across the five sites where recruitment occurred and generally declined after 2015, but showed no site by year interactions, which is consistent with spatially-variable recruitment and similar post-recruitment survival. Mean oyster shell heights also differed among sites, which could reflect different growth trajectories or recreational harvest patterns. This study supports the claim that warming sea surface temperatures may interact with species introductions to change modern biogeography.
1 Introduction
Climate change has been predicted to aid species invasion globally (Walther et al., 2009). With changing climate, the range of many non-native species is expanding (Zacherl et al., 2003; Clements and Ditommaso, 2011; Bertelsmeier et al., 2013). Decreased performance and diversity of native species also leaves ecosystems vulnerable to generalist invasive species (Stachowicz et al., 2002; Sorte et al., 2013). One such invasive species, the Pacific oyster (Magallana gigas Thunberg, formerly Crassostrea gigas), has already established populations on every continent except Antarctica and does not yet occupy its full predicted range (Ruesink et al., 2005; King et al., 2021; McAfee and Connell, 2021).
Pacific oysters were first planted for aquaculture in Washington state, USA in 1919 (Steele, 1964) and within a few decades had established in the coastal estuary of Willapa Bay, and in the inner waters of Hood Canal (Valdez and Ruesink, 2017). In the southern Puget Sound region of Washington, where oyster aquaculture is extensive (Decker, 2015), Pacific oyster populations have recently been observed establishing outside of cultivated areas. This raises questions regarding changes to factors influencing Pacific oyster spawning and recruitment that facilitated these new populations.
Pacific oyster spawning is typically triggered at water temperatures of about 20° C (Quayle, 1969; Mann, 2009). After eggs are fertilized, larvae stay suspended in the water column for a few weeks before settling on hard substrate. The ideal temperature for larval survival and settlement during this period is about 27° C, but larvae have been shown to survive at much lower temperatures (Rico-Villa et al., 2008, 2009). Rico-Villa et al. (2009) showed more than 80% survival among larvae reared at 17° C. King et al. (2021) considered larval survival to be based on degree days above 10.55° C, with a minimal requirement in order to complete reproduction. Water temperatures in south Puget Sound have not historically achieved the temperature threshold for spawning; during our study period, the mean summer water temperature from all recordings used was 14.5° C, much lower than the typical spawning threshold of 20° C.
Following recruitment, post-recruitment oyster population metrics such as growth and mortality are also influenced by local environmental factors (Brown and Hartwick, 1988b; Ren and Ross, 2001; Chavez-Villalba et al., 2010; Deng et al., 2013). For example, Pacific oyster growth rates in British Columbia, Canada, varied based on temperature as well as salinity and particulate organic matter concentration (Brown, 1988a; Brown and Hartwick, 1988b). While it has been well documented in other areas that oyster growth and survival are influenced by local environmental factors, we do not yet know how oysters perform outside of aquaculture on rocky shores of south Puget Sound.
Field observations in many parts of its non-native range are consistent with thermal controls on Pacific oyster recruitment. In Hood Canal, Washington, oyster recruitment over five decades increased by a factor of six with each additional degree C of summer water temperature (Valdez and Ruesink, 2017). In the northern Wadden Sea, years with high summer water temperatures were correlated with high recruitment (Diederich et al., 2005). On the French Atlantic coast, high water temperatures facilitated successful Pacific oyster recruitment (Dutertre et al., 2010). While the southern Puget Sound region has historically been too cold for Pacific oyster recruitment outside of an artificial environment, periods of warmer water temperature may become more frequent with climate change.
One recent example of elevated water temperatures in Puget Sound was the Blob marine heatwave, a region of elevated surface temperature that began off the coast of North America in the winter of 2013-2014 and spread to the coast by 2014 (Bond et al., 2015). The Blob caused surface temperatures of up to 3° C warmer than usual and lasted from 2014 through 2017 (Bond et al., 2015). The Blob had widespread repercussions for marine life, including large phytoplankton blooms causing the spread of a neurotoxin, changes in community composition in California kelp forests, and mortality of fishes in the larval stage (McCabe et al., 2016; Rogers et al., 2020; Michaud et al., 2022). While the Blob originated in the Pacific, warm water abnormalities spread to the Salish Sea in 2014 and elevated water temperatures were observed throughout the Salish Sea (Khangaonkar et al., 2021). There is currently no literature exploring the possible influence of the marine heatwave on Pacific oyster populations in this region.
The recent appearance of wild Pacific oysters in south Puget Sound led us to address the following objectives in our study: determining 1) how many cohorts of oysters have recruited over a decade of monitoring in south Puget Sound; 2) whether there is a relationship between oyster recruitment and water temperature across years and regions and whether the elevated temperatures caused by the Blob could have facilitated reproduction; and 3) how population dynamics (density and shell size) differed among sites since initial recruitment. We predicted that oyster recruitment would increase with increasing summer water temperature and that population dynamics would differ among sites.
2 Materials and methods
2.1 Study sites
Puget Sound is a section of the Salish Sea consisting of an inland fjord system in Washington state. The southern basin of Puget Sound extends south from a sill at the Tacoma Narrows and has multiple offshoots including Carr Inlet, the location of many of our study sites (Barnes et al., 1954). Inflow comes to Puget Sound from the Strait of Juan de Fuca and various rivers. At the shallow sills, up to half of outflow water is pushed back towards land and recycled, increasing basin residence time (Ebbesmeyer et al., 1988). Mean residence time in Carr Inlet, the western region of our study, is 6-11 days and flushing time is 12-17 days (Premathilake and Khangaonkar, 2022). Mean residence time in the Tacoma Narrows, near our eastern sites, is 0.7 days at depth and 1.2 days at the surface (Babson et al., 2005).
In this study, Pacific oysters were counted as part of a twice-yearly intertidal survey at eight sites (beaches) in south Puget Sound: Penrose Point State Park (Penrose), Purdy Sand Spit (Purdy), Kopachuck State Park (Kopachuck), Tacoma DeMolay Sandspit Nature Preserve (DeMolay), Maple Hollow Park (Maple Hollow), Gig Harbor Old Ferry Landing (Gig Harbor), Austin Park at txwaalqəł Estuary (Austin Estuary), and Sunrise Beach Park (Sunrise) (Figure 1). Beach monitoring was carried out by the nonprofit organization Harbor WildWatch. Quadrat data were collected once in winter (December/January) and once in summer (end of May/June/early July) beginning in 2013 (Table 1). The sites were distributed in two distinct water bodies, with five in a western region along the perimeter of Carr Inlet, and three in an eastern region of more active water exchange near the Tacoma Narrows sill (Figure 1). These western and eastern water bodies are at similar latitudes but separated by a landmass and have distinct water temperature regimes. All sites except Austin Estuary included hard substrate suitable for oyster settlement, mainly rock surfaces, at tidal heights of 0.3 m relative to mean lower low water (MLLW) and above.
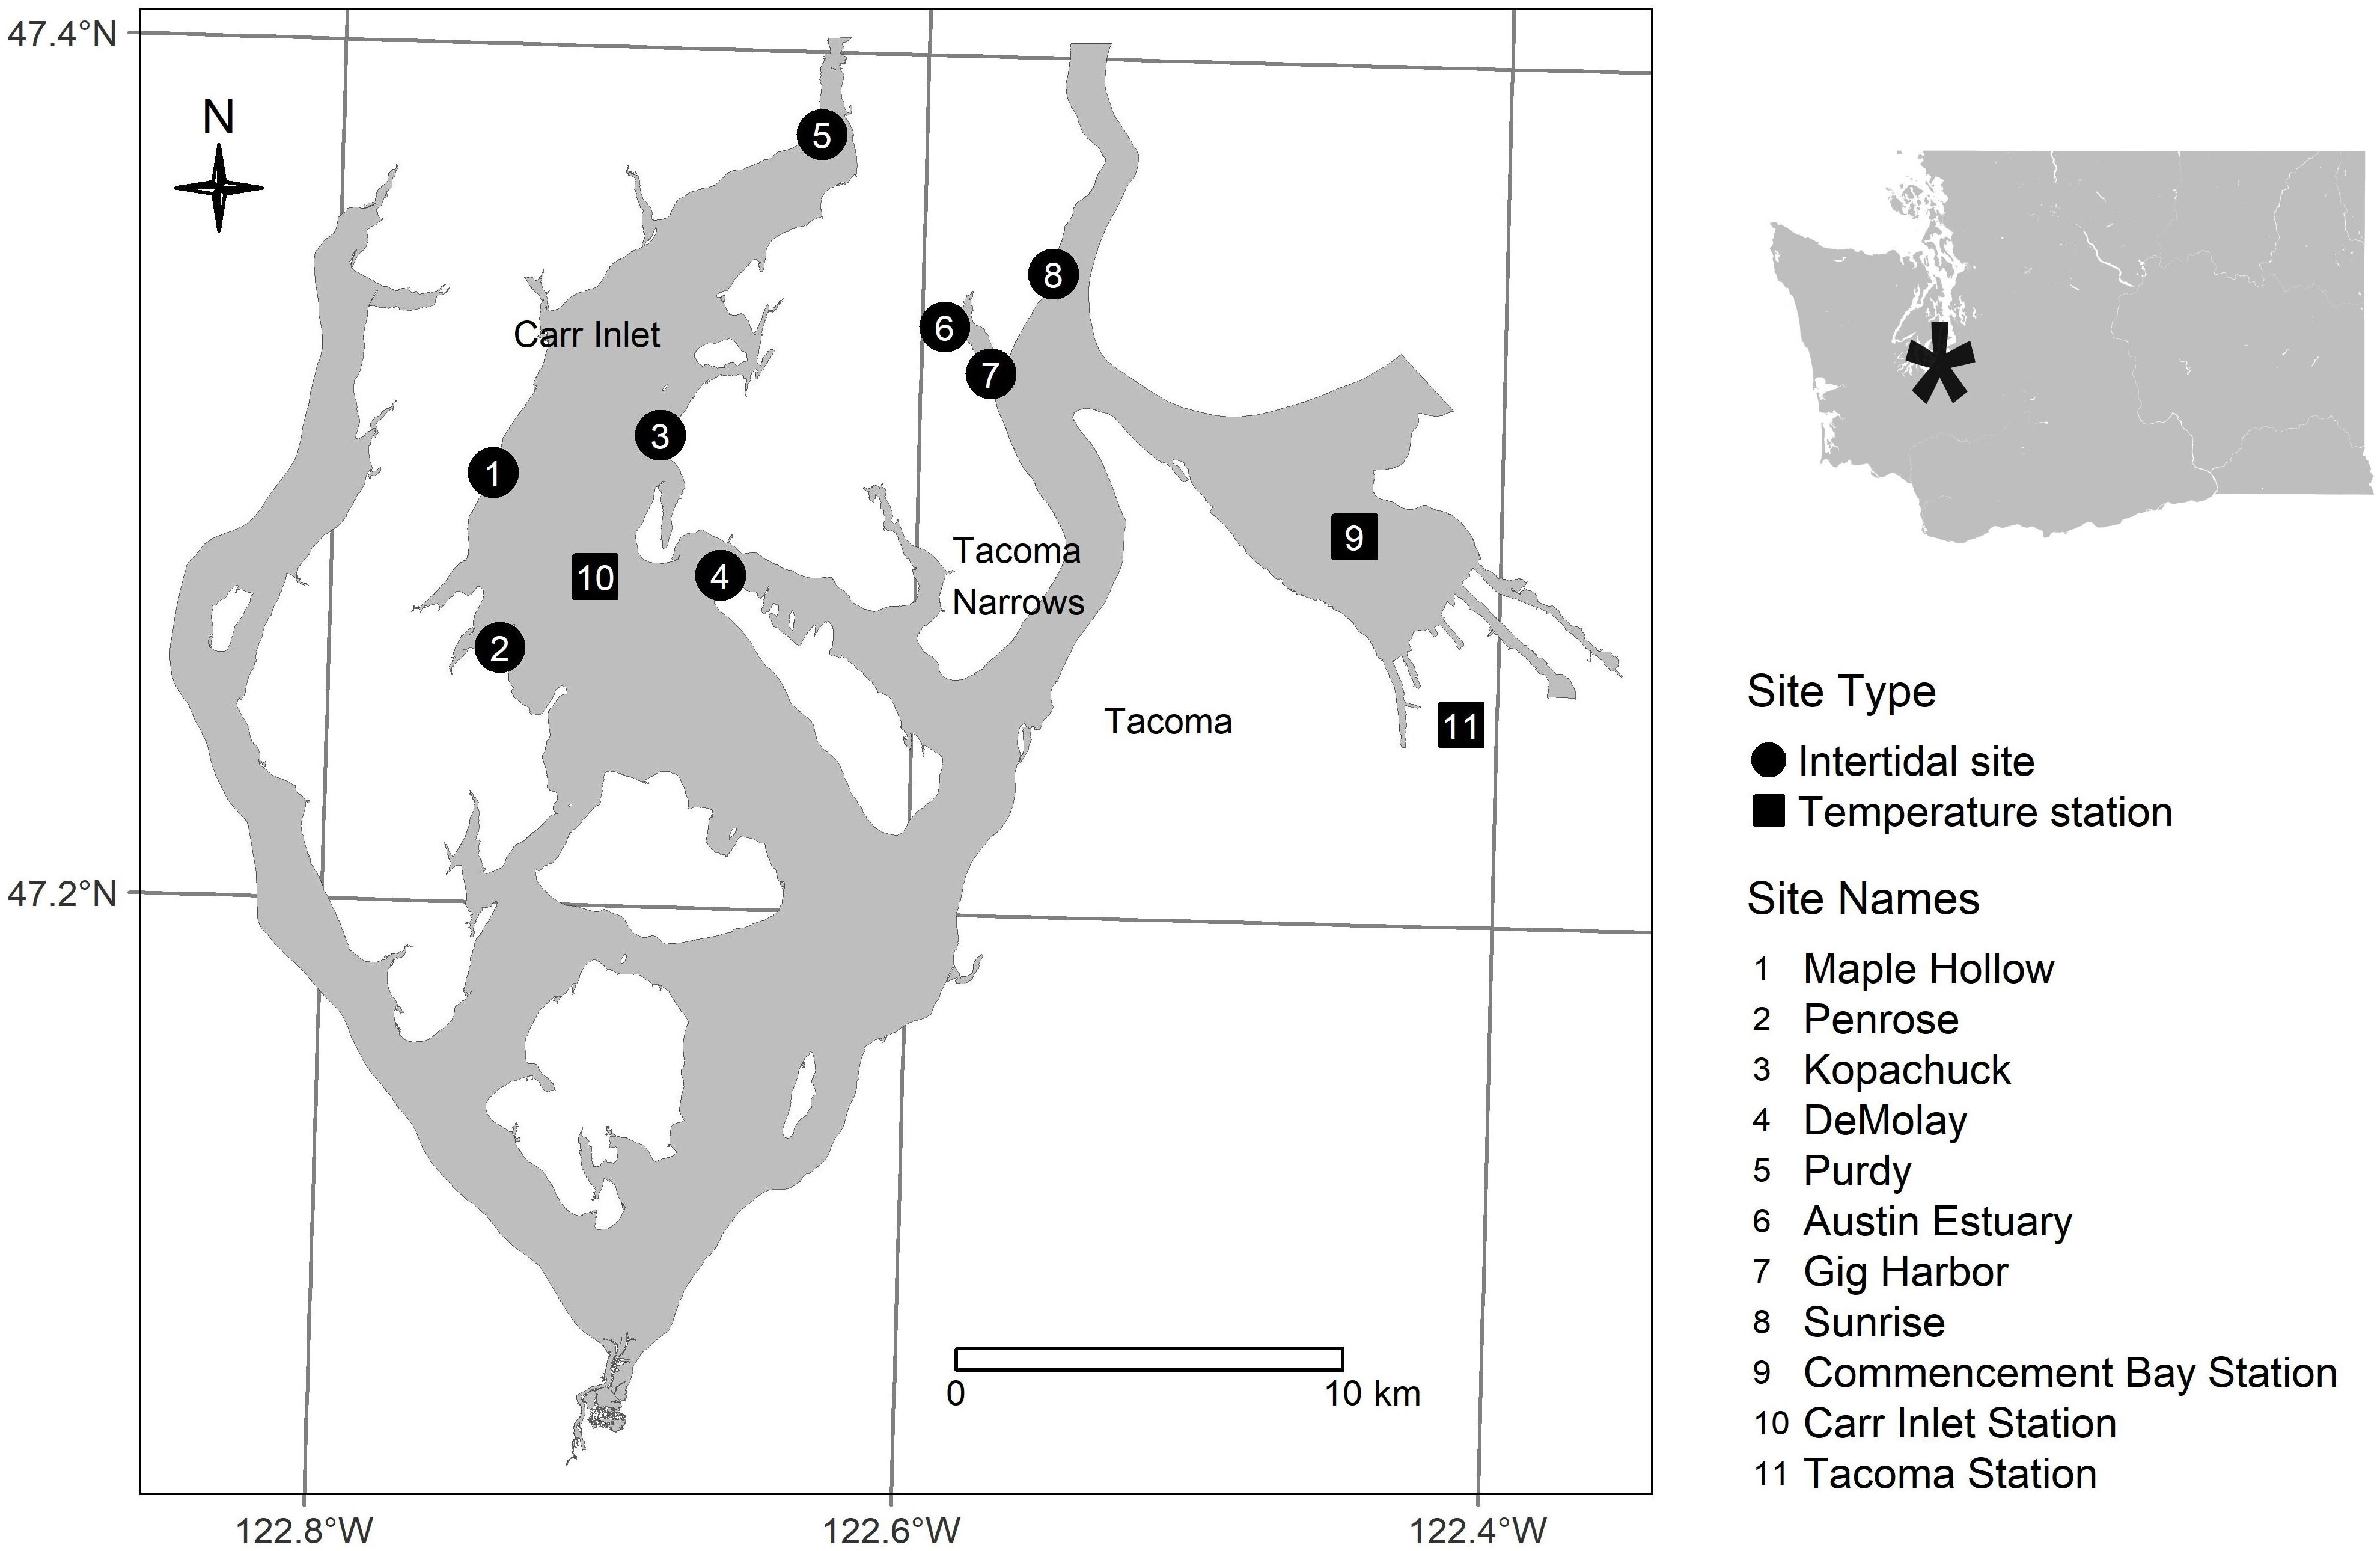
Figure 1 South Puget Sound, Washington (USA) showing intertidal survey sites, stations for monthly measurements of water temperature, and station for hourly measurements of air temperature.
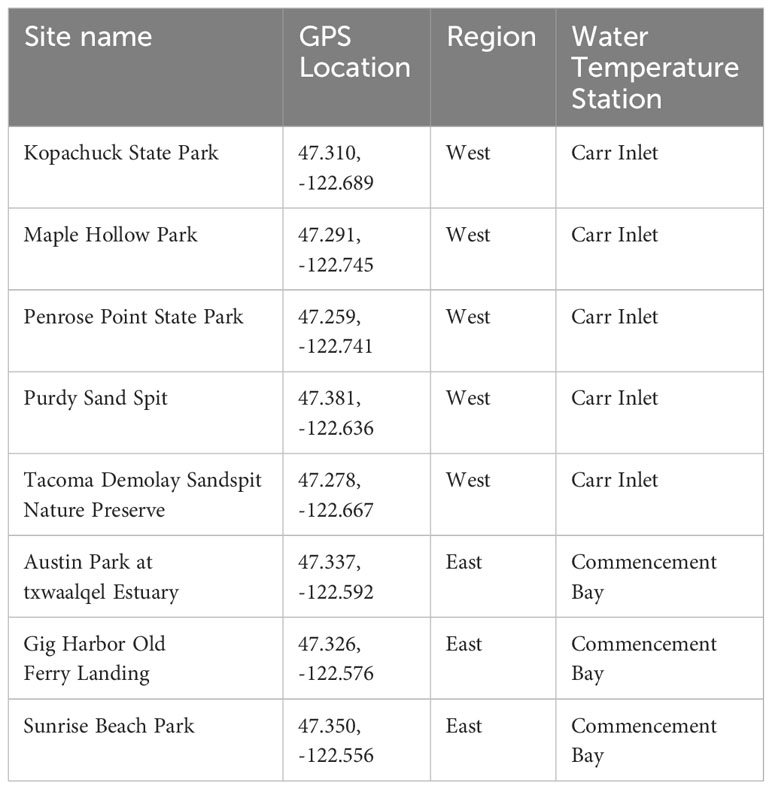
Table 1 Beach monitoring site names, GPS locations, and corresponding water temperature stations used in the study.
The active aquaculture and enhancement of Pacific oysters in south Puget Sound could serve as broodstock for recruitment in the region but not as a direct source of outplanted oysters at our study sites. The Washington Department of Fish and Wildlife (WDFW) has created oyster enhancement plots at both Penrose and Kopachuck, where seeded cultch is placed nearly annually. Our study sites at these two beaches were sufficiently separated from the WDFW enhancement sites that no settled oysters from the WDFW sites would move to our sites. At Penrose, all our transects were more than 100 meters from the WDFW site and separated from it by a small point and spit. At Kopachuck, all transects were more than 250 meters from the Kopachuck WDFW site. Thus, there is little anticipated impact on our study sites from WDFW stock enhancement activity.
2.2 Field data collection
2.2.1 Intertidal data
At each winter and summer sampling event, two types of data were collected on Pacific oysters: counts per quadrat and shell height. No Pacific oysters were ever found in the eastern region during our whole study period. At each sampling event, five 0.25 m2 quadrats were placed along a transect of 12.5 m at each of two tidal heights (+0.3, +1.5 m MLLW) (Figure 2). So, each site had 10 samples, five in the mid- and five in the upper-intertidal range. Transects were placed randomly on the beach, not in extant oyster beds, and maintained the same location, within a few meters, throughout all sampling dates. Pacific oysters were counted in each quadrat, and these counts were used to determine site-level densities at each time point. At Penrose beginning in summer 2019, transects covered a larger area and included 10 quadrats per elevation (20 samples per site), and then from summer 2020 onward they included 15 quadrats per elevation (30 samples per site). Mean oyster density (0.25 m-2) was calculated at each of the five western sites for each data collection date (twice annually) and for each tidal elevation (+0.3, +1.5 m MLLW), providing 10 independent samples (transects) at each sample date. Descriptive statistics were calculated for the western region at each sample date (mean, standard error, sample size), as well as in the eastern region where no Pacific oysters were found in quadrats.

Figure 2 Image of a 0.25 m2 quadrat containing Pacific oysters (Magallana gigas) taken at Kopachuck State Park, 1.5 m tidal height, on 8 June 2020. The tape marking the transect line is visible in the center of the quadrat.
Measurements of oysters were made in the same vicinity as transects at each western site but not necessarily in quadrats. Up to about 100 individuals were measured along the longest shell axis (= shell height, nearest 1 mm). To sample oyster heights, surveyors started at a random location on the beach with oysters present and measured every oyster along that tidal elevation until approximately 100 measurements were met, or there were no more oysters present. When no oysters were present in that location, a new location was chosen among those not previously sampled until approximately 100 oysters were measured. Oyster shells were inspected for small recruits, as well as all sizable rock surfaces, to avoid bias towards larger, more obvious individuals. While there were Olympia oyster (Ostrea lurida) beds in these regions, our sample site tidal heights were too high for Olympia recruits, and Olympia oysters were not found in these quadrats throughout the study period.
2.2.2 Air temperatures
Air temperatures were measured hourly in Tacoma, east of the study locations, within 26 km of every beach site and water temperature station (National Weather Service; Climate (weather.gov)). Mean monthly temperatures were downloaded for July and August, and summer air temperature for each year was defined as the mean of July and August temperatures.
2.2.3 Water temperatures
Surface water temperatures were measured monthly at two stations close to the study sites through a monitoring program by the Washington Department of Ecology (apps.ecology.wa.gov/eim/search). We used the mean temperature in the top three m on the August collection date at each station to describe annual summer water temperature from 2012 through 2020. The Commencement Bay station was associated with the eastern region. The Carr Inlet station was associated with the western region (Figure 1; Table 1). No water temperature data were collected in August 2020, and these were interpolated from the positive linear relationship between water and air temperature for the years 1999-2021, calculated at 15.3° C at the western side (F(1,16)=14.93, R2 = 0.45, p<0.01), and 13.4° C at the eastern side for August 2020 (F(1,20)=35.45, R2 = 0.62, p<0.01).
2.3 Data analysis
2.3.1 Recruitment
Beach surveys occurred at eight sites annually, but these were distributed in two regions of different water temperature, east and west, and we considered each region as a sample. The overall approach was 1) define the fraction of recruits at each site based on shell height measurements, 2) multiply recruit fraction by oyster density in quadrats to determine site-level density of recruits, 3) choose the maximum between recruitment calculated in winter and summer as the site-level recruitment magnitude for the prior summer, 4) calculate mean recruitment magnitude across sites in each region (which was always zero in the eastern region), 5) in order to use a Quasi-Poisson model, which requires integer values, scale these recruitment estimates to a beach area in which an integer number of recruits would appear, and 6) relate regional recruitment to water temperature, with region as an additional predictor.
For step one, we applied a clustering algorithm to size-frequency distribution of oysters [Mclust package (v5.4.7, Scrucca et al., 2016) in R (R Core Team, 2020)] to statistically determine the number of Gaussian distributions that best described the data while accounting for model complexity. If a cluster was identified with a mean shell height<35 mm, these were considered recruits (Figure 3). Recruits were also identified as the first appearance of oysters at any site. The fraction of recruits was multiplied by oyster density in quadrats to estimate recruit density in quadrats (step two). In the years we estimated recruitment to have occurred, our estimates were supported by observation of small oysters settled on hard substrate, visually identified as recruits.
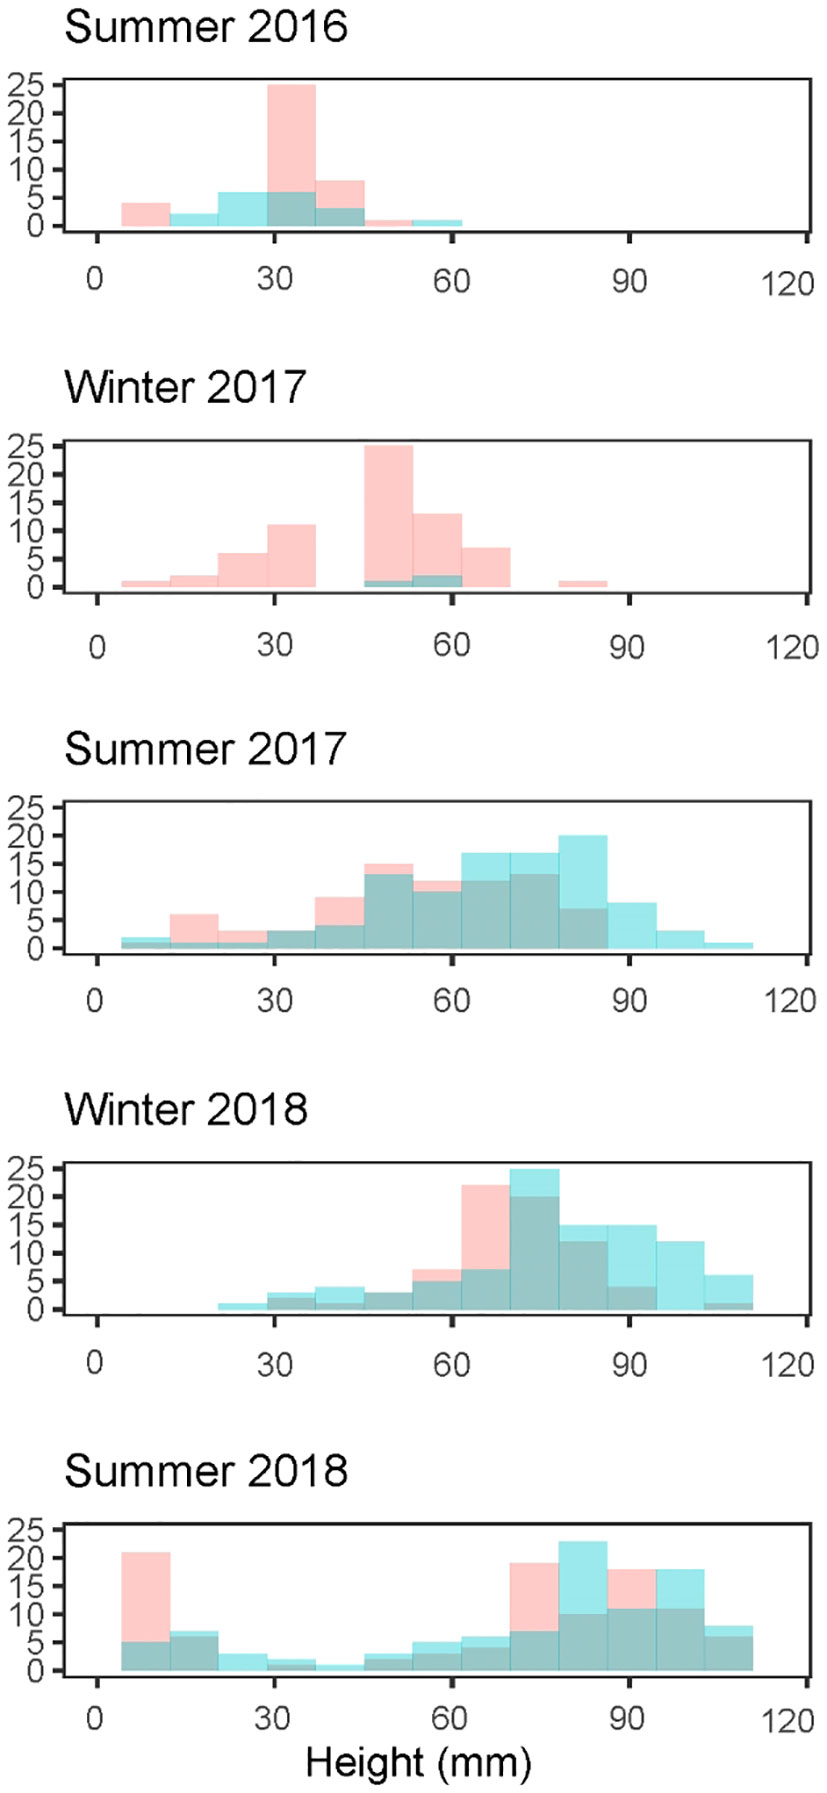
Figure 3 Size frequency histograms of Pacific oysters (Magallana gigas) at Kopachuck State Park (red) and Maple Hollow Park (blue), in south Puget Sound, Washington. Histograms show evidence of multiple recruitment cohorts.
Step three was necessary because recruitment was not apparent in beach sampling until the following winter or summer, when oysters were large enough to observe. The maximum of these two estimates of recruit density was used to define the previous year’s recruitment magnitude. In step four, the mean recruit density across all the western sites for each year was calculated. We chose to use a Quasi-Poisson model due to the large number of zero-recruitment years. To use a Quasi-Poisson model, which requires integer values, in step five we scaled the mean recruit density from step four to recruits per 10 m2 because recruits were scarce at one m2. Specifically, density 0.25 m-2 was multiplied by 40 and rounded to the nearest integer. Recruitment never occurred at the eastern sites, so the recruitment magnitude estimate for the eastern sites was always zero. Annual recruitment magnitude was the response variable, and summer temperature and region were fixed effects in a Quasi-Poisson regression model.
2.3.2 Density
We explored several possibilities regarding post-recruitment oyster density. A continuous increase in oyster density over time would suggest continued recruitment after the initial event. An overall decrease in density after the initial event would signal a pattern of one large recruitment with minimal later recruitment. Different density patterns over time at each site could reflect differing survival at each site. To explore these options, we conducted Poisson regression analysis with density of oysters as the response variable, and with site, time since initial recruitment, and their interaction as fixed effects. The sample size for this model was two transects at each of the five western sites from summer 2015 to summer 2021. We used a model comparison approach (Akaike’s Information Criterion, adjusted for small sample size) to determine which fixed effects to maintain in the model.
2.3.3 Size
Three sites, Kopachuck, Maple Hollow, and Penrose, had recruitment events in both 2015 and 2017. Mean shell heights were calculated in winter of 2017 and 2020 after removing individuals likely to have originated from recruitment after 2015 from the analysis. Specifically, oysters <60 mm were dropped from the 2020 analysis. The 60 mm cut-off was chosen because the clustering algorithm identified multiple clusters at Maple Hollow in 2020, and 60 mm was the largest shell height in the smallest size class. No oysters were removed from the 2017 analysis because the clustering algorithm identified a single size class at each site in 2017. We used t-tests to compare the mean oyster sizes between different sites in the same year and the same site in different years to gain insight into growth rates.
3 Results
3.1 Recruitment
No Pacific oysters (Magallana gigas) occurred at any of our study sites in south Puget Sound prior to the winter of 2016 (Figure 4). In 2016, oysters appeared at all five of the western sites as a single cohort identified by a clustering algorithm (Table 2). These oyster appearances would be due to settlement in the previous year (2015), after three survey years with no evidence of any earlier recruitment. After the first recruitment event at the five western sites in 2015, recruitment occurred (based on observations of recruits in the following year) in all years except 2016 and 2018. Oysters were never recorded at any of the three eastern sites. While there were WDFW oyster enhancement plots at Penrose and Kopachuck, we are confident that the enhancement sites did not impact our study due to the distance and barriers between our study transects and the enhancement sites. Additionally, the WDFW plants only spat on shells, but we did not see any spat on shells in any of our transects in the original waves of recruitment. In these waves, we saw only spat on rock or on barnacles. This indicates that the recruits we observed were there due to larval dispersal rather than physical transport out of the enhancement areas. Only after there were large adults on the transects did we see spat on shell, and even that was predominated by spat on the outside of the shell instead of spat on the nacreous layer as is most common in enhanced areas. Additionally, no adult Pacific oysters were observed at either of the sites with WDFW enhancement plots when the transects were established and for the first two years of the monitoring period, when active enhancement was occurring.
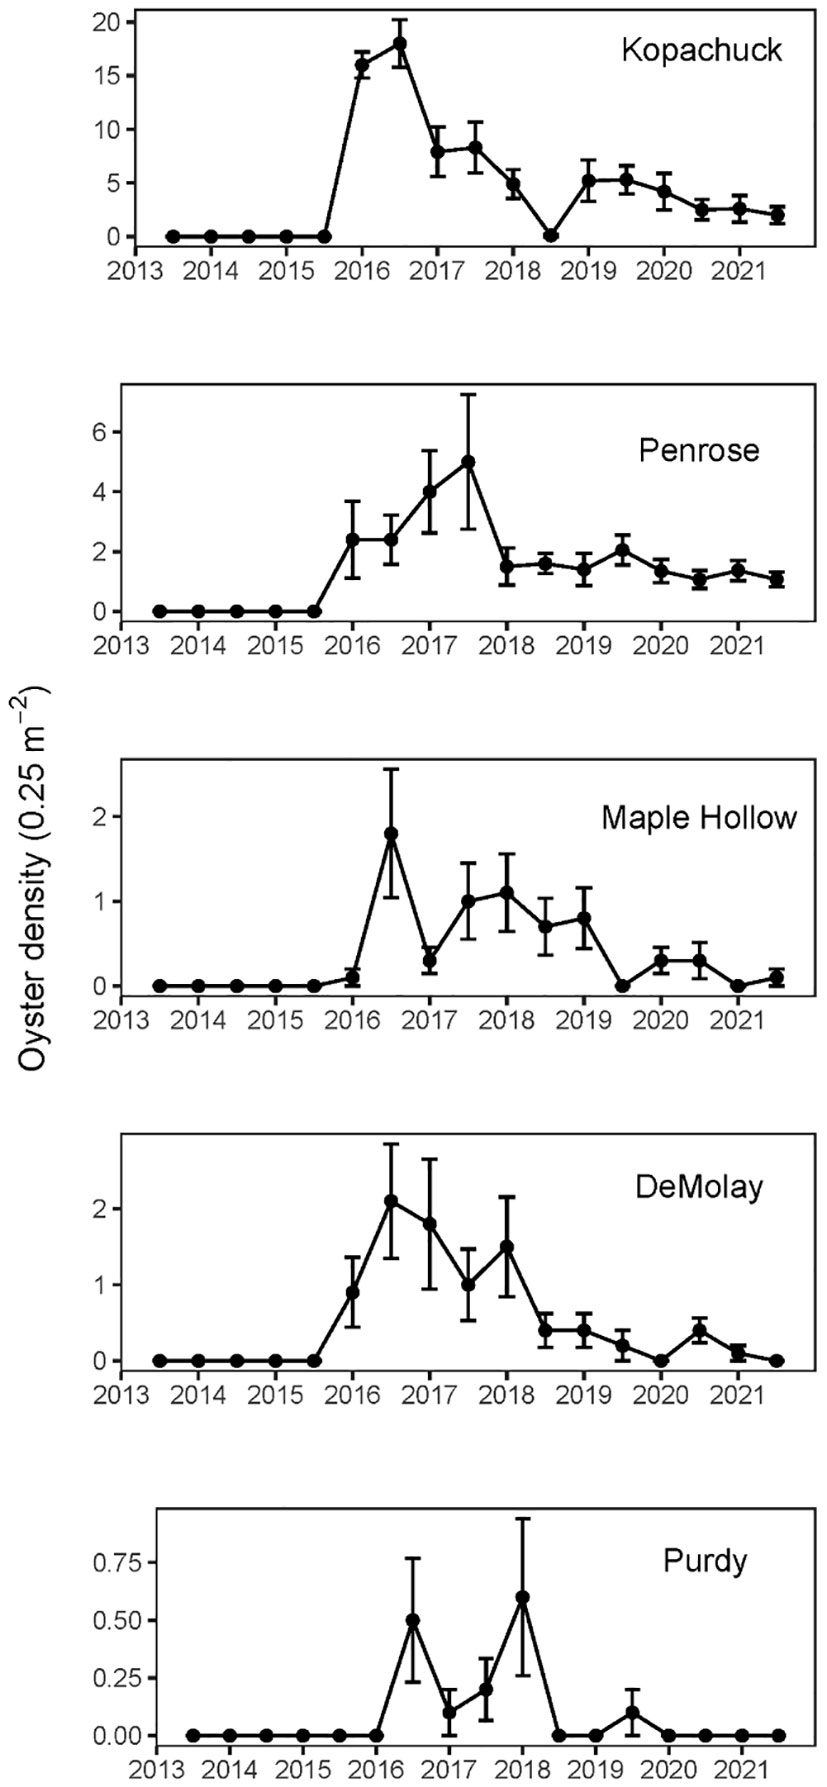
Figure 4 Mean Pacific oyster (Magallana gigas) density per 0.25 m2 quadrat measured twice annually at each of the five western (warmer) sites in south Puget Sound, Washington, from summer of 2013 to summer of 2021. At each of the sites, error bars show standard error of ten quadrats, five at 0.3 m and five at 1.5 m tidal elevation relative to mean lower low water (N=10). Penrose Point State Park time series shows only the original ten quadrats. No oysters appeared at the three eastern (cooler) sites.

Table 2 Beach sites and the years in which recruitment occurred at those sites (the summer six to twelve months before recruits were observed).
Summer water temperatures were typically warmer near the western than eastern sites (western mean=15.7° C, eastern mean=14.0° C, t(18)=6.1, p<0.001) (Figure 5). Surface water temperatures on the western side usually exceeded 15° C in summer and were reliably 1 to 2° C warmer than on the eastern side. Both stations were similar in having their warmest temperatures during the study period in 2014-2015. The warmest air temperature in the study period was also in 2015. The 2014-2015 warm water event could be attributed to the Blob marine heatwave in the eastern Pacific off the coast of North America, which occurred between 2013 and 2016. The air was relatively warm in 2017-2018 but the point temperatures for water did not track this pattern of elevated air temperatures.

Figure 5 Mean summer air temperatures and mean water temperatures in south Puget Sound, Washington, during the study period. Western (Carr Inlet) and eastern (Commencement Bay) stations are divided by a peninsula, with the western station deeper into Puget Sound. Intertidal surveys in the western and eastern region were collected within 13 km of the western and eastern water temperature stations, respectively. Water temperatures are shown as the mean for measurements taken at 0.5 m, 1.0 m, 1.5 m, 2 m, 2.5 m, and 3 m depth from the surface on one day in August each year. Air temperature, collected hourly in Tacoma, Washington, is shown as the mean for July and August.
We found that increased August surface water temperature was associated with increased oyster recruitment magnitude (Quasi-Poisson regression, McFadden Pseudo- R2=0.41, df=15, p=0.03; Figure 6). The recruitment analysis used mean small oyster density over an entire region, not each individual site, because there was only one water temperature station available in each region. Each additional degree C in summer water temperature was associated with an increase in recruitment magnitude by a factor of 5.67 (Figure 6). Using another Quasi-Poisson model with region as an additional predictor, we found that region was not a significant additional predictor of recruitment magnitude (Quasi-Poisson regression, McFadden Pseudo-R2=0.43, df=1, p>0.99). The following equation describes the relationship estimated through Quasi-Poisson regression between water temperature and number of recruits per 0.25 m2:

Figure 6 Recruitment of Pacific oysters (Magallana gigas) per 10 m2 in relation to August water temperature. Each data point is the mean of observed recruitment across two transects at three eastern or five western sites. Line represents expected mean recruitment across three eastern or five western sites calculated with a Quasi-Poisson regression model based on temperature.
Where r represents the estimated number of recruits per 0.25 m2 and t represents temperature in degrees C. This model estimates that there would be more than one recruit per 0.25 m2 at a water temperature at or above 16.4° C.
3.2 Density
Our density analysis showed evidence of one large recruitment event followed by decreases in density along with evidence of different recruitment but similar survival across sites. The mean density of Pacific oysters of any size among the western sites reached a maximum of 4.96 oysters per 0.25 m2 in the summer of 2016, six months after the first appearance outside of aquaculture and WDFW enhancement sites. Densities then generally decreased over the next few years (Poisson regression, time coefficient=-0.24671, df=118, p<0.001), despite evidence of low levels of additional recruitment (Figure 4). Models with and without inclusion of the site by time interaction had similar AIC values (AICc=1629 in both cases), so the simpler model without the interaction was preferred. Purdy had lower overall oyster density than the other sites (Poisson regression, df=118, Purdy coefficient=-1.63184, Purdy SE=0.27937). Kopachuck, which had by far the largest initial recruitment event, maintained the largest total oyster density at the end of the study (Figure 4).
3.3 Size
Post-recruitment oyster sizes varied across sites. Mean oyster shell heights were calculated in 2017 and 2020 at Maple Hollow, Kopachuck, and Penrose, excluding oysters that were obviously new recruits and therefore only tracking growth of the large cohort from 2015. Shell height was higher at Maple Hollow than at Penrose in 2017 [t(40)=-4.12, p=0.001] (Figure 7). Mean shell height between Maple Hollow and Kopachuck in 2017 was the same [t(95)=-1.60, p=0.1], as was mean shell height between Kopachuck and Penrose [t(57)=-0.74, p=0.5] (Figure 7).
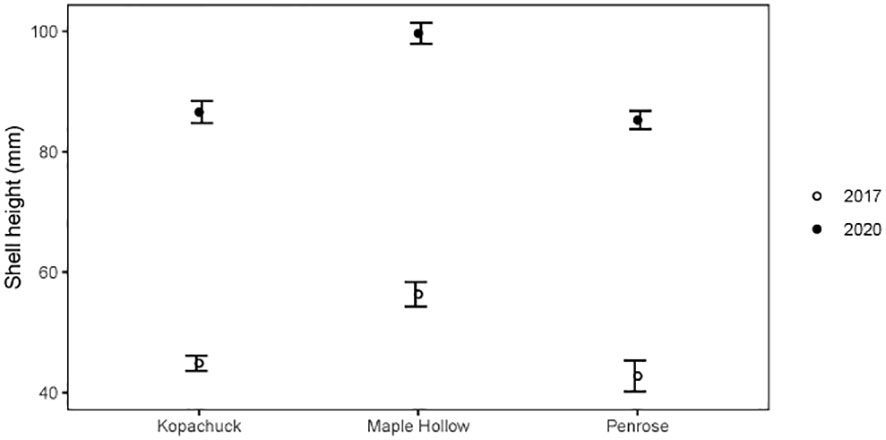
Figure 7 Size of Pacific oysters (Magallana gigas) in winter 2017 and winter 2020 at three sites in south Puget Sound, Washington. Each data point represents the mean height of oysters measured (up to ~100), excluding those that were likely new recruits (the smallest size class identified with a clustering algorithm or<60 mm in length in 2020). Error bars show standard error.
In 2020, oyster size also differed by site (Figure 7). The mean shell height at Maple Hollow was significantly higher than that of Kopachuck [t(134)=-5.20, p<0.001] and that of Penrose [t(176)=-6.23, p<0.001], while Kopachuck and Penrose had the same mean shell height in 2020 [t(148)=0.56, p=0.6]. Maple Hollow had a significant increase in mean shell height between 2017 and 2020 [t(74)=-5.07, p<0.001], as did Kopachuck [t(155)=-19.33, p<0.001] and Penrose [t(183)=-13.09, p<0.001], which is strong evidence that some oysters from the initial recruitment event survived for the entire study period.
4 Discussion
This study suggests that in areas where cooler water temperatures once restricted invasion by inhibiting spawning and larval survival, rising water temperatures may induce spawning and support the establishment of non-native marine species. High summer water temperatures in the years of the Blob marine heatwave could have initiated spawning or facilitated larval survival and supported wild recruitment of Pacific oysters in a region where the oyster has been grown for many decades in aquaculture and mariculture. Of our study sites, those with warmer water conditions all experienced recruitment and those with colder water conditions did not show evidence of recruitment. These results could be due to water temperatures passing the threshold for spawning, or they could be caused by larval dispersal from elsewhere with survival increased at warmer temperatures.
Higher summer water temperatures in our study were correlated with higher recruitment. Oyster recruit density in our study was estimated to increase by a factor of 5.67 per additional degree C in summer water temperature. These results support the hypothesis that Pacific oyster recruitment is correlated with water temperature and suggest that the Blob marine heatwave, which caused significantly elevated water temperatures in the Salish Sea from 2014-2017 (Khangaonkar et al., 2021), facilitated recruitment of Pacific oysters. While this study is the first to explore the influence between the elevated temperatures during the Blob heatwave and Pacific oyster recruitment in south Puget Sound, the relationship we found between recruitment and temperature mirrors results from other regions, including nearby Hood Canal, Washington, and the French Atlantic coast, along with a laboratory study. Specifically, Valdez and Ruesink (2017) found that Pacific oyster spat counts on shells from 1942 to 1992 increased by a factor of six for each additional degree C in water temperature. Hood Canal water temperatures were consistently a few degrees warmer than temperatures during our study period in south Puget Sound and were occasionally much warmer, above 22° C. In a study of Pacific oyster invasion on the French Atlantic coast, the magnitude of Pacific oyster recruitment was found to be positively correlated with warmer water temperature (Dutertre et al., 2010).
While our model agrees with previous literature in the positive relationship it shows between temperature and recruitment, it predicts far lower survival and settlement than other studies. Our model predicts that at 17° C, recruit densities would be two to three per 0.25 m2. The highest recruitment densities seen in our study were 18 recruits per 0.25 m2 at Kopachuck after the summer of 2015 at a recorded water temperature of 16.4° C. So, this level of recruitment at least must be possible with the typical concentration of larvae in the water column. Thus, our model’s predicted two to three recruits per 0.25 m2 likely represents a survival rate much lower than the 80% survival observed in Rico-Villa et al. (2009). The lower survival rates in this study could be due to lower food availability, among other possible factors [Rico-Villa et al. (2009) laboratory study provided larvae consistently more phytoplankton than could be consumed]. Another possible factor is suitable habitat availability. Larvae usually settle on oyster shells, and we did not observe recruits settled on shells in our transects until later in our study period, after the first wave of recruits had matured. In the earlier waves of recruitment, most recruits were settled on rock or barnacles.
Growth rates of newly established species can be dependent on density as well as site-specific environmental factors. Oyster shell heights in this study varied by site and these differences could have been due to a combination of differences in growth rate and/or different rates in recreational harvest. Of the three sites for which we analyzed post-recruitment oyster size, Maple Hollow consistently had the largest oysters. Larger oysters could reflect faster shell growth, although recreational harvest could have removed the largest oysters and contributed to smaller observed sizes at the other two sites, rather than oysters at these sites being growth-limited. Washington state legislature allows shucking of oysters at a minimum widest dimension of 63.5 mm. Recreational harvest is allowed at all three sites analyzed for size, but only Kopachuck and Penrose are in Department of Health Approved areas, whereas harvest is not advised at Maple Hollow. Recreational harvest levels could differ at the three sites. However, the density trends were similar across sites and not consistent with differential mortality due to harvest. Thus, we believe it is more likely that size differences may be due to environmental factors influencing oyster growth, including chlorophyll concentration, water temperature, and salinity (Brown, 1988a). Any of these factors could have been different between the three sites used in our size analysis and could have partially caused the suggested growth rate differences.
Our study supports the hypothesis that when conditions necessary for larval survival, such as ideal temperatures, are only occasionally available, species can experience one large recruitment event in a favorable year followed by minimal recruitment afterward. Regarding post-recruitment oyster survival, mean oyster density across all five western sites in this study peaked six months after initial appearance in our transects in the summer of 2016, followed by a gradual decline (Figure 4). Poisson regression analysis showed that time since the initial western recruitment event in 2015 had a significant effect on oyster density per quadrat, but site did not affect the density patterns over time, suggesting similar survival across sites but different initial recruitment. Differences in initial recruitment numbers could have been due in part to proximity to source populations. The two sites with the highest initial recruitment levels were Kopachuck and Penrose; these two sites are closest to large aggregations of enhanced Pacific oyster populations. Specifically, the largest pre-existing Pacific oyster beds in our study area are at Penrose, Kopachuck, one location 6 km from Kopachuck and from Purdy on the west side of Carr Inlet, and another location on the inside of the spit where Purdy is located. There are also some small populations 5 km across Carr Inlet from Kopachuck. Most of the possible source populations in the area are on the west side of Carr Inlet, and all are in the western region. Because Pacific oyster larvae have been predicted to be capable of dispersing up to 50 km from a source population (Robins et al., 2017), and Kornbluth et al. (2022) uses 30 km as an upper limit in a model of Pacific oyster dispersal, we suggest that local farmed and enhanced populations of Pacific oysters were capable of seeding the wild populations recorded in this study. Without finer scale studies of currents in Carr Inlet and the Tacoma Narrows region than currently exist, we cannot judge the impact of current flow on the different initial recruitment levels in our study.
Some sites had overall higher density than others; Kopachuck had the largest initial recruitment event and was still highest in density at the end of the study. This initial invasion pattern matches other documented Pacific oyster invasion trajectories (Reise et al., 2017). While Pacific oysters have been grown in aquaculture in the region for over 100 years, this invasion of oysters in the wild in south Puget Sound is very new and is likely still in the “establishment phase,” as described in Reise et al. (2017) in the northern Wadden Sea. In that region, the Pacific oyster invasion began in the 1990s, when summer water temperatures remained cold and often inhibited widespread recruitment. These cold summer temperatures led to a decade of the establishment phase, where recruitment was low-level and varied as summer temperatures allowed. Warm summers after the establishment phase in the northern Wadden Sea allowed densities to surpass 1000 m-2, much higher than any densities seen in our south Puget Sound sites. This suggests that if south Puget Sound is poised to follow a similar trajectory, a period of warmer summers could drastically increase Pacific oyster abundances.
Based on our findings, we predict that future warm summers with mean water temperatures above 16 to 17° C will lead to further recruitment and larger established populations of Pacific oysters. Changing climate is predicted to lead to increased temperature abnormalities such as the Blob heat wave that occurred during our study period (Laufkotter et al., 2020). Although climate change induced marine heat waves may facilitate Pacific oyster invasion, it is important to note that overall warming temperatures may not be beneficial to Pacific oyster populations. Extreme high atmospheric temperatures can be harmful to shellfish as was seen in June 2021 when a regional atmospheric heat wave coinciding with record low tides caused mass mortality among intertidal shellfish (Raymond et al., 2022). Following the atmospheric heat wave, there was widespread mortality of Pacific oysters at all the study sites where they were present. The oysters now rarely appear in quadrats and collecting size data is no longer practical due to low sample sizes (M. Behrens, personal observation, August 2023). The balance between warming that facilitates reproduction without causing mass mortality will influence the future trajectory of wild Pacific oyster populations in south Puget Sound. Future studies modeling potential establishment trajectories of Pacific oysters in this region would benefit from consideration of other factors influencing recruitment, including salinity, which may be altered by climate change.
Bivalves, including Pacific oysters, are established ecosystem engineers (Sousa et al., 2009), and an invasive population of Pacific oysters in south Puget Sound will alter the native ecosystem. Possible changes in the native ecosystem due to Pacific oyster invasion include: competition with native oysters, alteration of food webs, increased biodiversity, and increased human foot traffic. For example, invasive Pacific oysters populations in south Puget Sound could compete with the native populations of Olympia oysters, as was seen in Willapa Bay, Washington (Trimble et al., 2009). Pacific oyster reefs could provide habitat for epifauna, increasing biodiversity, and provide foraging opportunities for migratory birds, as seen in northern Patagonia (Escapa et al., 2004). Larger oyster populations could also provide more opportunities for recreational harvest, increasing foot traffic in locations with oyster beds.
Not only will climate change likely aid Pacific oyster invasion, but climate change is expected to favor species invasion in general (Stachowicz et al., 2002; Ward and Masters, 2007). Pacific oysters globally are expanding their range poleward as water temperatures warm (King et al., 2021). Our results from Puget Sound, a basin kept cool by inflow from the Strait of Juan de Fuca in the north, suggest that warming may not simply move species poleward but also into regions kept cool by deep water intrusions from the coast. We can expect that in areas where low temperatures have previously prevented the establishment of non-native species, increased temperatures in the future will enable species invasion.
Data availability statement
The raw data supporting the conclusions of this article will be made available by the authors, without undue reservation.
Ethics statement
The manuscript presents research on animals that do not require ethical approval for their study.
Author contributions
EB: Conceptualization, Formal Analysis, Funding acquisition, Software, Visualization, Writing – original draft. JR: Conceptualization, Funding acquisition, Supervision, Writing – review & editing. ST: Funding acquisition, Investigation, Writing – review & editing. MB: Conceptualization, Funding acquisition, Investigation, Writing – review & editing.
Funding
The author(s) declare financial support was received for the research, authorship, and/or publication of this article. This work was supported by the Washington NASA Space Grant, the Mary Gates Endowment for Students, the Rose Foundation for Communities and the Environment, the National Estuary Program, the Coastal Conservation Fund, Pierce County, Lu Winsor, the Melinda Grey Ardia Environmental Grant Program, Pierce Conservation District, and the Puget Soundkeeper Alliance.
Acknowledgments
We would like to thank Harbor WildWatch for their contribution of community science data, along with the 771 community scientists who collected data from 2013-2021. Water temperature records were supplied by Julia Bos at the Washington State Department of Ecology. We would like to thank the parks for providing access for community science: WA State Parks, KeyPen Parks, Pierce County, and PenMet Parks.
Conflict of interest
The authors declare that the research was conducted in the absence of any commercial or financial relationships that could be construed as a potential conflict of interest.
Publisher’s note
All claims expressed in this article are solely those of the authors and do not necessarily represent those of their affiliated organizations, or those of the publisher, the editors and the reviewers. Any product that may be evaluated in this article, or claim that may be made by its manufacturer, is not guaranteed or endorsed by the publisher.
References
Babson A. L., Kawase M., MacCready P. (2005). Seasonal and interannual variability in the circulation of Puget Sound, Washington: a box model study. Atmos. Ocean. 44, 29–45. doi: 10.3137/ao.440103
Barnes C. A., Lincoln J. H., Rattray M. Jr. (1954). An oceanographic model of Puget Sound. (Seattle: University of Washington Department of Oceanography).
Bertelsmeier C., Luque G. M., Courchamp F. (2013). Increase in quantity and quality of suitable areas for invasive species as climate changes. Conserv. Biol. 27, 1458–1467. doi: 10.1111/cobi.12093
Bond N. A., Cronin M. F., Freeland H., Mantua N. (2015). Causes and impacts of the 2014 warm anomaly in the NE Pacific. Geophys. Res. Lett. 42, 3414–3420. doi: 10.1002/2015GL063306
Brown J. R. (1988a). Multivariate analyses of the role of environmental factors in seasonal and site-related growth variation in the Pacific oyster Crassostrea gigas. Mar. Ecol. Prog. Ser. 45, 225–236. doi: 10.3354/meps045225
Brown J., Hartwick E. B. (1988b). Influences of temperature, salinity, and available food upon suspended culture of the Pacific oyster, Crassostrea gigas: II. condition index and survival. Aquaculture. 70, 253–267. doi: 10.1016/0044-8486(88)90100-7
Chavez-Villalba J., Arreola-Lizarraga A., Burrola-Sanchez S., Hoyos-Chairez F. (2010). Growth, condition, and survival of the Pacific oyster Crassostrea gigas cultivated within and outside a subtropical lagoon. Aquaculture. 300, 128–136. doi: 10.1016/j.aquaculture.2010.01.012
Clements D. R., Ditommaso A. (2011). Climate change and weed adaptation: can evolution of invasive plants lead to greater range expansion than forecasted? Weed Res. 51, 227–240. doi: 10.1111/j.1365-3180.2011.00850.x
Decker K. (2015). “Patterns in the economic contribution of shellfish aquaculture,” in Shellfish Aquaculture in Washington State: Final Report to the Washington State Legislature. (Seattle, WA: Washington Sea Grant). 1–14.
Deng Y., Fu S., Liang F., Du X., Xie S. (2013). Growth and survival of Pearl oyster Pinctada maxima spat reared under different environmental conditions. J. Shellfish. Res. 32, 675–679. doi: 10.2983/035.032.0308
Diederich S., Nehls G. J. E. E., Van Beusekom J. E., Reise K. (2005). Introduced Pacific oysters (Crassostrea gigas) in the northern Wadden Sea: invasion accelerated by warm summers. Helgoland Mar. Res. 59, 97–106. doi: 10.1007/s10152-004-0195-1
Dutertre M., Beninger P. G., Barillé L., Papin M., Haure J. (2010). Rising water temperatures, reproduction, and recruitment of an invasive oyster, Crassostrea gigas, on the French Atlantic coast. Mar. Environ. Res. 69, 1–9. doi: 10.1016/j.marenvres.2009.07.002
Ebbesmeyer C. C., Word J. Q., Barnes C. A. (1988). “Puget Sound: a fjord system homogenized with water recycled over sills by tidal mixing,” in Hydrodynamics of Estuaries: Volume II Estuarine Case Studies. (Boca Raton, FL: CRC Press), 17–29.
Escapa M., Isacch J. P., Daleo P., Alberti J., Iribarne O., Borges M., et al. (2004). The distribution and ecological effects of the introduced Pacific oyster Crassostrea gigas. (Thunberg 1793) in northern patagonia. J Shellfish Res. 23, 765–772.
Khangaonkar T., Nugraha A., Yun S. K., Premathilake L., Keister J. E., Bos J. (2021). Propagation of the 2014-2016 northeast pacific marine heatwave through the Salish Sea. Front. Mar. Sci. 8, e787604. doi: 10.3389/fmars.2021.787604
King N. G., Wilmes S. B., Smyth D., Tinker J., Robins P. E., Thorpe J., et al. (2021). Climate change accelerates range expansion of the invasive non-native species, the Pacific oyster, Crassostrea gigas. ICES Mar. Sci. 78, 70–81. doi: 10.1093/icesjms/fsaa189
Kornbluth A., Perog B., Crippen S., Zacherl D., Quintana B., Grosholz E., et al. (2022). Mapping oysters on the Pacific coast of North America: a coast-wide collaboration to inform enhanced conservation. PloS One. 17, e0263998. doi: 10.2112/JCOASTRES-D-15-00146.1
Laufkotter C., Zscheischler J., Frolicher T. L. (2020). High-impact marine heatwaves attributable to human-induced global warming. Science. 369, 1621–1625. doi: 10.1126/science.aba0690
Mann R. (2009). Some biochemical and physiological aspects of growth and gametogenesis in Crassostrea gigas and Ostrea edulis grown at sustained elevated temperatures. J. Mar. Biol. Assoc. UK. 59, 95–110. doi: 10.1017/S0025315400046208
McAfee D., Connell S. D. (2021). The global fall and rise of oyster reefs. Front. Ecol. Environ. 19, 118–125. doi: 10.1002/fee.2291
McCabe R. M., Hickey B. M., Kudela R. M., Lefebvre K. A., Adams N. G., Bill B. D., et al. (2016). An unprecedented coastwide toxic algal bloom linked to anomalous ocean conditions. Geophys. Res. Lett. 43, 10, 366–10, 376. doi: 10.1002/2016GL070023
Michaud K. M., Reed D. C., Miller R. J. (2022). The blob marine heatwave transforms California kelp forest ecosystems. Commun. Biol. 5, 1143. doi: 10.1038/s42003-022-04107-z
Premathilake L., Khangaonkar T. (2022). Explicit quantification of residence and flushing times in the Salish Sea using a sub-basin scale shoreline resolving model. Estuar. Coast Shelf Sci. 276, 108022. doi: 10.1016/j.ecss.2022.108022
Quayle D. B. (1969). Pacific oyster culture in British Columbia (Ottawa: Department of Fisheries and Oceans).
R Core Team (2020). R: A language and environment for statistical computing. R Foundation for Statistical Computing, Vienna, Austria. Available at: https://www.R-project.org/.
Raymond W. W., Barber J. S., Dethier M. N., Hayford H. A., Harley C. D., King T. L., et al. (2022). Assessment of the impacts of an unprecedented heatwave on intertidal shellfish of the Salish Sea. Ecology. 103. doi: 10.1002/ecy.3798
Reise K., Buschbaum C., Büttger H., Rick J., Wegner K. M. (2017). Invasion trajectory of Pacific oysters in the northern Wadden Sea. Mar. Biol. 164, 1–14. doi: 10.1007/s00227-017-3104-2
Ren J. S., Ross A. H. (2001). A dynamic energy budget model of the Pacific oyster. Crassostrea gigas. Ecol. Mod. 142, 105–120. doi: 10.1016/S0304-3800(01)00282-4
Rico-Villa B., Pouvreau S., Robert R. (2009). Influence of food density and temperature on ingestion, growth and settlement of Pacific oyster larvae. Crassostrea gigas. Aquaculture. 287, 395–401. doi: 10.1016/j.aquaculture.2008.10.054
Rico-Villa B., Woerther P., Mingant C., Lepiver D., Pouvreau S., Hamon M., et al. (2008). A flow-through rearing system for ecophysiological studies of Pacific oyster Crassostrea gigas larvae. Aquaculture. 282, 54–60. doi: 10.1016/j.aquaculture.2008.06.016
Robins P., King J., Jenkins S., Tita A. (2017). Predicting the dispersal of wild Pacific oysters Crassostrea gigas (Thunberg 1793) from an existing frontier population—a numerical study. Aquat Invasions. 12, 117–131. doi: 10.3391/ai.2017.12.2.01
Rogers L. A., Wilson M. T., Duffy-Anderson J. T., Kimmel D. G., Lamb J. F. (2020). Pollock and “the blob”: impacts of a marine heatwave on walleye pollock early life stages. Fish. Oceanogr. 30, 142–158. doi: 10.1111/fog.12508
Ruesink J. L., Lenihan H. S., Trimble A. C., Heiman K. W., Micheli F., Byers J. E., et al. (2005). Introduction of non-native oysters: ecosystem effects and restoration implications. Annu. Rev. Ecol. Evol. Syst. 36, 643–689. doi: 10.1146/annurev.ecolsys.36.102003.152638
Scrucca L., Fop M., Murphy T. B., Raftery A. E. (2016). mclust 5: clustering, classification and density estimation using gaussian finite mixture models. 8(1), 289–317.
Sorte C. J., Ibáñez I., Blumenthal D. M., Molinari N. A., Miller L. P., Grosholz E. D., et al. (2013). Poised to prosper? A cross-system comparison of climate change effects on native and non-native species performance. Ecol. Lett. 16, 261–270. doi: 10.1111/ele.12017
Sousa R., Gutierrez J. L., Aldridge D. C. (2009). Non-indigenous invasive bivalves as ecosystem engineers. Biol. Invasions. 11, 2367–2385. doi: 10.1007/s10530-009-9422-7
Stachowicz J. J., Terwin J. R., Whitlatch R. B., Osman R. W. (2002). Linking climate change and biological invasions: ocean warming facilitates nonindigenous species invasions. Proc. Natl. Acad. Sc. U.S.A. 99, 15497–15500. doi: 10.1073/pnas.24243749
Steele E. N. (1964). The Immigrant Oyster, Olympia, Washington, USA (Olympia: Warren’s Quick Print).
Trimble A. C., Ruesink J. L., Dumbauld B. R. (2009). Factors preventing the recovery of a historically overexploited shellfish species, Ostrea lurida Carpenter 1864. J. Shellfish. Res. 28, 97–106. doi: 10.2983/035.028.0116
Valdez S. R., Ruesink J. L. (2017). Scales of recruitment variability in warming waters: comparing native and introduced oysters in Hood Canal, Washington, usa. Mar. Ecol. 38, e12435. doi: 10.1111/maec.12435
Walther G. R., Roques A., Hulme P. E., Sykes M. T., Pyšek P., Kühn I., et al. (2009). Alien species in a warmer world: risks and opportunities. Trends. Ecol. Evol. 24, 686–693. doi: 10.1016/j.tree.2009.06.008
Ward N. L., Masters G. J. (2007). Linking climate change and species invasion: an illustration using insect herbivores. Global Change Biol. 13, 1605–1615. doi: 10.1111/j.1365-2486.2007.01399.x
Keywords: pacific oyster, Puget Sound, marine heatwave, species invasion, climate change
Citation: Beck EL, Ruesink J, Troyer S and Behrens M (2024) Wild populations of Pacific oysters (Magallana gigas) emerge during the blob heatwave in south Puget Sound, Washington USA. Front. Mar. Sci. 11:1292062. doi: 10.3389/fmars.2024.1292062
Received: 10 September 2023; Accepted: 07 February 2024;
Published: 06 March 2024.
Edited by:
Julie S. Barber, Fisheries Department Swinomish Indian Tribal Community, United StatesReviewed by:
Liqiang Zhao, Guangdong Ocean University, ChinaJack Dudding, Washington Department of Fish and Wildlife, United States
Copyright © 2024 Beck, Ruesink, Troyer and Behrens. This is an open-access article distributed under the terms of the Creative Commons Attribution License (CC BY). The use, distribution or reproduction in other forums is permitted, provided the original author(s) and the copyright owner(s) are credited and that the original publication in this journal is cited, in accordance with accepted academic practice. No use, distribution or reproduction is permitted which does not comply with these terms.
*Correspondence: Emma Lee Beck, ZWJlY2syQHV3LmVkdQ==