 Christine Gawinski1*
 Malin Daase1,2
 Raul Primicerio1
 Martí Amargant-Arumí1
 Oliver Müller3
 Anette Wold4
 Mateusz Roman Ormańczyk5
 Slawomir Kwasniewski5
 Camilla Svensen1
- 1Department of Arctic and Marine Biology, UiT The Arctic University of Norway, Tromsø, Norway
- 2Department of Arctic Biology Research, The University Centre in Svalbard, Longyearbyen, Svalbard, Norway
- 3Department of Biological Sciences (BIO), University of Bergen, Bergen, Norway
- 4Norwegian Polar Institute, Tromsø, Norway
- 5Department of Marine Ecology, Institute of Oceanology, Polish Academy of Sciences, Sopot, Poland
The reduction of Arctic summer sea ice due to climate change can lead to increased primary production in parts of the Barents Sea if sufficient nutrients are available. Changes in the timing and magnitude of primary production may have cascading consequences for the zooplankton community and ultimately for higher trophic levels. In Arctic food webs, both small and large copepods are commonly present, but may have different life history strategies and hence different responses to environmental change. We investigated how contrasting summer sea-ice cover and water masses in the northern Barents Sea influenced the copepod community composition and secondary production of small and large copepods along a transect from 76°N to 83°N in August 2018 and August 2019. Bulk abundance, biomass, and secondary production of the total copepod community did not differ significantly between the two years. There were however significant spatial differences in the copepod community composition and production, with declining copepod abundance from Atlantic to Arctic waters and the highest copepod biomass and production on the Barents Sea shelf. The boreal Calanus finmarchicus showed higher abundance, biomass, and secondary production in the year with less sea-ice cover and at locations with a clear Atlantic water signal. Significant differences in the copepod community between areas in the two years could be attributed to interannual differences in sea-ice cover and Atlantic water inflow. Small copepods contributed more to secondary production in areas with no or little sea ice and their production was positively correlated to water temperature and ciliate abundance. Large copepods contributed more to secondary production in areas with extensive sea ice and their production was positively correlated with chlorophyll a concentration. Our results show how pelagic communities might function in a future ice-free Barents Sea, in which the main component of the communities are smaller-sized copepod species (including smaller-sized Calanus and small copepods), and the secondary production they generate is available in energetically less resource-rich portions.
1 Introduction
One of the most noticeable consequences of ongoing climate change is the decline of Arctic summer sea ice (Pörtner et al., 2019). Sea ice is melting earlier and forming later in the season, resulting in a prolonged open water period with increased light transmission to the upper ocean (Wassmann and Reigstad, 2011). The seasonally ice-covered Barents Sea is experiencing the highest rates of warming amongst all regions of the Arctic (Isaksen et al., 2022) and it is projected to be ice-free during winter beyond the year 2061 (Onarheim and Årthun, 2017). These physical alterations have major impacts on biological processes in the Barents Sea, as sea ice constitutes a unique habitat for sea ice algae and further controls light availability and mixing in the upper ocean, which regulates the onset of phytoplankton blooms (Sakshaug et al., 1991). The blooms typically follow the northwards retreat of sea ice in spring and summer, as the melting ice creates the stratified surface layer and increased light transmittance that are necessary for bloom formation. Once surface nitrate and silicate are depleted, the phytoplankton community changes from a diatom-dominated system to one dominated by flagellates and ciliates (Rat’kova and Wassmann, 2002). Timing and quality of the bloom are critical for the biomass and reproductive success of secondary producers.
Associated with the diatom-dominated system are large, lipid-rich copepods of the genus Calanus that have developed a reproductive cycle that is tightly linked to the ice algae and spring phytoplankton blooms (Falk-Petersen et al., 2009). The Arctic species Calanus hyperboreus reproduces during winter, entirely based on internal lipid reserves that were build up during the previous growth season (Falk-Petersen et al., 2009). C. glacialis on the other hand usually spawns just before or during the ice algae bloom (Søreide et al., 2010), while the boreal species C. finmarchicus reproduces during the open water spring bloom (Hirche, 1996). Offspring of C. hyperboreus and C. glacialis are dependent on the phytoplankton spring bloom for growth and accumulation of energy reserves that are needed for diapause (Falk-Petersen et al., 2009; Søreide et al., 2010). Nauplii and young copepodids (CI-III) of C. finmarchicus feed during the spring bloom, while the development of older copepodids (CIV-V) is fueled by grazing on microzooplankton during the summer (Svensen et al., 2019). In late summer, Calanus spp. that have acquired enough lipids for diapause descend into deeper water layers to hibernate at depth until the next spring bloom (Falk-Petersen et al., 2009). While Calanus spp. often dominate the mesozooplankton community in terms of biomass, smaller copepods (adult body size <2 mm; Svensen et al., 2019), such as Oithona similis, usually dominate in terms of numbers (Gallienne and Robins, 2001; Madsen et al., 2008). These copepods are closely associated with the microbial food web occurring in late summer and autumn, as they are omnivores (Lischka and Hagen, 2007). In contrast to Calanus spp., they reproduce year-round, with greatest abundance of eggs and nauplii occurring during spring and summer (Ashjian et al., 2003; Madsen et al., 2008).
The reduction of summer sea-ice cover due to climate change can lead to increased primary production in parts of the Barents Sea, depending on the prevalent nutrient and stratification regimes (Randelhoff et al., 2020). With a retreat of the seasonal ice zone northwards, regions previously covered by ice will likely experience a prolonged phytoplankton growing season and higher primary production, if sufficient nutrients are available. The southern edge of the seasonal ice zone is expected to become less productive due to increased thermal stratification and the resulting decrease in nutrients supplied to the surface layers (Wassmann and Reigstad, 2011). These changes will likely affect the zooplankton community by altering the composition of the grazers. In the Bering Sea, large-sized Calanus spp. were found to be more abundant during cold periods with extensive sea-ice cover (Coyle and Pinchuk, 2002; Hunt et al., 2011; Stabeno et al., 2012; Eisner et al., 2014; Kimmel et al., 2018, Kimmel et al., 2023), while small copepods (e.g. Oithona spp. and Pseudocalanus spp.) were more abundant during warm periods with less sea-ice cover (Stabeno et al., 2012; Kimmel et al., 2018, Kimmel et al., 2023). Similar observations have been made in Svalbard fjords and the northern Barents Sea, where higher abundance of small copepods has been linked to warmer periods (Balazy et al., 2018) and the abundance of Calanus spp. was influenced by Atlantic water inflow and sea-ice cover (Dalpadado et al., 2003; Daase and Eiane, 2007; Blachowiak-Samolyk et al., 2008; Dalpadado et al., 2012; Stige et al., 2019).
Secondary production is key in understanding how climate related changes, such as a reduction of sea ice, may impact the transfer of energy in Arctic marine food webs. Secondary production refers to the biomass produced by consumers, such as copepods, in a given unit of time (e.g., mg C m-2 d-1). The Barents Sea is a highly productive fishing ground and Calanus spp. are a crucial food source for many small and juvenile planktivorous fish such as the Barents Sea capelin (Mallotus villosus), Atlantic herring (Clupea harengus) and polar cod (Boreogadus saida) (Hassel et al., 1991; Huse and Toresen, 1996; Bouchard et al., 2017). Small copepods, such as O. similis and Pseudocalanus spp. are food for fish larvae and other larger zooplankton, such as krill, amphipods, chaetognaths, ctenophores, and hydrozoans (Turner, 2004). Eggs and nauplii of both small and large copepods form a substantial part of the diet of the early larval stages of polar cod. Here, small copepods are especially important to polar cod larvae hatching during the winter months, when other food sources are scarce (Geoffroy and Priou, 2020). In the Bering Sea, sea-ice concentration was found to impact secondary production of Calanus spp., which was low during warm periods with less sea-ice cover (Kimmel et al., 2018, Kimmel et al., 2023). In the Barents Sea previous research on secondary production has mainly focused on the southern regions close to the polar front (Basedow et al., 2014; Dvoretsky and Dvoretsky, 2024a) and the eastern Barents Sea (Dvoretsky and Dvoretsky, 2009; Dvoretsky and Dvoretsky, 2024b) and primarily on large Calanus spp. (Slagstad et al., 2011). Gaining insights into the effects of sea-ice reduction on copepod secondary production in the Barents Sea is of great social and economic significance, especially since interannual sea-ice concentrations in the northern Barents Sea are highly variable due to climate change (Efstathiou et al., 2022).
In the present study, we evaluate how a reduction in sea-ice cover influenced the copepod community composition and their secondary production in the upper 100 m of the northern Barents Sea. We further examined the relationship between copepod secondary production and environmental and biological drivers, such as hydrography, protist community composition and bacterial and primary production. Zooplankton samples were collected in August 2018, a year with reduced sea-ice cover, and in August 2019, a year with extensive sea-ice cover along a transect spanning 76-83°N. We address the following research questions through direct hypothesis testing: Did differences in sea-ice cover between the two years (I) affect the total copepod secondary production and (II) change the contribution of different species to the total copepod secondary production? Additionally, we explore whether patterns in community composition or secondary production correlated with other environmental or biological factors through multivariate descriptive analyses.
We expect the total copepod secondary production to be higher in the summer with reduced sea-ice cover (2018) due to an extended period of primary production. However, this would likely be accompanied by a change in the copepod community composition, because diatom blooms terminate earlier in a year with reduced sea-ice cover and the community of primary producers becomes dominated by flagellates and ciliates earlier in the season, which favors the growth of small copepods (e.g. O. similis) (Gallienne and Robins, 2001). We therefore hypothesize that small copepods will contribute more to the total copepod secondary production during the summer with reduced sea-ice cover (2018), whereas large copepods (e.g. Calanus spp.) will contribute more when the summer sea-ice cover is more extensive (2019). Furthermore, we expect the quantity and relative contribution of small copepod production to total copepod production to be higher in habitats with higher water temperatures and a higher abundance of ciliates and dinoflagellates. Conversely, in habitats characterized by colder water temperatures and higher concentrations of chlorophyll a, which are typically associated with increased phytoplankton biomass and greater diatom abundance, we expect the production of large Calanus spp. and their contribution to total copepod production to be higher.
2 Material and methods
2.1 Study area
Samples and measurements were collected in the northern Barents Sea as part of The Nansen Legacy project, during cruises of RV Kronprins Haakon in August 2018 (06.-23.08.2018) and August 2019 (05.-27.08.2019). The study sections, where stations were located, covered an environmental gradient from Atlantic to Arctic waters (76°-83° N, Table 1; Figures 1A, C). Samples were collected at 8 stations in 2018 and 6 stations in 2019 and were categorized according to their locations. Station P1 was in Atlantic waters south of the polar front and is seen as a representative of ‘Atlantic’ environmental conditions. Stations P2-P5 were located north of the polar front on the Barents Sea shelf and are seen as representing ‘Barents Sea shelf’ conditions and stations P7, PICE1 and SICE2-3 were located in the deeper Arctic Ocean basin, representing ‘Arctic Ocean basin’ conditions. Stations P1-P5 were visited in both years, and among these stations P4 and P5 were in ice-free waters at the time of sampling in 2018 and in ice-covered waters during sampling in 2019 (Table 1). PICE1 and SICE2-3, only visited in 2018, were also ice covered, as well as P7, which was only visited in 2019.
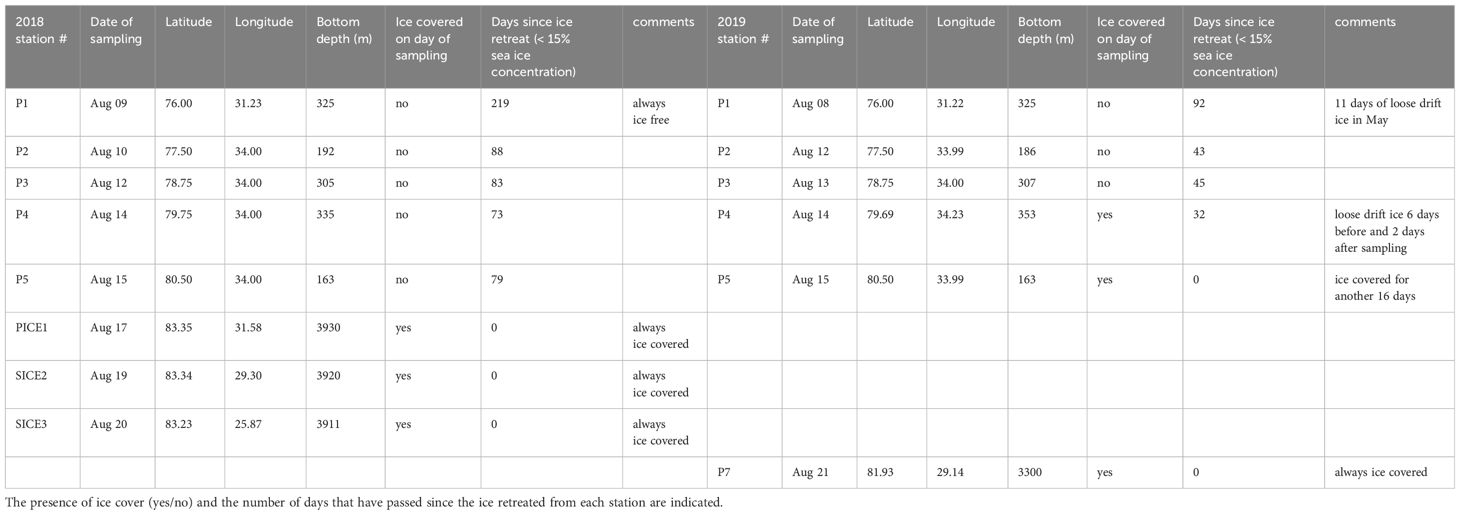
Table 1 Location and bottom depth at the stations where zooplankton samples were collected in August 2018 and August 2019.
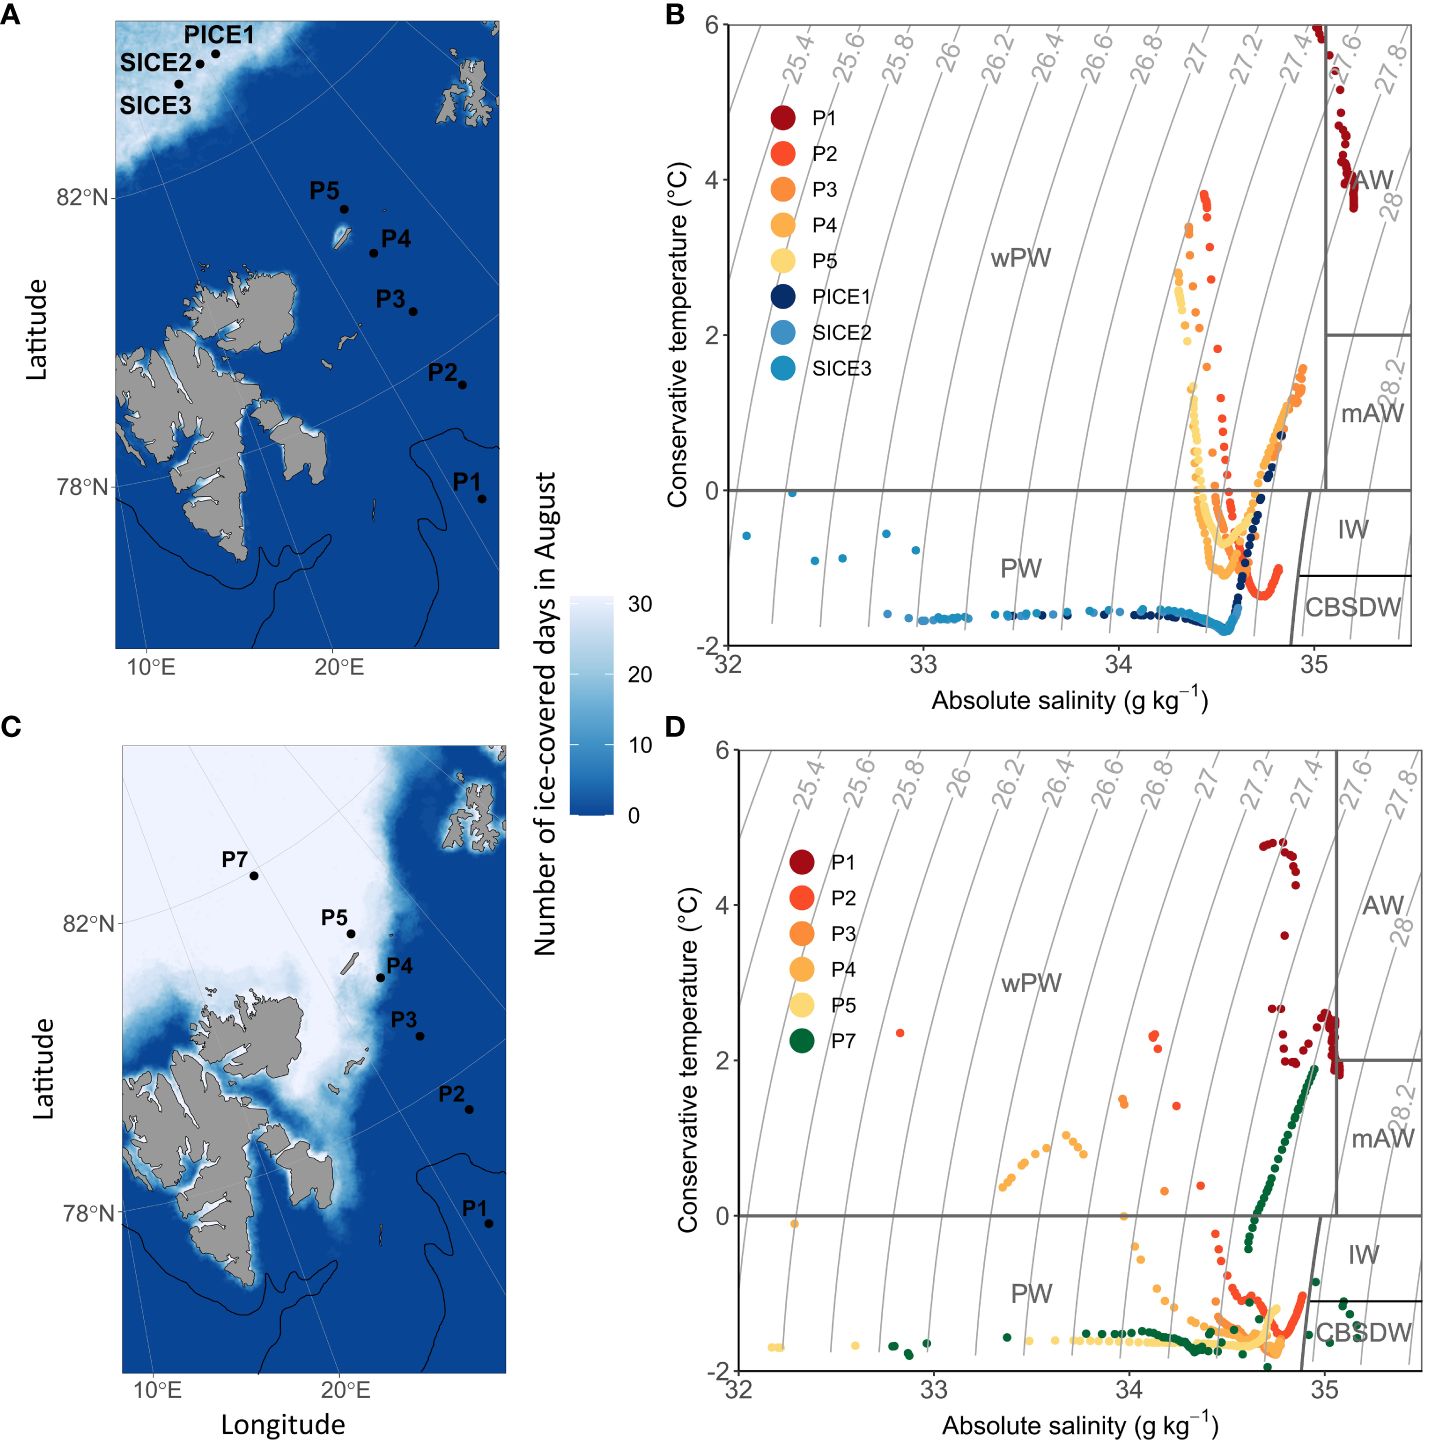
Figure 1 Location of the sampling stations and sea-ice cover during the sampling period (indicated as number of ice-covered days during August) in 2018 (A) and 2019 (C). The approximate location of the polar front based on the 200 m isobath is indicated with a black line. During the sampling campaign in 2018, sea ice was only present at stations PICE1 and SICE2-3 in the Arctic Ocean basin. During the 2019 sampling campaign, sea ice was present at P4, P5 and P7. (B) shows a t-s-plot of water masses in 2018 and (D) in 2019 (PW, Polar Water; IW, Intermediate Water; CBSDW, Cold Barents Sea Dense Water; wPW, warm Polar Water; AW, Atlantic Water; mAW, modified Atlantic Water, following definitions by Sundfjord et al., 2020).
2.2 Zooplankton sampling
Zooplankton was collected with stratified net hauls using two separate MultiNet® Type Midi (HYDRO-BIOS Apparatebau GmbH, net opening 0.25 m2), one with 64 μm and one with 180 μm mesh size net bags. The depth intervals for the shallow shelf stations were: bottom-200, 200-100, 100-50, 50-20 and 20-0 m. Where bottom depth exceeded 600 m, zooplankton was collected from the following depth strata: bottom-600, 600-200, 200-50, 50-20, 20-0 m. The 180 µm net was hauled with a speed of 0.5 m s-1 and the 64 µm with a speed of 0.3 m s-1 to warrant optimal water filtering. All samples were processed immediately upon retrieval of the nets. The samples were concentrated on 64 µm and 180 µm sieves respectively, gently flushed with filtered sea water, and stored in 125 mL bottles with 4% formaldehyde-seawater solution free from acid. Due to unpredictable failures of water flow meters installed in the plankton nets used, the volume of filtered water was calculated based on a regression equation describing the relationship between the volume of water filtered through the net and depth strata:
The equation is based on a data set consisting of numerous zooplankton collections using MultiNet plankton nets conducted in the Barents Sea area, e.g. from projects ‘On Thin Ice’, ‘Cabanera’, ‘MariClim’. This model equation is valid for depth strata ranging from 20 m to 400 m. For water layers <20 m, the volume of filtered water was calculated based on the relationship: Volume filtered (m3) = net opening area * (lower layer depth [m] - upper layer depth [m]), assuming the filtration efficiency declared by the manufacturer (in the range of 90%).
Zooplankton samples were analyzed under an Olympus SZX7 dissecting microscope (OM Digital Solutions GmbH) equipped with an ocular micrometer following methods described in Postel et al. (2000) and Kwasniewski et al. (2010). In the first step, the zooplankton sample was filtered from the preservative solution of formaldehyde, suspended in a beaker with fresh water and then all large zooplankton (total length >5 mm) were removed, identified, and counted in their entirety. Smaller zooplankton (total size <5 mm) were identified and counted from sub-samples taken from a fixed sample volume using a macro pipette. In this case, at least five subsamples were analyzed in detail, assuming that the number of organisms identified and counted was not less than 500 individuals. If the number of individuals in 5 subsamples was smaller, further subsamples were taken until at least 500 zooplankton individuals from the smaller than 5 mm fraction were identified and counted. All zooplankton individuals were identified to the lowest possible taxonomic level, also specifying developmental stage (copepodid stage for copepods). The remaining sample was scanned to detect rare species and developmental stages. The species distinction between Calanus finmarchicus, C. glacialis and younger developmental stages of C. hyperboreus was made based on the length of the prosome, using the size classes established in the study by Kwasniewski et al. (2003). This approach likely introduces some bias in our data, as studies using molecular tools have shown a high but regionally variable overlap in prosome lengths of C. finmarchicus and C. glacialis, which often leads to an underestimation of C. glacialis (e.g., Gabrielsen et al., 2012; Choquet et al., 2018). However, as the results of molecular species analysis for our study region are currently not available to us and the vast majority of ecological studies of zooplankton to date, including studies on species distribution patterns, are based on using size classes to distinguish between Calanus species (e.g. Unstad and Tande, 1991; Hirche et al., 1994; Basedow et al., 2004; Kosobokova and Hirche, 2009; Kosobokova et al., 2011; Wold et al., 2023), our data should nevertheless provide insights into Calanus species distribution in comparison with previous observations. We followed Roura et al. (2018), who defines small copepods as those having adult body size of <2 mm. Consequently, abundance of ‘small copepods’ was represented by Acartia longiremis, Centropages hamatus, Harpacticoida spp. indet., Oithona atlantica, O. similis, Microcalanus spp., Microsetella norvegica, Neomormonilla spp., Oncaea spp., Pseudocalanus spp., Scolecithricella minor and Triconia borealis. Abundance of ‘large copepods’ was represented by Aetideidae, C. finmarchicus, C. glacialis, C. hyperboreus, Gaetanus tenuispinus, Heterorhabdus norvegicus, Metridia longa, Scaphocalanus brevicornis and Paraeuchaeta spp. The samples from the 64 μm and 180 μm gauze nets were analyzed separately, and the analytical results were then combined. Abundance data of copepod nauplii, all stages of ‘small copepods’, as well as all early developmental stages (CI-CIII) of ‘large copepods’, were obtained from the 64 μm net results. Abundance data of older developmental stages (CIV-adult) of ‘large copepods’ were based on 180 μm net results. Copepod abundance was converted into biomass, based on species and stage-specific carbon mass relationships (Supplementary Table 1). Copepod stage specific carbon mass was obtained from literature if available. For copepod species and life stages for which no published carbon mass was available, a conversion factor of 0.4 (individual dry weight to carbon weight) was used (Peters and Downing, 1984). For further analyses, we only used data on copepod abundance (ind. m-2) and biomass (mg C m-2) integrated for the upper 100 m at individual stations (including three net sampling depth strata: 0-20, 20-50 and 50-100/50-200 m). In the case where samples were taken over a depth range of 50-200 m (P7, PICE1, SICE2, SICE3), the abundance in the 50-100 m depth strata was calculated as one third of the abundance of the 50-200 m depth strata, assuming an even distribution of zooplankton in this layer of water. While this approach might potentially lead to an underestimation of copepod production in these depth strata, a comparison using one third or the total abundance or biomass in the 50-200 m depth layer indicated that it had minimal impact in our study and did not change the main results or conclusions. This is due to the comparatively low abundance and biomass in the deep layers of the Arctic Ocean basin (P7, PICE1, SICE2, SICE3).
2.3 Secondary production calculation
Daily copepod secondary production p (mg C m−2 d−1) in the upper 100 m was calculated using the following Equation 1, (Runge and Roff, 2000):
Where Bi is copepod stage specific biomass for the upper 100 m (mg C m−2) and gi stage specific growth rate (d−1).
Here, gi was determined for nauplii, copepodids and adults of individual broadcast-spawning and sac-spawning copepod species using the multiple linear regression model of Hirst and Lampitt (1998), taking temperature and body weight into consideration (Table 2; Supplementary Table 1: distinction of broadcast- and sac-spawning copepod species). We chose the Hirst and Lampitt (1998) growth model, as it reflects the physiological performances of copepods at low water temperatures relatively realistically and has been used in previous studies on copepod secondary production in Arctic regions (e.g. Liu and Hopcroft, 2006; Madsen et al., 2008). This global model can be used to calculate growth rates of actively growing copepod populations in the epipelagic layer of polar to tropical regions (Hirst and Lampitt, 1998). The present study focuses solely on the upper 100 m water column, as copepods found in this depth range are assumed to be active. We are aware that some copepods below 100 m will be active and hence contribute to the total copepod production in the ecosystem. Therefore, our production estimates may be considered conservative. An alternative approach would be to estimate production for the entire water column – hence also to include the deeper communities. However, we believe this would significantly overestimate the production estimates. Diapause plays a crucial role in the life cycle of Calanus spp., where individuals that have acquired enough lipids descend into deeper water layers in late summer, to hibernate at depth until the next spring bloom (Falk-Petersen et al., 2009). Therefore, including hibernating individuals below 100 m (Ashjian et al., 2003) would overestimate secondary production. The majority of small copepod species, such as Oithona spp. and Pseudocalanus spp., can be found above a depth of 150 m in summer months in Arctic waters, with highest abundance recorded in the upper 50 m water column (Lischka and Hagen, 2005; Madsen et al., 2008; Darnis and Fortier, 2014). Mesopelagic, omnivorous copepods, such as Metridia longa and Microcalanus spp., and carnivorous copepods, such as Paraeuchaeta spp., are only sporadically found in the upper 100 m (Darnis and Fortier, 2014) and are therefore not the focus of the present study. Furthermore, currently there is a shortage of models that can accurately estimate the growth rates of these kind of copepods (Kobari et al., 2019). We therefore decided to use the first approach of estimating secondary production for the upper 100 m only, with a potential underestimation of production – rather than to include all depth layers and risk an overestimation of the production.
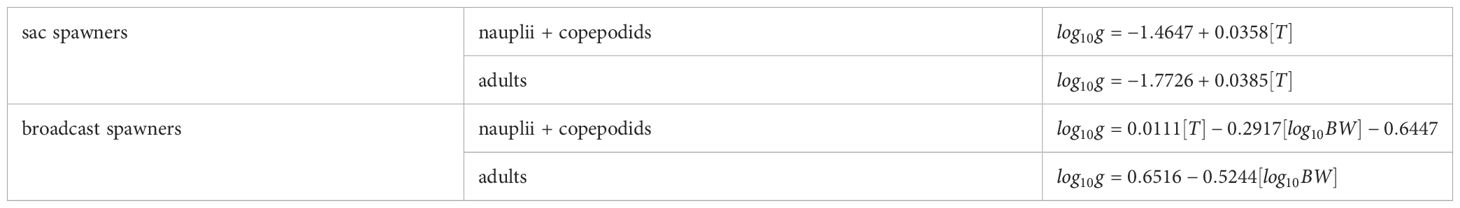
Table 2 Equations used to calculate stage specific growth rates of sac spawning and broadcast spawning copepods, after Hirst and Lampitt (1998).
2.4 Supplementary physical and biological data
In addition to sea-ice cover, multiple other biological and environmental factors can influence the copepod community composition and their production, such as water temperature and salinity (e.g. Daase and Eiane, 2007; Trudnowska et al., 2016; Balazy et al., 2018), the protist community composition (e.g. Levinsen et al., 2000; Leu et al., 2011) and primary production (e.g. Svensen et al., 2019). We therefore included data on water column temperature and salinity, chlorophyll a concentration, protist abundance, primary production, and bacterial production rates, collected during the same cruises as part of The Nansen Legacy project, in our statistical analyses. Detailed sampling procedures for the environmental and biological properties measured can be found in The Nansen Legacy sampling protocol (The Nansen Legacy, 2020).
2.4.1 Sea-ice concentration
A dataset containing daily sea-ice concentrations for each of the sampling stations in 2018 and 2019 was obtained from the data portal of the Norwegian Polar Institute (Steer and Divine, 2023). Daily sea-ice concentrations were derived from a 6.25 km resolution gridded sea-ice concentration product based on AMSR-E and AMSR2 passive microwave sensors. The satellite derived sea-ice concentration dataset was complemented with local sea-ice concentration from visual bridge-based sea ice observations, conducted following ASSIST Ice Watch protocol during some of the Nansen Legacy cruises to the study area. To visualize the sea-ice cover during the study period, AMSR2 sea-ice concentration data were obtained from the data archive of the University Bremen (Spreen et al., 2008) for the Svalbard region for each day in August 2018 and August 2019. The data was then processed by classifying each grid cell (3.125 km grid spacing) in the Barents Sea as either ice-free (0) or ice-covered (1) based on a threshold of less than 15 % sea-ice coverage representing ice-free conditions. Finally, the number of ice-covered days for each grid cell was determined by summing up the number of days classified as ice-covered, giving a range between 0-31 days of ice cover in August.
2.4.2 Hydrography
Data on hydrography of the sampling area was obtained from the Svalbard Integrated Arctic Earth Observing System (SIOS) data portal (Ingvaldsen, 2022; Reigstad, 2022). The data, consisting of depth profiles of water column salinity and temperature, were obtained using a rosette-mounted conductivity-temperature-depth (CTD) sensors mounted on the SBE911+ probe from Sea-Bird Electronics. Data were processed following standard procedures as recommended by the manufacturer and were averaged to 1 m vertical bins before plotting. We applied the suggested water mass definitions for the central and northern Barents Sea (Sundfjord et al., 2020), based on conservative temperature CT, absolute salinity SA and potential density values, following TEOS-10 convention.
2.4.3 Chlorophyll a
Values of acid-corrected chlorophyll a concentration at the stations along the transect were obtained from the SIOS data portal (Vader, 2022a, Vader, 2022b). Water for the measurements was collected with 10 L Niskin bottles mounted on a CTD rosette at nine depths: 5, 10, 20, 30, 40, 50, 60, 90 m and at the fluorescence maximum. Chlorophyll a was extracted with methanol using GF/F filters following the Holm-Hansen and Riemann (1978) procedure and its concentration was measured on board, using a Turner Design AU10 fluorometer.
2.4.4 Protist abundance
Abundance data of pelagic marine protists (cells L-1) at the study stations were obtained from the SIOS data portal (Assmy et al., 2022a, Assmy et al., 2022b). Samples were collected with Niskin bottles mounted on a CTD rosette at depths: 5, 10, 30, 60, 90 m and at deep chlorophyll maximum. The samples were preserved using a mixture of glutaraldehyde and hexamethylenetetramine-buffered formalin at final concentrations of 0.1% and 1%, respectively. The organisms were identified and counted under an inverted microscope according to the Utermöhl method (Utermöhl, 1958).
2.4.5 Primary production
Primary production rates at selected stations (2018: P1, P2, P4, PICE; 2019: P1, P4, P5, P7) were estimated by measuring 14C uptake during in situ incubations. Water was collected from a CTD rosette at 10, 20, 40, 60, 90 m and at the fluorescence maximum. The samples were stored in a dark and cold environment until processing, no longer than one hour. Two 250 mL polystyrene incubation bottles, one clear and one dark, were filled with water from each depth. NaH14CO3 was added to each incubation bottle to a final activity of 0.1 mCi/mL. Two 250 µL subsamples of each incubation bottle were fixed with 250 µL pure ethanolamine to quantify total added carbon. Both bottles were then incubated at their corresponding sampling depths, attached to a freely drifting mooring rig. After 18 to 24 hours, the bottles were recovered, and their contents filtered onto 25 mm Whatman GF/F filters at low vacuum pressure. The filters were transferred to 20 mL scintillation vials, and 750 µL concentrated HCl was added to remove the unincorporated inorganic carbon. The samples were stored in the dark until analysis, at which point 10 mL of scintillation cocktail (Ecolume) was added before analysis in a scintillation counter (Tricarb). Samples were counted for 10 minutes.
2.4.6 Bacterial production
Bacterial production rates at selected stations (2018: P1-P5, PICE; 2019: P1-P5, P7) were measured using the method of 3H-leucine incorporation according to Smith and Azam (1992). In short, four replicates of 1.5 mL of seawater, collected at depths of 5, 10, 20, 40, 60, 90, 120 m and at maximum fluorescence using Niskin bottles mounted on a CTD rosette, were distributed in 2 mL Eppendorf vials. To one replicate, 80 µL of 100% trichloroacetic acid (TCA) were immediately added to serve as control. All replicates were incubated with 3H-leucine (25-nM final concentrations) for 2h at in situ temperature (temperature measured at the sampling depth) and stopped through addition of 80 µL of 100% TCA. For the analysis, samples were first centrifuged for 10 min at 14,800 rpm and subsequently washed with 5% TCA (repeated three times). 5 mL of scintillation liquid (Ultima Gold) was added after the final step and the radioactivity in the samples was counted on a Perkin Elmer Liquid Scintillation Analyzer Tri-Carb, 2800TR. The measured leucine incorporation was converted to µg carbon incorporated per L per hour according to Simon et al. (1992). Datasets for bacterial production measurements in August 2018 and August 2019 can be found at NMDC (Müller, 2023a, Müller, 2023b).
2.5 Statistical analyses
Data on copepod abundance (ind. m-2), biomass (µg C m-2) and secondary production (µg C m-2 d-1) were aggregated at different taxonomic resolutions, combining across all developmental stages, using the following groupings: Calanoida nauplii, Calanus finmarchicus, C. glacialis, C. hyperboreus, Microcalanus spp., Pseudocalanus spp., Cyclopoida nauplii, Oithona spp., other Cyclopoida (including predominantly Triconia borealis), Microsetella norvegica and ‘other copepods’ (Table 3, representative species and life stages used in the grouping). Data was tested for normal distribution using the Shapiro-Wilk test. Prior to the analysis, data on abundance were fourth root transformed and data on biomass and secondary production were log10(x+1) transformed to approximate the normal distribution and stabilize variances. All statistical analyses of the copepod community were performed on abundance, biomass, and secondary production data from three depth strata (0-20, 20-50, 50-100 m) at stations along the study transect in 2018 and 2019. Because of non-replicated zooplankton tows, we used the different depth strata as replicates within each station, to be able to perform statistical tests on the dataset.
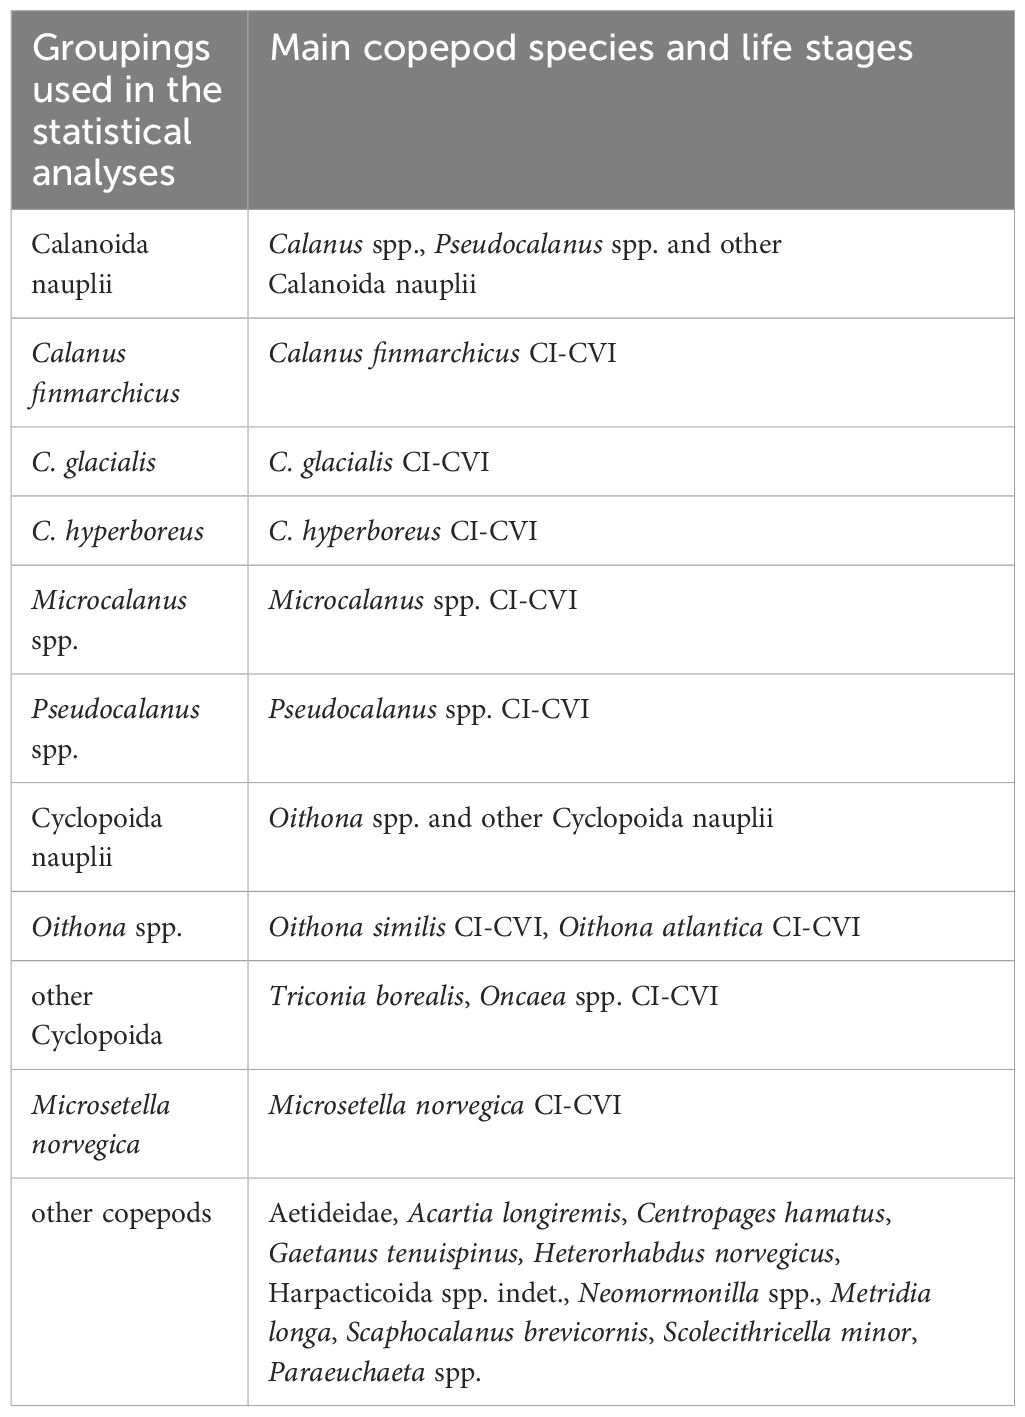
Table 3 Copepod groupings used for the statistical analyses, with representative species and life stages.
To test whether bulk abundance, biomass, and secondary production of the total copepod community and of individual copepod species differed significantly between the two years (2018 and 2019) and locations (stations P1, P2, P3, P4, P5, which were sampled in both years), two-ways Analyses of Variance (ANOVA) were performed for the dominant copepod species mentioned above.
To test whether there was a significant difference in copepod community composition between the two years (2018 and 2019) and locations (stations P1, P2, P3, P4, P5), a permutation test was performed for a Constrained Correspondence Analysis (CCA) on abundance data and for a Redundancy Analysis (RDA) on biomass and secondary production data. Due to the nature of the data, a CCA was chosen for the abundance data (count data appropriate for Chi-square distances) and an RDA for biomass and secondary production data (both continuous variables appropriate for Euclidean distances). The explanatory variables in the CCA and RDAs included year and location. The interaction term (year x location) was included in the model to capture interannual differences of the copepod community along the transect. The significance of the overall model and individual terms were obtained by permutation testing (1000 permutations) at a significance level of α = 0.05.
To test the effect of environmental variables on the copepod community composition at stations in the two years, a CCA was performed on abundance data, whereas an RDA was performed on biomass and secondary production data. Included stations were P1-P5, P7, PICE1, SICE2, SICE3. The explanatory variables in the CCA and RDAs were selected based on ecological relevance and included water temperature (conservative temperature, °C) and salinity (absolute salinity, g kg-1), number of ice-free days, and integrated chlorophyll a concentration (mg Chl a m-2 for the upper 100 m water column). Because temperature and number of ice-free days were highly correlated, the temperature residuals were extracted using a linear model relating temperature to ice-free days. These temperature residuals were further used in the analyses and were representative of temperature variations within the water column decoupled from the spatial trend in sea-ice cover. Using temperature residuals also ensured that secondary production was not correlated with the same temperature data set that was used in the secondary production calculations. Model assumptions (linearity, variance heterogeneity and normality) were checked via exploratory data analyses and regression diagnostics. Salinity was square root transformed and number of ice-free days was log10(x+1) transformed, due to their skewed distributions. The significance of the overall model and individual terms were obtained by permutation testing (1000 permutations) at a significance level of α = 0.05.
In the constrained multivariate analysis, we could only include salinity, temperature, integrated chlorophyll a, and number of ice-free days as explanatory variables, due to missing values of other biological and environmental drivers at some of the sampling stations. However, primary production rate, bacterial production rate, ciliate abundance, dinoflagellate abundance and diatom abundance can be of high ecological relevance to secondary production. To explore the relationship between copepod secondary production and these additional environmental and biological drivers, a Principal Component Analysis (PCA) was performed on the copepod secondary production variables, and the explanatory variables were then superimposed on the biplot by relating these to the principal components (PC1, PC2).
All data processing, statistical analyses and visualizations were performed using R version 4.2.2. The multivariate ordination analyses and permutation tests were performed with R package Vegan (Oksanen et al., 2023). Station maps were plotted in R using the GGOceanmaps package (Vihtakari, 2022) and Bathymetry data from the National Geophysical Data Center (NOAA National Geophysical Data Center 2009).
3 Results
3.1 Physical properties: sea ice and hydrography
Sea-ice cover and water mass distribution in the study area varied between the two years. In August 2018, the ice edge was at 83°N, while it extended as far south as 80°N in 2019 (Figures 1A, C). Analysis of the sea-ice concentration in the Barents Sea in the weeks prior to the sampling campaigns revealed that in 2018 the Atlantic station P1 had been ice-free (defined as consecutive days with < 15% sea ice concentration) for 219 days, while it had only been ice-free for 92 days in 2019 (Table 1). The Barents Sea shelf stations P2, P3, P4 and P5 north of the polar front had been ice-free respectively for 88, 83, 73 and 79 days in 2018 and 43, 45, 32 and 0 days in 2019 (Table 1). All stations in the Arctic Ocean basin in 2018 (PICE1, SICE2, SICE3) and 2019 (P7) were ice covered in August (Table 1). In 2018, the sea ice in the study area started to melt around mid-May and did not form again until approximately mid-December. In 2019, on the other hand, the sea ice started to melt roughly by the end of June and formed again by the beginning of October (Amargant-Arumí et al., 2024).
The upper 100 m water column was warmer and more saline in 2018 than in 2019. In 2018, Atlantic Water was only observed at station P1, while this water mass was not present there in 2019 and was substituted with warm Polar Water (Figures 1B, D). Stations P2, P3, P4 and P5 north of the polar front were characterized by warm Polar Water in the surface layers and Polar Water in deeper layers in both years. In 2019, both temperature and salinity of the water masses decreased from south to north over the Barents Sea shelf. The Arctic Ocean basin stations in 2018 (PICE1, SICE2-3) and 2019 (P7) were characterized by Polar Water in the surface layers and warm Polar Water in deeper layers (Figures 1B, D).
3.2 Copepod community composition
3.2.1 Copepod depth distribution
In general, the majority of the copepods were found in the upper 100 m of the water column. At the Atlantic station P1, 85% of the entire copepod community was found in the upper 100 m in 2018, and 95% in 2019 (Figures 2A, B, diamonds representing the percentage of the copepod community that resided in the upper 100 m). On the Barents Sea shelf (stations P2-P5) approximately 66-91% of the entire copepod community was in the upper 100 m in 2018 and 84-94% in 2019 (Figures 2A, B). In the Arctic Ocean basin between 47-57% of the whole copepod community were found in the upper 100 m in 2018 (stations PICE1, SICE2-3) and 49% in 2019 (station P7, Figures 2A, B). It should be recalled that the stations in the Arctic Ocean basin were located in much deeper areas of the ocean. Of the Calanus population at the Atlantic station P1, 4% was found in the upper 100 m of water in 2018, while it was as much as 40% in 2019 (data not shown). On the Barents Sea shelf, 51-94% of the Calanus spp. community was found in the upper 100 m in 2018 and 68-94% in 2019 (data not shown). In the Arctic Ocean basin, between 72-100% of the Calanus spp. community was in the upper 100 m in 2018 (stations PICE1, SICE2-3) and 92% in 2019 (P7, data not shown). As the present study focuses solely on the secondary production occurring in the upper 100 m water column, e.g. does not considering Calanus spp. below 100 m in hibernation, the focus of the following chapters lays exclusively on the depth range of 0-100 m.
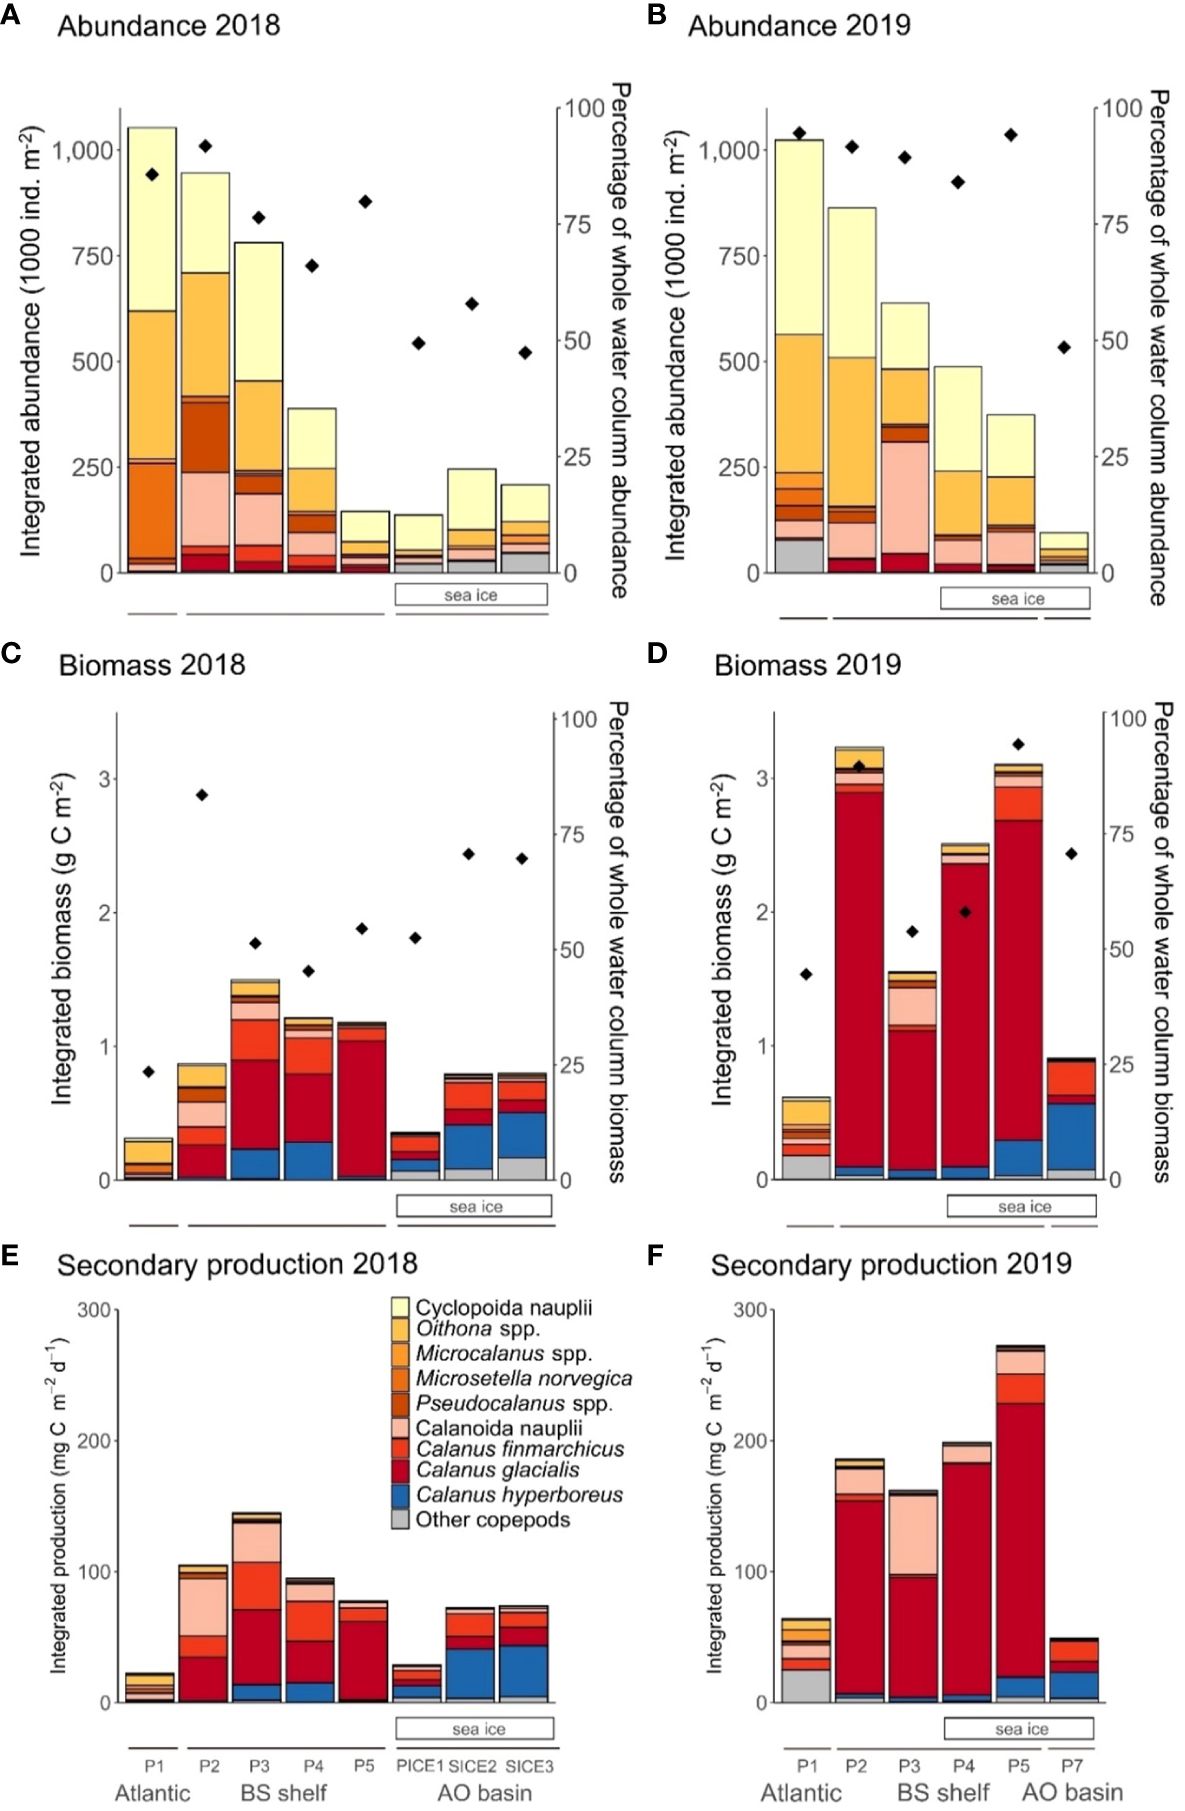
Figure 2 Abundance (upper panels), biomass (middle panels) and secondary production (lower panels) of dominating copepods within the upper 100 m layer at the southernmost station P1 (Atlantic), on the Barents Sea shelf (BS shelf) and in the Arctic Ocean basin (AO basin) in 2018 (left side graphs) and 2019 (right side graphs). Integrated abundance (1000 ind. m-2) in 2018 (panel (A)) and 2019 (panel (B)), integrated biomass (g C m-2) in 2018 (panel (C)) and 2019 (panel (D)) and integrated secondary production (mg C m-2 d-1) in 2018 (panel (E)) and 2019 (panel (F)) with proportions for individual copepod groups shown in the legend. Diamonds represent the percentage of the copepod community abundance (panels (A, B)) and biomass (panels (C, D)) that was located in the upper 100 m. Solid lines below the figure panels indicate the respective regions of the study section. Sea-ice cover is indicated with white rectangles under the graphs.
3.2.2 Copepod abundance
Copepod abundance in the upper 100 m was highest at the Atlantic station P1 in both years and amounted to 1052 and 1023 x 103 ind. m-2 in 2018 and 2019, respectively. The copepod community was numerically dominated by small copepods and cyclopoid nauplii (Figures 2A, B). The small copepod Microsetella norvegica and its nauplii were found almost exclusively at the Atlantic station P1. The total abundance of this species, including nauplii, was 225 x 103 ind. m-2 in 2018 and 40 x 103 ind. m-2 in 2019. The large copepods Calanus spp. reached abundance of 0.4 x 10³ ind. m-2 in 2018 and 5 x 10³ ind. m-2 in 2019, representing less than 0.5% of total copepod abundance in both years. Other large copepods, e.g. Metridia longa, were virtually absent at station P1 in 2018, whereas they represented up to 4% of the total copepod abundance at this station in 2019.
On the Barents Sea shelf (stations P2-P5) copepod abundance ranged between 145-946 x 103 ind. m-2 in 2018 and 374-863 x 103 ind. m-2 in 2019. The community was numerically dominated by small copepods and copepod nauplii in both years (Figures 2A, B). Calanus spp. and especially individuals in the size range of C. glacialis, contributed more to total abundance there. In terms of abundance, Calanus spp. made up 6-12% of the copepod community in 2018 (18-62 x 103 ind. m-2) and accounted for 4-7% (16-44 x 103 ind. m-2) in 2019. The species composition of the Calanus complex differed between the two years. C. finmarchicus made up 31-67% of the Calanus abundance on the Barents Sea shelf in 2018 and 1-17% in 2019. C. glacialis made up 29-68% in 2018 and 73-97% in 2019. C. hyperboreus made up 0.5-5% in 2018 and 1-10% in 2019. Copepod nauplii made up more than half of the total abundance of Copepoda on the shelf in both years, with cyclopoid nauplii being more abundant than calanoid nauplii. The only exception was station P3 in 2019, where the highest nauplii abundance was recorded (420 x 103 ind. m-2) and the nauplii assemblage was dominated by calanoid nauplii, with 63% contribution to total nauplii abundance.
In the Arctic Ocean basin copepod abundance in the upper 100 m of the ocean was low in both years, ranging from 137-246 x 103 ind. m-2 in 2018 (stations PICE1 and SICE2, respectively) and 95 x 103 ind. m-2 in 2019 (station P7) (Figures 2A, B). This was only a fraction (9-23%) of the abundance found at the Atlantic station P1. The copepod community in both years consisted mainly of copepod nauplii (48-76% of total abundance) and small copepods (24-46% of total abundance), while large copepods played a minor role (0-6% of the total abundance). As for Calanus spp., C. finmarchicus accounted for approximately 60-70% in both years, while C. hyperboreus only accounted for 7-26% in 2018 and 34% in 2019.
3.2.3 Copepod biomass
In both years, the copepod biomass in the upper 100 m was highest on the Barents Sea shelf and lower at the Atlantic station and in the Arctic Ocean basin. The copepod biomass at the Atlantic station P1 amounted to 0.31 g C m-2 in 2018 and 0.61 g C m-2 in 2019. In 2018, Oithona spp., Microsetella norvegica (Figures 2C, D) and the nauplii of both small copepods contributed most to the copepod biomass. In 2019, the copepod biomass consisted mainly of Oithona spp., other small copepods (e.g. Pseudocalanus spp., Triconia borealis, Microcalanus spp., Microsetella norvegica) and Metridia longa (other copepods in Figures 2C, D).
Copepod biomass was the highest on the Barents Sea shelf, with a maximum of 1.50 g C m-2 at station P3 in 2018 and a maximum of 3.21 g C m-2 at station P2 in 2019. The main component of copepod biomass on the Barents Sea shelf was Calanus spp. in both years, except at the southernmost station P2 in 2018, where small copepods and copepod nauplii together accounted for 55% of the total copepod biomass, and station P3 in 2019, where calanoid nauplii constituted 18%. Calanus in the size range of C. finmarchicus made up 8-34% of Calanus spp. biomass on the Barents Sea shelf in 2018 and 24-44% in 2019. C. glacialis made up 48-90% in 2018 and 82-96% in 2019. C. hyperboreus made up 2-27% in 2018 and 2-9% in 2019 (Figures 2C, D).
Copepod biomass was considerably lower in the Arctic Ocean basin than in the south, with 0.06-0.80 g C m-2 in 2018 and 0.90 g C m-2 in 2019. Here the biomass was mainly composed of Calanus spp. and other large copepods and C. hyperboreus contributed up to 60% in Calanus spp. biomass in both years (Figures 2C, D).
3.2.4 Copepod secondary production
The secondary production of copepods in the upper 100 m was highest on the Barents Sea shelf and lower at the Atlantic station P1 and at stations in the Arctic Ocean basin. At the Atlantic station P1, total estimated secondary production was 22.3 and 64.3 mg C m-2 d-1 in 2018 and 2019, respectively. Small copepods (13.8 and 19.3 mg C m-2 d-1 2018 and 2019, respectively) and their nauplii (1.8 and 1.4 mg C m-2 d-1 2018 and 2019, respectively) contributed considerably to the total copepod secondary production (Figures 2E, F). The production of large copepods at the Atlantic station was only 1.9 mg C m-2 d-1 in 2018 while it was 32.7 mg C m-2 d-1 in 2019.
The total estimated secondary production on the Barents Sea shelf ranged between 77.6-144.8 mg C m-2 d-1 in 2018 and 162.1-272.2 mg C m-2 d-1 in 2019. There was a change between years in the relative contribution of different groups to total secondary production of copepods on the Barents Sea shelf. In 2018, copepod nauplii and small copepods accounted for a large part of the production in the southern-most part of the Barents Sea shelf (stations P2), while Calanus spp. accounted for the majority of production in the remaining northern part (stations P3, P4, P5). In 2019, Calanus spp. accounted for most of the copepod secondary production at all stations except station P3, where calanoid nauplii had a higher share in production, amounting to 37.2% (Figures 2E, F). C. finmarchicus made up 13-39% of Calanus spp. production on the Barents Sea shelf in 2018 and 0.2-9% in 2019. C. glacialis made up 41-83% in 2018 and 83-97% in 2019. C. hyperboreus made up 2-19% in 2018 and 2-6% in 2019 (Figures 2C, D).
The secondary production of copepods in the Arctic Ocean basin ranged from 28.9-74.0 mg C m-2 d-1 in 2018 to 49.2 mg C m-2 d-1 in 2019 and resulted mainly from the production of Calanus spp. (72-89% in 2018, 89% in 2019) (Figures 2E, F).
3.3 Distribution of copepod communities in relation to ecological drivers
3.3.1 Differences in bulk abundance, biomass, and secondary production
There were no significant differences in mean abundance, biomass, and secondary production of the bulk copepod community between the two years (2018, 2019). In contrast, the mean abundance of the bulk copepod community was significantly different between locations (upper 100 m, stations P1-P5, two-way ANOVA, p <0.001, Supplementary Table 2). Post-hoc testing showed that the mean abundance decreased from south to north (Supplementary Figure 1A).
The only copepod species for which significant interannual differences were found was C. finmarchicus. The mean abundance, biomass, and secondary production of C. finmarchicus were significantly different between the two years (abundance, p <0.001; biomass, p = 0.007; secondary production, p = 0.001, Supplementary Table 2) and the interaction between year and location had a significant effect (abundance, p = 0.018; biomass, p = 0.003; secondary production, p = 0.002, Supplementary Table 2). Post-hoc testing showed that the mean abundance, biomass, and secondary production of C. finmarchicus were higher in 2018 than in 2019 at station P2, P3 and P4 (Supplementary Figures 1, panels 7A–C).
Significant differences between locations were found for Calanus spp. and the small copepods Oithona similis and Microsetella norvegica. The mean biomass of the large copepods Calanus spp. was significantly different between the locations (biomass, p = 0.03, Supplementary Table 2). Post-hoc testing showed that the mean bulk biomass of Calanus spp. was lower at the Atlantic station P1 than at the Barents Sea shelf stations P2-P5 (Supplementary Figures 1, panel 5B). The mean bulk abundance, biomass, and secondary production of Oithona spp., Pseudocalanus spp., Microcalanus spp., Microsetella norvegica and remaining small copepods combined were significantly different between locations (abundance, p = 0.006; biomass, p = 0.003, secondary production, p < 0.001, Supplementary Table 2). Post-hoc testing showed that the mean bulk abundance, biomass, and secondary production of small copepods decreased from south to north (Supplementary Figures 1, panels 10A–C). The mean abundance, biomass, and secondary production of the small copepods O. similis and M. norvegica varied significantly with location (O. similis abundance, p = 0.038; O. similis biomass, p = 0.020; O. similis secondary production, p = 0.018 and M. norvegica abundance, p = 0.013; M. norvegica biomass, p = 0.013; M. norvegica production, p = 0.002, Supplementary Table 2). Post-hoc testing showed that the mean abundance, biomass, and secondary production of both copepods decreased from south to north.
3.3.2 Copepod community composition
Multivariate analyses showed that there was no significant difference in terms of mean abundance, biomass, and secondary production of the copepod community between the two years (Table 4). The copepod community differed significantly in terms of mean abundance, biomass, and secondary production between locations (permutation test for stations P1-P5, using copepod groupings in Table 3, CCA abundance, p = 0.001; RDA biomass, p = 0.001; RDA production, p = 0.001, Table 4). Mean abundance, biomass, and secondary production of the copepod community differed significantly when testing for the interaction between year and location simultaneously (CCA abundance, p = 0.004; RDA biomass, p = 0.011; RDA production, p = 0.049, Table 4).

Table 4 Results of permutation testing of the copepod community in the upper 100 m (three depth strata 0-20, 20-50, 50-100 m) in relation to the two study years (2018 and 2019) and locations (stations P1-P5).
The constrained ordination models that explained the differences in copepod community abundance (Figure 3A; CCA, p <0.01), biomass (Figure 3B; RDA, p <0.01) and secondary production (Figure 3C; RDA, p <0.01) between locations within and between the two years included salinity, temperature, chlorophyll a and number of ice-free days as explanatory variables. Of the explanatory variables, only number of ice-free days was significant (p = 0.001, for abundance, biomass, secondary production, Table 5). The CCA explained 27.16% of total variation in the abundance data (Table 5), with the first axis accounting for 18.05% and the second axis for 4.81%. The RDA explained 27.43% of total variation in the biomass data (Table 5), with the first axis accounting for 19.38% and the second axis for 5.15%. The RDA accounted for 28.77% of total variation in the secondary production data (Table 5), with the first axis accounting for 20.35% and the second axis for 5.72% of the explained variability. The first axis of the CCA and of the two RDAs was significant (p = 0.001, for abundance, biomass, secondary production) and was primarily related to ice-free days, which contributed most to the observed variation. The second axis of the CCA and of the two RDAs was related to higher temperature and salinity on one end (Atlantic Water) and higher chlorophyll a concentrations on the other end, but was not significant. Samples clustered by characteristic geographical area, with the Atlantic station P1, the Barents Sea shelf stations (P2-P5) and the Arctic Ocean basin stations (PICE1, SICE2-3, P7) separating within the ordination plane. There was no clear distinction between samples from 2018 and 2019 in the ordination (Figures 3A–C). Copepod abundance, biomass, and secondary production were positively correlated with chlorophyll a at the Barents Sea shelf stations and positively correlated with salinity and temperature at the Atlantic station. A negative correlation was found between copepod abundance, biomass and secondary production and number of ice-free days for the Arctic Ocean basin stations. The analyses showed that the abundance, biomass, and secondary production of Microsetella norvegica, Pseudocalanus spp. and Oithona spp. were positively correlated with number of ice-free days, water temperature and salinity. The abundance, biomass, and secondary production of Calanus glacialis was positively correlated with chlorophyll a concentration. The abundance, biomass, and secondary production of C. hyperboreus, Microcalanus spp. and other copepods (e.g. Metridia longa, Paraeuchaeta spp.) was negatively correlated with number of ice-free days (Figures 3A–C). This shows that distinct copepod communities were found in the southern and northern parts of the study transect (spread along the first axis), with M. norvegica, Pseudocalanus spp., Oithona spp. and C. glacialis being characteristic for the Atlantic and shelf community, and C. hyperboreus, C. finmarchicus, Microcalanus spp., M. longa, and Paraeuchaeta spp. characteristic for the Arctic Ocean basin community. The communities were either located in Atlantic waters with low phytoplankton biomass, i.e. low integrated chlorophyll a, or in other water masses with higher phytoplankton biomass (sample points spread along the second axis).
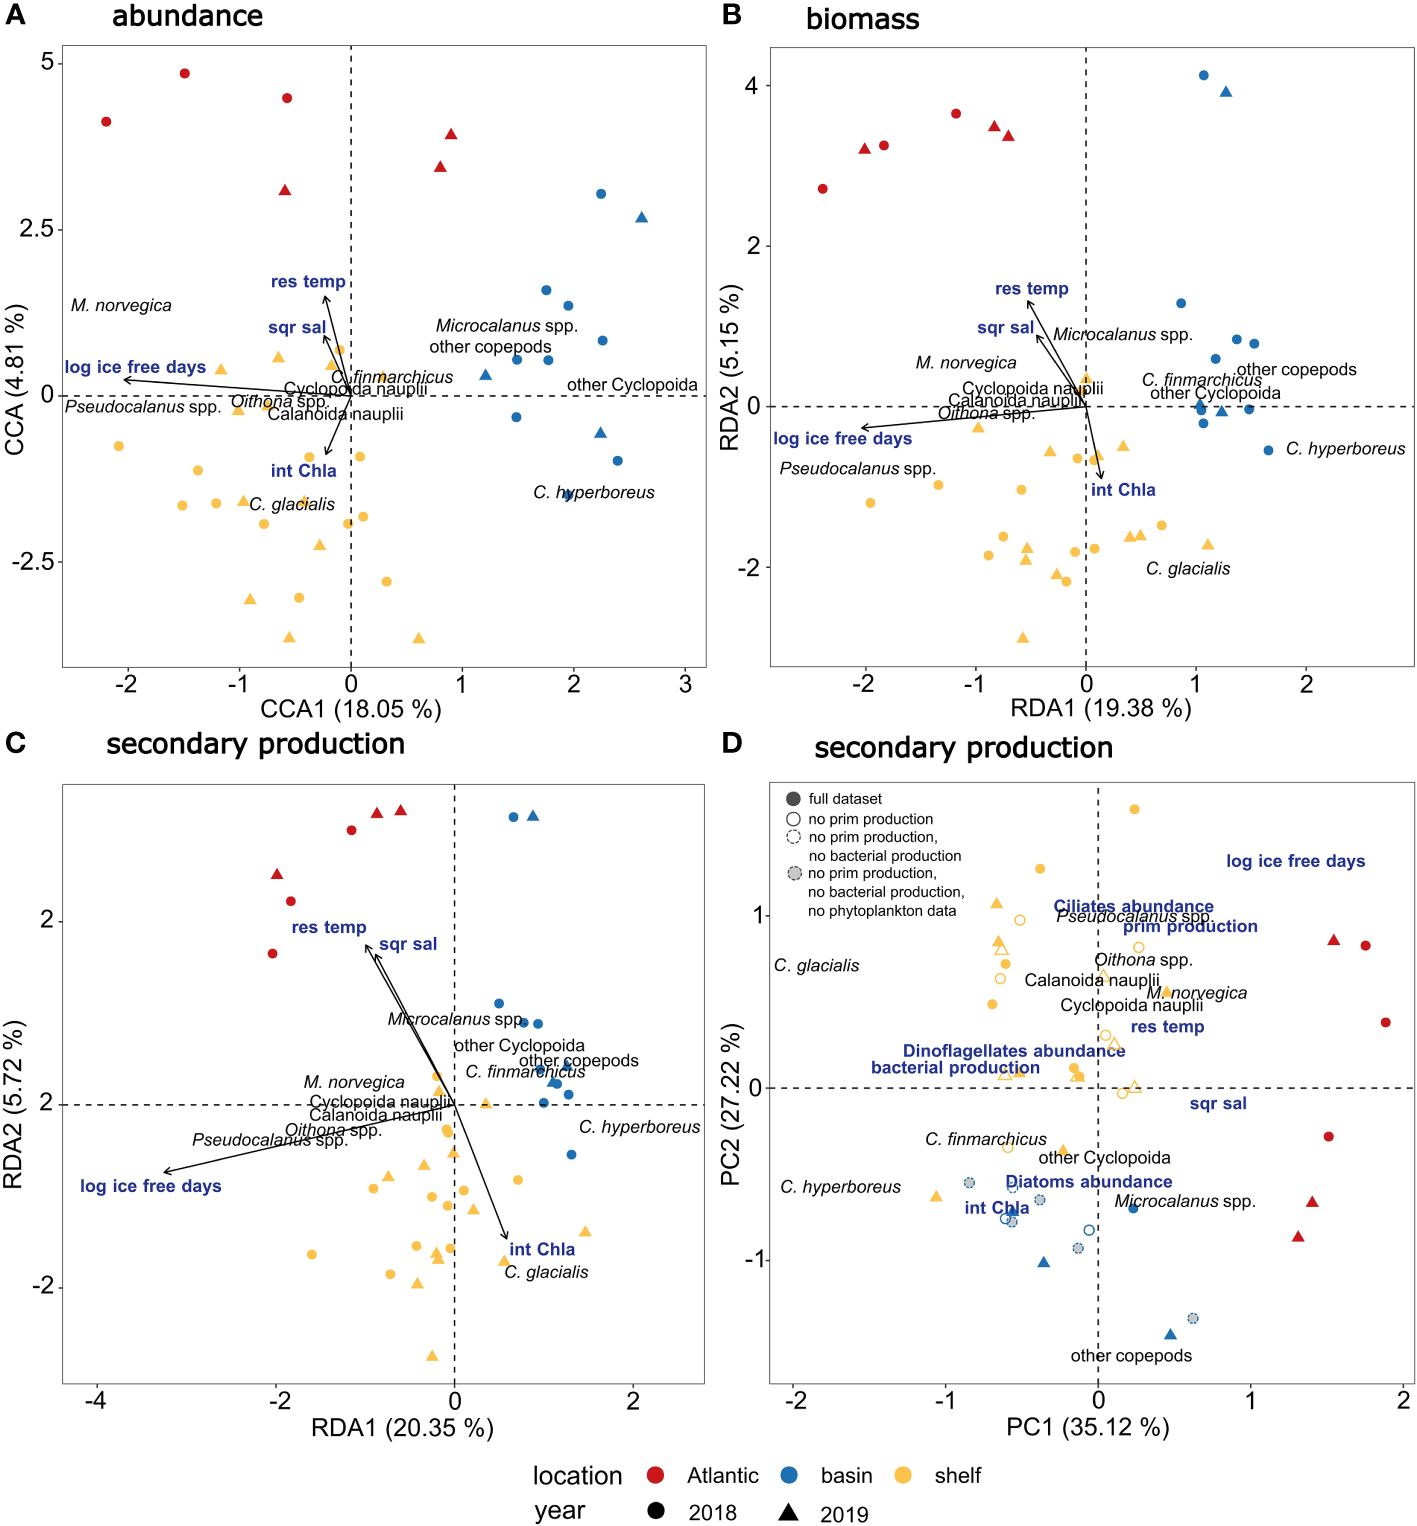
Figure 3 Multivariate analyses of copepod communities in relation to environmental and biological factors. (A) Triplot showing relationship between copepod abundance (based on fourth root transformed abundance data expressed as ind. M-2 in three depth strata from 0-20, 20-50, 50-100 m) and environmental factors (int Chl a = integrated chlorophyll a concentration, sqr sal = square root transformed salinity, res temp = residuals of temperature and log ice free days = log transformed number of ice-free days) using Constrained Correspondence Analysis (CCA). (B) Triplot showing relationship between copepod biomass (based on log10(x+1) transformed biomass data expressed as µg C m-2) and environmental factors using Redundancy Analysis (RDA). (C) Triplot showing relationship between copepod secondary production (based on log10(x+1) transformed secondary production data expressed as µg C m-2 d- 1) and environmental factors using Redundancy Analysis (RDA). (D) Biplot showing Principal Component Analysis of copepod secondary production with overlaid potential drivers of secondary production, including log-transformed number of ice-free days, square root transformed salinity, residuals of temperature, integrated chlorophyll a concentration, bacterial production, primary production, abundance of ciliates, dinoflagellates, and diatoms. Solid filled symbols indicate samples with full dataset of environmental and biological variables, symbols with solid lines indicate that primary production was not measured, symbols with dashed lines indicate that primary production and bacterial production were not measured, grey-filled symbols with dashed lines indicate that primary production, bacterial production, and phytoplankton community composition were not measured.
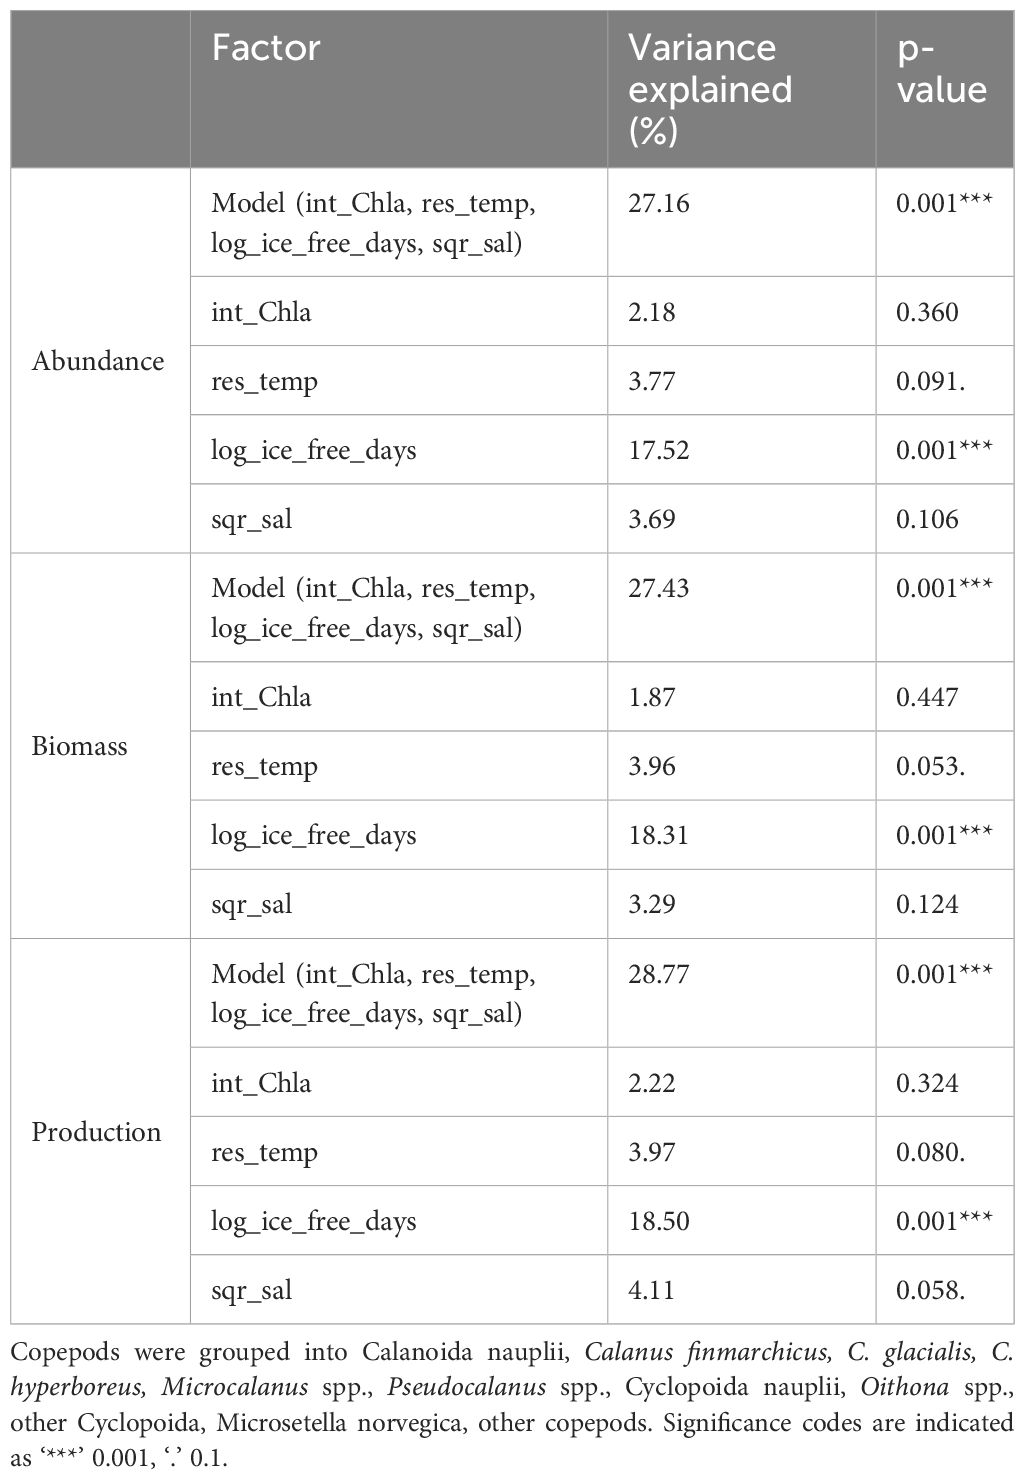
Table 5 Results of permutation testing of the copepod community in the upper 100 m (three depth strata 0-20, 20-50, 50-100 m) at stations P1-5, P7, PICE1, SICE2 and SICE3 in relation to environmental and biological variables (int_Chla = integrated chlorophyll a concentration, res_temp = residuals of temperature, log_ice_free_days = log transformed number of ice-free days and sqr_sal = square root transformed salinity.
A Principal Component Analysis (PCA) revealed that the secondary production of small copepods (e.g. Oithona spp., Pseudocalanus spp., M. norvegica) on the Barents Sea shelf and in the Atlantic region was positively correlated with number of ice-free days and was furthermore associated with a higher primary production rate and ciliate abundance (Figure 3D). The secondary production of C. finmarchicus and C. hyperboreus and other copepods in the Arctic Ocean basin was positively correlated with integrated chlorophyll a values, and also associated with higher diatom abundance. The high secondary production of C. glacialis on the Barents Sea shelf was associated with a higher bacterial production rate and higher dinoflagellate abundance. Both the bacterial production rate and dinoflagellate abundance were negatively correlated with salinity and temperature (Figure 3D). Hence, different environmental drivers seemed to influence the copepod communities in the southern and northern parts of the study area.
4 Discussion
4.1 Effect of interannual variation of sea-ice cover on copepod secondary production
Since the cold climate period in the late 1970s, the Barents Sea has undergone a warming trend (Bagøien et al., 2020), marked by notable interannual and multidecadal variability, resulting in an overall sea surface temperature increase of about 1.5°C (Mohamed et al., 2022). In this perspective, the two investigated years were both relatively warm years, although on a generally slightly cooling trend since the record warm year 2016 (Bagøien et al., 2020). There were differences in environmental drivers in the Barents Sea between the two years of study, which influenced the pelagic community and its production. Most notably, in August 2018, there was no sea-ice cover across the Barents Sea shelf and the hydrography in the southernmost part of the section was shaped by Atlantic water masses. In 2019, parts of the Barents Sea shelf were still ice-covered and water temperature at the study stations was overall lower. In the ice-free summer of 2018, the microbial community in the study area was in a late post-bloom stage, while in 2019, remnants of a marginal ice-zone bloom were still observed (Kohlbach et al., 2023; Amargant-Arumí et al., 2024). Even though the microbial community in 2018 was in a later seasonal succession stage than in 2019, both communities sustained comparable primary production averaged across the transect (Amargant-Arumí et al., 2024). To understand how climate change affects the entire pelagic ecosystem, it is crucial to understand how this energy is transferred to higher trophic levels. The Barents Sea as a highly productive fishing ground and depends on copepods as key food sources for many fish species (Hassel et al., 1991; Huse and Toresen, 1996; Bouchard et et al., 2017). It is therefore important to understand how the productivity patterns of copepods may be altered by changes in environmental conditions. Despite the contrasting sea-ice regimes in the two years, we did not find any statistically significant interannual differences in the mean copepod secondary production (Table 4), even though a comparison of the total integrated copepod biomass and secondary production between the two years (integrated for the upper 100 m) suggested that both were higher in 2019 than 2018 (Figures 2C–F). Instead, we found that spatial rather than interannual differences dominated the variation of copepod secondary production across the study region. Integrated bulk copepod secondary production for the upper 100 m ranged between 22.3-64.3 mg C m-2 d-1 in the Atlantic region, 77.6-272.2 mg C m-2 d-1 on the Barents Sea shelf and 28.9-74.0 mg C m-2 d-1 in the Arctic Ocean basin (Figures 2E, F). These values are comparable to data reported for the eastern Barents Sea (13.6-128 mg C m-2 d-1, assuming a dry mass to carbon mass relationship of 0.4 and integrating for the upper 100 m, Dvoretsky and Dvoretsky, 2024a) and the Barents Sea polar front (mean 70 ± 8.8 mg C m-2 d-1, for the whole water column, Dvoretsky and Dvoretsky, 2024b).
One possible explanation for the absence of interannual variability in the analyzed dataset is that potential interannual differences may have been masked by natural heterogeneity in the depth and spatial distribution of copepods, which is a natural feature of zooplankton and not an effect of climate change. Although the distribution of copepods within the three distinguished depth layers (0-20, 20-50, 50-100 m) did not differ much (Supplementary Figures 2-4 for copepod abundance, biomass and secondary production, respectively), similarly to the zooplankton distribution in the same region described by Wold et al. (2023), the within-group variability of copepod occurrence data across different depth layers at a station was nevertheless high. This reduced the power of the analyses and potentially masked interannual variability. Furthermore, using depth layers as replicates introduces pseudoreplication, which may lead to optimistic estimates affecting the statistical inference. But the large variance observed within stations implies that effect size must be large for significant effects to emerge. To address these challenges, a sampling plan which involves replicate sampling with vertical resolution across multiple stations within each region would be crucial, enabling the inclusion of depth as a predictor in the statistical model to correct for potential differences between depths. Unfortunately, this is a very challenging sampling plan both at sea and in the laboratory and could not be implemented, even for such a large-scale research program as The Nansen Legacy. Further sampling efforts are needed to conclusively answer the important question of the effect of sea-ice reduction on the bulk copepod secondary production and should ideally focus on specific regions to investigate long-term trends. Despite its potential, this approach would require long-term monitoring and additional resources, posing practical challenges. At present we can discuss the question of the effects of interannual variation in sea-ice cover on copepod production based on results from short-term studies such as the present one, which, despite their limitations, provide new insights into how copepod communities respond to changes in water masses and sea ice cover.
It has previously been suggested that as the Arctic continues to warm and sea ice declines, large copepods may become less important for copepod secondary production, while the proportion of small copepods in the copepod community increases (Kimmel et al., 2018, Kimmel et al., 2023) and our observations support this notion. We found significant differences in the copepod community composition and production when comparing individual sampling sites between the two years. These changes could mainly be linked to differences in sea-ice cover at the stations between the two years. Small copepods showed the highest contribution to total copepod production at the warmer stations, but Calanus spp. was overall the largest contributor to secondary production in both years. The differences in community composition and secondary production of small and large copepods in 2018 and 2019 were consequences of the interplay of the sea-ice retreat, the phytoplankton bloom status and Atlantic water inflow. In the following we discuss each of these factors in the context of copepod community production.
4.2 Higher water temperature and the specific structuring of the microbial food web promoted secondary production of small copepods
Daily secondary production rates of 1.0-9.7 mg C m-2 d-1 for small copepods on the Barents Sea shelf are in good agreement with secondary production rates previously recorded in other Arctic regions. The maximum secondary production of small copepods in Disko Bay, western Greenland, in the upper 50 m water column was estimated as 15.5 mg C m−2 d-1 in October (Madsen et al., 2008). Secondary production values of 2.7-16.1 mg C m-2 d-1 were reported for small copepods in Ura Bay, when aggregating Dvoretsky and Dvoretsky (2012) mean daily secondary production rates of different copepod species and converting them to carbon mass, using a conversion factor of 0.4 (Peters and Downing, 1984). When comparing the integrated secondary production of small copepods reported in the present study to the integrated primary production in 2018, it becomes apparent that small copepods played a moderate role for carbon transport to higher trophic levels. At the Atlantic station P1, the integrated primary production in the upper 100 m was 632 mg C m-2 d-1 (Amargant-Arumí et al., 2024) and secondary production of small copepods was 13.8 mg C m-2 d-1, which equals an energy transfer of 2.2%. On the Barents Sea shelf, integrated primary production was between 652-710 mg C m-2 d-1 (stations P4 and P2, respectively, Amargant-Arumí et al., 2024) and secondary production of small copepods was 4.3-9.7 mg C m-2 d-1 (stations P4 and P2, respectively), equal to an energy transfer of 0.6-1.4%.
There were no significant interannual differences in secondary production of small copepods, but variations were observed between locations, with highest production occurring in warm waters in the southernmost part of the transect. In 2018, water temperatures in the study area were overall higher, less sea-ice was present and chlorophyll a concentrations were low (Kohlbach et al., 2023). In August 2018, the protist community was in a late-summer oligotrophic state, dominated by small-sized autotrophic and heterotrophic protists, predominantly flagellates and ciliates (Kohlbach et al., 2023). Highest primary production in 2018 was observed at the southernmost station of the transect (P1), where the growth of small pico- and nano-flagellated cells was sustained by nutrient input through Atlantic Water inflow (Amargant-Arumí et al., 2024). Along the rest of the transect, primary production was overall low and no latitudinal structuring of the microbial community was observed (Amargant-Arumí et al., 2024). In 2019, on the other hand, the microbial community was latitudinally structured (Kohlbach et al., 2023), with highest primary and bacterial production occurring close to the sea-ice edge (around station P4, Amargant-Arumí et al., 2024). With increasing distance to the ice-edge, higher nutrient and chlorophyll a concentrations were observed at deeper water layers at the southern stations. The southernmost station P1 was dominated by late-summer protist communities, including high numbers of ciliates in both years (Kohlbach et al., 2023). Our analyses showed that secondary production of small copepods (e.g. Oithona spp.) had a positive relationship with the number of ice-free days, which was strongly correlated with the overall water temperature in the study area (Figure 3). A positive relationship between secondary production of O. similis and temperature has previously been demonstrated by Balazy et al. (2021). This can be explained by the fact that egg hatching and developmental rates of copepods are positively correlated with temperature, resulting in higher secondary production at higher temperature (Nielsen et al., 2002; Dvoretsky and Dvoretsky, 2009). The development and growth of small copepods appears to depend more directly on water temperature than that of large copepods, whose production is more food dependent. Because of their size, small copepods live in conditions close to food saturation (Kiørboe and Sabatini, 1995). Furthermore, species of the genus Oithona prey upon a larger variety of prey items including dinoflagellates, phytoplankton, and faecal material (Gallienne and Robins, 2001), with a preference for swimming prey particles such as ciliates (Svensen and Kiørboe, 2000; Zamora-Terol et al., 2013). This makes them able to sustain higher productivity in low chlorophyll a conditions (Sabatini and Kiørboe, 1994), as has been observed in this study in 2018 and explains the positive correlation of secondary production with ciliate abundance that we observed. In the Bering Sea, both the abundance and secondary production of the small copepods Oithona spp. and Pseudocalanus spp. were higher during a warm period (2001–2005) compared to a cold period (2007–2011) (Hunt et al., 2011; Stabeno et al., 2012; Eisner et al., 2014; Kimmel et al., 2018). In the Barents Sea, higher abundance of small copepods has previously been linked to higher water temperatures (Trudnowska et al., 2016; Balazy et al., 2018).
4.3 Water mass distribution shaped the spatial pattern of secondary production of Calanus finmarchicus
The daily secondary production rates of large copepods in the range of 50.8-250.7 mg C m-2 d-1 for the Barents Sea shelf reported in this study are in good agreement with secondary production previously recorded in other Arctic regions. The highest secondary production rates for Calanus spp. of 250 mg C m-2 d-1 have been estimated in Disko Bay, western Greenland, in the upper 50 m water column in May/June (Madsen et al., 2001). Dvoretsky and Dvoretsky (2012) reported secondary production values of 13.3-14.0 mg C m-2 d-1 for large copepods in Ura Bay (low copepod biomass in coastal Barents Sea area). When comparing the integrated secondary production of large copepods to the integrated primary production in 2019 it becomes apparent that large copepods were especially important for energy transfer to higher trophic levels in the marginal ice zone. On the Barents Sea shelf, integrated primary production in the upper 100 m was 261-551 mg C m-2 d-1 (stations P5 and P4, respectively) and secondary production of large copepods was 182.8-250.7mg C m-2 d-1 (stations P4 and P5, respectively), equivalent to an energy transfer of 33.2-96.1%. At the Atlantic station P1, energy transfer only equaled 10%, based on an integrated primary production of 340 mg C m-2 d-1 and secondary production of large copepods of 32.7 mg C m-2 d-1.
We observed overall higher abundance, biomass, and secondary production of Calanus in the size range of the boreal species C. finmarchicus in the year that was characterized by presence of Atlantic Water in the southern part of the study area (2018). The recent Arctic winter sea-ice retreat in the Barents Sea has been linked to a strengthening of the Atlantic water inflow into this region and warming of the water masses (Årthun et al., 2012) i.e. ‘Atlantification’. As a result of this event, an increasing number of organisms from boreal regions can be advected into the Arctic (Freer et al., 2022). Currently, low water temperatures prevent the boreal species C. finmarchicus from establishing a population that can successfully reproduce in the Arctic Ocean (Ji et al., 2012). However, this may change with continued ocean warming and a prolonged retreat of the ice edge (Tarling et al., 2022). A modelling study by Slagstad et al. (2015) showed that with rising water temperature and increasing Atlantic water inflow, the production areas of C. finmarchicus will steadily expand into the Greenland Sea, northern Barents Sea, and western Kara Sea. Likewise, warming and an extended growth season due to earlier sea-ice retreat have been suggested to increase the suitability of pelagic habitats in the Fram Strait for C. finmarchicus (Freer et al., 2022; Tarling et al., 2022). The large fraction of smaller Calanus found on the Barents Sea shelf in our study indicates an advection of C. finmarchicus onto the shelf from the southern Barents Sea (Gluchowska et al., 2017), while those in the Arctic Ocean basin are transported into this region with the West Spitsbergen Current (Basedow et al., 2018).
4.4 Differences in sea-ice cover influenced Calanus glacialis reproduction
Significantly higher secondary production of the larger Calanus (i.e. C. glacialis) was observed in the year with extensive sea-ice cover (2019), when chlorophyll a concentrations were higher and the protist community was in a late-bloom stage and showed a dominance of autotrophs and large-celled phytoplankton, in particular diatoms (Kohlbach et al., 2023). Highest primary production in 2019 was found at station P5 closest to the ice edge on the Barents Sea shelf. The marginal ice zone bloom had a typical south-to-north progression, where primary production shifted into deeper water layers in the southern parts of the study area (Amargant-Arumí et al., 2024). The sea-ice breakup in 2019 was at the beginning of July, compared to mid-May in 2018, and likely resulted in a longer ice-algae season and an extended spring bloom in 2019 (Kohlbach et al., 2023). This was supported by high numbers of calanoid nauplii observed close to the ice edge at station P3 in 2019, and the presence of CI and CII at the stations south of P3, that may indicate that reproduction took place some weeks earlier. Overall, higher abundance of older Calanus copepodids in 2018 compared to 2019 indicated that reproduction in 2018 had started earlier than in 2019. In 2018 biomass and secondary production of C. glacialis (i.e. the larger size fraction of the Calanus population) on the Barents Sea shelf were however generally lower than in 2019, possibly due to a mismatch between the reproduction of the species and the bloom phenology, and consequently lower recruitment. The life history strategy of C. glacialis is tightly linked to the distribution and timing of sea-ice cover and the resulting timing of the ice-algae and phytoplankton blooms (Falk-Petersen et al., 2009; Daase et al., 2013; Feng et al., 2016, Feng et al., 2018). The nutritional quality of both ice algae and phytoplankton is highest at the beginning of the bloom (Søreide et al., 2010; Leu et al., 2011) and C. glacialis females can increase their reproductive output if an ice algae bloom is available to fuel egg maturation, while they must rely to a large extent on internal energy reserves from the previous feeding season in the absence of an ice algae bloom (Søreide et al., 2010). The reduction of sea-ice thickness and extent alters the current primary production regime, shortening the growth period of ice algae and advancing the onset of the open water phytoplankton growth season (Arrigo et al., 2008; Søreide et al., 2010). At sub-zero temperatures, the species’ nauplii require about three weeks to develop to the first naupliar stage that feeds (Daase et al., 2011). If the phytoplankton bloom occurs shortly after the ice algae bloom, the new generation may miss the early, high-quality food phase of the bloom, thus reducing the reproductive success.
C. glacialis secondary production was higher in the ice-covered northern parts of the study area in 2019. However, this trend was not significant, likely due to high within-group variance compared to the number of replicates in this study. Our observations nevertheless agree with previous studies showing elevated secondary production of large Calanus spp. during a cold period (2007–2011) compared to a warm period with reduced sea-ice cover (2001–2005) in the Bering Sea (Hunt et al., 2011; Stabeno et al., 2012; Eisner et al., 2014; Kimmel et al., 2018, Kimmel et al., 2023). While a mismatch scenario between C. glacialis reproduction and the phytoplankton bloom may explain the interannual variation in the local Calanus population in the Barents Sea, there is so far little evidence that sea-ice loss has been detrimental to Calanus populations in other parts of the European Arctic. Studies from Svalbard fjords suggest that warming and sea-ice loss benefit C. glacialis populations (Hatlebakk et al., 2022). Life history models by Feng et al. (2016); Feng et al. (2018) showed that early ice retreat, warming, increased phytoplankton food availability and prolonged growth season overall create favorable conditions for C. glacialis development, leading to a northward expansion of well prospering populations of the species as the sea ice retreats. This has been confirmed by observations from the polar basin, indicating a northwards expansion of C. glacialis (Kvile et al., 2019; Ershova et al., 2021).
It should be noted that due to the identification of C. finmarchicus and C. glacialis based on size alone, there is a possibility of an underestimation of C. glacialis abundance, as the prosome lengths of the early developmental stages of the two species may overlap for populations thriving in convergence areas. Additionally, because we only looked at communities within the upper 100 m of the water column for this study, we may also have missed parts of the Calanus population that have likely already descended to greater depths at this time of the year. However, including diapausing Calanus spp. in production estimates would likely result in an overestimation of secondary production in this area. Also, even if some Calanus spp. in the two years might have been misidentified, the conclusion that secondary production of large copepods in 2018 was mainly driven by Calanus within the size range of C. finmarchicus and in 2019 by Calanus within the size range of C. glacialis, would remain the same, as the differences in secondary production between the two years were pronounced.
While our data indicates that differences in bloom phenology and food availability between the two years may explain the observed changes in community composition from larger to smaller species, the presence of sea ice itself and its effect on visual predation risk may have played an important role. A recent study from the Barents Sea suggests that the prevalence of large copepods in deeper troughs and under sea ice is best explained by top-down control (Langbehn et al., 2023). Large copepods, such as Calanus spp., experience a reduced visual predation risk and subsequent increased survival rate where sea ice shades the water. The increased predation risk in open waters can therefore shift the community to a dominance of smaller species (Aarflot et al., 2019; Langbehn et al., 2023), which is also in accordance with our observations.
4.5 Changes in copepod secondary production and the marine food web
Even though our results suggest that the total secondary production in a year with less sea-ice cover is not different from a year with extended sea-ice cover, we speculate that the shift towards smaller organisms may affect the food quality and availability for planktivorous organisms, ultimately leading to food web changes. In terms of biomass, calanoid copepods are the major component of the mesozooplankton community in the Arctic (Falk-Petersen et al., 2009), due to their high lipid content that can account for 50-70% of their dry mass (Falk-Petersen et al., 2009). The lipid content of Calanus spp. is size rather than species specific and a shift in dominance from larger to smaller Calanus individuals would lead to a reduction in lipid production at the individual level, but not necessary on population level, if overall turn-over rates increase (Renaud et al., 2018). Early larval stages of many fish species, such as Atlantic herring (Clupea harengus), Atlantic cod (Gadus morhua), haddock (Melanogrammus aeglefinus), Alaska pollock (Gadus chalcogrammus) and polar cod (Boreogadus saida) have a specific prey preference for calanoid nauplii, due to their high lipid content in comparison to other copepod nauplii (Kane, 1984; Napp et al., 2000; Swalethorp et al., 2014; Bouchard and Fortier, 2020). Even though cyclopoid copepods, such as those of Oithona spp., are often found in much higher abundance than calanoid copepods, their contribution to the diet of these fish species is considerably less important (Kane, 1984; Napp et al., 2000; Swalethorp et al., 2014). In some Arctic regions, low abundance of preferred prey (e.g. Calanus spp., Pseudocalanus spp., and Temora longicornis) has been linked to lower recruitment of pollock (Kimmel et al., 2018) and mackerel (Lafontaine, 1999; Paradis et al., 2012). Similar to the observed trends in other regions of the Arctic, we hypothesize that the recruitment of commercially and ecologically important fish species in the Barents Sea, such as polar cod, capelin, and Atlantic herring, may be lower in years with increased water temperature and reduced summer sea-ice, due to a shift towards a more generalist diet based on smaller-sized, less lipid-rich copepods.
Zooplankton groups other than copepods can be important both in terms of abundance and biomass in the Barents Sea. Meroplankton, e.g. Bivalvia and Echinodermata larvae, emerged across the study transect in summer (Wold et al., 2023) and high abundance of arrow worms (Parasagitta elegans), pteropods (Limacina helicina) and gelatinous zooplankton were observed (Van Engeland et al., 2023; Wold et al., 2023). In the present study, we focus solely on copepod secondary production, given the pivotal role of copepods in transferring energy to higher trophic levels in Barents Sea food webs (Pedersen et al., 2021). Most of the secondary production research has focused on copepods, as the majority of available growth rate models are tailored specifically to this group. Due to the complicated life cycle of some non-copepod groups, especially gelatinous zooplankton, determination of their growth rates can be difficult (Postel et al., 2000). Therefore, total secondary production in the study area is likely higher, especially in the Atlantic region and the Arctic Ocean basin, where the contribution of non-zooplankton groups was found to be larger than in the Arctic parts of the study area (Van Engeland et al., 2023; Wold et al., 2023). Copepods can also impact the biological carbon pump through feeding on phytoplankton and aggregates, as well as through fecal pellet production (Jumars et al., 1989). Larger, current-feeding copepods, such as Calanus spp., can increase the flux of particulate organic carbon (POC) through efficient grazing and production of large, fast sinking fecal pellets (e.g. Riser et al., 2008). Many small copepod taxa are particle-feeders and can decrease POC export efficiency through feeding on organic particles (e.g. Koski et al., 2020; Koski and Lombard, 2022; Mooney et al., 2023). A shift of the copepod community towards smaller-sized species will possibly be reflected in a compositional and quantitative change of the vertical flux in the Barents Sea. Indications supporting this hypothesis are the lower vertical flux in the study area in 2018 with no attenuation with depth, while the vertical flux in 2019 was higher and showed a strong attenuation profile (Amargant-Arumí et al., 2024).
5 Conclusions
The Barents Sea, known for its high productivity, sustains a substantial commercial fishery. Despite declining sea-ice, the impact on lower trophic levels’ productivity is still under debate. In particular, the impact of environmental change on copepod secondary production is not well understood at present. We expected to find higher total bulk copepod secondary production in a summer with reduced sea-ice cover, due to a hypothesized extended period of primary production and consequently higher food availability. However, our observations did not support this hypothesis. Instead, we found that spatial rather than interannual differences dominated the observed variation of copepod secondary production in the Barents Sea. Here, Atlantic waters in summer were characterized by a high contribution of small copepods to total copepod secondary production, as they benefited from higher water temperatures and a more abundant microbial food web in this region. Copepod secondary production on the northern Barents Sea shelf, the study focus area, was overall highest and mainly driven by large Calanus spp. Our study shows that if environmental conditions (e.g. the presence of sea ice or water temperature) change to an appropriate extent in a habitat from year to year, this will affect the copepod community composition and its production. There were significant interannual differences of the Calanus spp. community composition between the two years, with the smaller C. finmarchicus being more important for total copepod secondary production during the summer with less sea-ice cover and in habitats characterized by higher water temperatures and a pronounced Atlantic water signal. The larger C. glacialis, on the other hand, was more important in the summer with extensive sea-ice cover and in habitats with lower water temperatures, sea-ice cover and with the presence and higher contribution of diatoms to pelagic primary production.
Due to high spatial heterogeneity in copepod distribution and consequently high variability in secondary production, we still cannot conclude with high confidence which effect the sea-ice decline will have on bulk copepod secondary production in the Barents Sea. Despite its limitations, our study provides important insight into the copepod community response to changes in water masses and sea-ice cover. The results of our study confirm the observations that, as a result of Arctic warming and reduced sea ice, large copepods may become less important and smaller-sized copepod species (including smaller-sized Calanus and small copepods) more important components of pelagic communities, which will have consequences for the secondary production of copepods, as well as for the role of copepods in food webs, bio-geochemical cycles, including the biological carbon pump, and other functions performed by them in the ecosystem.
Data availability statement
The original contributions presented in the study are included in the article/Supplementary Material. Further inquiries can be directed to the corresponding author.
Ethics statement
The manuscript presents research on animals that do not require ethical approval for their study.
Author contributions
CG: Writing – review & editing, Writing – original draft, Visualization, Methodology, Investigation, Formal analysis, Data curation, Conceptualization. MD: Writing – review & editing, Writing – original draft, Visualization, Supervision, Methodology, Conceptualization. RP: Writing – review & editing, Visualization, Supervision, Software, Methodology, Formal analysis, Data curation, Conceptualization. MA-A: Writing – review & editing, Formal analysis, Data curation, Conceptualization. OM: Writing – review & editing, Formal analysis, Data curation, Conceptualization. AW: Writing – review & editing, Investigation, Data curation, Conceptualization. MO: Writing – review & editing, Formal analysis, Data curation. SK: Writing – review & editing, Writing – original draft, Supervision, Methodology, Formal analysis, Data curation. CS: Writing – review & editing, Writing – original draft, Supervision, Methodology, Funding acquisition, Data curation, Conceptualization.
Funding
The author(s) declare financial support was received for the research, authorship, and/or publication of this article. This work was funded by the Research Council of Norway through the project The Nansen Legacy (RCN # 276730).
Acknowledgments
We would like to thank the captain and crew of R/V Kronprins Haakon for their excellent support at sea during the Nansen Legacy research cruises in 2018 (JC1-2) and 2019 (Q3). We would like to thank the Institute of Oceanology of the Polish Academy of Sciences (IO PAN) for cooperation in laboratory analysis of zooplankton samples.
Conflict of interest
The authors declare that the research was conducted in the absence of any commercial or financial relationships that could be construed as a potential conflict of interest.
Publisher’s note
All claims expressed in this article are solely those of the authors and do not necessarily represent those of their affiliated organizations, or those of the publisher, the editors and the reviewers. Any product that may be evaluated in this article, or claim that may be made by its manufacturer, is not guaranteed or endorsed by the publisher.
Supplementary material
The Supplementary Material for this article can be found online at: https://www.frontiersin.org/articles/10.3389/fmars.2024.1308542/full#supplementary-material
References
Aarflot J. M., Aksnes D. L., Opdal A. F., Skjoldal H. R., Fiksen Ø. (2019). Caught in broad daylight: topographic constraints of zooplankton depth distributions. Limnol. Oceanogr. 64, 849–859. doi: 10.1002/lno.11079
Amargant-Arumí M., Müller O., Bodur Y. V., Ntinou I. V., Vonnahme T., Assmy P., et al. (2024). Interannual differences in sea ice regime in the north-western Barents Sea cause major changes in summer pelagic production and export mechanisms. Prog. Oceanogr. 220, 103178. doi: 10.1016/j.pocean.2023.103178
Arrigo K. R., van Dijken G., Pabi S. (2008). Impact of a shrinking Arctic ice cover on marine primary production. Geophys. Res. Lett. 35, L19603. doi: 10.1029/2008GL035028
Årthun M., Eldevik T., Smedsrud L. H., Skagseth Ø., Ingvaldsen R. B. (2012). Quantifying the influence of Atlantic heat on Barents Sea ice variability and retreat. J. Clim. 25, 4736–4743. doi: 10.1175/JCLI-D-11-00466.1
Ashjian C. J., Campbell R. G., Welch H. E., Butler M., van Keuren D. (2003). Annual cycle in abundance, distribution, and size in relation to hydrography of important copepod species in the western Arctic Ocean. Deep Sea Res. Part I 50, 1235–1261. doi: 10.1016/S0967-0637(03)00129-8
Assmy P., Gradinger R., Edvardsen B., Wold A., Goraguer L., Wiktor J., et al. (2022a). Phytoplankton biodiversity nansen legacy JC1. doi: 10.21334/npolar.2022.c86f931f
Assmy P., Gradinger R., Edvardsen B., Wold A., Goraguer L., Wiktor J., et al. (2022b). Phytoplankton biodiversity nansen legacy Q3. doi: 10.21334/npolar.2022.dadccf78
Bagøien E., Bogstad B., Dalpadado P., Dolgov A. V., Eriksen E., Fauchald J., et al. (2020). Working Group on the Integrated Assessments of the Barents Sea (WGIBAR). (ICES Scientific Reports). 1 (42), 157. doi: 10.17895/ices.pub.5536
Balazy K., Boehnke R., Trudnowska E., Søreide J. E., Błachowiak-Samołyk K. (2021). Phenology of Oithona similis demonstrates that ecological flexibility may be a winning trait in the warming Arctic. Sci. Rep. 11, 18599. doi: 10.1038/s41598-021-98068-8
Balazy K., Trudnowska E., Wichorowski M., Błachowiak-Samołyk K. (2018). Large versus small zooplankton in relation to temperature in the Arctic shelf region. Pol. Res. 37, 1427409. doi: 10.1080/17518369.2018.1427409
Basedow S. L., Eiane K., Tverberg V., Spindler M. (2004). Advection of zooplankton in an Arctic fjord (Kongsfjorden, Svalbard). Estuar. Coast. Shelf Sci. 60, 113–124. doi: 10.1016/j.ecss.2003.12.004
Basedow S. L., Sundfjord A., von Appen W.-J., Halvorsen E., Kwasniewski S., Reigstad M. (2018). Seasonal variation in transport of zooplankton into the Arctic Basin through the Atlantic gateway, Fram Strait. Front. Mar. Sci. 5. doi: 10.3389/fmars.2018.00194
Basedow S. L., Zhou M., Tande K. S. (2014). Secondary production at the polar front, Barents Sea, August 2007. J. Mar. Syst. 130, 147–159. doi: 10.1016/j.jmarsys.2013.07.015
Blachowiak-Samolyk K., Søreide J. E., Kwasniewski S., Sundfjord A., Hop H., Falk-Petersen S., et al. (2008). Hydrodynamic control of mesozooplankton abundance and biomass in northern Svalbard waters (79-81 N). Deep Sea Res. Part II 55, 2210–2224. doi: 10.1016/j.dsr2.2008.05.018
Bouchard C., Fortier L. (2020). The importance of Calanus glacialis for the feeding success of young polar cod: a circumpolar synthesis. Polar Biol. 43, 1095–1107. doi: 10.1007/s00300-020-02643-0
Bouchard C., Geoffroy M., LeBlanc M., Majewski A., Gauthier S., Walkusz, et al. (2017). Climate warming enhances polar cod recruitment, at least transiently. Prog. Oceanogr. 156, 121–129. doi: 10.1016/j.pocean.2017.06.008
Choquet M., Kosobokova K., Kwaśniewski S., Hatlebakk M., Dhanasiri A. K., Melle W., et al. (2018). Can morphology reliably distinguish between the copepods Calanus finmarchicus and C. glacialis, or is DNA the only way? Limnol. Oceanogr. Methods 16, 237–252. doi: 10.1002/lom3.10240
Coyle K. O., Pinchuk A. I. (2002). Climate-related differences in zooplankton density and growth on the inner shelf of the southeastern Bering Sea. Prog. Oceanogr. 55, 177–194. doi: 10.1016/S0079-6611(02)00077-0
Daase M., Eiane K. (2007). Mesozooplankton distribution in northern Svalbard waters in relation to hydrography. Polar Biol. 30 pp, 969–981. doi: 10.1007/s00300-007-0255-5
Daase M., Falk-Petersen S., Varpe Ø., Darnis G., Søreide J. E., Wold A., et al. (2013). Timing of reproductive events in the marine copepod Calanus glacialis: a pan-Arctic perspective. Can. J. Fish. Aquat. Sci. 70, 871–884. doi: 10.1139/cjfas-2012-0401
Daase M., Søreide J. E., Martynova D. (2011). Effects of food quality on naupliar development in Calanus glacialis at subzero temperatures. Mar. Ecol. Prog. Ser. 429, 111–124. doi: 10.3354/meps09075
Dalpadado P., Ingvaldsen R. B., Hassel A. (2003). Zooplankton biomass variation in relation to climatic conditions in the Barents Sea. Polar Biol. 26, 233–241. doi: 10.1007/s00300-002-0470-z
Dalpadado P., Ingvaldsen R. B., Stige L. C., Bogstad B., Knutsen T., Ottersen G., et al. (2012). Climate effects on Barents Sea ecosystem dynamics. ICES J. Mar. Sci. 69, 1303–1316. doi: 10.1093/icesjms/fss063
Darnis G., Fortier L. (2014). Temperature, food and the seasonal vertical migration of key arctic copepods in the thermally stratified Amundsen Gulf (Beaufort Sea, Arctic Ocean). J. Plankton Res. 36, 1092–1108. doi: 10.1093/plankt/fbu035
Dvoretsky V. G., Dvoretsky A. G. (2009). Life cycle of Oithona similis (Copepoda: Cyclopoida) in Kola Bay (Barents Sea). Mar. Biol. 156, 1433–1446. doi: 10.1007/s00227-009-1183-4
Dvoretsky V. G., Dvoretsky A. G. (2012). Estimated copepod production rate and structure of mesozooplankton communities in the coastal Barents Sea during summer-autumn 2007. Polar Biol. 35, 1321–1342. doi: 10.1007/s00300-012-1175-6
Dvoretsky V. G., Dvoretsky A. G. (2024a). Marine copepod assemblages in the Arctic: The effect of frontal zones on biomass and productivity. Mar. Environ. Res. 193, 106250. doi: 10.1016/j.marenvres.2023.106250
Dvoretsky V. G., Dvoretsky A. G. (2024b). Local variability of Arctic mesozooplankton biomass and production: A case summer study. Environ. Res. 241, 117416. doi: 10.1016/j.envres.2023.117416
Efstathiou E., Eldevik T., Årthun M., Lind S. (2022). Spatial patterns, mechanisms, and predictability of Barents Sea ice change. J. Clim. 35, 2961–2973. doi: 10.1175/JCLI-D-21-0044.1
Eisner L. B., Napp J. M., Mier K. L., Pinchuk A. I., Andrews III, A.G. (2014). Climate-mediated changes in zooplankton community structure for the eastern Bering Sea. Deep Sea Res. Part II 109, 157–171. doi: 10.1016/j.dsr2.2014.03.004
Ershova E. A., Kosobokova K. N., Banas N. S., Ellingsen I., Niehoff B., Hildebrandt N., et al. (2021). Sea ice decline drives biogeographical shifts of key Calanus species in the central Arctic Ocean. Global Change Biol. 27, 2128–2143. doi: 10.1111/gcb.15562
Falk-Petersen S., Mayzaud P., Kattner G., Sargent J. R. (2009). Lipids and life strategy of Arctic Calanus. Mar. Biol. Res. 5, 18–39. doi: 10.1080/17451000802512267
Feng Z., Ji R., Ashjian C., Campbell R., Zhang J. (2018). Biogeographic responses of the copepod Calanus glacialis to a changing Arctic marine environment. Global Change Biol. 24, e159–e170. doi: 10.1111/gcb.13890
Feng Z., Ji R., Campbell R. G., Ashjian C. J., Zhang J. (2016). Early ice retreat and ocean warming may induce copepod biogeographic boundary shifts in the Arctic Ocean. J. Geophys. Res.: Oceans 121, 6137–6158. doi: 10.1002/2016JC011784
Freer J. J., Daase M., Tarling G. A. (2022). Modelling the biogeographic boundary shift of Calanus finmarchicus reveals drivers of Arctic Atlantification by subarctic zooplankton. Global Change Biol. 28, 429–440. doi: 10.1111/gcb.15937
Gabrielsen T. M., Merkel B., Søreide J. E., Johansson-Karlsson E., Bailey A., Vogedes D., et al. (2012). Potential misidentifications of two climate indicator species of the marine arctic ecosystem: Calanus glacialis and C. finmarchicus. Polar Biol. 35, 1621–1628. doi: 10.1007/s00300-012-1202-7
Gallienne C. P., Robins D. B. (2001). Is Oithona the most important copepod in the world’s oceans? J. Plankton Res. 23, 1421–1432. doi: 10.1093/plankt/23.12.1421
Geoffroy M., Priou P. (2020). “Fish ecology during the polar night,” in POLAR NIGHT Marine Ecology: Life and Light in the Dead of Night, 181–216 (Springer Cham).
Gluchowska M., Trudnowska E., Goszczko I., Kubiszyn A. M., Blachowiak-Samolyk K., Walczowski W., et al. (2017). Variations in the structural and functional diversity of zooplankton over vertical and horizontal environmental gradients en route to the Arctic Ocean through the Fram Strait. PloS One 12, e0171715. doi: 10.1371/journal.pone.0171715
Hassel A., Skjoldal H. R., Gjøsæter H., Loeng H., Omli L. (1991). Impact of grazing from capelin (Mallotus villosus) on zooplankton: a case study in the northern Barents Sea in August 1985. Polar Res. 10, 371–388. doi: 10.1111/j.1751-8369.1991.tb00660.x
Hatlebakk M. K. V., Kosobokova K. N., Daase M., Søreide J. (2022). Contrasting life traits of sympatric Calanus glacialis and C. finmarchicus in a warming Arctic revealed by a year-round study in Isfjorden, Svalbard. Front. Mar. Sci 9, 877910. doi: 10.3389/fmars.2022.877910
Hirche H.-J. (1996). Diapause in the marine copepod, Calanus finmarchicus—a review. Ophelia 44, 129–143. doi: 10.1080/00785326.1995.10429843
Hirche H. J., Hagen W., Mumm N., Richter C. (1994). The Northeast Water polynya, Greenland Sea: III. Meso-and macrozooplankton distribution and production of dominant herbivorous copepods during spring. Polar Biol. 14, 491–503. doi: 10.1007/BF00239054
Hirst A. G., Lampitt R. S. (1998). Towards a global model of in situ weight-specific growth in marine planktonic copepods. Mar. Biol. 132, 247–257. doi: 10.1007/s002270050390
Holm-Hansen O., Riemann B. (1978). Chlorophyll a determination: improvements in methodology (Oikos), 438–447. doi: 10.2307/3543338
Hunt G. L. Jr., Coyle K. O., Eisner L. B., Farley E. V., Heintz R. A., Mueter F., et al. (2011). Climate impacts on eastern Bering Sea foodwebs: a synthesis of new data and an assessment of the Oscillating Control Hypothesis. ICES J. Mar. Sci. 68, 1230–1243. doi: 10.1093/icesjms/fsr036
Huse G., Toresen R. (1996). A comparative study of the feeding habits of herring (Clupea harengus, Clupeidae, 1.) and capelin (Mallotus villosus, Osmeridae, müller) in the Barents Sea. Sarsia 81, 143–153. doi: 10.1080/00364827.1996.10413618
Ingvaldsen R. (2022). CTD data from Nansen Legacy Cruise - Joint cruise. 1–2. doi: 10.21335/NMDC-714672628
Isaksen K., Nordli Ø., Ivanov B., Køltzow M.A.Ø., Aaboe S., Gjelten H. M., et al. (2022). Exceptional warming over the Barents area. Sci. Rep. 12, 1–18. doi: 10.1038/s41598-022-13568-5
Ji R., Ashjian C. J., Campbell R. G., Chen C., Gao G., Davis C. S., et al. (2012). Life history and biogeography of Calanus copepods in the Arctic Ocean: an individual-based modeling study. Prog. Oceanogr. 96, 40–56. doi: 10.1016/j.pocean.2011.10.001
Jumars P. A., Penry D. L., Baross J. A., Perry M. J., Frost B. W., Part A. (1989). Closing the microbial loop: dissolved carbon pathway to heterotrophic bacteria from incomplete ingestion, digestion and absorption in animals. Deep Sea Res. 36 (4), 483–495. doi: 10.1016/0198-0149(89)90001-0
Kane J. (1984). The feeding habits of co-occurring cod and haddock larvae from Georges Bank. Mar. Ecol. Prog. Ser. 16, 9–20. doi: 10.3354/meps016009
Kimmel D. G., Eisner L. B., Pinchuk A. I. (2023). The northern Bering Sea zooplankton community response to variability in sea ice: evidence from a series of warm and cold periods. Mar. Ecol. Prog. Ser. 705, 21–42. doi: 10.3354/meps14237
Kimmel D. G., Eisner L. B., Wilson M. T., Duffy-Anderson J. T. (2018). Copepod dynamics across warm and cold periods in the eastern Bering Sea: implications for walleye pollock (Gadus chalcogrammus) and the Oscillating Control Hypothesis. Fish. Oceanogr. 27, 143–158. doi: 10.1111/fog.12241
Kiørboe T., Sabatini M. (1995). Scaling of fecundity, growth and development in marine planktonic copepods. Mar. Ecol. Prog. Ser. 120, 285–298. doi: 10.3354/meps120285
Kobari T., Sastri A. R., Yebra L., Liu H., Hopcroft R. R. (2019). Evaluation of trade-offs in traditional methodologies for measuring metazooplankton growth rates: assumptions, advantages and disadvantages for field applications. Prog. Oceanogr 178, 102137. doi: 10.1016/j.pocean.2019.102137
Kohlbach D., Goraguer L., Bodur Y. V., Müller O., Amargant-Arumí, Blix K., et al. (2023). Earlier sea-ice melt extends the oligotrophic summer period in the Barents Sea with low algal biomass and associated low vertical flux. Prog. Oceanogr 103018. doi: 10.1016/j.pocean.2023.103018
Koski M., Lombard F. (2022). Functional responses of aggregate-colonizing copepods. Limnol. Oceanogr 67, 2059–2072. doi: 10.1002/lno.12187
Koski M., Valencia B., Newstead R., Thiele C. (2020). The missing piece of the upper mesopelagic carbon budget? Biomass, vertical distribution and feeding of aggregate-associated copepods at the PAP site. Progr. Oceanogr 181, 102243. doi: 10.1016/j.pocean.2019.102243
Kosobokova K., Hirche H. J. (2009). Biomass of zooplankton in the eastern Arctic Ocean–a base line study. Prog. Oceanogr. 82, 265–280. doi: 10.1016/j.pocean.2009.07.006
Kosobokova K. N., Hopcroft R. R., Hirche H. J. (2011). Patterns of zooplankton diversity through the depths of the Arctic’s central basins. Mar. Biodiv. 41, 29–50. doi: 10.1007/s12526-010-0057-9
Kvile K.Ø., Ashjian C., Ji R. (2019). Pan-Arctic depth distribution of diapausing Calanus copepods. Biolog. Bull. 237, 76–89. doi: 10.1086/704694
Kwasniewski S., Gluchowska M., Jakubas D., Wojczulanis-Jakubas K., Walkusz W., Karnovsky N., et al. (2010). The impact of different hydrographic conditions and zooplankton communities on provisioning Little Auks along the West coast of Spitsbergen. Prog. Oceanogr. 87, 72–82. doi: 10.1016/j.pocean.2010.06.004
Kwasniewski S., Hop H., Falk-Petersen S., Pedersen G. (2003). Distribution of Calanus species in Kongsfjorden, a glacial fjord in Svalbard. J. Plankton Res. 25, 1–20. doi: 10.1093/plankt/25.1.1
Lafontaine Y. (1999). Covariation in climate, zooplankton biomass and mackerel recruitment in the southern Gulf of St Lawrence. Fish. Oceanogr. 8, 139–149. doi: 10.1046/j.1365-2419.1999.00095.x
Langbehn T. J., Aarflot J. M., Freer J. J., Varpe Ø. (2023). Visual predation risk and spatial distributions of large Arctic copepods along gradients of sea ice and bottom depth. Limn. Oceanogr 68 (6), 1388–1405. doi: 10.1002/lno.12354
Leu E., Søreide J. E., Hessen D. O., Falk-Petersen S., Berge J. (2011). Consequences of changing sea-ice cover for primary and secondary producers in the European Arctic shelf seas: timing, quantity, and quality. Prog. Oceanogr. 90, 18–32. doi: 10.1016/j.pocean.2011.02.004
Levinsen H., Turner J. T., Nielsen T. G., Hansen B. W. (2000). On the trophic coupling between protists and copepods in arctic marine ecosystems. Mar. Ecol. Prog. Ser. 204, 65–77. doi: 10.3354/meps204065
Lischka S., Hagen W. (2005). Life histories of the copepods Pseudocalanus minutus, P. acuspes (Calanoida) and Oithona similis (Cyclopoida) in the Arctic Kongsfjorden (Svalbard). Polar Biology 28, 910–921.
Lischka S., Hagen W. (2007). Seasonal lipid dynamics of the copepods Pseudocalanus minutus (Calanoida) and Oithona similis (Cyclopoida) in the Arctic Kongsfjorden (Svalbard). Mar. Biol. 150, 443–454. doi: 10.1007/s00227-006-0359-4
Liu H., Hopcroft R. R. (2006). Growth and development of Neocalanus flemingeri/plumchrus in the northern Gulf of Alaska: validation of the artificial-cohort method in cold waters. J. Plankton Res. 28, 87–101. doi: 10.1093/plankt/fbi102
Madsen S. D., Nielsen T. G., Hansen B. W. (2001). Annual population development and production by Calanus finmarchicus, C. glacialis and C. hyperboreus in Disko Bay, western Greenland. Mar. Biol. 139, 75–83. doi: 10.1007/s002270100552
Madsen S. D., Nielsen T. G., Hansen B. W. (2008). Annual population development and production by small copepods in Disko Bay, western Greenland. Mar. Biol. 155, 63–77. doi: 10.1007/s00227-008-1007-y
Mohamed B., Nilsen F., Skogseth R. (2022). Interannual and decadal variability of sea surface temperature and sea ice concentration in the Barents Sea. Remote Sens 14, 4413. doi: 10.3390/rs14174413
Mooney B. P., Iversen M. H., Norrbin F. (2023). Impact of Microsetella norvegica on carbon flux attenuation and as a secondary producer during the polar night in the subarctic Porsangerfjord. Front. Mar. Sci 10. doi: 10.3389/fmars.2023.996275
Müller O. (2023a). Bacterial production measurements (rate of production of biomass expressed as carbon by prokaryotes [bacteria and archaea]) during Nansen Legacy cruise 2018707 (University of Bergen). doi: 10.21335/NMDC-1815353537-2018707
Müller O. (2023b). Bacterial production measurements (rate of production of biomass expressed as carbon by prokaryotes [bacteria and archaea]) during Nansen Legacy cruise 2019706 (University of Bergen). doi: 10.21335/NMDC-1815353537-2019706
Napp J. M., Kendall A. W., Schumacher J. D. (2000). A synthesis of biological and physical processes affecting the feeding environment of larval walleye pollock (Theragra chalcogramma) in the eastern Bering Sea. Fish. Oceanogr. 9, 147–162. doi: 10.1046/j.1365-2419.2000.00129.x
Nielsen T. G., Møller E. F., Satapoomin S., Ringuette M., Hopcroft R. R. (2002). Egg hatching rate of the cyclopoid copepod Oithona similis in arctic and temperate waters. Mar. Ecol. Prog. Ser. 236, 301–306. doi: 10.3354/meps236301
NOAA National Geophysical Data Center. (2009). ETOPO1 1 Arc-Minute Global Relief Model (NOAA National Centers for Environmental Information). Available at: https://www.ngdc.noaa.gov/mgg/global/relief/ETOPO1/data/ice_surface/grid_registered/netcdf/. 2009. ETOPO1 1 Arc-Minute Global Relief Model.
Oksanen J., Simpson G., Blanchet F., Kindt R., Legendre P., Minchin P., et al. (2023). vegan: Community Ecology Package. R package version 2.6-5. Available online at: https://github.com/vegandevs/vegan.
Onarheim I. H., Årthun M. (2017). Toward an ice-free barents sea. Geophys. Res. Lett. 44, 8387–8395. doi: 10.1002/2017GL074304
Paradis V., Sirois P., Castonguay M., Plourde S. (2012). Spatial variability in zooplankton and feeding of larval Atlantic mackerel (Scomber scombrus) in the southern Gulf of St. Lawrence. J. Plankton Res. 34, 1064–1077. doi: 10.1093/plankt/fbs063
Pedersen T., Mikkelsen N., Lindstrøm U., Renaud P. E., Nascimento M. C., Blanchet M. A., et al. (2021). Overexploitation, recovery, and warming of the Barents Sea ecosystem during 1950–2013. Front. Mar. Sci. 8, 732637. doi: 10.3389/fmars.2021.732637
Peters R. H., Downing J. A. (1984). Empirical analysis of zooplankton filtering and feeding rates 1. Limn. Oceanogr. 29, 763–784. doi: 10.4319/lo.1984.29.4.0763
Pörtner H.-O., Roberts D. C., Masson-Delmotte V., Zhai P., Tignor M., Poloczanska E., et al. (2019). “Summary for policymakers,” in IPCC special report on the ocean and cryosphere in a changing climate, vol. 7. .
Postel L., Fock H., Hagen W. (2000). Biomass and abundance. ICES zooplankton methodology manual Vol. 83 (London: Acadenıic Press), 192.
Randelhoff A., Holding J., Janout M., Sejr M. K., Babin M., Tremblay J.-É., et al. (2020). Pan-Arctic Ocean primary production constrained by turbulent nitrate fluxes. Front. Mar. Sci. 7. doi: 10.3389/fmars.2020.00150
Rat’kova T. N., Wassmann P. (2002). Seasonal variation and spatial distribution of phyto-and protozooplankton in the central Barents Sea. J. Mar. Syst. 38, 47–75. doi: 10.1016/S0924-7963(02)00169-0
Reigstad M. (2022). CTD data from Nansen Legacy Cruise - Seasonal cruise Q3. doi: 10.21335/NMDC-1107597377
Renaud P. E., Daase M., Banas N. S., Gabrielsen T. M., Søreide J. E., Varpe Ø., et al. (2018). Pelagic food-webs in a changing Arctic: a trait-based perspective suggests a mode of resilience. ICES J. Mar. Sci. 75, 1871–1881. doi: 10.1093/icesjms/fsy063
Riser C. W., Wassmann P., Reigstad M., Seuthe L. (2008). Vertical flux regulation by zooplankton in the northern Barents Sea during Arctic spring. Deep Sea Res. Part II 55, 2320–2329. doi: 10.1016/j.dsr2.2008.05.006
Roura Á., Strugnell J. M., Guerra Á., González Á.F., Richardson A. J. (2018). Small copepods could channel missing carbon through metazoan predation. Ecol. Evo. 8, 10868–10878. doi: 10.1002/ece3.4546
Runge J. A., Roff J. C. (2000). The measurement of growth and reproductive rates. In: ICES zooplankton methodology manual Elsevier, 401–454.
Sabatini M., Kiørboe T. (1994). Egg production, growth and development of the cyclopoid copepod Oithona similis. J. Plankton Res. 16, 1329–1351. doi: 10.1093/plankt/16.10.1329
Sakshaug E., Slagstad D., Holm-Hansen O. (1991). Factors controlling the development of phytoplankton blooms in the Antarctic Ocean—a mathematical model. Mar. Chem. 35, 259–271. doi: 10.1016/S0304-4203(09)90021-4
Simon M., Cho B. C., Azam F. (1992). Significance of bacterial biomass in lakes and the ocean: comparison to phytoplankton biomass and biogeochemical implications. Mar. Ecol. Prog. Ser. 86 (2), 103–110. doi: 10.3354/meps086103
Slagstad D., Ellingsen I. H., Wassmann P. (2011). Evaluating primary and secondary production in an Arctic Ocean void of summer sea ice: an experimental simulation approach. Prog. Oceanogr. 90, 117–131. doi: 10.1016/j.pocean.2011.02.009
Slagstad D., Wassmann P. F. J., Ellingsen I. (2015). Physical constrains and productivity in the future Arctic Ocean. Front. Mar. Sci. 2. doi: 10.3389/fmars.2015.00085
Smith D. C., Azam F. (1992). A simple, economical method for measuring bacterial protein synthesis rates in seawater using 3H-leucine. Mar. Microb. Food webs 6, 107–114.
Søreide J. E., Leu E. V. A., Berge J., Graeve M., Falk-Petersen S. (2010). Timing of blooms, algal food quality and Calanus glacialis reproduction and growth in a changing Arctic. Global Change Biol. 16, 3154–3163. doi: 10.1111/j.1365-2486.2010.02175.x
Spreen G., Kaleschke L., Heygster G. (2008). Sea ice remote sensing using AMSR-E 89 GHz channels. J. Geophys. Res. 113, C02S03. doi: 10.1029/2005JC003384
Stabeno P. J., Kachel N. B., Moore S. E., Napp J. M., Sigler M., Yamaguchi A., et al. (2012). Comparison of warm and cold years on the southeastern Bering Sea shelf and some implications for the ecosystem. Deep Sea Res. Part II 65, 31–45. doi: 10.1016/j.dsr2.2012.02.020
Steer A., Divine D. (2023). Sea ice concentrations in the northern Barents Sea and the area north of Svalbard at Nansen Legacy stations during 2017-2021 (Norwegian Polar Institute). doi: 10.21334/npolar.2023.24f2939c
Stige L. C., Eriksen E., Dalpadado P., Ono K. (2019). Direct and indirect effects of sea ice cover on major zooplankton groups and planktivorous fishes in the Barents Sea. ICES J. Mar. Sci. 76, i24–i36. doi: 10.1093/icesjms/fsz063
Sundfjord A., Assmann K. M., Lundesgaard Ø., Renner A. H. H., Lind S., Ingvaldsen R. B. (2020). Suggested water mass definitions for the central and northern Barents Sea, and the adjacent Nansen Basin. NLRS. doi: 10.7557/nlrs.2020.8
Svensen C., Halvorsen E., Vernet M., Franzè G., Dmoch K., Lavrentyev P. J., et al. (2019). Zooplankton communities associated with new and regenerated primary production in the Atlantic inflow north of Svalbard. Front. Mar. Sci. 6. doi: 10.3389/fmars.2019.00293
Svensen C., Kiørboe T. (2000). Remote prey detection in Oithona similis: hydromechanical versus chemical cues. J. Plankton Res. 22, 1155–1166. doi: 10.1093/plankt/22.6.1155
Swalethorp R., Kjellerup S., Malanski E., Munk P., Nielsen T. G. (2014). Feeding opportunities of larval and juvenile cod (Gadus morhua) in a Greenlandic fjord: temporal and spatial linkages between cod and their preferred prey. Mar. Biol. 161, 2831–2846. doi: 10.1007/s00227-014-2549-9
Tarling G. A., Freer J. J., Banas N. S., Belcher A., Blackwell M., Castellani C., et al. (2022). Can a key boreal Calanus copepod species now complete its life-cycle in the Arctic? Evidence and implications for Arctic food-webs. Ambio 51, 333–344. doi: 10.1007/s13280-021-01667-y
Trudnowska E., Gluchowska M., Beszczynska-Möller A., Blachowiak-Samolyk K., Kwasniewski S. (2016). Plankton patchiness in the Polar Front region of the West Spitsbergen Shelf. Mar. Ecol. Prog. Ser. 560, 1–18. doi: 10.3354/meps11925
Turner J. T. (2004). The importance of small planktonic copepods and their roles in pelagic marine food webs. Zool. Stud. 43, 255–266.
Unstad K. H., Tande K. S. (1991). Depth distribution of Calanus finmarchicus and C. glacialis in relation to environmental conditions in the Barents Sea. Polar Res. 10, 409–420. doi: 10.1111/j.1751-8369.1991.tb00662.x
Utermöhl H. (1958). Zur vervollkommnung der quantitativen phytoplankton-methodik: Mit 1 Tabelle und 15 abbildungen im Text und auf 1 Tafel. Internationale Vereinigung für theoretische und angewandte Limnologie: Mitt. 9, 1–38. doi: 10.1080/05384680.1958.11904091
Vader A. (2022a). Chlorophyll A and phaeopigments Nansen Legacy cruise 2019706. doi: 10.21335/NMDC-1109067467
Vader A. (2022b). Chlorophyll A and phaeopigments Nansen Legacy cruise 2021708. doi: 10.21335/NMDC-1248407516
Van Engeland T., Bagøien E., Wold A., Cannaby H. A., Majaneva S., Vader A., et al. (2023). Diversity and seasonal development of large zooplankton along physical gradients in the Arctic Barents Sea. Progr. Oceanogr 216, 103065. doi: 10.1016/j.pocean.2023.103065
Vihtakari M. (2022). ggOceanMaps: Plot data on oceanographic maps using “ggplot2”. R package version 1. doi: 10.5281/zenodo.4554714
Wassmann P., Reigstad M. (2011). Future Arctic Ocean seasonal ice zones and implications for pelagic-benthic coupling. Oceanogr. 24, 220–231. doi: 10.5670/oceanog
Wold A., Hop H., Svensen C., Søreide J. E., Assmann K. M., Ormanczyk M., et al. (2023). Atlantification influences zooplankton communities seasonally in the northern Barents Sea and Arctic Ocean. Prog. Oceanogr 219, 103133. doi: 10.1016/j.pocean.2023.103133
Keywords: sea-ice cover, copepod community composition, secondary production, northern Barents Sea, interannual variability, sea-ice melt
Citation: Gawinski C, Daase M, Primicerio R, Amargant-Arumí M, Müller O, Wold A, Ormańczyk MR, Kwasniewski S and Svensen C (2024) Response of the copepod community to interannual differences in sea-ice cover and water masses in the northern Barents Sea. Front. Mar. Sci. 11:1308542. doi: 10.3389/fmars.2024.1308542
Received: 06 October 2023; Accepted: 28 February 2024;
Published: 27 March 2024.
Edited by:
Antonia Granata, University of Messina, ItalyReviewed by:
Hauke Flores, Alfred Wegener Institute Helmholtz Centre for Polar and Marine Research (AWI), GermanyDavid Kimmel, National Oceanic and Atmospheric Administration, United States
Copyright © 2024 Gawinski, Daase, Primicerio, Amargant-Arumí, Müller, Wold, Ormańczyk, Kwasniewski and Svensen. This is an open-access article distributed under the terms of the Creative Commons Attribution License (CC BY). The use, distribution or reproduction in other forums is permitted, provided the original author(s) and the copyright owner(s) are credited and that the original publication in this journal is cited, in accordance with accepted academic practice. No use, distribution or reproduction is permitted which does not comply with these terms.
*Correspondence: Christine Gawinski, Q2hyaXN0aW5lLmdhd2luc2tpQHVpdC5ubw==