 Gwénaëlle Chaillou
 Gwendoline Tommi-Morin
 Alfonso Mucci
- 1Québec-Océan, Institut des Sciences de la Mer de Rimouski (ISMER), Université du Québec à Rimouski, Rimouski, QC, Canada
- 2GEOTOP, Earth & Planetary Sciences, McGill University, Montreal, QC, Canada
- 3Department of Earth and Planetary Sciences, McGill University, Montreal, QC, Canada
In this study, we focus on the biogeochemical processes that produce both dissolved inorganic carbon (DIC) and total alkalinity (TA) along a subarctic subterranean estuary (STE) located in the Gulf of St. Lawrence (Magdalen Island, Qc, Canada) in order to evaluate the DIC and TA fluxes as well as the buffering capacity of the exported groundwater to coastal waters. DIC and TA do not behave conservatively during mixing along the groundwater flow path and this implies the occurrence of internal redox reactions that control both their production and consumption. In addition, we show that the origin and composition of the organic carbon within the system alter the carbonate parameters by generating low pH conditions (5.9 - 7.2) and contributing to non-carbonate alkalinity (NCA) that accounts for more than 30% of TA. Whereas iron cycling plays a key role in the production of DIC in the fresh and low-salinity groundwaters, the precipitation of sulfide minerals neutralize the acidity produced by the metabolically produced CO2, in the saline groundwater where sulfate is available. The STE pCO2, computed from the DIC-pHNBS pair ranged from a few ppm to 16000 ppm that results in a CO2 evasion rate of up to 310 mol m−2 d−1 to the atmosphere. Based on Darcy flow and the mean concentrations of DIC and carbonate alkalinity (Ac = TA - NCA) in the discharge zone, fluxes derived from submarine groundwater discharge were estimated at 1.43 and 0.70 mol m−2 d−1 for DIC and Ac, respectively. Despite a major part of the metabolic CO2 being lost along the groundwater flow path, the SGD-derived DIC flux was still greater than the Ac flux, implying that groundwater discharge reduces the buffering capacity of the receiving coastal waters. This site-specific scale study demonstrates the importance of diagenetic reactions and organic matter remineralization processes on carbonate system parameters in STE. Our results highlight that subarctic STEs could be hot spots of CO2 evasion and a source of acidification to coastal waters that should be considered in carbon budgets.
Introduction
At the land-sea interface, subterranean estuaries (STEs) of unconfined coastal aquifers are important biogeochemical reactors where solutes, of both marine and terrestrial origin, are rapidly transformed and released to adjacent coastal embayments. Over the last decades, numerous field investigations have highlighted that STEs are a major source of nutrients and carbon to coastal waters (Moore, 1999; Anschutz et al., 2009; Moore, 2010; Robinson et al., 2018) and possibly an overlooked driver of both coastal eutrophication and acidification (Santos et al., 2011; Maher et al., 2013; Kwon et al., 2017; Liu et al., 2017). Carbonate dissolution/precipitation (Cyronak et al., 2012) and organic matter remineralization (Dorsett et al., 2011; Chaillou et al., 2014; Liu et al., 2014; Pain et al., 2019) along the groundwater flow path control the subsurface dissolved organic carbon (DIC) production/consumption in groundwater.
How submarine groundwater discharge (SGD)-derived fluxes influence receiving seawater buffering capacity is, however, still poorly understood. Reports of both groundwater DIC and total alkalinity (TA) are sparse in the literature and, when available, are mainly from tropical and temperate coastal regions (see the compilation in Sadat-Noori et al. (2015) and Robinson et al. (2018)). In coral lagoons, mangrove and wetland systems, SGD have been reported to be a source of acidity (Santos et al., 2011; Wang et al., 2014; Wang et al., 2015). At these sites, high DIC concentrations coupled to low TA in coastal groundwater induced a pH drop in receiving seawaters. For example, in Waquoit Bay (USA), Liu et al. (2017) reported that, irrespective of the season, DIC production always exceeded TA production in the STE, mostly in response to subsurface biogeochemical and organic matter remineralization processes. Whereas the DIC production was associated to aerobic oxidation and denitrification, the re-oxidation of metabolites, such as reduced iron, serves as a TA sink. The export of groundwater with a TA to DIC ratio lower than 1 reduces the CO2 buffering capacity of receiving seawaters, and a source of acidity. In contrast, at Hwasun Bay, an oligotrophic body of water on the volcanic Jeju Island, the protonation (adsorption of protons) of sandy sediment along the groundwater flow path led to a pH increase in low-salinity groundwater associated to an atmospheric CO2 uptake. This leads to discharge of alkalified groundwater to the marine water of the Bay (e.g. TA/DIC>1; Lee and Kim (2015)). More recently, Charbonnier et al. (2022) reported strong aerobic remineralisation along the groundwater pathway of the high-energy, intertidal sandy sediment at Truc-Vert, SW France. Because of the active CO2 degassing along the beach, the TA/DIC evolves above 1 and discharge increased the buffering capacity of the coastal seawater (Charbonnier et al., 2022). These contrasting results highlight the complexity of the behaviour of carbonate system parameters in STE and the necessity of site-specific scale studies to characterize and quantify SGD-derived fluxes of DIC and alkalinity.
Such a quantification is especially crucial for STEs in the North because subarctic and Arctic regions are experiencing – and are expected to continue to experience – important hydroclimatic changes and modification of terrestrial carbon storage (Hinzman et al., 2005; Roulet et al., 2007). In addition, some of these regions, like the Atlantic coast of North America, are more prone to the risk of future relative sea-level rise (Slangen et al., 2014). The Magdalen Islands, in the southern sector of the Gulf of St. Lawrence, eastern Canada (Figure 1A), experience higher than global average rates of relative sea-level rise. This led to the submersion and burial of forest soil horizons in the intertidal zones (Barnett et al., 2017). These buried organic-rich horizons can greatly alter the STE dissolved organic matter (DOM) budget and SGD-derived organic carbon fluxes (Beck et al., 2007; Seidel et al., 2014; Couturier et al., 2016; Linkhorst et al., 2017; Sirois et al., 2018). Leaching of organic-rich horizons affects the microbial respiration rates and, thus, the production or consumption of both DIC and TA. In addition, the release of organic acids from terrestrial organic matter can modify the acid-base properties of seawater by either increasing (Cai et al., 1998; Hunt et al., 2011) or decreasing (Delaigue et al., 2020) TA depending of the strength of acidic functional groups. This non-carbonate alkalinity (NCA), if not taken into consideration, will generate errors in carbonate parameter calculations when TA is used as an input in speciation calculations.
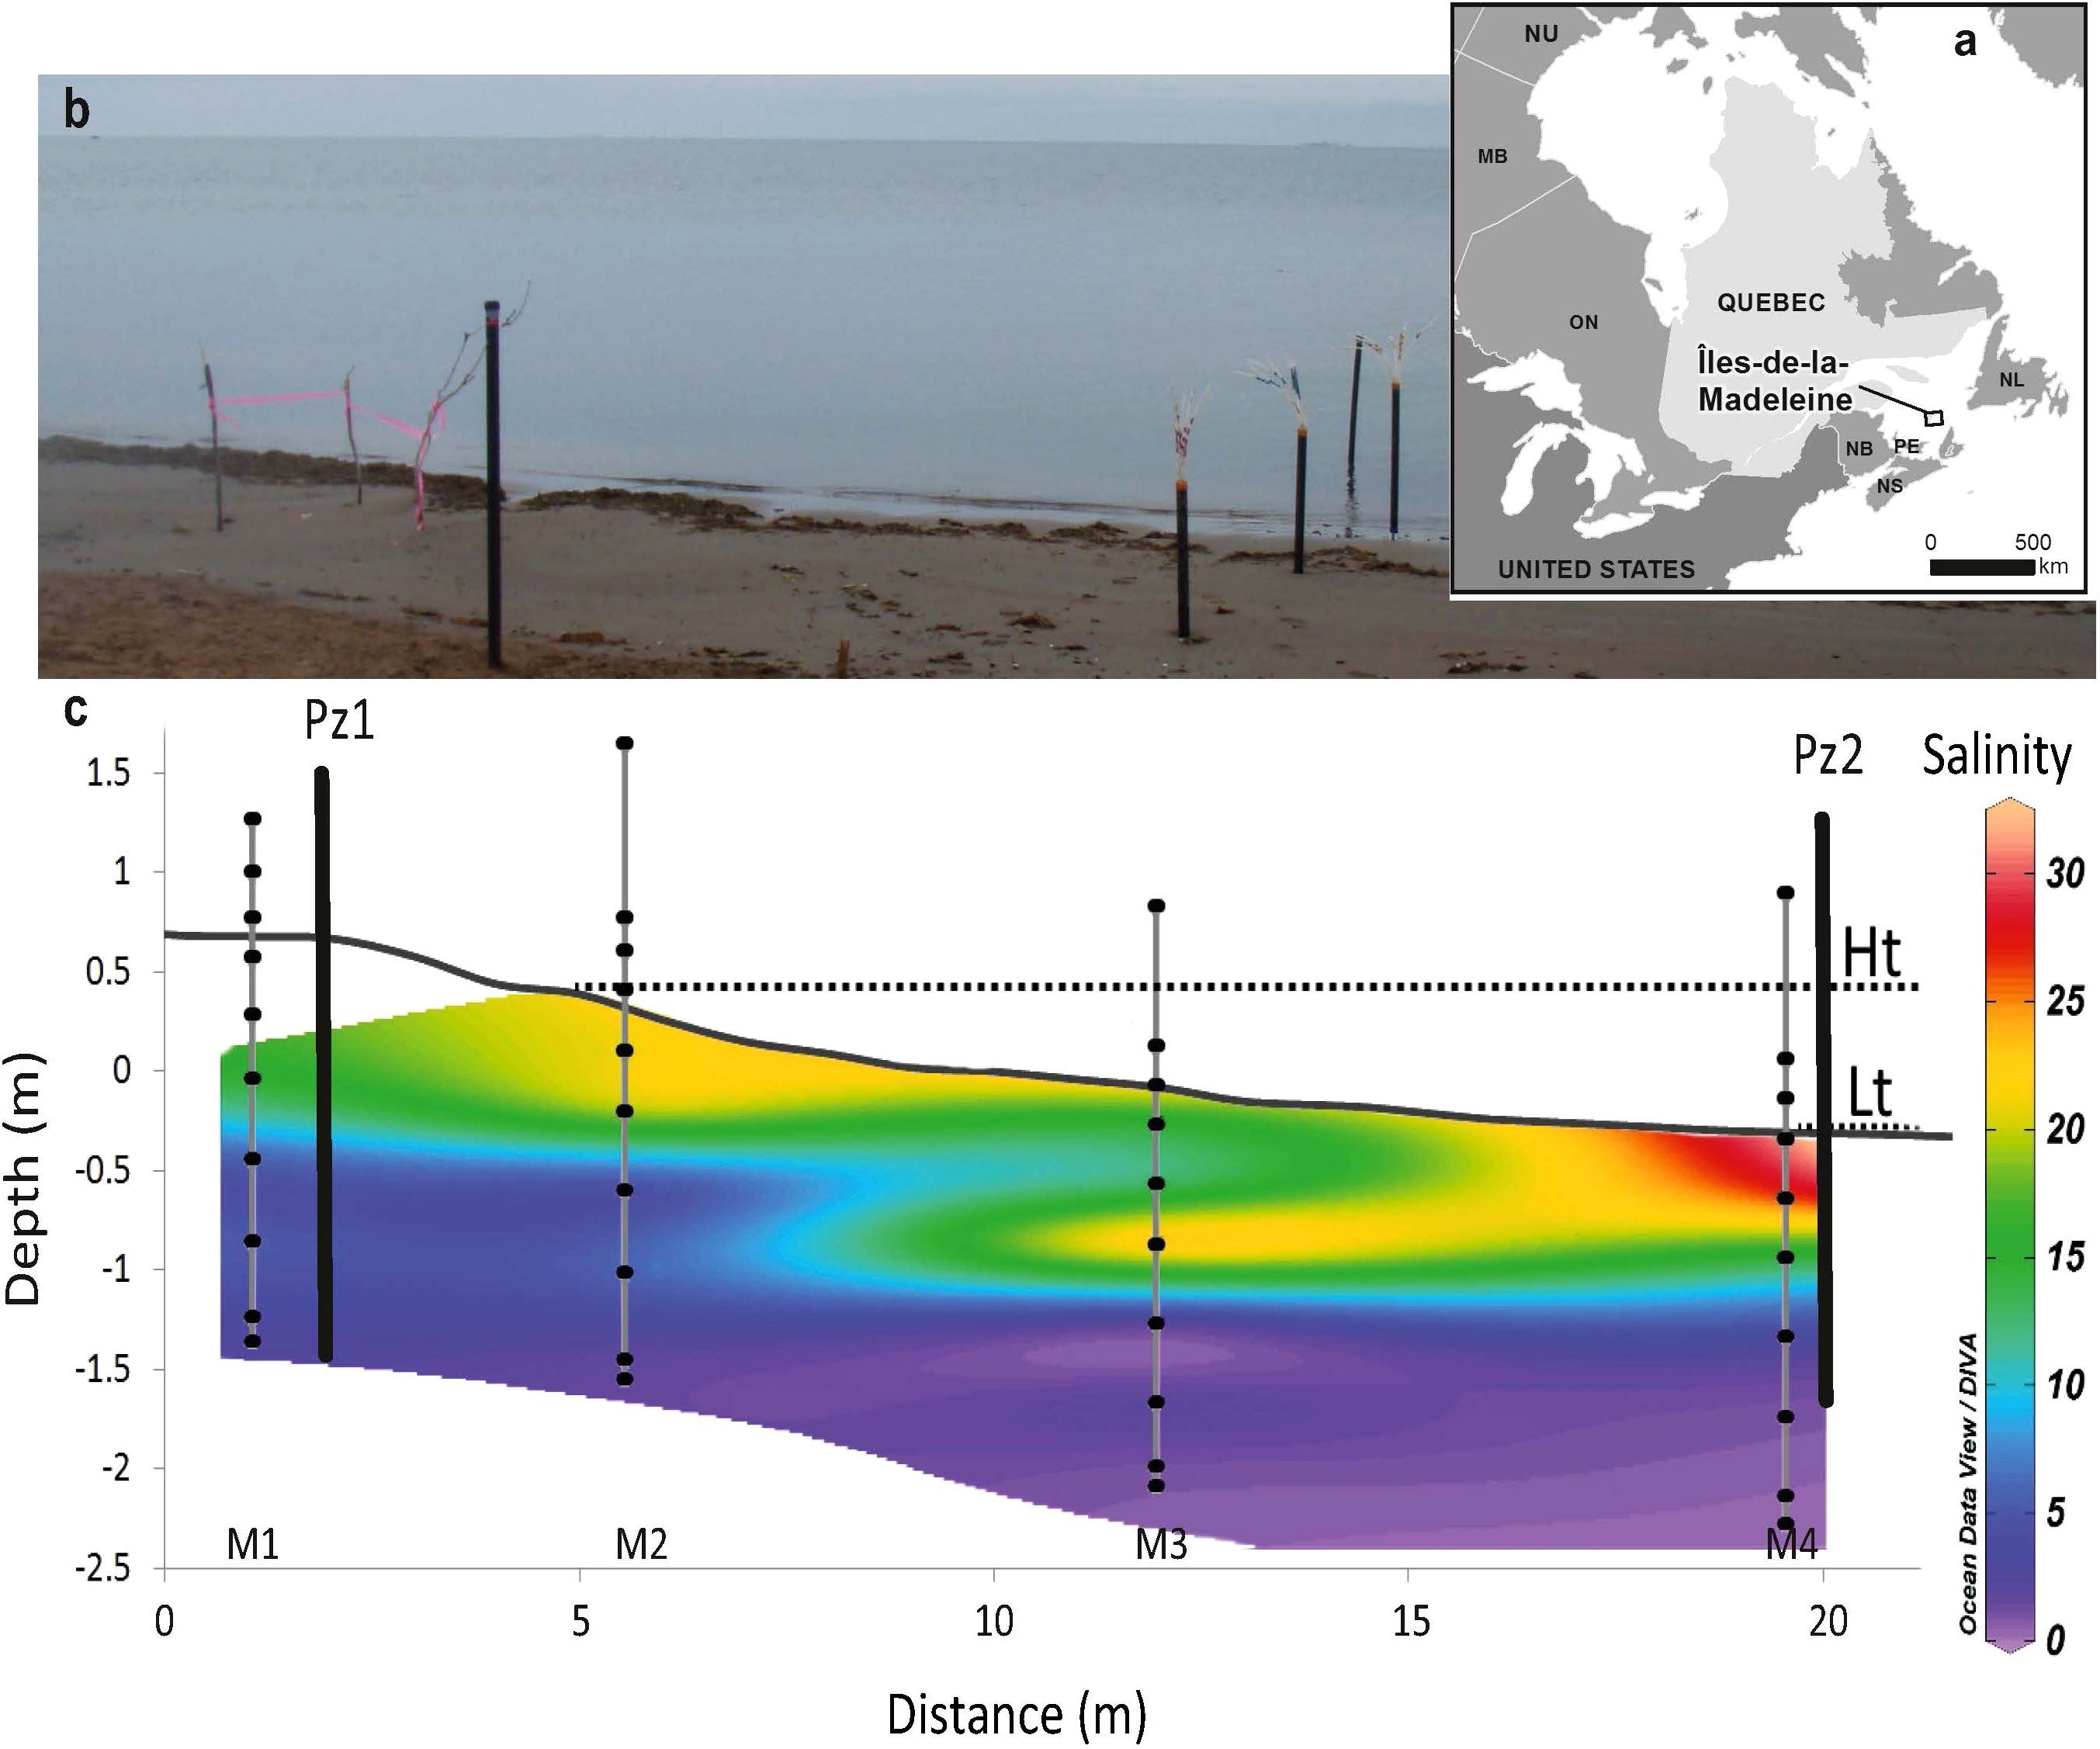
Figure 1 (A) Location of the Magdalen Archipelago in the southeastern part of the Gulf of St. Lawrence; (B) View of the Martinique Beach and the studied cross-shore transect in the intertidal zone of the beach; and (C) the cross-sections of transect showing the topography and distribution of practical salinity. Contour line was determined by linear interpolation in Ocean Data view software. Black dots refer to groundwater sampling points and vertical black lines, labelled Pz1 and Pz2, represent the position of piezometers. Depth was reported relative to the mean sea level (0 cm) and was determined from DGPS measurements. The position of high tide and low tide marks (Ht and Lt) are also reported.
In this study, we carry out an in-depth analysis of carbonate system parameters in the subarctic STE of the Magdalen Islands. The STE intercepts an old buried forest soil along its flow path. Groundwater was sampled along the STE and carbonate system parameters (pH, TA and DIC) were measured and speciation calculations carried out. We first assess the impact of NCA on TA and then explore the sources and the distribution of DIC, carbonate and non-carbonate alkalinity as well as redox-sensitive species along the groundwater flow path. Relevant diagenetic reactions and their stoichiometric relationships are considered to guide a quantitative interpretation of the field measurements. Finally, we estimate the release rate of CO2 to the atmosphere and, based on Darcy’s law, we calculate SGD-derived fluxes of DIC and carbonate alkalinity to nearshore waters. Results of this study allow for the elaboration of a quantitative STE carbon budget and assess whether subarctic STEs are sources or sinks of inorganic carbon to nearshore waters.
Methods
Hydrostratigraphical context of the studied STE
The Martinique Beach is located on the main island of the Magdalen Archipelago in the Gulf of St. Lawrence (Quebec, Canada; Figure 1A). This archipelago is located in the Maritimes Permo-carboniferous Shelf Basin (Brisebois, 1981) where the main aquifer is mainly composed of sandstones from the Lower Permian period (the Cap-aux-Meules Formation). At the seaward boundary of this aquifer, the Martinique Beach originates from a recent transgression sequence. The archipelago currently experiences rates of relative sea-level rise that are higher than the global average, ranging between 1.3 and 2.0 mm per year for the past 2000 years (Barnett et al., 2017). This rapid rise buried the unconfined Permian sandstone aquifer, that is now covered by intertidal sandy sediment. The exposed beach consists of a ~ 50 cm thick layer of eolian sand with an average grain size of ~ 300 µm that is mainly composed of quartz (95%), minor silt (<5%) with no trace of carbonate minerals (Chaillou et al., 2014). The underlying Permian sandstone aquifer consists of fine red-orange sands (~ 100 µm) composed of iron-oxide coated silicates and aluminosilicates (Chaillou et al., 2014). Carbonate minerals are also absent in this layer. At the top of the sandstone aquifer, there is a fragmented organic-rich layer, mainly composed of terrestrial plant detritus formed between a calibrated age of 854 (+/-61) and 713 (+/-32) cal a BP, as revealed by 14C dating of lignose fragments and conifer needles (Barnett et al., 2017). The thickness and the extent of this organic-rich horizon is unknown. At the top of the beach, it is 30 to 40 cm thick, but in the intertidal zone, the horizon thins to a 5 to 10 cm of highly degraded and undifferentiated black organic layer. Several studies have focused on estimating groundwater flows through the beach and at the discharge zone (Chaillou et al., 2016; Chaillou et al., 2018). The shallow STE releases both fresh groundwater and recirculated seawater to the coastal water. Based on a radon mass balance model applied to the nearshore waters and on a time series of piezometric levels, the authors estimated that the total water flux at the shoreline was about 0.040 m3 s−1 in June 2013. More than 50% of this water flux was comprised of fresh groundwater originating from the thawing snow pack.
Water table levels and hydrogeological properties
Two piezometers equipped with pressure sensors were installed along a 22 m transect perpendicular to the beach front (Figure 1C). The first piezometer was located a few meters above the high tide mark (Pz1) and the second one was located further offshore, at the mean low tide mark (Pz2). The piezometers were made from 38 mm ID PVC pipes sealed at the base and equipped with 0.4 m long screens at the bottom end. The piezometers extended around 2 m below the beach surface so that the bottom end was always below the water table. Automated level loggers (Hobo U20 001) recorded groundwater levels every 10 minutes during 14 consecutive days, from June 3rd to June 17th 2015, which includes the water sampling period. Time series were corrected for barometric pressure from a barologger located at the study site. In addition, Guelph permeameter measurements (N=15), conducted by Chaillou et al. (2018), provided an estimate of the hydraulic conductivity of 11.4 m d−1 in the unsaturated surficial sands.
Sample collection
Water samples were collected during two consecutive neap tides between June 3rd and 4th 2015, when the water table was high and the aquifer was recharged by the thawing snow pack. Multi-level groundwater samplers were inserted along a 22 m transect perpendicular to the shoreline (Figures 1B, C). The multi-level samplers were designed to collect water at different depths from a few centimeters to almost 2 m below the beach surface. Groundwater was continuously pumped with a peristaltic pump into an on-line flow cell where temperature, pH (NBS scale, +/- 0.05 pH unit), oxidation-reduction potential (ORP read versus the Ag/AgCl reference electrode, +/- 2 mV) and practical salinity (Sp, +/- 0.5) were monitored using a daily calibrated YSI 600QS multiparametric probe. Briefly, the specific conductivity, ORP, and a 3 NIST(NBS)-traceable buffer calibration were applied every day prior to the YSI deployment. After the probe signals stabilized, groundwater samples were filtered through 0.2 µm Whatman Polycap 75S membranes into polypropylene tubes and acidified with metal-free nitric acid to a pH<2 for total dissolved iron (Fe), manganese (Mn) and calcium (Ca) analyses. The acidified samples were stored at 4°C until analysis. Samples for NH4+ analyses were stored in acid-washed polyethylene tubes that were rapidly frozen for later analysis. Samples for dissolved inorganic carbon (DIC), total alkalinity (TA) and methane (CH4) measurements were collected by filling 60 mL glass bottles with no headspace, to which 0.2 mL of a saturated HgCl2 solution was added, sealed with Teflon stoppers and crimping aluminum caps, and stored in the dark at room temperature. Samples for sulfide analyzes were taken in 50 mL glass vials. Before closing the tubes, 0.5 mL of a 2N zinc acetate solution was added and tubes were then stored at room temperature. The sulfide analyses were carried out over the next week. The inland groundwater and seawater were systematically sampled. Samples from the Permian sandstone aquifer were collected as described above from private and municipal wells located 50 to 2000 m inshore from the multi-level sampler transect. Seawater samples were collected 500 to 1000 m offshore in Martinique Bay. The seawater samples were collected from a small boat using a submersible pump connected to an on-line flow cell, as described above.
Analytical methods
DIC was analyzed using a flow injection analysis (FIA) technique based on the method proposed by Hall and Aller (1992). Briefly, a gas permeable membrane is used to move CO2 from an acidic reagent stream to a basic receiving stream and conductivity detector. The calibration was carried out using a reagent grade sodium bicarbonate (NaHCO3) solution, and the conductivity response was linear for samples having DIC concentrations from 0.2 to 20 mmol kg−1 with a precision of ~0.5%. Total alkalinity (TA) was analyzed potentiometrically using the Gran end point method. The latter analysis was performed on 1 mL samples with a micrometer buret and 0.02N HCl solution, as described by Rao et al. (2014), standardized with the Dickson Batch 122 standard reference material (Dickson et al., 2003). The accuracy was better than 0.2%. Methane concentrations were determined at the EPOC laboratory at Bordeaux University (France) upon creating a 10 mL headspace of N2 in the sampling bottle. The samples were vigorously shaken to equilibrate the gas and water phases. After 10 to 12 hours of equilibration, an aliquot of the gas phase was taken up by a gas tight syringe and injected into a gas chromatograph (Hewlett Packard 5890HP Agilent GC) with flame ionization detection (GC-FID), as described by Abril et al. (2007). The methane concentrations were calculated using the volumes of water and headspace in the vial as well as the solubility coefficient of methane of Yamamoto et al. (1976) as a function of temperature and practical salinity. The accuracy of this method was better than 5%. The sulfide concentrations were determined according to the Cline method using solutions of 1 g kg−1 of diamine and 1.5 g kg−1 of ferric chloride at 1 g kg−1. A working reagent volume of 4 mL was added to each sample. After 20 minutes of reaction, samples were analyzed using a spectrophotometer at 670 nm with a 10 cm optical path. The instrument was calibrated using a sodium sulfide solution prepared with nitrogen-purged distilled water (Na2S·9H20) under an inert atmosphere. The solution was standardized iodometrically. Precision of this method is about 3%. Total dissolved Fe, Mn and Ca concentrations were analyzed in acidified and refrigerated samples with a Microwave Plasma - Atomic Emission Spectrometer (4200 MP-AES from Agilent Technologies) at wavelengths of 371.993, 403.076, and 396.848 nm, respectively. The precision was< 1% for the three elements.
Data processing and calculations
Darcy’s flow at the shoreline
Tidal propagation in the Martinique Beach STE was recently studied by combining Darcy’s law and a cross-correlation analysis (Chaillou et al., 2018). Here, we only focus on the evaluation of Darcy flow at the shoreline. By assuming that the hydraulic gradient component parallel to the coastline is null, groundwater flows in the STE (q; cmd−1) were calculated according to Equation (1):
where K= 11.4 (+/-4.4) cm d−1 is the mean hydraulic conductivity measured by Chaillou et al. (2018). To convert these results to volumetric fluxes, which is the discharge per unit width of the aquifer (Q in m3 s−1), the cross sectional flow area was determined as previously described by Chaillou et al. (2018). Briefly, based on the Ghyben–Herzberg and Glover relationship, the top 3.2 m of the aquifer at the top of the discharge zone (near Pz1) is assumed to be fresh, except for the narrow surficial recirculation cell. The length of the shoreline, determined using global positioning system measurements, is 1200 m. Hence, the cross sectional flow area is 9240 m2. Assuming a uniform hydraulic conductivity (K) and an isotropic shallow aquifer all along the 1200 m of shoreline, Q is computed every 10 minutes (Figure 2) and a mean Q value is calculated.
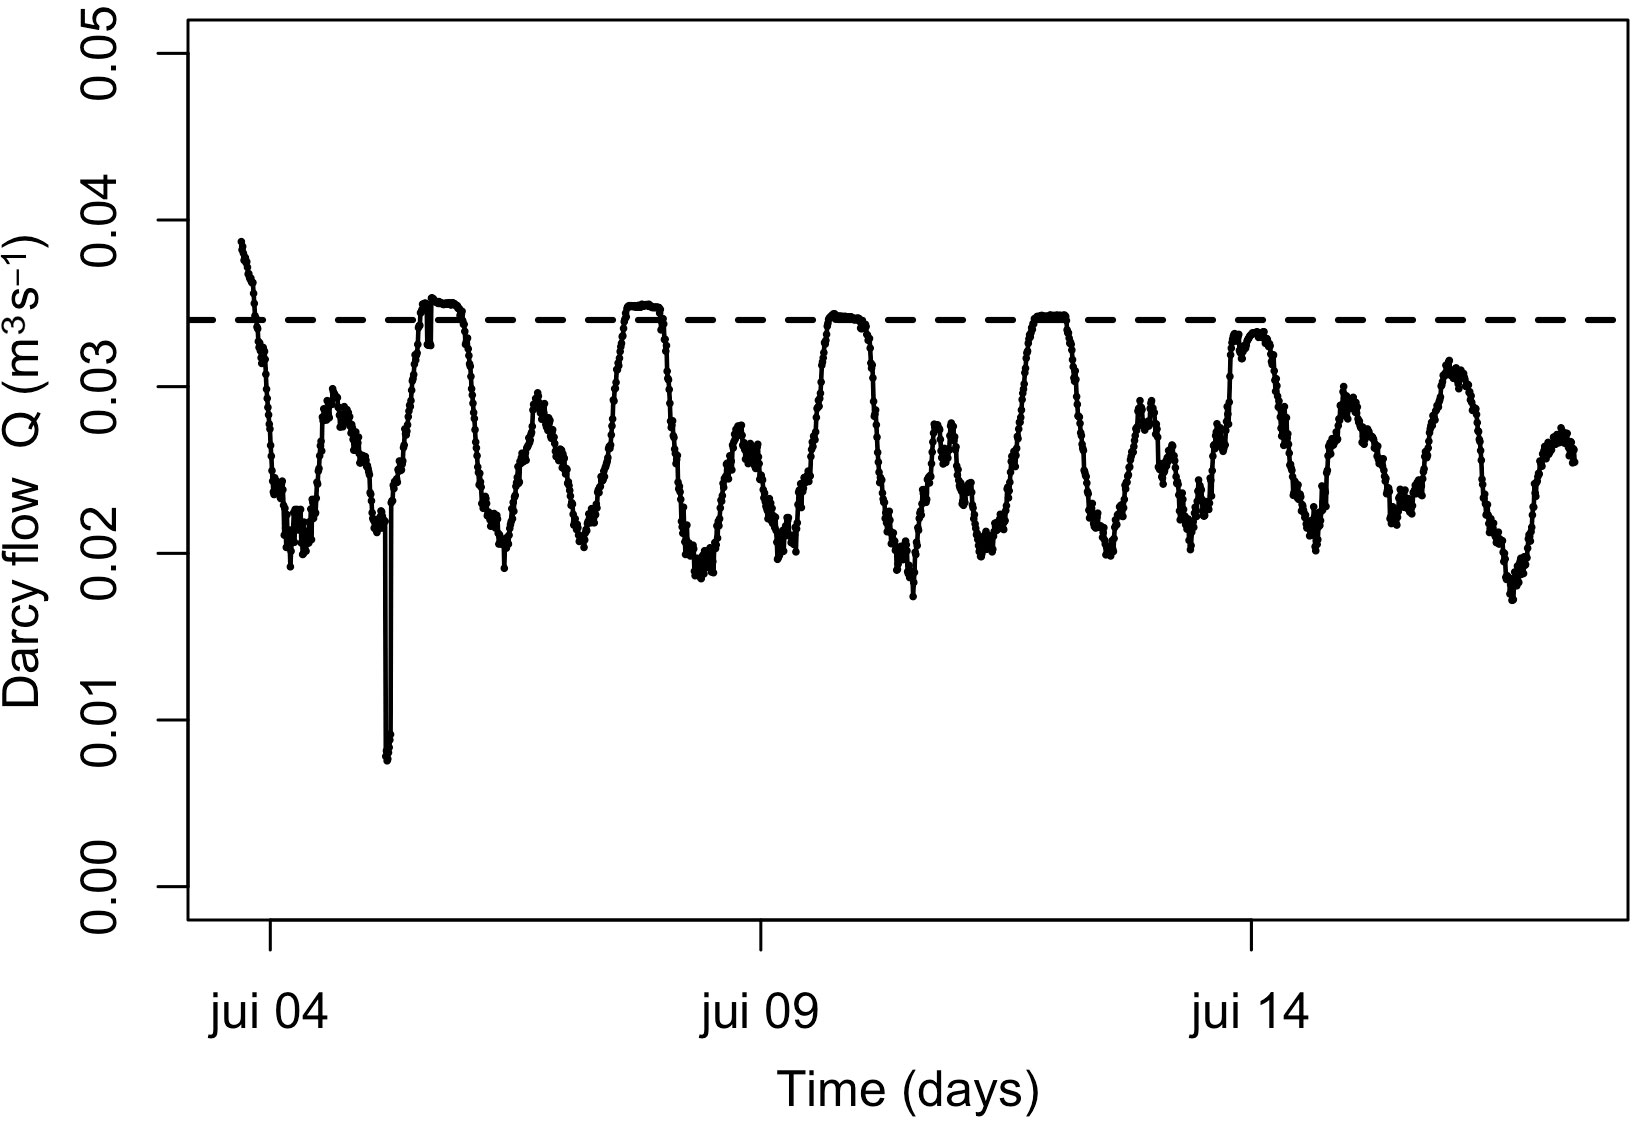
Figure 2 Time series of Darcy flow computed from head gradients between Pz1 and Pz2. The dashed line is the mean maximal Q value calculated over the 14-day study.
Total alkalinity and non-carbonate alkalinity
A mixture of inorganic and organic bases and acids make up the total alkalinity (TA). It is calculated as follows (Equation (2)):
In seawater, TA is dominated by the carbonate alkalinity (Ac = [HCO3-] + 2[CO32-]+ [OH-] - [H+]) and borate. However, in freshwater where dissolved organic matter and fulvic acid concentrations are high, the non-carbonate fraction of TA (also labeled NCA for non-carbonate alkalinity) may be an important component of TA (Abril et al., 2015). In systems where the concentrations of organic matter are expected to be high, the quantification of NCA is necessary to accurately estimate DIC speciation and CO2 degassing fluxes when TA is used as input parameters in speciation calculations. NCA can be estimated as the difference between TA measured by titration and TA calculated using the DIC-pHNBS pair (Hunt et al., 2011) in fresh and low salinity water samples. In brackish and seawater, the contribution of borate to TA was computed from Sp using the measured pH and the theoretical B/Sp relationship of Uppström (1974) in addition to ammonia (Sirois et al., 2018) and H2S concentrations.
Carbonate system calculation
Measured pHNBS, DIC, and TA were input to the R package “AquaEnv: An Aquatic Acid–Base Modelling Environment in R” (Hofmann et al., 2010) for experimental aquatic chemistry, a program focused on acidification and CO2 air-water exchange adapted to marine, estuaries, and freshwater. The dissociation constants of carbonic acid (K1 and K2) used are from Millero et al. (2006) and were calculated for the practical salinity and temperature ranges of our set of data. In 2013, the values of pH measured by the multiparametric probe (NBS scale) were compared to potentiometric pH electrode measurements calibrated using NIST traceable buffer solutions. The mean standard deviation for the samples (N=19) was 0.021, with no deviation for fresh and low salinity samples with Sp<5 and the highest deviation for samples with Sp>21. For the rest of the calculations, pH on the NBS scale was used and transformed to free proton scale pH following the conversion of Roy et al. (1993) by considering a 0.05 error associated with the electrode. The saturation state of waters with respect to calcite and aragonite (Ωcal, and Ωarag, respectively) as well as the NCA values were calculated. The NCA values were then substracted from the TA to obtain the carbonate alkalinity (Ac), whereas, pCO2 was computed from the DIC-pHNBS pair. The average cumulative errors on these parameters were better than 7% on Ac values (ranging from 0.88 to 6.74%, with a mean value of 3.43%) and better than 9% on the pCO2 (ranging from 5.33 to 8.93%, with a mean value of 6.86%).
Calcium anomalies
Assuming that Ca behaves conservatively, we calculated a theoretical Ca concentrations based on the two potential water mass end-members (e.g. inland groundwater and seawater) and the practical salinity. The Ca anomaly is the difference between the theoretical Ca concentrations and the measured Ca concentrations in samples. Therefore, when the Ca anomaly is positive, it is interpreted as evidence of carbonate dissolution whereas when the Ca anomaly is negative, it is an indication of carbonate mineral precipitation.
Results
Groundwater flow at the shoreline
Hydraulic heads were used to compute hydraulic gradients along the STE and to calculate Darcy flow at the discharge zone. The flow was maximal at low tide and supported a mean maximal flow of 0.038 m3 s−1. It fell to minimum values at high tide with a mean flow of ~0.020 m3 s−1, identical to the mean regional groundwater flow (see Chaillou et al. (2016)) (Figure 2). Based on the time series over the study period, we calculated a mean flow of 0.034 m3 s−1. This corresponded to an average shoreline flow of 2.450 m3 m−1 d−1 over the 1200 m length of the beach, a value in the range of those previously reported at the same site (between 1.5 to 3.1 m3 m−1 d−1; see Chaillou et al. (2018)) and to others microtidal STEs, such as Waquoit Bay (Cape Cod, Massachusetts; 4.0–5.6 m3 m−1 d−1; Mulligan and Charette (2006)), western Australia (2.5–8.0 m3 m−1 d−1; Smith and Nield (2003)), Shelter Island (Long Island, New York; 0.4–17.0 m3 m−1 d−1; Burnett et al. (2006)), and Turkey Point (Florida; 0.7–22.0 m3 m−1 d−1; Santos et al. (2009)).
Biogeochemical results
Characteristics of the end members
Inland groundwater and seawater are two potential sources of DIC and TA into the STE. Based on the stable isotopes of water, Chaillou et al. (2018) confirmed the absence of additional domestic wastewater and runoff infiltration as sources of carbon. The Sp of inland groundwater collected in municipal and private wells averaged 0.30 with a temperature around 7°C (Table 1). The pHs were slightly acidic with a mean value of 6.30. DIC concentrations were 0.90 mmol kg−1 and calculated TA was 1.78 mmol kg−1. The Ca concentration was low and close to 0.20 mmol kg−1 and, thus, the saturation states of the water with respect to carbonate minerals were close to 0, implying that, if present, carbonate mineral dissolution should occur in the groundwater. The pCO2 of the groundwater, calculated based on the DIC-pHNBS pair, were higher than 17000 ppm, supersaturated with respect to the atmosphere.
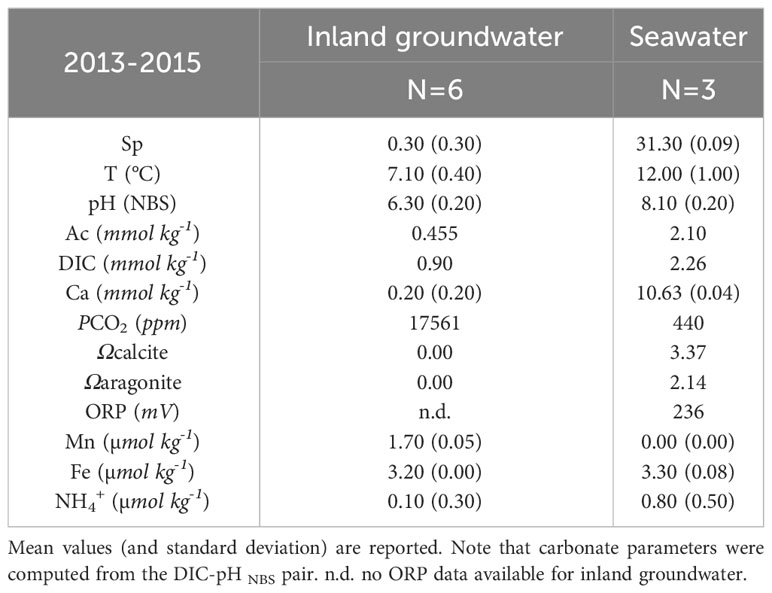
Table 1 Geochemical characteristics of inland groundwater and seawater used as end members in the salinity-based mixing models.
In the seawater samples, the Sp was around 33 and the temperature was approximately 12°C. The mean pH was 8.10 and DIC concentrations were 2.26 mmolkg−1, leading to a calculated TA of 2.10 mmol kg−1. The seawater calcium concentrations were 10.63 mmol kg−1, slightly higher than the expected value at the corresponding salinity (9.69 mmol kg−1). Seawater samples were largely oversaturated with respect to calcite and aragonite, indicating the precipitation of carbonate mineral could occur. The ORP values were all positive, consistent with the fact that the water column is well oxygenated in the Martinique Bay.
Physico chemical features along the STE
Variations of the physicochemical parameters (e.g., Sp, T, pHNBS, and oxygen saturation) along the groundwater flow path were previously reported (Sirois et al., 2018). Briefly, Sp ranged from ˜0 to 31 along the STE. The 2D cross section profile revealed the presence of fresh and low salinity groundwaters with Sp<5 in the deepest samples and in the landward part of the transect (Figure 1C). In contrast, between the high and low tide marks, Sp was higher than 20 in a narrow recirculation seawater cell located in the first 0.3 m below the beach surface. The sharp Sp gradient observed along this recirculation cell is characteristic of a microtidal unconfined beach aquifer dominated by fresh groundwater discharge, where most of the STE is stratified and the tidal induced seawater recirculation is limited to the first decimeters below the beach surface (Robinson et al., 2007; Heiss and Michael, 2014). The pHs ranged from 5.90 to 7.03 (Figure 3A). The lowest values (5.90<pH<6.23), which were lower than the pH measured in the inland fresh groundwater (e.g., pH~6.34, Table 1), were measured in the middle of the intertidal zone, 1.2 m below the surface. The highest values (>7.00) were mainly recorded at the high tide mark. Ca anomalies ranged from 5.2 to 3.9 mmol kg-1, but for most of the samples, they were null (Figure 3B). The most positive Ca anomaly is coincided with the lowest measured pH, approximately 1.2 m below the surface. Negative Ca anomalies were only observed in the first meter below the surface, mainly centered between M2 and M3.
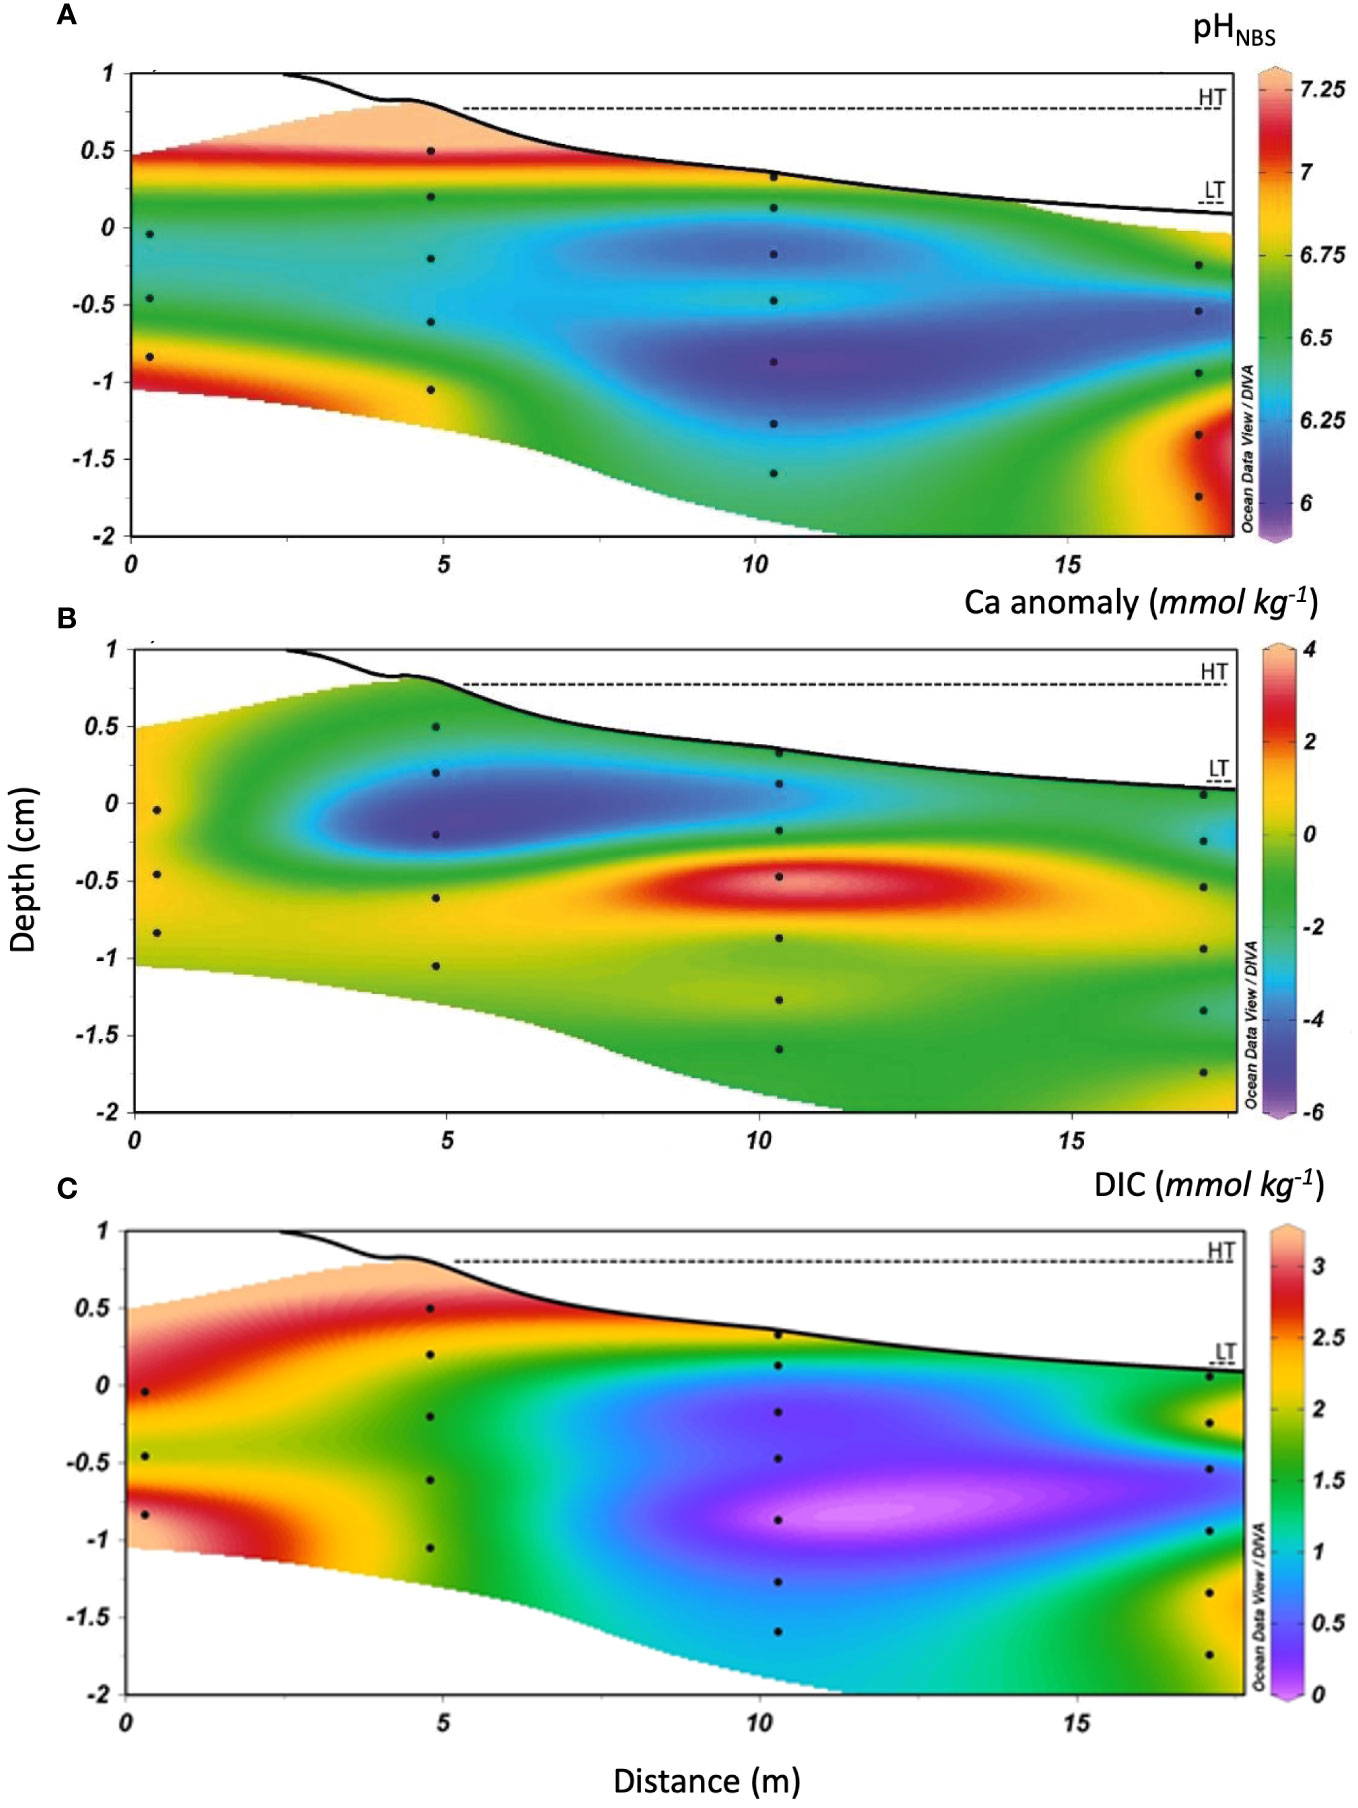
Figure 3 Cross-section of transect M1–M4 showing the topography and distribution of (A) pH, (B) calcium anomaly and (C) DIC concentrations along the STE. The high tide (Ht) and low tide (Lt) marks are identified by dashed lines. Contour lines were determined by linear interpolation on Ocean Data View software that reproduced the empirical data set with a 0.95 confidence level. Depth is reported relative to the mean sea level (0 cm) and was determined from DGPS measurements. Black dots represent the depths at which samples were collected using multilevel samplers.
Redox gradients along the STE
Redox-sensitive species are plotted against Sp in the Figure 4. For the purpose of the discussion, we defined three zones of salinity: low (Sp<5), mid (5<Sp<20) and high (Sp>21) salinity. As in surficial estuaries, the spatial distribution of parameters can be examined within a theoretical conservative mixing framework, where Sp is used as the conservative property and the composition of the two mixing end members (fresh groundwater and seawater) is assumed to be constant. The redox potential (ORP vs. the Ag/AgCl reference electrode) ranged from +19 mV in the recirculation seawater cell (with a Sp = 22, in M3) to -135 mV in the deepest part of the STE, where salinity was low (Sp<5; Figure 4A). The most negative values were measured around the pH minimum. Total dissolved Mn, Fe, and ammonium concentrations increased with Sp and were maximal at salinities between 15 and 20 (Figures 4B–D). The dissolved sulfide concentrations were highest in low-salinity waters (Sp<5, Figure 4E) with values up to 1.5 μmol kg−1 (with one outlier at 3.2 μmol kg−1) at the high tide mark. Concentrations decreased and remained relatively constant (~0.5 μmol kg−1) at salinities up to 5 (Figure 4E). Methane concentrations ranged from a few μmol to 10 μmol kg−1 (Figure 4F). High CH4 concentrations were measured in mid- (5<Sp<20) and high-salinity (Sp>21) waters. The highest concentrations were recorded in the recirculation seawater cell at M3. The concentrations of the redox-sensitive species in the STE exhibited non-conservative mixing along the groundwater flow path.

Figure 4 Distribution of redox-sensitive species along the practical salinity gradient in the STE. (A) redox potential (ORP vs. Ag/AgCl reference electrode), (B) total dissolved Mn, (C) total dissolved Fe, (D) ammonia, (E) sulfide and (F) methane concentrations. Mean concentrations of redox-sensitive species in inland groundwater and seawater (in Table 1) are also reported (red dots) and a conservative mixing line is drawn for each species (red lines) using a salinity-based mixing model.
Carbonate parameters and saturation states with respect to carbonate minerals
Like the redox-sensitive species, both DIC and TA distributions displayed a non-conservative mixing behaviour within the STE. DIC exhibited a wide range of concentrations, from below the limit of detection (<0.2 mmol kg−1) to 3.0 mmol kg−1 (Figures 3C, 5A). The concentrations were high in low- (Sp<5) and high- (Sp>21) salinity groundwaters, reaching the highest concentrations at the top of the recirculation seawater cell (i.e. M2 and M3). The concentrations were lower in the middle of the intertidal zone, near the M3 sampler, with the lowest concentration associated to the lowest pH and the maximum Ca anomaly. The DIC concentrations, however, were 2 to 5 times lower than those previously reported by Chaillou et al. (2016) at the same site where DIC concentrations reached 15 mmol kg−1 in June 2013. Total alkalinity paralleled the DIC distribution. TA values ranged from 0 to 2.8 mmol kg−1 (Figure 5B). The highest TA values were measured in low- and high-salinity groundwaters and the lowest value was recorded at the pH minimum. Fresh groundwater and seawater samples were all undersaturated with respect to calcite and aragonite, with Ω values near 0. In the STE, Ωcal and Ωarag were also well below 1 throughout the flow path (Figure 3A). Saturation state was near 0 at low- (Sp<5, as in inland groundwater) to mid-salinities, implying that dissolution of carbonate minerals, if present, was possible. The Ω values increased in high-salinity groundwaters and reached values near at Sp>30. Conditions favorable to the precipitation of carbonate minerals are only found at or near the beach surface.
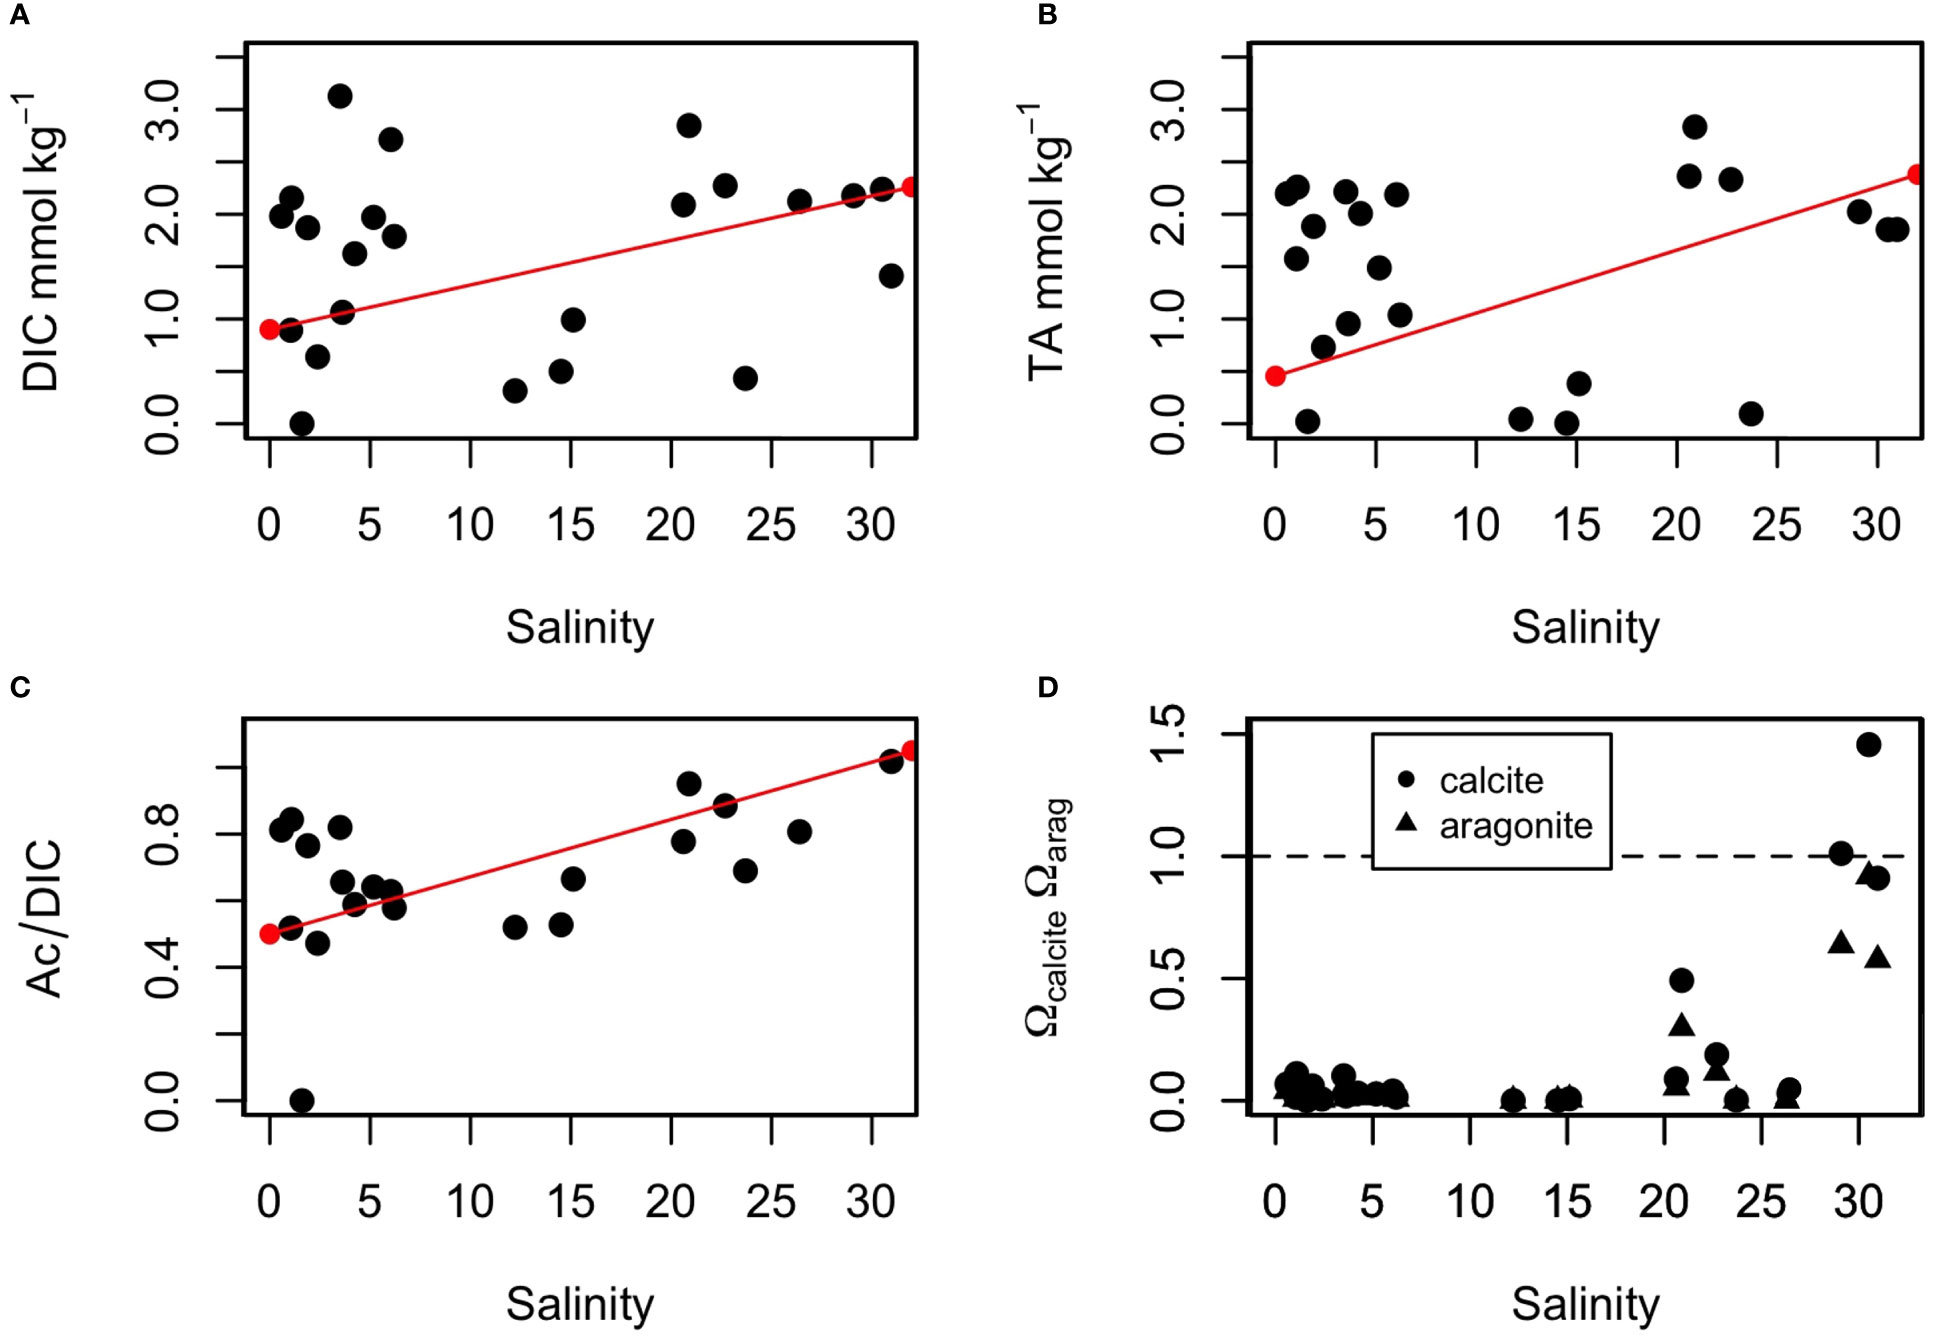
Figure 5 Distribution of carbonate parameters along the practical salinity gradient in the STE. (A) DIC, (B) TA, (C) Ac/DIC, and (D) saturation states with respect to calcite and aragonite. The theoretical mixing lines for DIC, TA, and Ac/DIC between the inland groundwater and seawater samples are in red. In (D), the dashed line represents the equilibrium with respect to calcite and aragonite.
Discussion
The distribution of redox-sensitive species and carbonate parameters in the Martinique Beach STE is not determined by conservative mixing of inland groundwater and seawater, but reveals the occurrence of internal redox reactions that control both the production and consumption of DIC and TA. These reactions modulate the ecological impact of SGD-derived carbon fluxes. Physical forces that drive subsurface flow and transit times control the extent of the reactions and thus the chemical transformations in this transient biogeochemical zone (see Santos et al. (2012) and reference therein). Based on Darcy flow and assuming that the beach aquifer is isotropic, the flow velocity was estimated at between 30 and 40 cm d−1. The transit time, defined as the time required for groundwaters to flow horizontally along the 20m-long transect was therefore 50 to 66 days. This is likely an overestimate of the time spent in the subsurface because it neglects the vertical movement of the water mass under the effect of the piston flow generated by the vertical infiltration of seawater (Martin et al., 2007; Chaillou et al., 2018). Irrespective, the transit time and the high organic carbon content of the STE are conducive to the development of anaerobic conditions and processes, metabolite production and accumulation, as well as the onset of a complex web of redox reactions.
The role of organic matter on the carbonate system
In carbonate mineral rich aquifers, DIC and TA concentrations are generally high and generated by the acidic dissolution of carbonate minerals (Cyronak et al., 2014). In siliciclastic systems, much of the dissolved inorganic carbon is generated by heterotrophic processes (Cai, 2003; Chaillou et al., 2016; Pain et al., 2019; Charbonnier et al., 2022). Irrespective, the origin and the reactivity of the organic matter (marine vs terrestrial) in the STE influence the production of these metabolites. Most studies have highlighted the importance of the marine organic matter input, specifically in the recirculation cell where tides and waves continuously force seawater to infiltrate (Anschutz et al., 2009; Charbonnier et al., 2013; Kim and Kim, 2017; Charbonnier et al., 2022). In systems where relative sea-level has risen rapidly over the last centuries, buried soils also contribute to the reactive pool of organic matter. This leached terrestrial organic matter, typically enriched in high molecular weight and humic-like compounds (Couturier et al., 2016; Hébert et al., 2022), has a very high affinity for Fe-hydroxides (Seidel et al., 2014). The role of the Fe in the STE carbon cycle is still poorly understood but it may modulate the export and the remineralization of the released terrestrial organic matter (Linkhorst et al., 2017; Sirois et al., 2018; Waska et al., 2021). In the Martinique Beach, despite a fraction of the leached DOM being trapped by Fe-hydroxides, the dissolved organic carbon concentrations are high and range from 1 to 10 mmol kg−1 (Sirois et al., 2018). The δ13C signature of this DOC was ~ -25‰, and even more depleted in C-13 above the high tide mark, where it drops to about -30‰, revealing the dominance of terrestrial DOM along the entire system. The terrestrial DOM, and more specifically humic-like compounds, act as both proton acceptors and donors that influence the acid-base properties of coastal waters (Kuliński et al., 2014; Delaigue et al., 2020). In marine environments, the organic fraction of TA (noted [Org-] in the Equation (2)) is generally much smaller than the alkalinity provided by bicarbonate ([HCO3-] + 2[CO32-]+ [OH-] - [H+], Equation (2))), but in DOM-rich systems, such as in the Martinique Beach STE, it can make up a significant fraction of the TA and, thus, when TA is used as an input parameter in speciation calculations, it will yield doubtful values for other carbonate parameters (Kuliński et al., 2014; Abril et al., 2015). Following Hunt et al. (2011), the non-carbonate alkalinity, which includes the [Org-] term in addition to inorganic acid-base species, was calculated by subtracting the carbonate alkalinity (Ac = [HCO3-] + 2[CO32-] + [OH-] - [H+]), derived from the DIC-pHNBS pair, from measured TA. NCA values ranged from -1.07 to +1.11 mmol kg−1 (± 3.4%) with a mean value of -0.26 mmol kg−1. The occurrence of negative NCA (i.e., acidity: Ac > TA) implies that some of the DOM behaves as a proton donor, in agreement with the low pH of the corresponding water sample. Based on the absolute values, we calculated that NCA contributed to approximately 32% of TA. Where TA values were low (TA< 0.1 mmol kg−1), NCA contributed up to 100% of the TA and the pHs were lower than 6.8. At pHs higher than 6.8, the NCA contributions dropped to 20%, as it is commonly observed in river and coastal waters (Kuliński et al., 2014; Abril et al., 2015; Delaigue et al., 2020).
Sinks and sources of DIC and alkalinity along the flow path
Various diagenetic reactions contribute to modifying the DIC and alkalinity in the STE and, therefore, the TA/DIC is used to identify the geochemical processes that occur along the groundwater flow path. Here, we use Ac which mainly refers to the inorganic alkalinity without the [Org-] fraction. For simplicity of discussion, we will use the term Ac while remaining critical of the importance of NCA in some low-salinity groundwater samples, as discussed above. In addition to precipitation and dissolution of carbonate minerals (reactions R1 and R1’ in Table 2), other diagenetic reactions that modify the DIC and Ac include the aerobic respiration of organic matter (R2), denitrification (R3), iron (R4), sulfate reduction (R5) as well as methanogenesis (R6). To discriminate between them, DIC and Ac were expressed as ΔDIC and ΔAc, the differences between their conservative mixing and measured concentrations. Figure 6 shows the relationship between ΔDIC and ΔAc compared to ΔAc/ΔDIC produced by the selected diagenetic reactions listed in Table 2. The overall distribution of ΔDIC and ΔAc exhibits a ratio around 0.7 (R2 = 0.800 with a p value < 0.001), near the slope of the denitrification (R3) and sulfate reduction (R5). Nevertheless, a detailed examination reveals that for low- and mid-salinity (Sp<20) groundwaters, the distribution yields a ratio near 0.7 while for high-salinity (Sp>21) groundwaters the ratio is closer to 0.9. This change in Ac and DIC indicates a change in the dominant reactions that affect the ratio and increase the buffering capacity of groundwater at high salinities.
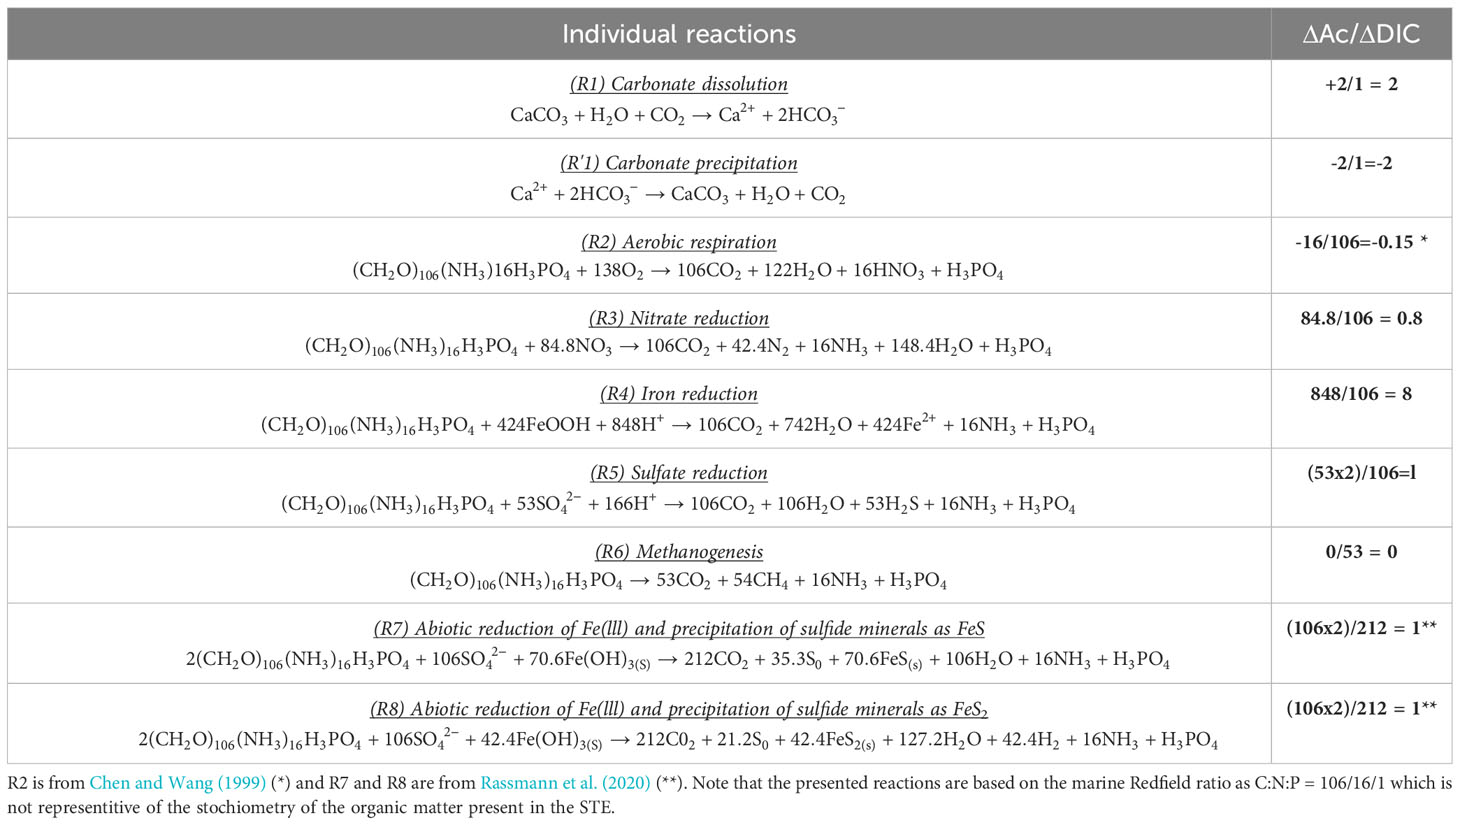
Table 2 Selected diagenetic reactions and their effect on Ac and DIC.
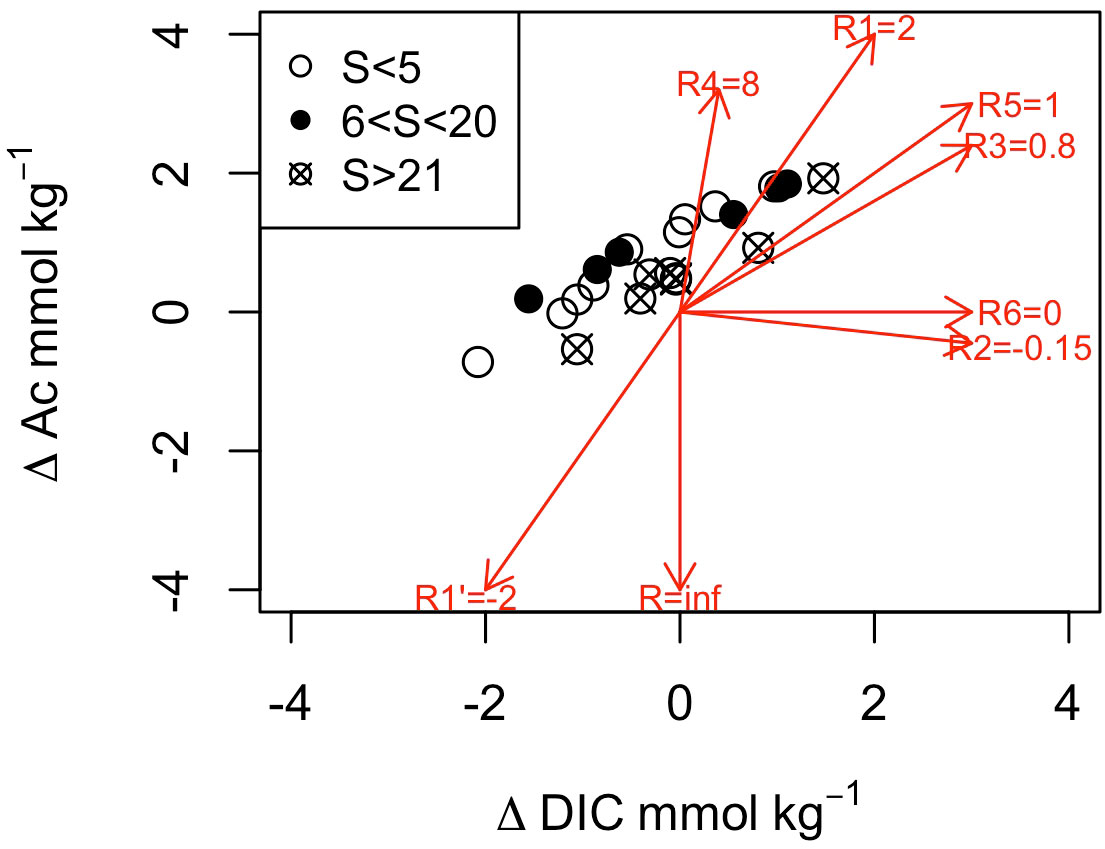
Figure 6 Relationship between DIC and Ac along the Martinique Beach STE. The stoichiometric ratio of TA to DIC is reported for carbonate mineral precipitation and dissolution (R1 = 2 and -2), oxic respiration (R2=-0.16 based on Chen and Wang (1999)), denitrification (R3 = 0.8), iron (R4 = 8) and sulfate (R5 = 1) reduction and methanogenesis (R6 = 0). Note that the oxidation of reduced iron and sulfides by oxygen leads to an infinite ratio.
In sediment containing carbonate minerals, CaCO3 dissolution can neutralize the metabolic CO2 produced during diagenesis. The low saturation states relative to calcite and aragonite in the inland groundwater and low- and mid-salinity groundwaters (Figure 5D) indicate that, if present, carbonate minerals should dissolve. Nevertheless, the low Ca concentration in these samples (<0.8 mmol kg−1) and the nearly null or slightly positive Ca anomaly, however, imply a limited interaction with CaCO3 minerals. Along the groundwater flow path, Ca concentrations increase with salinity and the Ca anomaly clearly becomes positive at high salinities (Sp>21) indicating CaCO3 dissolution likely occurring, consistent with the calculated groundwater undersaturations. If seawater is mixed with the inland groundwater that hosted aerobic and anaerobic respiration as well as CaCO3 dissolution, Ac/DIC should increase to a ratio between 1 and 2 (Table 2, R1; see Cai (2003)). This pathway could not explain the measured ratios comprised between 0 and 1. The low CaCO3 content of the sediment (Chaillou et al., 2014) and the very depleted δ13C signature of the DIC (i.e. around -25‰; Chaillou et al. (2016)), well below the signature for marine carbonates, suggest that the interaction with carbonate minerals is limited whereas organic matter metabolism is dominant along the STE. In the following sections, we will use the stoichiometry of relevant diagenetic reactions to interpret our field data.
At circumneutral pH, denitrification likely occurs and reduces NO3- to N2 with a ΔDIC to ΔAc ratio of 0.8 (Table 2, R3). NO3- concentrations were low within the STE, in contrast to the high concentrations measured in the inland groundwater: there was a strong attenuation from a mean concentration of 65 μmol kg−1 in inland wells, dropping to 2 μmol kg−1 near the discharge zone (Couturier et al. (2017)). Couturier et al. (2017) showed that the groundwater-born NO3- is reduced by the organic matter present in the STE, leading to the production of ~82 μmol kg−1 of DIC, quantities well below those measured. In STE, where fresh groundwater mixes with seawater, sulfate reduction and methanogenesis may also contribute to DIC production (Cai, 2003; Pain et al., 2019) with a ΔDIC to ΔAc ratio of 1 and 0, respectively. Given the sulfide and methane concentrations -a few μmol kg−1- in the STE, the DIC production of these reactions to the STE DIC pool is three order of magnitude lower than the measured DIC concentrations in the STE. In the presence of O2, the oxidation of sulfides to sulfate would favor the consumption of the previously produced Ac, increasing the acidity and lowering the pH. Because the advection of dissolved O2 is limited to the first centimeter below the beach surface (Chaillou et al., 2018), O2 is rapidely consumed at the surface with no impact on Ac. Irrespective, measured concentrations of sulfide concentrations do not reflect the full extent of anaerobic reactions and alternative reactions in the STE, including Fe cycling, reactions that would increase the ΔAc/ΔDIC and the buffering capacity of groundwater.
The iron cycle plays a pivotal role in the chemistry of STEs. Redox oscillations induced by tides, waves, seasonal water table levels, and long-term sea-level changes control the location of the redox front and, therefore, where precipitation of ferrous Fe-hydroxides occurs (Charette and Sholkovitz, 2002). This Fe curtain acts as an oxidative barrier for redox-sensitive species such as nitrogen species, sulfides, and other elements with a strong affinity with Fe-hydroxide surfaces (e.g., phosphate, arsenate) (Charette and Sholkovitz, 2002; Charette et al., 2005; Spiteri et al., 2006). Total dissolved Fe concentrations were high in the studied STE, with a mean of ~0.4 mmol kg−1 and concentrations as high as 1.8 mmol kg−1 at some locations (Figure 4C). The microbial reduction of Fe(III) to Fe(II) (reaction R4, Table 2) leads to the production of 0.10 to 0.45 mmol DIC kg−1 which accounts for 10 to 50% of the DIC produced between the fresh groundwater and the beach groundwater. This reaction also produces much Ac, from 0.8 to 3.6 mmol kg−1 that would explain why Ac is much higher in the low salinities (Sp<5) than in inland groundwater (2.30 vs. 0.45 mmol kg−1, respectively). The produced Ac would then be consumed by the concomitant oxidation of reduced Fe(II) by O2 or NO3, and the acidity generated by these two reactions would be too important to explain the observed ΔAc/ΔDIC. Alternately, the precipitation of sulfide minerals, as FeS and FeS2 (Table 2, reactions R7 and R8), may consume Ac and lower pH as observed in the mid-salinity (5<Sp<20) groundwaters. A variety of biotic and abiotic reactions are also thermodynamicaly favorable under anoxic conditions and in the presence of sulfate. For example, in high salinity (Sp>21) groundwaters, the concomitant dissimilatory Fe and SO42- reduction with precipitation of sulfide minerals (FeS and FeS2) would produce ΔAc/ΔDIC close to 1 (see Rassmann et al. (2020)). The exact mechanism (i.e., biotic or abiotic) cannot be known without a detailed examination of the S speciation. Nevertheless, the range of ΔAc/ΔDIC (from 0.68 to 1.13; Figure 5C), in the high-salinity (Sp>21) groundwaters is fully compatible with sulfate reduction coupled to iron reduction and FeS precipitation, and potentially pyrite precipitation. If the system permanently stores FeS, it would serve as a long-term source of Ac and act as a buffer to metabolically produced CO2 along the groundwater flow path.
The buffering capacity of submarine groundwater discharges: what is the impact on nearshore water chemistry?
The carbonate system parameters varied greatly along the groundwater flowpath in response to organic matter remineralization and redox reactions. The high DIC, Ac, and TA measured in STE groundwater are consistent with results from previous studies in intertidal zones where porewater seepages were considered as the main source of solutes to tidal creeks (Borges et al., 2003; Sadat-Noori et al., 2015). Whereas groundwater exported from the Martinique Beach STE clearly delivered large amounts of carbon to coastal water, the Ac to DIC ratio determines whether the STE serves as a source or sink of atmospheric CO2. In non-conservative systems, such as the studied STE, inorganic carbon speciation for flux calculation is not straightforward, in particular if metabolically produced CO2 escapes to the atmosphere along the groundwater transit. The set of data provided here allows for an in-depth analysis of the behaviour of inorganic carbon, in spring period at least, as well as the possibility to estimate the CO2 emission rate in the discharge zone.
Because of the occurrence of NAC, the pCO2 was computed from the DIC-pHNBS pair. The range of calculated pCO2 is extremely high (Figure 7), reaching 6000 ppm in the subsurface of the discharge zone. The flux across the (ground)water-air interface was estimated between M3 and M4 using a mean surficial pCO2 of 4010 (± 6.8%) ppm (calculated between 0 to 30 cm depth below the beach surface, N= 6 samples). By following the Wanninkhof (1992) relationship, the gas transfer velocity parametrization was computed based on a mean daily wind speed u10 of 4.8 m s−1 and by assuming the water turbulence is null (which is probably not true at the water table). The value was then normalized to a Schmidt number of 600 (Sc= 600, for CO2 at 20°C) to obtain a k600 value of 1.6 m d−1 which is in the range of values reported by Raymond and Cole (2001). Accordingly, the CO2 fluxes ranged between 286 to 333 mmol m−2 d−1 (with a mean flux of 310 mmol m−2 d−1). This emission rate is higher than estimates reported for tropical mangrove tidal creeks (e.i., 1-200 mmol m−2 d−1, Borges et al. (2003); 1-80 mmol m−2 d−1 Bouillon et al. (2007)). In a small subtropical estuary, Sadat-Noori et al. (2016) estimated water to air CO2 fluxes as high as 1650 mmol m−2 d−1 in the wet season when the contribution of SGD is also high. Comparison of our result to literature values is difficult given the assumptions used to estimate the CO2 flux from (ground)water to air, including the gas transfer velocity. Despite these uncertainties, if we consider the extent of the intertidal zone over the 1200 m of the Martinique Beach, this emission rate results in a loss from 5165 to 6009 mol d−1 of CO2 with a mean loss of 5590 mol d−1 which corresponds to ~246 kg d−1 (227-264 kg d−1, Figure 7). This result suggests that the discharge zone may be a hot spot of CO2 degassing, during low tide periods. During the rest of the tidal cycle, the groundwater flow likely dominates the transport of carbonate parameters that would alter the buffering capacity of the receiving water.
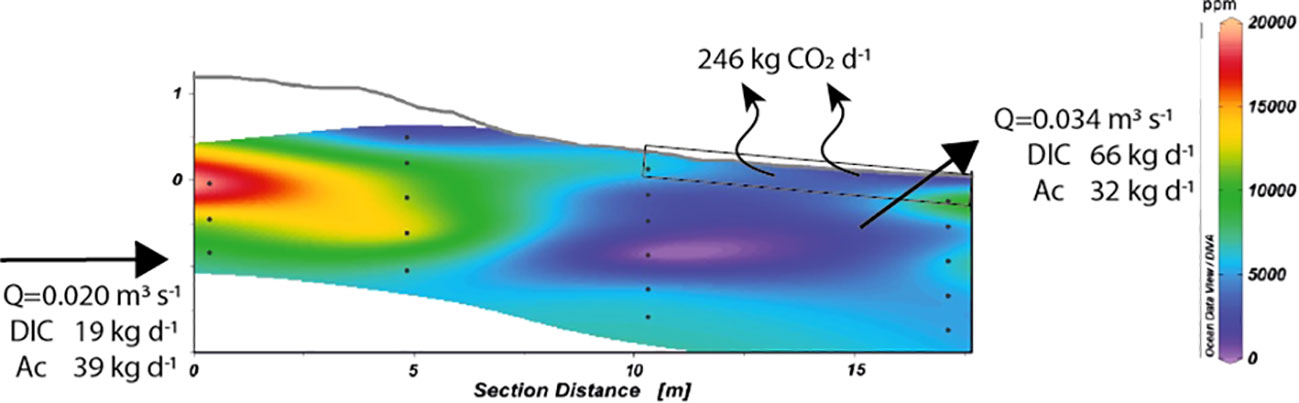
Figure 7 Cross-section of transect M1–M4 showing the topography and distribution of pCO2 along the STE (calculated with DIC-pH pair). Contour lines were determined by linear interpolation on Ocean Data View software that reproduced the empirical data set with a 0.93 confidence level. Depth is reported relative to the mean sea level (0 cm) and was determined from DGPS measurements. Black dots represent the depths at which samples were collected using multi-level samplers. Emissions of CO2 to the atmosphere, volumetric groundwater discharge and associated DIC and AC fluxes are reported. See text for details.
Based on inland well concentrations (Table 1) and an inland volumetric groundwater flow of 0.020 m3 s−1, the DIC and Ac inputs were around 1555 and 778 mol d−1, respectively (~19 and ~39 kg d−1 for DIC and Ac, Figure 7). Given a mean volumetric groundwater flow of 0.034 m3 s−1 measured at the shoreline and the mean DIC concentrations between piezometers M3 and M4, the inorganic carbon export was of ~5520 mol d−1 from the STE (which corresponds to 66 kg d−1, Figure 7). Likewise, the flux of carbonate alkalinity was twice as low, close to ~2700 mol d−1 (˜32 kg d−1, Figure 7). These fluxes are 3.5 times higher than fluxes derived from inland groundwater, and highlight the importance of considering the redox reactions along the flow path. The loss of CO2 to the atmosphere at low tide probably limits the export of metabolically produced DIC and the export of acidic SGD to coastal waters. Given the surface area of the aquifer at the shoreline, the SGD-derived DIC and Ac fluxes were 1.45 and 0.70 mol m−2 d−1, respectively. The DIC flux was lower than estimated in June 2013 in the same area because of the very high concentrations of DIC previously measured in the intertidal zone (Chaillou et al. (2014)). Nevertheless, it remains in the upper range of values reported in temperate and tropical systems, indicating that subarctic STEs must be also considered as potential sources of acidity to nearshore waters. For example, Moore et al. (2006) reported SGD-derived DIC fluxes of 1.9 mol m−2 d−1 to the Okatee Estuary (USA), and Atkins et al. (2013) estimated fluxes around 1.6 mol m−2 d−1 in North Creek, Australia. We note that most of these solute fluxes were calculated from radon-based SGD. Despite a major part of the metabolically produced CO2 being lost and neutralized along the groundwater flow path, the SGD-derived DIC flux was still greater, nearly twice, than Ac flux, reducing the buffering capacity of receiving nearshore waters.
Our results provide a snapshot of SGD-derived alkalinity (TA and Ac) and DIC fluxes from a subarctic subterranean estuary on the Magdelen Island in spring when the unconfined aquifer had been recharged after a few weeks of snow melt. Although an investigation of the net annual effect of SGD on nearshore water chemistry is not possible because of the difficulty to sample in the presence of ice foot and sea ice during the winter season, we observe that the SGD exported from the Martinique Beach STE is a net source of acidity to coastal waters, at least in the spring. The net production of acidity mainly results from the remineralization of organic matter released by the old buried forest soil. The biogeochemical role of paleo-soil on groundwater chemistry is complex and further investigations are necessary to determine the impact of weak organic acids on the acid-base properties of a STE system. In our region, where relative sea-level rises rapidly (Barnett et al., 2017), marine submersion and coastline retreat will favor the burial of coastal boreal forest soils which, upon their diagenetic remineralization, could become major sources of inorganic carbon to the atmosphere and coastal waters. In the St. Lawrence Gulf region, where deep waters are already experiencing the effects of acidification (Nesbitt and Mucci, 2020), considering CO2-rich groundwater input is critical to determine the impact of sea-level rise on regional and global carbon budgets.
Data availability statement
The raw data supporting the conclusions of this article will be made available by the authors, without undue reservation.
Author contributions
GC: Conceptualization, Funding acquisition, Methodology, Project administration, Resources, Supervision, Validation, Visualization, Writing – original draft, Writing – review & editing. GT-M: Formal analysis, Investigation, Methodology, Visualization, Writing – review & editing. AM: Validation, Writing – review & editing.
Funding
The author(s) declare financial support was received for the research, authorship, and/or publication of this article. This research was supported by the Canada Research Chair Program, grants from the Natural Sciences and Engineering Research Council of Canada NSERC (RGPIN-2021-04332 to GC) and the Université du Québec à Rimouski. Partial funding was provided by UQAR and Québec-Océan to GT-M.
Acknowledgments
We are grateful to Antoine Biehler and Maude Sirois for their valuable field assistance and Claude and Kathia Bourque for allowing access to the beach in the front of their lovely home. We would also like to acknowledge Dominique Poirier (EPOC, U. Bordeaux) for CH4 analyses. We thank Gwénaël Abril (BOREA, MNHN Paris) for his helpful comments during GT-M’s master thesis and on the preliminary version of this paper and the two anonymous reviewers who helped improve the paper.
Conflict of interest
The authors declare that the research was conducted in the absence of any commercial or financial relationships that could be construed as a potential conflict of interest.
Publisher’s note
All claims expressed in this article are solely those of the authors and do not necessarily represent those of their affiliated organizations, or those of the publisher, the editors and the reviewers. Any product that may be evaluated in this article, or claim that may be made by its manufacturer, is not guaranteed or endorsed by the publisher.
References
Abril G., Bouillon S., Darchambeau F., Teodoru C. R., Marwick T. R., Tamooh F., et al. (2015). Technical Note: Large overestimation of pCO2 calculated from pH and alkalinity in acidic, organic-rich freshwaters. Biogeosciences 12, 67–78. doi: 10.5194/bg-12-67-2015
Abril G., Commarieu M.-V., Guérin F. (2007). Enhanced methane oxidation in an estuarine turbidity maximum. Limnol. Oceanogr. 52, 470–475. doi: 10.4319/lo.2007.52.1.0470
Anschutz P., Mouret A., Deborde J., Lecroart P. (2009). Tidal sands as biogeochemical reactors. Estuar. Coast. And Shelf Sci. 84, 84–90. doi: 10.1016/j.ecss.2009.06.015
Atkins M. L., Santos I. R., Ruiz-Halpern S., Maher D. T. (2013). Carbon dioxide dynamics driven by groundwater discharge in a coastal floodplain creek. J. Hydrol. 493, 30–42. doi: 10.1016/j.jhydrol.2013.04.008
Barnett R. L., Bernatchez P., Garneau M., Juneau M.-N. (2017). Reconstructing late Holocene relative sea-level changes at the Magdalen Islands (Gulf of St. Lawrence, Canada) using multi-proxy analyses. J. Quaternary Sci. 32, 380–395. doi: 10.1002/jqs.2931
Beck M., Dellwig O., Kolditz K., Freund H. (2007). In situ pore water sampling in deep intertidal flat sediments. Limnol. Oceanogr. 5 (5), 136–144. doi: 10.4319/lom.2007.5.136
Borges A. V., Djenidi S., Lacroix G., Théate J., Delille B., Frankignoulle M. (2003). Atmospheric CO2 flux from mangrove surrounding waters. Geophys. Res. Lett. 30. doi: 10.1029/2003GL017143
Bouillon S., Middelburg J. J., Dehairs F., Borges A. V., Abril G., Flindt M. R., et al. (2007). Importance of intertidal sediment processes and porewater exchange on the water column biogeochemistry in a pristine mangrove creek (Ras Dege, Tanzania). Biogeosciences 4, 311–322. doi: 10.5194/bg-4-311-2007
Brisebois D. (1981). Lithostratigraphie des strate permo-carbonifères, de l’archipel des Îles-de-laMadeleine. In Ministére de l'énergie et des ressources naturelles, direction générale des énergies conventionelles, DPV-796, ISBN 2-550-01688-2, 58p.
Burnett W. C., Aggarwal P. K., Aureli A., Bokuniewicz H., Cable J. E., Charette M. A., et al. (2006). Quantifying submarine groundwater discharge in the coastal zone via multiple methods. Sci. Total Environ. 367, 498–543. doi: 10.1016/j.scitotenv.2006.05.009
Cai W. (2003). The geochemistry of dissolved inorganic carbon in a surficial groundwater aquifer in North Inlet, South Carolina, and the carbon fluxes to the coastal ocean. Geochim. Et Cosmochim. Acta 67, 631–639. doi: 10.1016/S0016-7037(02)01167-5
Cai W.-J., Wang Y., Hodson R. E. (1998). Acid-base properties of dissolved organic matter in the estuarine waters of Georgia, USA. Geochim. Et Cosmochim. Acta 62, 473–483. doi: 10.1016/S0016-7037(97)00363-3
Chaillou G., Couturier M., Tommi-Morin G., Rao A. M. F. (2014). Total alkalinity and dissolved inorganic carbon production in groundwaters discharging through a sandy beach. Proc. Earth Planet. Sci. 10, 88–99. doi: 10.1016/j.proeps.2014.08.017
Chaillou G., Lemay-Borduas F., Couturier M. (2016). Transport and transformations of groundwaterborne carbon discharging through a sandy beach to a coastal ocean. Can. Water Resour. J. / Rev. Can. Des. res. hydriques 1–14, 18–38. doi: 10.1080/07011784.2015.1111775
Chaillou G., Lemay-Borduas F., Larocque M., Couturier M., Biehler A., Tommi-Morin G. (2018). Flow and discharge of groundwater from a snowmelt-affected sandy beach. J. Hydrol. 557, 4–15. doi: 10.1016/j.jhydrol.2017.12.010
Charbonnier C., Anschutz P., Abril G., Mucci A., Deirmendjian L., Poirier D., et al. (2022). Carbon dynamics driven by seawater recirculation and groundwater discharge along a forestdune-beach continuum of a high-energy meso-macro-tidal sandy coast. Geochim. Cosmochim. Acta 317, 18–38. doi: 10.1016/j.gca.2021.10.021
Charbonnier C., Anschutz P., Poirier D., Bujan S. (2013). Aerobic respiration in a high-energy sandy beach. Mar. Chem. 155, 10–21. doi: 10.1016/j.marchem.2013.05.003
Charette M. A., Sholkovitz E. R. (2002). Oxidative precipitation of groundwater-derived ferrous iron in the subterranean estuary of a coastal bay. Geophys. Res. Lett. 29, 1444. doi: 10.1029/2001GL014512
Charette M. A., Sholkovitz E. R., Hansel C. M. (2005). Trace element cycling in a subterranean estuary: Part 1. Geochemistry of the permeable sediments. Geochim. Et Cosmochim. Acta 69, 2095–2109. doi: 10.1016/j.gca.2004.10.024
Chen C.-T. A., Wang S.-L. (1999). Carbon, alkalinity and nutrient budgets on the East China Sea continental shelf. J. Geophys. Res. 104 (C9), 20675–20686. doi: 10.1029/1999JC900055
Couturier M., Nozais C., Chaillou G. (2016). Microtidal subterranean estuaries as a source of fresh terrestrial dissolved organic matter to the coastal ocean. Mar. Chem. 186, 46–57. doi: 10.1016/j.marchem.2016.08.001
Couturier M., Tommi-Morin G., Sirois M., Rao A., Nozais C., Chaillou G. (2017). Nitrogen transformations along a shallow subterranean estuary. Biogeosciences 14, 3321–3336. doi: 10.5194/bg-14-3321-2017
Cyronak T., Santos I. R., Erler D. V., Eyre B. D. (2014). Groundwater and porewater as major sources of alkalinity to a fringing coral reef lagoon (Muri Lagoon, Cook Islands). Biogeosciences 10, 2467–2480. doi: 10.5194/bg-10-2467-2013
Cyronak T., Santos I. R., McMahon A., Eyre B. D. (2012). Carbon cycling hysteresis in permeable carbonate sands over a diel cycle: Implications for ocean acidification. Limnol. Oceanogr. 58, 131–143. doi: 10.4319/lo.2013.58.1.0131
Delaigue L., Thomas H., Mucci A. (2020). Spatial variations in CO2 fluxes in the saguenay fjord (quebec, Canada) and results of a water mixing model. Biogeosciences 17, 547–566. doi: 10.5194/bg-17547-2020
Dickson A. G., Afghan J. D., Anderson G. C. (2003). Reference materials for oceanic CO2 analysis: A method for the certification of total alkalinity. Mar. Chem. 80, 185–197. doi: 10.1016/S0304-4203(02)00133-0
Dorsett A., Cherrier J., Martin J. B., Cable J. E. (2011). Assessing hydrologic and biogeochemical controls on pore-water dissolved inorganic carbon cycling in a subterranean estuary: A 14C and 13C mass balance approach. Mar. Chem. 127, 76–89. doi: 10.1016/j.marchem.2011.07.007
Hall P. 0. J., Aller R. C. (1992). Rapid, small-volume, flow injection analysis for SCO2, and NH4+ in marine and freshwaters. Limnol. Oceanogr. 37, 1113–1119. doi: 10.4319/lo.1992.37.5.1113
Hébert A.-J., Flamand A., Chaillou G. (2022). Origins and transformations of terrigenous dissolved organic matter in a transgressive coastal system. Estuarine Coast. Shelf Sci. 279, 108137. doi: 10.1016/j.ecss.2022.108137
Heiss J. W., Michael H. A. (2014). Saltwater-freshwater mixing dynamics in a sandy beach aquifer over tidal, spring-neap, and seasonal cycles. Water Resour. Res. 50, 6747–6766. doi: 10.1002/2014WR015574
Hinzman L. D., Bettez N. D., Bolton W. R., Chapin F. S., Dyurgerov M. B., Fastie C. L., et al. (2005). Evidence and implications of recent climate change in Northern Alaska and other arctic regions. Climatic Change 72, 251–298. doi: 10.1007/s10584-005-5352-2
Hofmann A. F., Soetaert K., Middelburg J. J., Meysman F. J. R. (2010). AquaEnv : An Aqua tic Acid–Base Modelling Env ironment in R. Aquat. Geochem. 16, 507–546. doi: 10.1007/s10498-009-9084-1
Hunt C. W., Salisbury J. E., Vandemark D. (2011). Contribution of non-carbonate anions to total alkalinity and overestimation of pCO2 in New England and New Brunswick rivers. Biogeosciences 8, 3069–3076. doi: 10.5194/bg-8-3069-2011
Kim J., Kim G. (2017). Inputs of humic fluorescent dissolved organic matter via submarine groundwater discharge to coastal waters off a volcanic island (Jeju, Korea). Sci. Rep. 7, 1–9. doi: 10.1038/s41598-017-08518-5
Kuliński K., Schneider B., Hammer K., Machulik U., Schulz-Bull D. (2014). The influence of dissolved organic matter on the acid–base system of the Baltic Sea. J. Mar. Syst. 132, 106–115. doi: 10.1016/j.jmarsys.2014.01.011
Kwon H. K., Kang H., Oh Y. H., Park S. R., Kim G. (2017). Green tide development associated with submarine groundwater discharge in a coastal harbor, Jeju, Korea. Sci. Rep. 7, 6325. doi: 10.1038/s41598-017-06711-0
Lee J., Kim G. (2015). Dependence of pH in coastal waters on the adsorption of protons onto sediment minerals. Limnol. Oceanogr. 60, 831–839. doi: 10.1002/lno.10057
Linkhorst A., Dittmar T., Waska H. (2017). Molecular fractionation of dissolved organic matter in a shallow subterranean estuary: the role of the iron curtain. Environ. Sci. Technol. 51, 1312–1320. doi: 10.1021/acs.est.6b03608
Liu Q., Charette M. A., Breier C. F., Henderson P. B., McCorkle D. C., Martin W., et al. (2017). Carbonate system biogeochemistry in a subterranean estuary - Waquoit Bay, USA. Geochim. Et Cosmochim. Acta 203, 422–439. doi: 10.1016/j.gca.2017.01.041
Liu Q., Charette M. A., Henderson P. B., McCorkle D. C., Martin W., Dai M. (2014). Effect of submarine groundwater discharge on the coastal ocean inorganic carbon cycle. Limnol. Oceanogr. 59, 1529–1554. doi: 10.4319/lo.2014.59.5.1529
Maher D. T., Santos I. R., Golsby-Smith L., Gleeson J., Eyre B. D. (2013). Groundwater-derived dissolved inorganic and organic carbon exports from a mangrove tidal creek: The missing mangrove carbon sink? Limnol. Oceanogr. 58, 475–488. doi: 10.4319/lo.2013.58.2.0475
Martin J. B., Cable J. E., Smith C., Roy M., Cherrier J. (2007). Magnitudes of submarine groundwater discharge from marine and terrestrial sources: Indian River Lagoon, Florida. Water Resour. Res. 43. doi: 10.1029/2006WR005266
Millero F. J., Graham T. B., Huang F., Bustos-Serrano H., Pierrot D. (2006). Dissociation constants of carbonic acid in seawater as a function of salinity and temperature. Mar. Chem. 100, 80–94. doi: 10.1016/j.marchem.2005.12.001
Moore W. S. (1999). The subterranean estuary: a reaction zone of ground water and sea water. Mar. Chem. 65, 111–125. doi: 10.1016/S0304-4203(99)00014-6
Moore W. S. (2010). The effect of submarine groundwater discharge on the ocean. Annu. Rev. Mar. Sci. 2, 59–88. doi: 10.1146/annurev-marine-120308-081019
Moore W. S., Blanton J. O., Joye S. B. (2006). Estimates of flushing times, submarine groundwater discharge, and nutrient fluxes to Okatee estuary, South Carolina. J. Geophys. Re Oceans : J. Geophys. Res. 111 (C9). doi: 10.1029/2005JC003041
Mulligan A. E., Charette M. A. (2006). Intercomparison of submarine groundwater discharge estimates from a sandy unconfined aquifer. J. Hydrol. 327, 411–425. doi: 10.1016/j.jhydrol.2005.11.056
Nesbitt W. A., Mucci A. (2020). Direct evidence of sediment carbonate dissolution in response to bottom-water acidification in the Gulf of St. Lawrence, Canada. Can. J. Of Earth Sci. 58 (1), 84–92. doi: 10.1139/cjes-2020-0020
Pain A. J., Martin J. B., Young C. R. (2019). Sources and sinks of CO 2and CH 4in siliciclastic subterranean estuaries. Limnol. Oceanogr. 64, 1500–1514. doi: 10.1002/lno.11131
Rao A. M. F., Malkin S. Y., Montserrat F., Meysman F. J. R. (2014). Alkalinity production in intertidal sands intensified by lugworm bioirrigation. Estuarine Coast. Shelf Sci. 148, 36–47. doi: 10.1016/j.ecss.2014.06.006
Rassmann J., Eitel E. M., Lansard B., Cathalot C., Brandily C., Taillefert M., et al. (2020). Benthic alkalinity and dissolved inorganic carbon fluxes in the Rhône River prodelta generated by decoupled aerobic and anaerobic processes. Biogeosciences 17, 13–33. doi: 10.5194/bg-17-13-2020
Raymond P. A., Cole J. J. (2001). Gas exchange in rivers and estuaries: choosing a gas transfer velocity. Estuaries 24, 312. doi: 10.2307/1352954
Robinson C., Li L., Prommer H. (2007). Tide-induced recirculation across the aquifer-ocean interface. Water Resour. Res. 43. doi: 10.1029/2006WR005679
Robinson C. E., Xin P., Santos I. R., Charette M. A., Li L., Barry D. A. (2018). Groundwater dynamics in subterranean estuaries of coastal unconfined aquifers: Controls on submarine groundwater discharge and chemical inputs to the ocean. Adv. Water Resour. 115, 315–331. doi: 10.1016/j.advwatres.2017.10.041
Roulet N. T., Lafleur P. M., Richard P. J. H., Moore T. R., Humphreys E. R., BUBIER J. (2007). Contemporary carbon balance and late Holocene carbon accumulation in a northern peatland. Global Change Biol. 13, 397–411. doi: 10.1111/j.1365-2486.2006.01292.x
Roy R. N., Roy L. N., Lawson M., Vogel K. M., Porter Moore C., Davis W., et al. (1993). Thermodynamics of the dissociation of boric acid in seawater at S = 35 from 0 to 55°C. Mar. Chem. 44, 243–248. doi: 10.1016/0304-4203(93)90206-4
Sadat-Noori M., Maher D. T., Santos I. R. (2015). Groundwater discharge as a source of dissolved carbon and greenhouse gases in a subtropical estuary. Estuaries Coasts 39, 639–656. doi: 10.1007/s12237-015-0042-4
Sadat-Noori M., Santos I. R., Tait D. R., Maher D. T. (2016). Fresh meteoric versus recirculated saline groundwater nutrient inputs into a subtropical estuary. Sci. Total Environ. 566-567, 1440–1453. doi: 10.1016/j.scitotenv.2016.06.008
Santos I. R., Burnett W. C., Dittmar T., Suryaputra I. G. N. A., Chanton J. (2009). Tidal pumping drives nutrient and dissolved organic matter dynamics in a Gulf of Mexico subterranean estuary. Geochim. Cosmochim. Acta 73, 1325–1339. doi: 10.1016/j.gca.2008.11.029
Santos I. R., de Weys J., Eyre B. D. (2011). Groundwater or floodwater? Assessing the pathways of metal exports from a coastal acid sulfate soil catchment. Environ. Sci. Technol. 45, 9641–9648. doi: 10.1021/es202581h
Santos I. R., Eyre B. D., Huettel M. (2012). The driving forces of porewater and groundwater flow in permeable coastal sediments: A review. Estuar. Coast. And Shelf Sci. 98, 1–15. doi: 10.1016/j.ecss.2011.10.024
Seidel M., Beck M., Riedel T., Waska H., Suryaputra I. G. N. A., Schnetger B., et al. (2014). Biogeochemistry of dissolved organic matter in an anoxic intertidal creek bank. Geochim. Et Cosmochim. Acta 140, 418–434. doi: 10.1016/j.gca.2014.05.038
Sirois M., Couturier M., Barber A., Gelinas Y., Chaillou G. (2018). Interactions between iron and organic carbon in a sandy beach subterranean estuary. Mar. Chem. 202, 86–96. doi: 10.1016/j.marchem.2018.02.004
Slangen A. B. A., Carson M., Katsman C. A., van de Wal R. S. W., Köhl A., Vermeersen L. L. A., et al. (2014). Projecting twenty-first century regional sea-level changes. Climatic Change 124, 317–332. doi: 10.1007/s10584-014-1080-9
Smith A. J., Nield S. P. (2003). Groundwater discharge from the superficial aquifer into Cockburn Sound Western Australia: estimation by inshore water balance. Biogeochemistry 66, 125–144. doi: 10.1023/B:BIOG.0000006152.27470.a9
Spiteri C., Regnier P., Slomp C. P., Charette M. A. (2006). pH-Dependent iron oxide precipitation in a subterranean estuary. J. Geochem. Explor. 88, 399–403. doi: 10.1016/j.gexplo.2005.08.084
Uppström L. R. (1974). The boron/chlorinity ratio of deep-sea water from the pacific ocean. Deep Sea Res. Oceanogr. Abs. 21, 161–162. doi: 10.1016/0011-7471(74)90074-6
Wang G., Jing W., Wang S., Xu Y., Wang Z., Zhang Z., et al. (2014). Coastal acidification induced by tidal-driven submarine groundwater discharge in a coastal coral reef system. Environ. Sci. Technol. 48, 13069–13075. doi: 10.1021/es5026867
Wang G., Wang Z., Zhai W., Moore W. S., Li Q., Yan X., et al. (2015). Net subterranean estuarine export fluxes of dissolved inorganic C, N, P, Si, and total alkalinity into the Jiulong River estuary, China. Geochim. Et Cosmochim. Acta 149, 103–114. doi: 10.1016/j.gca.2014.11.001
Wanninkhof R. (1992). Relationship between wind speed and gas exchange over the ocean. J. Of Geophys. Research-Oceans 97, 7373–7382. doi: 10.1029/92JC00188
Waska H., Simon H., Ahmerkamp S., Greskowiak J., Ahrens J., Seibert S. L., et al. (2021). Molecular traits of dissolved organic matter in the subterranean estuary of a high-energy beach: Indications of sources and sinks. Front. Mar. Sci. 8. doi: 10.3389/fmars.2021.607083
Keywords: subterranean estuary, submarine groundwater discharge, dissolved inorganic carbon, carbon dioxide, alkalinity, redox reactions
Citation: Chaillou G, Tommi-Morin G and Mucci A (2024) Production and fluxes of inorganic carbon and alkalinity in a subarctic subterranean estuary. Front. Mar. Sci. 11:1323463. doi: 10.3389/fmars.2024.1323463
Received: 17 October 2023; Accepted: 18 January 2024;
Published: 21 February 2024.
Edited by:
Antonio Cobelo-Garcia, Spanish National Research Council (CSIC), SpainReviewed by:
Henry Bokuniewicz, The State University of New York (SUNY), United StatesJ. Severino Pino Ibánhez, Spanish National Research Council (CSIC), Spain
Copyright © 2024 Chaillou, Tommi-Morin and Mucci. This is an open-access article distributed under the terms of the Creative Commons Attribution License (CC BY). The use, distribution or reproduction in other forums is permitted, provided the original author(s) and the copyright owner(s) are credited and that the original publication in this journal is cited, in accordance with accepted academic practice. No use, distribution or reproduction is permitted which does not comply with these terms.
*Correspondence: Gwénaëlle Chaillou, Z3dlbmFlbGxlX2NoYWlsbG91QHVxYXIuY2E=