 Tomoko Hamabata
 Kazunari Kameda2
 Ryota Hayashi
 Junichi Okuyama
 Hideaki Nishizawa
- 1Graduate School of Information Sciences, Tohoku University, Sendai, Miyagi, Japan
- 2Kuroshima Research Station, Sea Turtle Association of Japan, Taketomi, Okinawa, Japan
- 3Research & Development Center, Nippon Koei Co., Ltd., Tsukuba, Ibaraki, Japan
- 4Graduate School of Informatics, Kyoto University, Yoshida Honmachi, Kyoto, Japan
- 5Okinawa Churashima Research Institute, Motobu, Okinawa, Japan
- 6Okinawa Churaumi Aquarium, Okinawa Churashima Foundation, Motobu, Okinawa, Japan
Introduction
Marine turtles exhibit philopatry in their natal regions, forming genetically differentiated population structures in distant regions (Meylan et al., 1990; Bowen et al., 1993). Since it has been shown that the control region in maternally inherited mitochondrial DNA (mtDNA) evolves faster and is available to identify and distinguish genetically distinct populations (Allard et al., 1994; Norman et al., 1994), haplotype frequencies of marine turtles have been collected worldwide. Population structure elucidated from haplotype frequencies is helpful for defining Regional Management Units (Wallace et al., 2010) or distinct population segments (Seminoff et al., 2015) for conservation management. Furthermore, haplotype frequencies in genetically distinct populations have been used as baseline data for estimating the natal origin of in-water/foraging individuals using mixed stock analysis (MSA) (Pella and Masuda, 2001; Bolker et al., 2007), and have helped elucidate the relationships between various nesting sites and feeding grounds.
The Japanese Archipelago provides both nesting sites and foraging grounds for three species of marine turtles: loggerhead (Caretta caretta), green (Chelonia mydas), and hawksbill turtles (Eretmochelys imbricata) (Seminoff, 2004; Mortimer and Donnelly, 2008; Wallace et al., 2010; Casale and Tucker, 2017). Genetic data on these marine turtles around Japan were first used to investigate the global population structure (Bowen et al., 1992) and structures of green turtles in the Indo-Pacific or broad Pacific region (Norman et al., 1994). Similarly, Okayama et al. (1999) examined the genetic diversity of Indo-Pacific and Caribbean populations of hawksbill turtles. Trans-Pacific migration during the development of loggerhead turtles born in Japan was clarified using mtDNA analysis of juvenile turtles captured around Baja, California (Bowen et al., 1995). Shifting to a more localized scope, research has focused on the genetic structure of loggerhead turtles in Japanese nesting rookeries (Hatase et al., 2002; Matsuzawa et al., 2016). The locations of nesting rookeries for green and hawksbill turtles were also identified in remote islands and islet areas of the Ryukyu Archipelago (Ryukyus) or Ogasawara Islands (Kamezaki, 1989; Kikukawa et al., 1999; Kondo et al., 2017; Okuyama et al., 2020) (Figure 1). However, because of the challenges in comprehensively collecting samples from the entire island region, genetic research on these two species began mainly after 2010, resulting in a series of regional studies documented in multiple papers.

Figure 1 Map of the Japanese Archipelago showing the locations of nesting sites and foraging grounds where the samples were collected (A). Enlarged maps (B–E) show the areas of Yakushima Island in the northern Ryukyus and Nomaike in the southern part of Kyushu Island (B), the islands in the central Ryukyus (C), the islands in the Yaeyama Islands (D), and the islands in the Ogasawara Islands (E).
The collection of haplotype data on a global scale necessitated the comparison of sequences across different regions. The NOAA and Atmospheric Administration Southwest Fisheries Science Center (SWFSC) has played a pivotal role in standardizing the nomenclature for haplotypes in the Indo-Pacific region. Initially, sequences of Japanese sea turtles were identified using RFLP fragment names (Bowen et al., 1992), regional labels (Norman et al., 1994), or serial numbers (Okayama et al., 1999) of various lengths. Subsequently, some studies have introduced unique sequence lengths of approximately 500 bp and designated sequence names with distinct prefixes, such as CMJ for green turtles and EIJ for hawksbill turtles, to report the haplotypes of green and hawksbill turtles within Japan. However, comparing them with data reported from other regions, which now adhere to standardized sequences of approximately 760 bp with prefixes CmP or EiIP and branch numbers established by the aforementioned SWFSC group, is challenging. In addition, the situation is complex for hawksbill turtle mtDNA haplotypes, as GenBank contains multiple nearly identical haplotypes, often without associated publications, making it difficult to ascertain sample localities. Furthermore, various studies have reported the haplotypes of in-water/foraging green turtles in Japan, leading to data dispersion. This intricate scenario poses challenges for researchers who aim to utilize haplotype data collected near Japan for future MSA studies. This complexity could potentially result in overlooked references, leading to inaccurate MSA studies.
This Data Report presents a more accessible format for future research by consolidating published data and offering insights into where genetic investigations have been conducted in Japan. Additionally, it is useful to non-researchers and conservationists seeking information on potential temporary origins based on mtDNA from sporadic stranding or bycatch specimens. Moreover, we incorporated newly obtained sequencing data not covered in previous studies but acquired through sporadic or ongoing sampling after the release of regional reports. This report presents the most up-to-date and comprehensive data on mtDNA haplotype frequencies encompassing both the nesting and foraging regions of green and hawksbill turtles in Japan and the surrounding waters.
Methods
Green turtles
Nesting sites for green turtles within Japan span the Ryukyu Archipelago and the Ogasawara Islands, whereas their foraging grounds encompass a wide coastal expanse along Japan’s shores (Figure 1). Haplotype data associated with nesting populations were collected from Yaeyama (Nishizawa et al., 2011), the central Ryukyus (Hamabata et al., 2009, 2014), and Ogasawara Islands (Nishizawa et al., 2013; Hamabata et al., 2020). Haplotype data for the foraging aggregations were collected from Yaeyama (Nishizawa et al., 2013; Hamabata et al., 2023), Okinawajima (Nishizawa et al., 2013; Hayashi and Nishizawa, 2015; Hamabata et al., 2018), Nomaike, Muroto, Kumano-nada (Hamabata et al., 2015), Oita (Kudo et al., 2021), Kanto (Nishizawa et al., 2013), and Sanriku (Nishizawa et al., 2014). We expanded the existing haplotype dataset by including new samples from nesting sites and sites where turtles were present while foraging or in water.
Haplotype lengths and names differed before and after the introduction of standardized haplotype nomenclature. In publications preceding 2013, short CMJ haplotypes have been documented and deposited in GenBank. After 2014, longer CmP haplotypes were reported using the novel LCM15382 and H950g primers that can be used across sea turtle species (Abreu-Grobois et al., 2006). Samples previously associated with shorter haplotype lengths were resequenced and subsequently assigned a standardized nomenclature. However, this resequencing process did not cover all samples. These data categorized haplotypes based on whether they covered the present standard length of approximately 760 bp. To prioritize comparisons with data from other regions, the data were tabulated using the abbreviated CmP sequence version, omitting the branch number, although the resolution was lowered. Among sequences of shorter length, approximately 500 bp fragments designated with CMJ prefixes displayed a similar level of resolution to the standard name haplotypes, approximately 760 bp in length, which utilize CmP prefixes and include branch numbers. For example, CMJ2, CMJ8, and CMJ14 correspond to CmP20.3, CmP20.1, and CmP20.2, respectively, although the complete identity of 500 bp haplotypes with CMJ prefixes to the longer haplotypes with CmP prefixes cannot be assured because of unidentified substitutions in the unanalyzed loci. Therefore, we added the CMJ haplotype name to corresponding long (760 bp) haplotype. Some short haplotypes with CMJ prefixes did not match with the corresponding sequences utilizing CmP prefixes. The sequences were included without changing their names. Samples with long sequences were included in the tally of short sequences by trimming but were also tallied only with longer sequences. Haplotype networks were created for each length using the R package pegas to visually understand how much data from long sequences collected at the nesting sites covered the short sequence data (Supplementary Figure S1). Each haplotype is shown as a pie chart based on the number of individuals in the sampled nesting regions. Networks separated by substitutions of 10 or more bases were divided into clade names according to the ones used by Jensen et al. (2019). Haplotype and nucleotide diversity of nesting sites were calculated except for the samples of Kuroshima, where only one sample, and longer sequences in Hahajima, where there were no longer sequences available, were analyzed using Arlequin ver. 3.5.1 (Excoffier and Lischer, 2010). The Tamura-Nei (Tamura and Nei, 1993) model was used to estimate nucleotide substitution.
Hawksbill turtles
Hawksbill nesting sites in Japan are primarily confined to the Ryukyu Archipelago (Kamezaki, 1989). Although the detailed distribution is unknown, most foraging grounds are thought to be coral reef areas along the Ryukyu coast (Figure 1). Compared to green turtles, hawksbill have undergone less extensive haplotype analysis because of their limited distribution and small population/aggregation size in Japan. Three studies reported ~500-bp haplotypes (Okayama et al., 1999; Nishizawa et al., 2010, 2012). A previous study classified haplotypes using serial numbers ranging from one to twenty-four (Supplementary Data 1). The latter two studies systemized haplotypes named with the EIJ prefix, but there were no sequences comparable to the ~760 bp haplotypes with EiIP prefixes. Here, we include resequencing data for longer haplotypes of samples derived from nesting sites (Nishizawa et al., 2012). Furthermore, our dataset incorporates additional new samples. These samples were collected from nesting sites within the Yaeyama Islands and Okinawajima and were extracted from the foraging grounds surrounding the Yaeyama region.
Similar to the green turtle haplotypes, hawksbill turtle haplotypes characterized by short sequences lacking corresponding standard name sequences were retained in their original form and were not assigned new designations in this study. Short haplotypes aligned with the sequences of standard names are presented in the same table row to denote their correspondence. To ensure comparability, we rearranged the long-sequence haplotypes using the EiIP prefix nomenclature maintained by the NWFSC and used in previous studies (Nishizawa et al., 2016; Vargas et al., 2016; Arantes et al., 2020). As with green turtles, haplotype networks were created for hawksbill turtles using long and short sequences collected at their nesting sites (Figure S2). Clade names were obtained as described by Arantes et al. (2020). Haplotype and nucleotide diversity were calculated only for Ishigakijima Island, where multiple samples were available, using the same method used for green turtles.
Results & discussion
The haplotype data of the green turtles at the nesting sites were collected from 393 individuals with short sequences and 217 individuals with long sequences (Table 1, Supplementary Table S1, S2). Of these, 79 individuals were newly analyzed or resequenced samples for long sequences. Captured or stranded turtles in the foraging grounds provided data from 968 individuals with short sequences (680 individuals within the Ryukyus and 288 individuals around the Main Islands) (Supplementary Table S3) and 573 individuals with long sequences (341 individuals within the Ryukyus and 232 individuals in the Main Islands) (Supplementary Table S4). Of these, 81 individuals were newly analyzed or resequenced samples with long sequences. Previous studies that reported haplotype data of nesting sites in the three geographic regions, Yaeyama, Central Ryukyus, and Ogasawara, showed that each region includes one or more genetically distinct populations (Nishizawa et al., 2011, 2013; Hamabata et al., 2014). The increased sample size didn’t change the frequent haplotypes in nesting sites and foraging grounds from the previous data. This suggests that the population structure or mixed stock compositions discussed in previous studies are still likely to be supported. In previous studies, short sequences were employed as baseline data for MSA owing to regional disparities in reported sequence lengths because of the unavailability of longer haplotypes in some nesting sites, even when individuals within foraging areas were sequenced for longer haplotypes. The sample size for haplotype frequencies from the longer sequences collected at nesting sites was still smaller than that of the short sequences. Also, the haplotype network and genetic diversities showed that the diversity was not always higher in longer haplotype data than in shorter haplotype data in nesting sites. Therefore, given the large sample size, MSA using short sequences as baseline data is likely to continue to be beneficial. This time, we expanded the baseline by adding samples from Yakushima to encompass most of the data on green turtle nesting sites in Japan. It would be meaningful in the future to replace baseline data with long sequences. Recently, changes over time in the natal origin composition of foraging individuals have been observed around Yaeyama (Hamabata et al., 2023). Collecting data that allows us to observe changes in foraging grounds over time may become more important for the conservation of this long-lived species and the coexistence of its ecosystem.
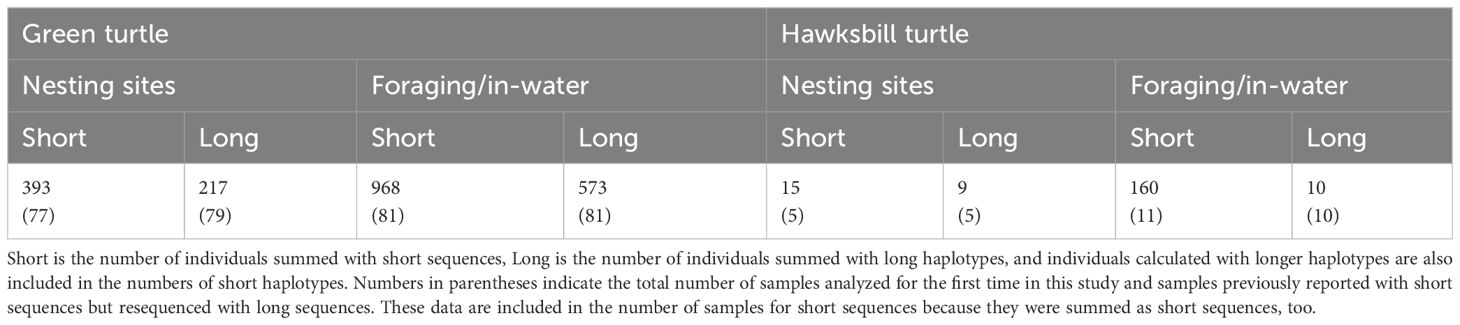
Table 1 The Numbers of green and hawksbill turtles summarized in this Data Report.
Haplotype data of hawksbill turtle nesting sites in Japan were collected from 15 individuals with short and 9 with long sequences (Table 1, Supplementary Table S5). Data from five individuals, both long and short sequences, are newly obtained. Haplotypes from hawksbills in foraging/in-water habitats were collected from 160 individuals with short and ten with long sequences (Tables 1, Supplementary Table S6). Most of the data regarding foraging individuals came from previous studies (Okayama et al., 1999; Nishizawa et al., 2010), and only ten individuals were added. In the haplotype data from the nesting regions, turtles with the haplotype 9/EIJ1/EiIP-125 series and haplotype 3/EIJ11/EiIP-53 series were frequently found in Yaeyama and Central Ryukyus, respectively (Supplementary Table S5, Supplementary Figure S2). However, the current sample sizes of both short and long haplotypes are insufficient not only to compare regional population genetic structure but also as a baseline for MSA. In addition, haplotype 3/EIJ11 was the second most common among foraging individuals in the Ryukyus (Okayama et al., 1999; Nishizawa et al., 2010) (Supplementary Table S6). It matches a partial sequence of multiple long sequences with the EiIP prefix, including EiIP-53, making regional comparisons of contributions based on short sequences difficult. It is essential to organize haplotype data, including those from other regions, and improve the MSA baseline. However, the present haplotype data of nesting individuals and foraging/in-water individuals in Japan will help to clarify the gaps and develop future research to understand the distribution and populations in the northernmost regions.
Data availability statement
The original contributions presented in the study are included in the article/Supplementary Material, further inquiries can be directed to the corresponding authors.
Ethics statement
The animal study was approved by Kyushu Regional Environment Office, Ministry of the Environment, Yakushima National Park, the Kagoshima Prefecture Turtle Protection Ordinance, and Marine Fisheries Coordinating Committee of Okinawa Prefecture, Japan. The study was conducted in accordance with the local legislation and institutional requirements.
Author contributions
TH: Conceptualization, Data curation, Funding acquisition, Validation, Visualization, Writing – original draft, Writing – review & editing, Investigation, Resources. KK: Resources, Writing – review & editing, Validation. RH: Resources, Writing – review & editing, Funding acquisition, Validation, Investigation. JO: Resources, Writing – review & editing, Validation. IK: Resources, Writing – review & editing, Validation. HN: Conceptualization, Data curation, Validation, Writing – original draft, Writing – review & editing, Investigation, Resources.
Funding
The author(s) declare financial support was received for the research, authorship, and/or publication of this article. This work was supported by the Japan Society for the Promotion of Science [grant number JP21K15162 to TH, JP16K21005 and JP19K04683 to RH] and the Cooperation Research Program of the Wildlife Research Center, Kyoto University (RH).
Acknowledgments
We would like to thank Osamu Abe, Yu Nakanishi, Wakatsuki Motoki, Ishigaki Island Sea Turtle Research Group, Yakushima Umigame-kan and many volunteers, and the Sea Turtle Association of Japan for their cooperation in providing many samples and their support of our field sampling. We are also grateful to the staff responsible for the rearing of captive sea turtles at the Okinawa Churaumi Aquarium, Japan.
Conflict of interest
Author RH is employed by Research & Development Center, Nippon Koei Co., Ltd.
The remaining authors declare that the research was conducted in the absence of any commercial or financial relationships that could be construed as a potential conflict of interest.
Publisher’s note
All claims expressed in this article are solely those of the authors and do not necessarily represent those of their affiliated organizations, or those of the publisher, the editors and the reviewers. Any product that may be evaluated in this article, or claim that may be made by its manufacturer, is not guaranteed or endorsed by the publisher.
Supplementary material
The Supplementary Material for this article can be found online at: https://www.frontiersin.org/articles/10.3389/fmars.2024.1328101/full#supplementary-material
References
Abreu-Grobois F. A., Horrocks J. A., Krueger B., Formia A., Beggs J. (2006). “New mtDNA dloop primers which work for a variety of marine turtle species may increase the resolution of mixed stock analyses,” in Book of abstracts from the 26th annual symposium on sea turtle biology and conservation. International Sea Turtle Society (Japan: The Herpetological Society), 179, ISBN: 960-87926-1-4.
Allard M. W., Miyamoto M. M., Bjorndal K. A., Bolten A. B., Bowen B. W. (1994). Support for natal homing in green turtles from mitochondrial DNA sequences. Copeia 1994, 34–41. doi: 10.2307/1446668
Arantes L. S., Vargas S. M., Santos F. R. (2020). Global phylogeography of the critically endangered hawksbill turtle (Eretmochelys imbricata). Genet. Mol. Biol. 43, e20190264. doi: 10.1590/1678-4685-gmb-2019-0264
Bolker B. M., Okuyama T., Bjorndal K. A., Bolten A. B. (2007). Incorporating multiple mixed stocks in mixed stock analysis: “many-to-many” analyses. Mol. Ecol. 16, 685–695. doi: 10.1111/j.1365-294X.2006.03161.x
Bowen B. W., Abreu-Grobois F. A., Balazs G. H., Kamezaki N., Limpus C. J., Ferl R. J. (1995). Trans-Pacific migrations of the loggerhead turtle (Caretta caretta) demonstrated with mitochondrial DNA markers. Proc. Natl. Acad. Sci. U.S.A. 92, 3731–3734. doi: 10.1073/pnas.92.9.3731
Bowen B., Avise J. C., Richardson J. I., Meylan A. B., Margaritoulis D., Hopkins-Murphy Sally R. (1993). Population structure of loggerhead turtles (Caretta caretta) in the northwestern atlantic ocean and mediterranean sea. Conserv. Biol. 7, 834–844. doi: 10.1046/j.1523-1739.1993.740834.x
Bowen B. W., Meylan A. B., Ross J. P., Limpus C. J., George H., Avise J. C. (1992). Global population structure and natural history of the green turtle (Chelonia mydas) in terms of matriarchal phylogeny. Evol. (N Y) 46, 865–881. doi: 10.1111/j.1558-5646.1992.tb00605.x
Casale P., Tucker A. D. (2017) The IUCN Red List of Threatened Species 2017. Available online at: https://dx.doi.org/10.2305/IUCN.UK.2017-2.RLTS.T3897A119333622.en (Accessed September 27, 2023). doi: 10.2305/IUCN.UK.2017-2.RLTS.T3897A119333622.en
Excoffier L., Lischer H. E. L. (2010). Arlequin suite ver 3.5: a new series of programs to perform population genetics analyses under Linux and Windows. Mol. Ecol. Resour. 10, 564–567. doi: 10.1111/j.1755-0998.2010.02847.x
Hamabata T., Hikida T., Okamoto K., Watanabe S., Kamezaki N. (2015). Ontogenetic habitat shifts of green turtles (Chelonia mydas) suggested by the size modality in foraging aggregations along the coasts of the western Japanese main islands. J. Exp. Mar. Biol. Ecol. 463, 181–188. doi: 10.1016/j.jembe.2014.12.007
Hamabata T., Kamezaki N., Hikida T. (2014). Genetic structure of green turtle (Chelonia mydas) peripheral populations nesting in the northwestern Pacific rookeries: Evidence for northern refugia and postglacial colonization. Mar. Biol. 161, 495–507. doi: 10.1007/s00227-013-2352-z
Hamabata T., Kawata M., Kondo S., Matsuo A., Suyama Y., Suzuki K., et al. (2023). Twenty-year changes in the composition of a mixed stock of foraging green turtles in the Yaeyama Islands of Japan. Mar. Ecol. Prog. Ser. 716, 93–105. doi: 10.3354/meps14367
Hamabata T., Matsuo A., Sato M. P., Kondo S., Kameda K., Kawazu I., et al. (2020). Natal origin identification of green turtles in the North Pacific by genome-wide population analysis with limited DNA samples. Front. Mar. Sci. 7. doi: 10.3389/fmars.2020.00658
Hamabata T., Nishida S., Kamezaki N., Koike H. (2009). Genetic structure of populations of the green turtle (Chelonia mydas) in Japan using mtDNA control region sequences. Bull. Graduate School Soc. Cult. Studies Kyushu Univ. 15, 35–50. doi: 10.15017/13994
Hamabata T., Nishizawa H., Kawazu I., Kameda K., Kamezaki N., Hikida T. (2018). Stock composition of green turtles Chelonia mydas foraging in the Ryukyu Archipelago differs with size class. Mar. Ecol. Prog. Ser. 600, 151–163. doi: 10.3354/meps12657
Hatase H., Kinoshita M., Bando T., Kamezaki N., Sato K., Matsuzawa Y., et al. (2002). Population structure of loggerhead turtles, Caretta caretta , nesting in Japan: bottlenecks on the Pacific population. Mar. Biol. 141, 299–305. doi: 10.1007/s00227-002-0819-4
Hayashi R., Nishizawa H. (2015). Body size distribution demonstrates flexible habitat shift of green turtle (Chelonia mydas). Glob Ecol. Conserv. 3, 115–120. doi: 10.1016/j.gecco.2014.11.008
Jensen M. P., FitzSimmons N. N., Bourjea J., Hamabata T., Reece J., Dutton P. H. (2019). The evolutionary history and global phylogeography of the green turtle (Chelonia mydas). Journal of Biogeography. 46, 860–870. doi: 10.1111/jbi.13483
Kamezaki N. (1989). “The nesting sites of sea turtles in the Ryukyu Archipelago and Taiwan,” in Current Herpetology in East Asia, 342–348.
Kikukawa A., Kamezaki N., Ota H. (1999). Current status of the sea turtles nesting on Okinawajima and adjacent islands of the central Ryukyus, Japan. Biol. Conserv. 87, 149–153. doi: 10.1016/S0006-3207(98)00047-0
Kondo S., Morimoto Y., Sato T., Suganuma H. (2017). Factors affecting the long-term population dynamics of green turtles (Chelonia mydas) in Ogasawara, Japan: Influence of natural and artificial production of hatchlings and harvest pressure. Chelonian Conserv. Biol. 16, 83–92. doi: 10.2744/CCB-1222.1
Kudo H., Nishizawa H., Uchida K., Sato K. (2021). Boldness–exploration behavioral syndrome in wild sub-adult green sea turtles caught at Oita, Japan. Appl. Anim. Behav. Sci. 236, 105216. doi: 10.1016/j.applanim.2021.105216
Matsuzawa Y., Kamezaki N., Ishihara T., Omuta K., Takeshita H., Goto K., et al. (2016). Fine-scale genetic population structure of loggerhead turtles in the Northwest Pacific. Endanger Species Res. 30, 83–93. doi: 10.3354/esr00724
Meylan A. B., Bowen B. W., Avise J. C. (1990). A genetic test of the natal homing versus social facilitation models for Green turtle migration. Sci. (1979) 248, 724–727. doi: 10.1126/science.2333522
Mortimer J. A., Donnelly M. (2008) The IUCN Red List of Threatened Species 2008. Available online at: https://dx.doi.org/10.2305/IUCN.UK.2008.RLTS.T8005A12881238.en (Accessed September 27, 2023).
Nishizawa H., Abe O., Okuyama J., Kobayashi M., Arai N. (2011). Population genetic structure and implications for natal philopatry of nesting green turtles Chelonia mydas in the Yaeyama Islands, Japan. Endanger Species Res. 14, 141–148. doi: 10.3354/esr00355
Nishizawa H., Joseph J., Chong Y. K. (2016). Spatio-temporal patterns of mitochondrial DNA variation in hawksbill turtles (Eretmochelys imbricata) in Southeast Asia. J. Exp. Mar. Biol. Ecol. 474, 164–170. doi: 10.1016/j.jembe.2015.10.015
Nishizawa H., Naito Y., Suganuma H., Abe O., Okuyama J., Hirate K., et al. (2013). Composition of green turtle feeding aggregations along the Japanese archipelago: implications for changes in composition with current flow. Mar. Biol. 160, 2671–2685. doi: 10.1007/s00227-013-2261-1
Nishizawa H., Narazaki T., Fukuoka T., Sato K., Hamabata T., Kinoshita M., et al. (2014). Juvenile green turtles on the northern edge of their range: mtDNA evidence of long-distance westward dispersals in the northern Pacific Ocean. Endanger Species Res. 24, 171–179. doi: 10.3354/esr00592
Nishizawa H., Okuyama J., Abe O., Kobayashi M., Arai N. (2012). Mitochondrial DNA variation in hawksbill turtles (Eretmochelys imbricata) nesting on Ishigaki island, Japan. Mar. Turtle Newslett. 132, 1–2.
Nishizawa H., Okuyama J., Kobayashi M., Abe O., Arai N. (2010). Comparative phylogeny and historical perspectives on population genetics of the Pacific hawksbill (Eretmochelys imbricata) and green turtles (Chelonia mydas), inferred from feeding populations in the Yaeyama Islands, Japan. Zool. Sci. 27, 14–18. doi: 10.2108/zsj.27.14
Norman J. A., Moritz C., Limpus C. J. (1994). Mitochondrial DNA control region polymorphisms: genetic markers for ecological studies of marine turtles. Mol. Ecol. 3, 363–373. doi: 10.1111/j.1365-294X.1994.tb00076.x
Okayama T., Diaz-Fernandez R., Baba Y., Halim M., Abe O., Azeno N., et al. (1999). Genetic diversity of the hawksbill turtle in the Indo-Pacific and Caribbean regions. Chelonian Conserv. Biol. 3, 362–367.
Okuyama J., Ishii H., Tanizaki S., Suzuki T., Abe O., Nishizawa H., et al. (2020). Quarter-century, (1993–2018) nesting trends in the peripheral populations of three sea turtle species at Ishigakijima Island, Japan. Chelonian Conserv. Biol. 19, 101–110. doi: 10.2744/CCB-1428.1
Pella J., Masuda M. (2001). Bayesian methods for analysis of stock mixtures from genetic characters. Fish. Bullet. Natl. Mar. Fish. Service/NOAA: Seattle 99, 151–167.
Seminoff J. A. (2004) The IUCN Red List of Threatened Species 2004. Available online at: https://dx.doi.org/10.2305/IUCN.UK.2004.RLTS.T4615A11037468.en (Accessed September 27, 2023).
Seminoff J. A., Allen C. D., Balazs G. H., Dutton P. H., Eguchi T., Haas H. L., et al. (2015). Status review of the green turtle (Chelonia mydas) under the Endangered Species Act. NOAA Tech. Memorandum NOAANMFS-SWFSC-539, 571.
Tamura K., Nei M. (1993). Estimation of the number of nucleotide substitutions in the control region of mitochondrial DNA in humans and chimpanzees. Mol. Biol. Evol. 10, 512–526. doi: 10.1093/oxfordjournals.molbev.a040023
Vargas S. M., Jensen M. P., Ho S. Y. W., Mobaraki A., Broderick D., Mortimer J. A., et al. (2016). Phylogeography, genetic diversity, and management units of hawksbill turtles in the indo-pacific. J. Hered. 107, 199–213. doi: 10.1093/jhered/esv091
Keywords: Chelonia mydas, Eretmochelys imbricata, mitochondrial DNA, haplotype, Japan
Citation: Hamabata T, Kameda K, Hayashi R, Okuyama J, Kawazu I and Nishizawa H (2024) Latest and comprehensive mitochondrial DNA haplotype data on green and hawksbill turtles collected in their habitats in Japan. Front. Mar. Sci. 11:1328101. doi: 10.3389/fmars.2024.1328101
Received: 26 October 2023; Accepted: 18 March 2024;
Published: 28 March 2024.
Edited by:
Robson G. Santos, Federal University of Alagoas, BrazilReviewed by:
Carlos Carreras, University of Barcelona, SpainSarah Vargas, Federal University of Espirito Santo, Brazil
Copyright © 2024 Hamabata, Kameda, Hayashi, Okuyama, Kawazu and Nishizawa. This is an open-access article distributed under the terms of the Creative Commons Attribution License (CC BY). The use, distribution or reproduction in other forums is permitted, provided the original author(s) and the copyright owner(s) are credited and that the original publication in this journal is cited, in accordance with accepted academic practice. No use, distribution or reproduction is permitted which does not comply with these terms.
*Correspondence: Tomoko Hamabata, dG1rLmhhbWFiYXRhQGdtYWlsLmNvbQ==; Hideaki Nishizawa, bmlzaGl6YXdhLmhpZGVha2kuNnNAa3lvdG8tdS5hYy5qcA==
†Present address: Junichi Okuyama, Fisheries Technology Institute, Japan Fisheries Research and Education Agency, Ishigaki, Okinawa, Japan
‡These authors have contributed equally to this work