 Yan Li
 Zongnan Wu
 Liang Sun
 Jiafei Yue2
- 1Beibu Gulf Ocean Development Research Center, Beibu Gulf University, Qinzhou, Guangxi, China
- 2School of Economics and Management, Beibu Gulf University, Qinzhou, Guangxi, China
Under the low-carbon background, 37 ports of countries along the South China Sea with capacity ranking in the world’s top 100 container ports are selected as the research object to establish a shipping network, construct a directed dichotomous shipping network, and divide the port tiers after finding the kernel number by using kernel analysis method, respectively, to explore the relationship between tiers and the relationship between ports at the higher level, and then make clear the direction of the improvement for the reduction of carbon emissions. The results show that: the routes sent between container ports in countries along the South China Sea have formed a more stable connection, but the receiving routes are still in a passive position, and the port call relationship is affected by the port hierarchy. High-level ports such as Shanghai Port and Singapore Port undertake the transshipment function of cargo concentration and redistribution within the network. The small-world characteristics among ports such as Singapore Port, Ningbo Port, Haiphong Port, Shenzhen Port, Guangzhou Port, and Linchaban Port are obvious. Based on the results of the empirical analysis, corresponding suggestions are put forward to optimize the structure of the container port system in the countries along the South China Sea and promote the low-carbon development of the sea.
1 Introduction
Global warming has triggered a series of serious consequences, such as rising sea levels, frequent meteorological disasters, reduced biodiversity, and food crises, and is one of the major challenges facing the international community today. The increase in atmospheric carbon dioxide concentration is the key to global warming (AK-BHD, 2021). In 2020, Xi Jinping, President of the People’s Republic of China, proposed at the 75th session of the United Nations General Assembly that “China’s carbon dioxide emissions will strive to peak by 2030, and to achieve the ‘dual-carbon’ goal of carbon neutrality by 2060”.2022 On 26 October 2021, the World Meteorological Organization (WMO) released the Global Greenhouse Gas Bulletin 2021, which showed that the global atmospheric concentration of carbon dioxide reached (415.7 ± 0.2) ppm, indicating that the global average concentration of carbon dioxide in the atmosphere has risen to the highest level in the past 800,000 years (Tarasova et al., 2023). Reducing the concentration of carbon dioxide in the atmosphere and implementing active carbon dioxide emission reduction measures are of great significance in mitigating climate change, protecting the environment, promoting sustainable development, and fostering international cooperation.
The oceans are an important part of the Earth, and they play a key role in low-carbon development; the rational use of marine resources, the protection of marine ecosystems, and the development of low-carbon technologies can promote a global low-carbon transition, mitigate climate change and achieve sustainable development. The South China Sea, with an area of about 3.5 million square kilometers, is located in the western part of the Pacific Ocean and is the largest sea area in the Asia-Pacific region. As one of the richest areas in the world in terms of marine biodiversity and blue carbon resources, the South China Sea plays an important role in the global ocean carbon cycle. The neighboring countries in the South China Sea are rich in blue carbon resources, and with the rapid increase in the number of ships sailing in the South China Sea, the development and use of blue carbon resources in the South China Sea has brought development opportunities to the neighboring countries but also caused serious damage to the ecological environment. The South China Sea is an important part of the global ecosystem, affecting the climate of the global region. Shipping is a more polluting mode of transport, and a large number of ships sailing in the South China Sea for a long period definitely damage the ecological environment of the South China Sea and also lead to the substantial decline of mangrove forests, salt marshes and seagrass beds and other blue carbon resources, which reduces the capacity of the South China Sea for carbon sequestration and storage and is not conducive to the development of the marine ecology in a green and low-carbon manner.
The IMO’s 4th International Report on Greenhouse Gas Emissions from Maritime Transport shows that the maritime industry emitted 1,076 Mt of greenhouse gases in 2018, accounting for about 2.9 percent of total annual global anthropogenic greenhouse gas emissions and 11 percent of total transport emissions, an increase of 9.6 percent from 2012 (Wang et al., 2023). 《International Maritime Organization preliminary strategy for reducing greenhouse gas emissions from ships》 A clear proposal to reduce the carbon intensity of the shipping industry by 40 percent by 2023 and 70 percent by 2050, with a 50 percent reduction in total carbon emissions, using 2008 as a baseline (Tzeng et al., 2023). Ports, as the starting point and focus of shipping routes, are important hubs in the system of material flow between countries along the South China Sea, Creating a “low carbon” port is conducive to the protection of the marine ecosystem and the achievement of the goal of carbon neutrality.
Along with the rapid development of the shipping industry, air pollution has also risen sharply as a result, posing a huge challenge to maritime management (Shu et al., 2023), In the process of “low-carbon” port construction, “high consumption, high emissions, and high pollution” have become the main problems in building a new type of low-energy port (Xu and Ma, 2013). The low-carbon and green development of the port logistics industry has become an irreversible trend. Countries are actively using 5G, big data, and other cutting-edge technologies to comprehensively promote the digital transformation of port logistics and create first-class green and intelligent port logistics (Wu, 2021). The application of modern logistics management information technology, not only can greatly improve the efficiency of logistics and transport, and reduce unnecessary carbon emissions and unnecessary expenditure costs (Wang, 2022), It is also possible to set up a port emission management system to accurately collect various information on port emissions at the lowest cost and provide the logistics industry with favorable decisions on energy saving, emission reduction, transformation, and upgrading (Qin, 2014). Setting sulphur limits in Emission Control Areas (ECAs) is an important step in marine environmental governance at the international regulatory level. By using an integrated control approach to quantify the overall and structural impacts of the two rounds of ECA policies on SOX concentrations, in the case of China, for example, the first round of ECA policy limits on the sulphur content of bunker fuels effectively reduced sulphur concentrations in the Bohai Rim and Yangtze River Basin, but did not have a significant impact on the Pearl River Delta (PRD), and the implementation of the second round of ECA policies only had an effective impact on the Bohai Sea region. The first round of Emission Control Area (ECA) policies was more effective than the second round, as further favorable effects of the ECA policies were offset by a significant increase in ship activity in China’s coastal ports (Xu et al., 2024c). The implementation of ECAs has had a positive impact on shipbuilding orders for eco-designed ships, with a significant increase in shipbuilding orders for eco-designed ships from China, the Netherlands, South Korea and the United Kingdom. governments have considered issuing guidance on supply guarantees and joint supervision of low-sulfur fuel oil, promoting the coordination and linkage mechanism of LNG clean-energy applications as a strengthening of the infrastructure construction of shore-to-ship power. Expanding the scope of emission-control areas has motivated shipping companies to increase the orders of eco-designed ships, which is lower than the long-term investment of desulfurization transformation (Xu et al., 2024b). Important research significance for promoting the green development of the shipping and logistics industry, promoting energy saving and emission reduction of ships, minimizing the negative impact of shipping on the ecological environment of the South China Sea, and optimizing port carbon emissions (Yang, 2013).
Current research on port carbon emissions focuses on the measurement and optimization of carbon emissions and the application of green and low-carbon technologies. In the monitoring of ship traffic emissions, the use of the ship traffic emission assessment model can calculate the emission intensity of CO2, NOX, CO, PM2.5 and SO2, and find the fluctuation pattern of carbon emissions from ships under different modes of operation (Shu et al., 2023); The construction of a comprehensive and scientific marine pollution public opinion monitoring and measurement scale can provide a public opinion monitoring tool for marine pollution, reduce the occurrence of public trust crisis, and also help to create a stable and harmonious marine low-carbon environment (Chen et al., 2023). Introducing the data of 19 coastal countries of the EU, constructing the spatial weight matrix and Durbin model, the analysis results show that the carbon emissions from shipping trade of the coastal countries of the EU have positive spatial correlation and agglomeration with the global carbon emissions, and the drivers of the carbon emissions from international shipping not only affect the domestic region, but also produce spillover effects, both in the short term and long term, the spatial spillover effect of the drivers still exists, of which the short-term spillover effect is more obvious (Xu et al., 2024a). In research on the application of green and low-carbon technologies. International port emission reduction technologies are mainly focused on shore power, new energy equipment, and automation systems (Anas et al., 2022). The adoption of shore power technology in US ports has brought huge economic and environmental benefits (Parth et al., 2016). The use of shore power by ships in Hong Kong can effectively reduce fuel consumption when the ships are docked, thus effectively reducing carbon emissions (Huang et al., 2023). Development of an intelligent control system for fully automated container terminals, optimization of yard space allocation, etc. to speed up the green and low-carbon development of ports (Yu et al., 2023).
Looking back at the area of port carbon research, although ports have been included in the carbon emissions trading pilot for many years (Meng, 2014), However, there have been relatively few studies on optimizing shipping networks to reduce carbon emissions. Shipping network optimization usually involves the optimization of networks, fleets, and flight routes (Zhen et al., 2020a), The container port system level is also an important element of the optimization of the shipping network, to improve energy efficiency from the deployment of capacity, and thus achieve energy saving and emission reduction (Yang et al., 2021). The construction of an international green shipping logistics network mainly focuses on the construction of alternative fuel supply facilities networks and the exploration of low-carbon routes (Zhen et al., 2020b). Predicting the flow of people in various areas of port cities is of strategic importance for shipping networks and public safety (Xiao et al., 2023). A clear picture of the structure of the shipping network can help monitor the carbon footprint of shipping activities, provide data to support the assessment of mitigation measures, and help governments and international organizations formulate effective policies. Understanding the critical nodes and pathways of the shipping network can guide the deployment and use of new technologies (e.g., cleaner energy ships) to achieve green upgrading of ports and shipping networks (Wang and Li, 2022). Therefore, the establishment of an efficient container port system and the construction of a perfect container transport network is conducive to giving full play to the radiation effect of hub ports, reducing the pollution caused by port transport operations while shortening the voyage, maintaining the ecological balance of the South China Sea region and realizing “low-carbon water transport”.
In the study of the defining relationship of the container port system, the container port system hierarchy has gradually been established as five different stages of development, i.e. the pre-containerization stage, the initial development stage, the diffusion stage, the consolidation and concentration stage, the central hub port stage and the peripheral challenge stage of the five-stage model (Yehuda, 1981), Later scholars proposed a six-stage evolutionary model through a five-stage model, combined with the emergence of offshore transshipment ports (Theo and Jean-Paul, 2005). Regarding the delineation of the shipping pattern, the first step is the identification of the main nodes and the delineation of the hierarchy. Social network analysis can be introduced to identify the functional nodes in the shipping network based on shipping relationships (Wang et al., 2018); Cluster analysis can also be used to classify the top 20 international container shipping hubs by tiers of comprehensive indicators (Chen et al., 2020). The shipping system can be abstracted as a network of ports and routes (Tian et al., 2007), Designing a scientific approach to the identification of strategic shipping pivots, which can be identified globally (Wang and Chen, 2017); The spatial pattern of China’s shipping network with countries along the “Sea Silk Road” is a typical example of the identification of strategic pivot points for shipping (Wang and Zhu, 2017). In addition, the topology and spatial structure of the container network can be analyzed with the help of the method of evaluating indicators of overall network structure and node centrality (Wang and Zhu, 2017), the method of social network analysis (Qiu et al., 2021), and the method of multiple chaining analysis (Kevin and Wang, 2012).
Regarding the research on the hierarchical characteristics of shipping networks, scholars have used relatively diverse methods, such as using cluster analysis to hierarchically classify China’s Arctic route ports (Li et al., 2015); using complex network models to analyze the spatial connections and regional differences in the shipping networks of China’s container ports (Guo et al., 2018); and applying indicators related to the social network analysis methodology to analyze the changes in port throughput share within China’s Guangdong, Hong Kong and Macao Greater Bay Area port cluster, changes in the internal structure of the port cluster, and the participation of the Bay Area port cluster in the shipping network pattern of the eight global regions (Wang et al., 2022); and a comparative analysis of the results of the research on shipping network tiers using a topological feature-driven vulnerability model (Wu et al., 2019). Globally, the world shipping centers based on the value links of shipping enterprises present complex network relationships among each other, and the world shipping city network possesses small-world characteristics (Lv and Zhang, 2012); from the perspective of the global container liner shipping network, port connectivity will have a global impact on the overall network (Jiang et al., 2015). The global liner shipping network will affect global trade and logistics development, and global trade and logistics changes have important impacts on port hierarchies (Ducruet and Notteboom, 2012). In addition, the shipping industry needs to assess the additional risks posed by the epidemic, prepare for uncertain events such as geopolitical changes, reduce maritime supply chain costs, improve transport efficiency and promote low-carbon development in the shipping industry (Xu et al., 2022).
In summary, the South China Sea is one of the richest areas in the world in terms of marine biodiversity and blue carbon resources, so it is very important to protect the ecological environment of the South China Sea, promote the low-carbon development of ports, and optimize the hierarchical structure of the container port system in countries along the South China Sea. The current research on low carbon development of ports by scholars at home and abroad mainly focuses on how to make ports into digital and automated ports as well as fine measurement and detection of carbon emissions, etc., while the research on optimizing the shipping network and reducing carbon emissions is still relatively small, and the hierarchy of the container port system is the key to optimizing the shipping network. In the research of container port systems defining relationship and shipping network hierarchical characteristics, the topological analysis focuses on the structural characteristics of the network, but cannot fully consider the dynamic characteristics and diversity of the actual shipping network; graph theoretical methods can effectively carry out path analysis, connectivity analysis, and the assessment of network flow and network stability, but ignores the actual situation of the network flow and the time dependence; the complex network analysis can be effectively carried out via the Complex network analysis can effectively identify the key characteristics of the network through the concepts of small-world network and scale-free network, but the theoretical model is not fully applicable to the actual shipping network; it can be seen that there is still room for development in the existing research. In this paper, the analysis method based on the network topology in the low-carbon context adopts the k-core analysis method, which is highly data-driven and has a high degree of adaptability to the complex port system and can more accurately identify the key links and dependencies between ports in the context of common carbon emission reduction, and classify them through their hierarchical levels in the network, identify the core ports and edge ports, and systematically delineate the port system hierarchy, thereby further optimizing route design and reducing carbon emissions by reducing unnecessary sailing distances. An accurate shipping network structure can help monitor the carbon footprint of shipping activities, improve energy efficiency, provide data support for the evaluation of emission reduction measures, and help governments and international organizations formulate effective policies, such as carbon emission quotas for shipping companies and regulations on the use of low-carbon fuels.
2 Materials and methods
2.1 Study area and data sources
There are a total of nine countries along the South China Sea, namely China, the Philippines, Malaysia, Brunei, Indonesia, Singapore, Thailand, Cambodia and Vietnam, and this paper selects the ports in the countries along the South China Sea whose capacity is ranked in the top 100 containers in the world as the main research object, and there are no ports ranked in the top 100 container ports in the world in Brunei and Cambodia, so this paper selects seven countries along the South China Sea, namely China, the Philippines, Malaysia, Indonesia, Singapore, Thailand and Vietnam, as the main research area. There are 37 ports with capacity ranked in the top 100 container ports in the world, so this paper selects 37 container ports along the South China Sea as the research object, including 27 ports in China, such as Shanghai Port, Ningbo Port, Qingdao Port, and 10 ports in Singapore, Malaysia, Indonesia, Vietnam, Thailand, and the Philippines, as shown in Table 1.

Table 1 List of container ports in countries along the South China Sea.
In terms of data sources, this paper obtains the top 100 container ports in terms of capacity from the official website of Lloud’s List (Lloyd’s List https://lloydslist.maritimeintelligence.informa.com ) and extracts the routes of the world’s top seven shipping lines in terms of throughput and 80% of the total capacity from Alphaliner (https://public.alphaliner.com) to construct the shipping network.
2.2 Research methodology
2.2.1 K-core methods
In this paper, after the statistics of the route distribution of the top 7 liner companies in global throughput, it is stipulated that if any liner company has a direct route between any two ports, the connection between these two ports will be established and recorded as 1, otherwise, no connection will be established. In this way, with 37 ports as nodes and the connection between ports as edges, a directed dichotomous shipping network of container port system of the countries along the South China Sea is established, in which the directed dichotomous network refers to determining the direction of the edges of the network based on the cargo flow of the ports (directionality), and setting the nodes of the network as the receiving and sending ports (dichotomousness), respectively. By constructing the shipping network, the k-core analysis method in complex network analysis is used to quantitatively study the connection strength and hierarchical structure among ports.
The main research process of this paper is as follows: firstly, the length of the shortest path from the starting node to the node, i.e. the node depth, is evaluated for each port (i.e. node in the network). Next, a shipping network is constructed based on inter-port connectivity relationships, and node depth, network aggregation coefficient, node centrality, and network proximity centrality potential are evaluated for the ports themselves, which are the network metrics to delineate the port network hierarchies and explore the inter-hierarchical network structure. Finally, on this basis, the ports at the level of a core circle within the port network are extracted. The specific research methodology flow is shown in Figure 1.
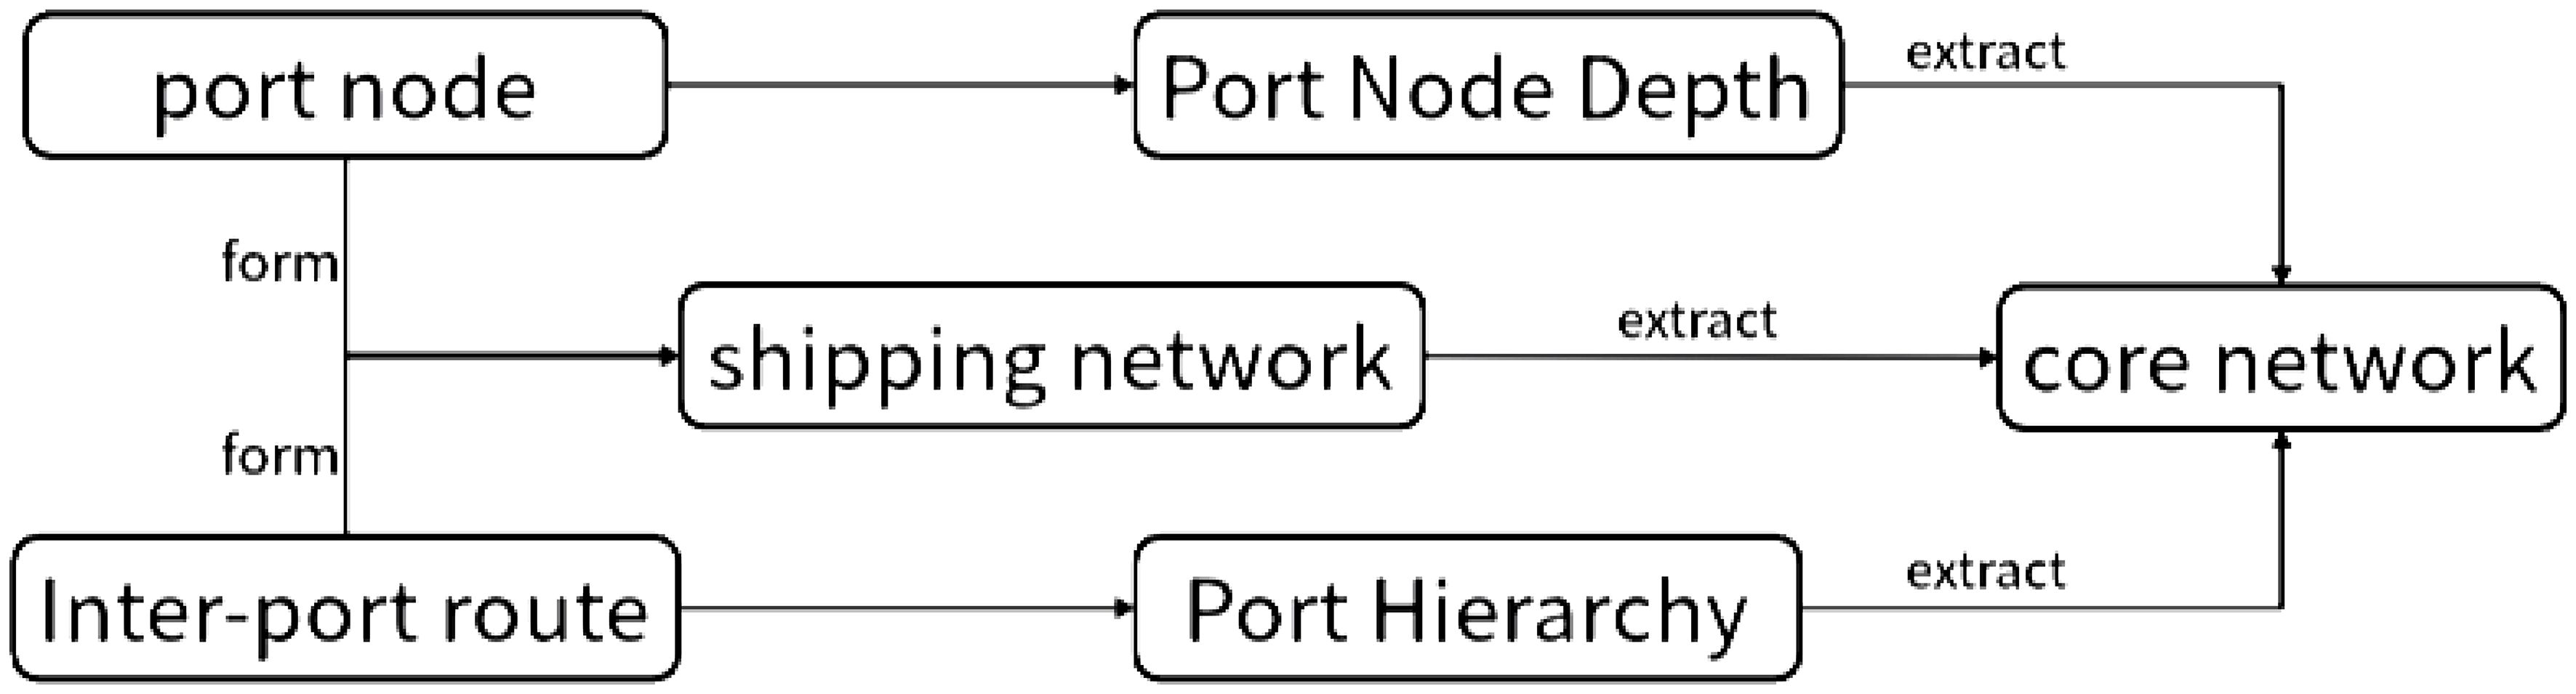
Figure 1 K-core technology flow chart.
2.2.1.1 K-core resolution
A subgraph is said to be k-core if there exists a subgraph in the network such that all of its nodes have degree values of at least k and all are directly connected to other nodes in that subgraph. Repeatedly removing the nodes with degree values less than k and their neighboring edges, all nodes in the resulting remaining network have degree values greater than or equal to k. The inner structure is called k-core, and the process is called k-core parsing. The process is called k-core parsing. There are three forms of parsing: (1) Ignore the directionality of the edges and treat the directed graph as an undirected graph. (2) Consider only the in-degree and do the in-degree resolution. (3) Consider only the out-degree and do the out-degree resolution.
2.2.1.2 k-core node depth
The k-core node depth of a port is a metric used to measure the importance and connectivity of a port in a network. In this paper, the k-core node depth is used to measure the degree of centrality or criticality of a port in the shipping network. The formula is shown in the following equation (1).
The set represents the neighbors of node , while represents the value of the node. This index is referenced in the present study to specifically assess the correlation between low-level ports and other high-level ports, as well as to ascertain whether the port in question is an adjacent port to a core-level port.
2.2.1.3 Network aggregation coefficient
In shipping network studies, the network aggregation factor is used to measure the degree of connectivity between nodes in a shipping network. In this paper, it is used to analyze the degree of connection and interconnection between ports. A high network aggregation coefficient indicates that ports are more closely connected with more direct routes or common transshipment nodes, while a low network aggregation coefficient indicates that ports are relatively less connected or more dispersed, as shown in Equation (2) below.
In the given context, represents the total number of nodes in a network. denotes the number of neighboring nodes connected to a specific node, referred to as . Additionally, represents the count of ties or connections between these nodes. In the present study, the concept of the aggregation coefficient of a single node is utilized to quantify the proportion of connections between neighboring nodes about the maximum potential number of connections. Furthermore, the average aggregation coefficient of all nodes within the network is employed to determine the overall aggregation coefficient of the network.
2.2.1.4 Average shortest path length
The average shortest path length is often used to measure the average degree of distance or connectivity between nodes in a network. It is used in shipping network studies to characterize the average efficiency of traffic, logistics, or information transfer between ports, reflecting the overall efficiency and connectivity of the network. A larger average shortest path length means that the distance between nodes is longer, and information or cargo transmission may require more transshipment ports for transshipment. The formula is shown in Equation (3) below.
refers to the shortest distance between nodes and . The distance between a single node and refers to the number of edges on the shortest path connecting the two nodes, and the average distance between any two nodes is the average shortest path length of the network. The flat-angle average shortest path length is cited in this study to portray the small-world characteristics of the port system.
2.2.1.5 Absolute centrality of nodes
Absolute centrality is a measure of the importance of a node in a network. In shipping network studies, absolute centrality can be used to identify those ports or routes that are most connected to other nodes. These ports or routes may play a key role in the transport of goods and are therefore critical to the stability and efficiency of the network. The study of absolute centrality can help decision-makers to better understand the position of the nodes in the network to optimize shipping routes and resource allocation. The formula is shown in Equation (4) below, and the absolute centrality of a node is used in this paper to represent the degree of connectivity centrality.
In shipping network research, proximity centroid potential can be used to identify nodes that have better connectivity and accessibility in the network. These nodes may have a critical role in emergencies or the transportation of goods, and the proximity-centered potential is a measure of the proximity of nodes to other nodes in the network. This metric is used in this study to assess the resilience and immunity of the network as well as to plan effective emergency response strategies. The expression for the proximity center potential of the network is shown in Equation (5) below.
where refers to the maximum value of the absolute proximity centrality of the nodes in the network.
2.2.2 Parsing process
In the process of complex network hierarchy analysis, k-core is a common analysis method. If there is a subgraph in the network, in which all nodes are connected to at least k other nodes, the node degree in the subgraph is said to be k. The subgraph is a k-core, and the size of the k-core is determined by the number of nodes. By repeatedly removing nodes less than k and their neighboring edges, a port network with all nodes of degree k and above can be obtained, and the deepest node k-core of a node is expressed by the number of node k-core, and the maximum value is the number of k-core of this network.
The whole analysis process can be divided into three types. First, the data were not processed in a targeted manner; second, only in-degree analyses were performed; and third, only out-degree analyses were performed. In this paper, we innovatively analyze the port network hierarchy by combining the entry degree and exit degree analysis, extract the core port circles, then repeatedly remove the ports individually, and later analyze the remaining port network to obtain the degree of influence of each port on the distance, aggregation and centrality of the port network. This method can be applied to port networks of different sizes and complexity. By adjusting the parameter k, different levels of core ports can be explored, making the method highly scalable.
3 Results and analyses
In this section, through the k-core analysis method in the complex network analysis method, firstly, we do an in-degree and out-degree analysis of the South China Sea container port shipping network and get the number of ports contained in each level of in-degree and out-degrees respectively. Then, the layered structure, k-core depth, and core structure of the South China Sea container port shipping network are analyzed to obtain the connection relationship between ports at each level of the in-degree and out-degree and the conclusion that the high-level ports have a small-world nature.
3.1 Results of k-core analysis of the container port system in the South China Sea
The container port system in the South China Sea, as described in this study, is a directed dichotomous network. It is analyzed using k-core in-degree resolution and k-core out-degree resolution. The findings are presented in Figures 2 and 3.
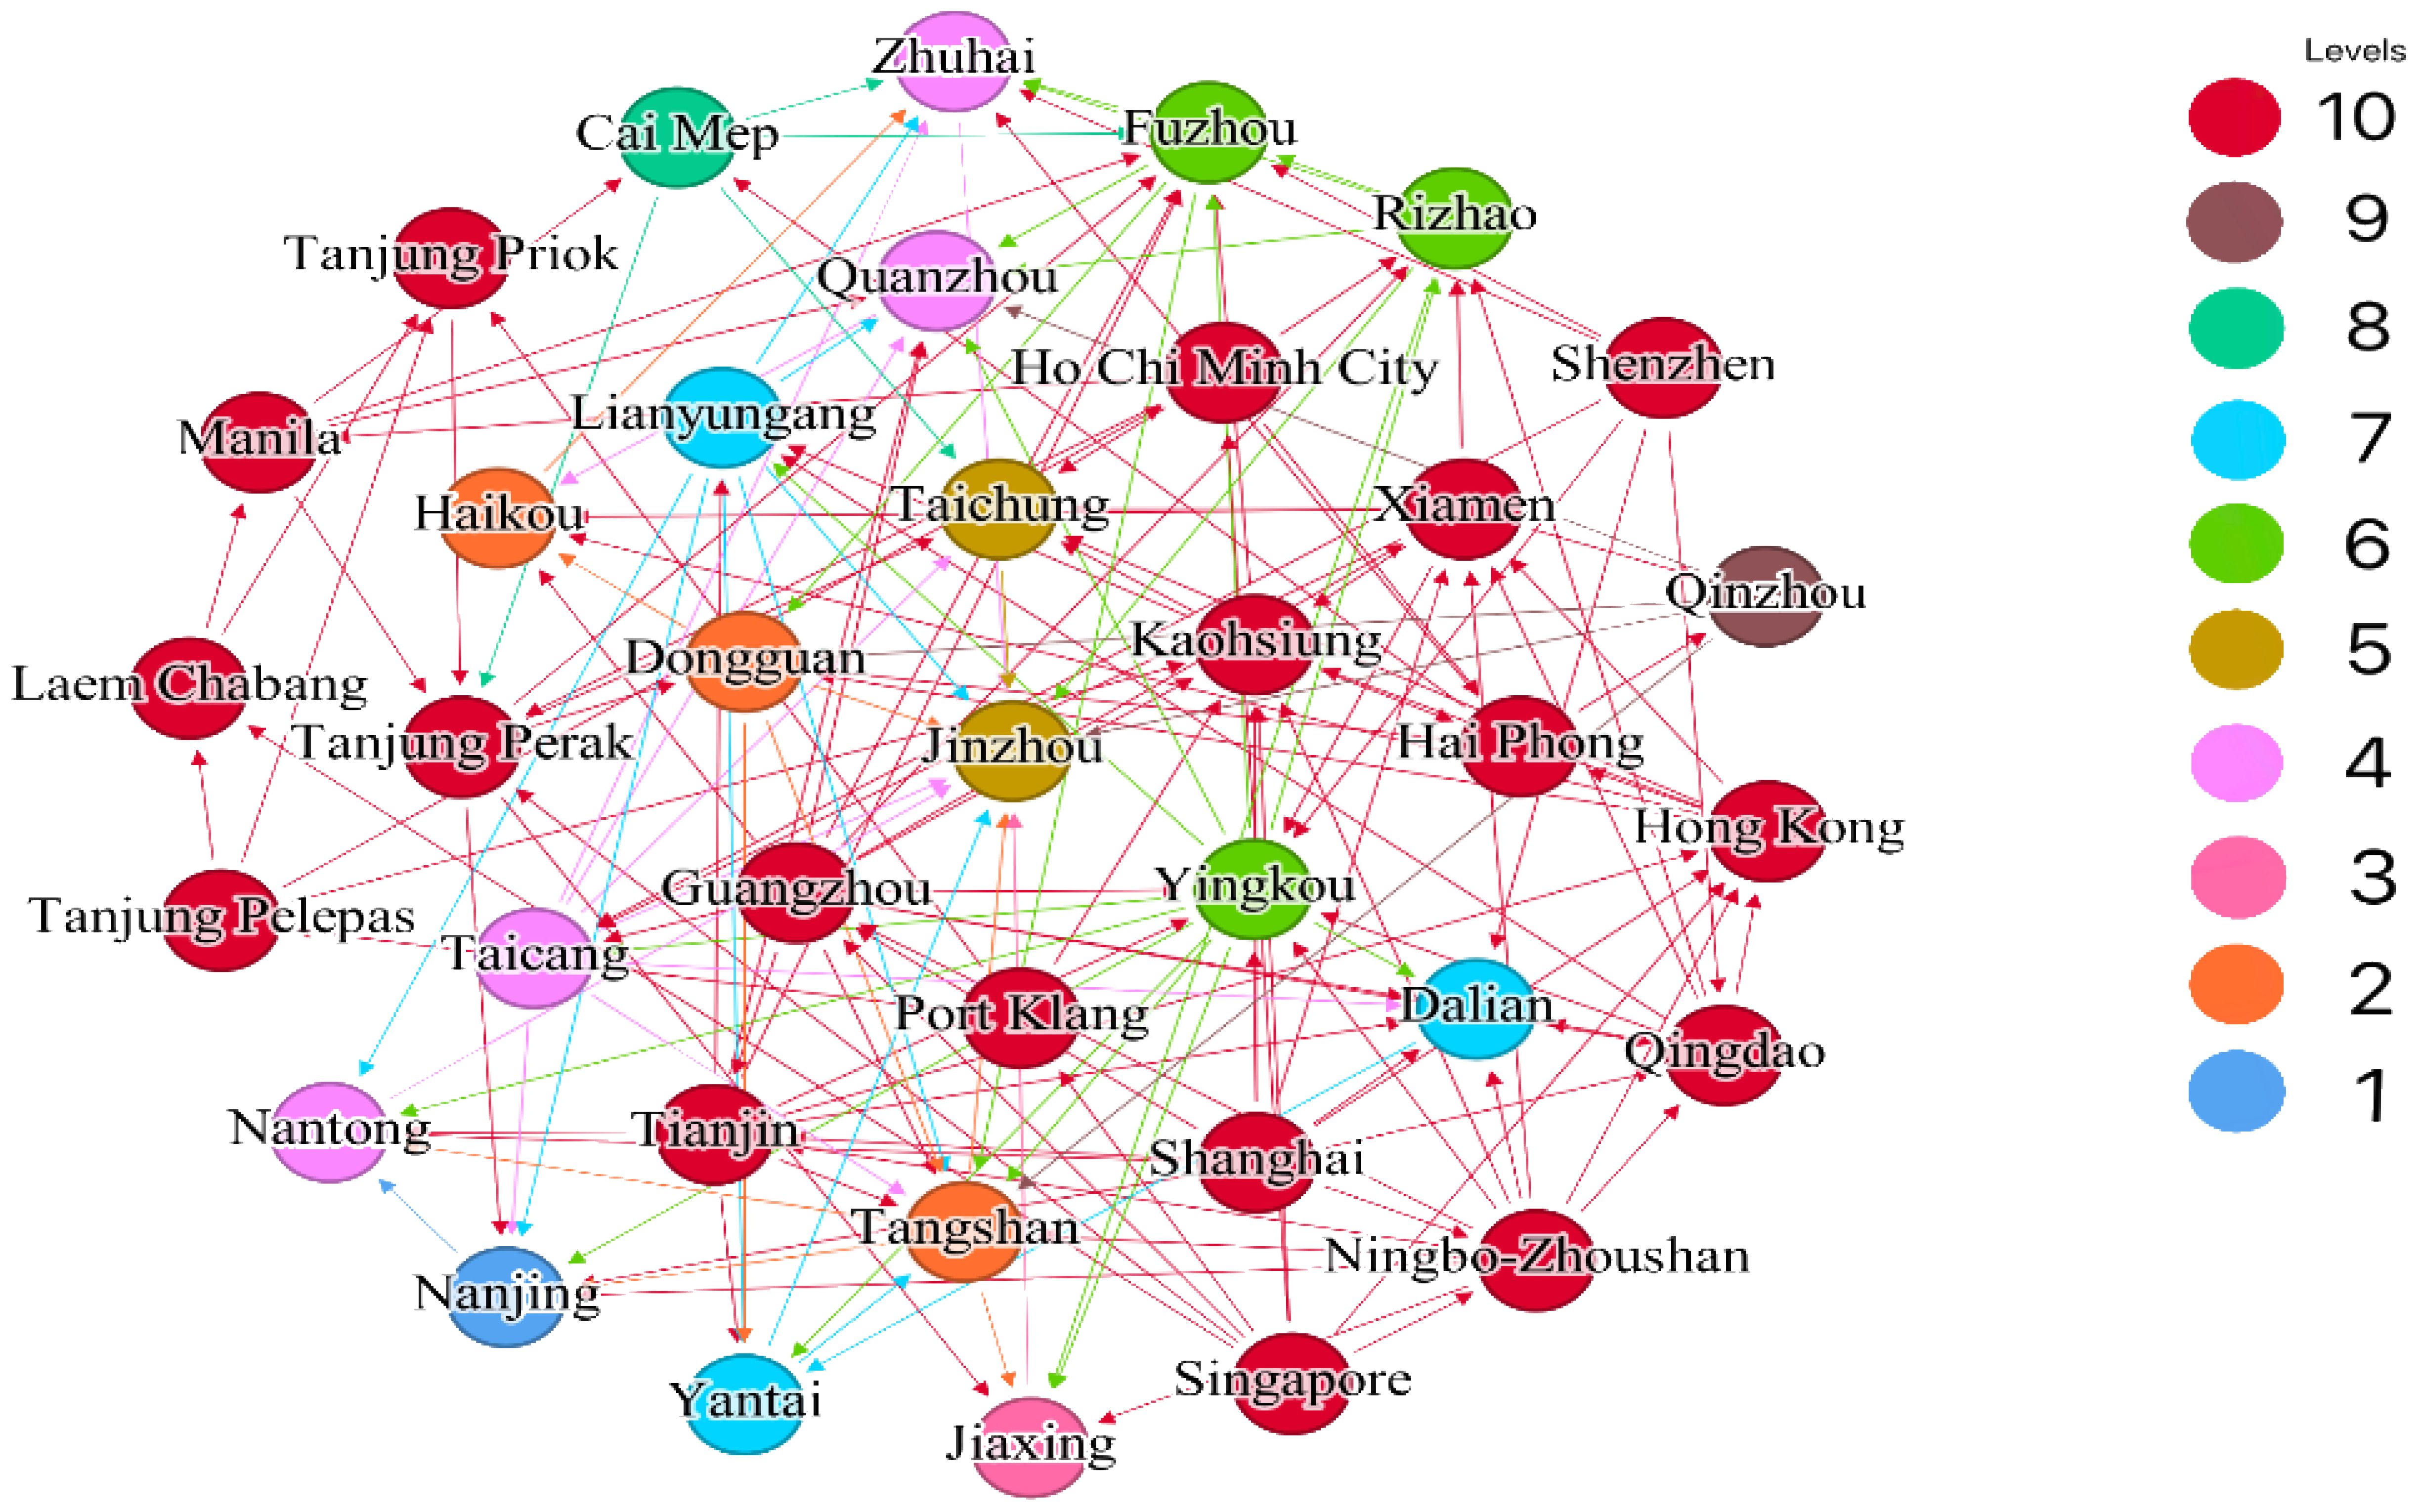
Figure 2 Distribution of kernels resolved by k-core out-degrees.
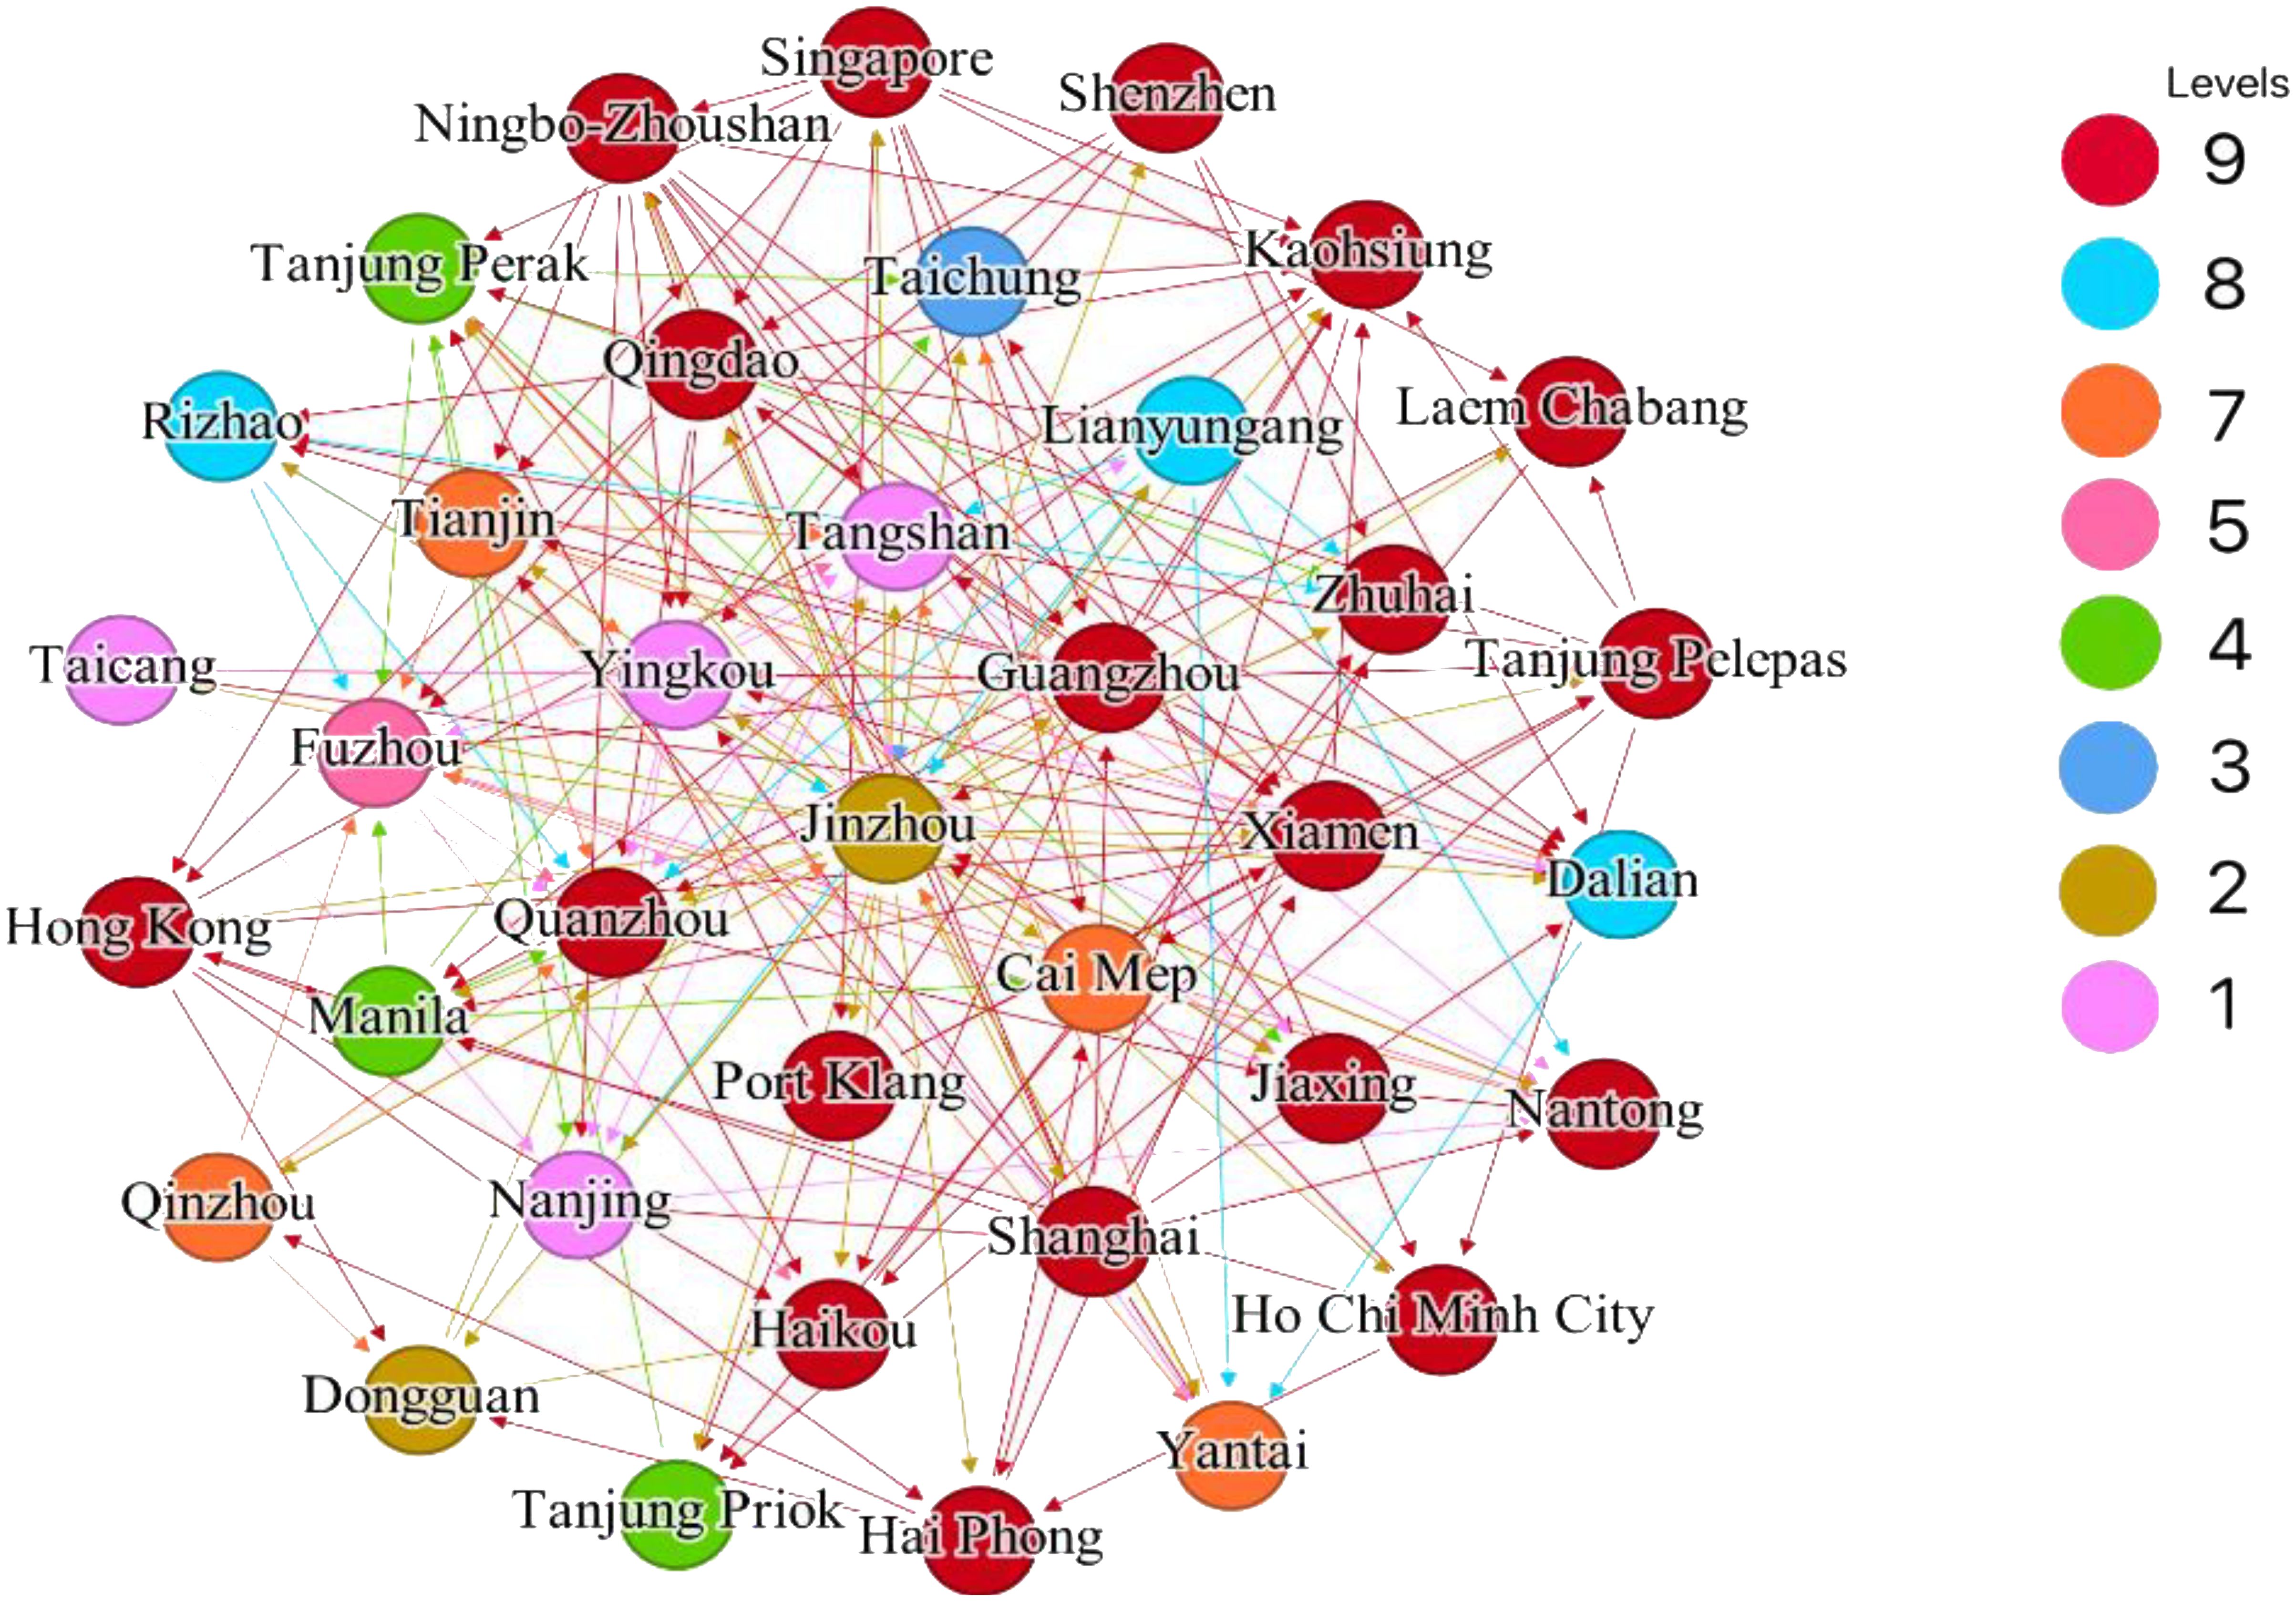
Figure 3 Distribution of kernels resolved by k-core in-degrees.
According to Figure 2 of the distribution of the core of the out-degree analysis, there are 18 ports with a core of 10, including the ports of Shanghai, Guangzhou, Shenzhen, and Tianjin; the port of Qinzhou with a core of 9; the port of Gaimei with a core of 8; three ports with a core of 7, including the ports of Dalian, Yantai, and Lianyungang; three ports with a core of 6, including the ports of Fuzhou, Rizhao, and Yingkou; two ports with a core of 5, namely, the ports of Jinzhou and Taichung; four ports with a core of 4, namely the ports of Taicang, Nantong, Quanzhou, and Zhuhai; three ports with a core of 3, namely, the port of Jiaxing; three ports with a core of 2, namely the ports of Tangshan, Haikou and Dongguan; and one core of 1, which is only the port of Nanjing.
According to Figure 3 of the core distribution of the incidence analysis, there are 14 ports with a core of 9, including Shanghai, Ho Chi Minh, and Qingdao; three ports with a core of 8, including Rizhao, Lianyungang and Dalian; four ports with a core of 7, including Tianjin, Yantai, Qinzhou and Cai Mep; one port with a core of 5, including Fuzhou; four ports with a core of 4, including Manila and Tanjung Pelepra; only Taichung; two ports with a core of 2, including Dongguan and Jinzhou; and four ports with a core of 1, namely, Nanjing, Tangshan, Yingkou and Taicang.
There are 9 k-core partitioning forms after the in-degree resolution, which are 0-k-core, 1-k-core, 2-k-core, 3-k-core, 4-k-core, 5-k-core, 7-k-core, 8-k-core, and 9-k-core (denoted as k0, k1, k2, k3, k4, k5, k7, k8, and k9 in that order), where k0 includes 37 ports, i.e., the initial South China Sea Container Port Network (hereafter referred to as the initial network). Similarly, there are 10 forms of k-core partitioning after out-degree resolution, denoted as k1, k2, k3, k4, k5, k6, k7, k8, k9, and k10, where k1 includes 37 ports, i.e., the initial network. Each K-nucleus network was examined in terms of the number of ports, number of links, density, and average respectively, and the results are shown in Table 2.
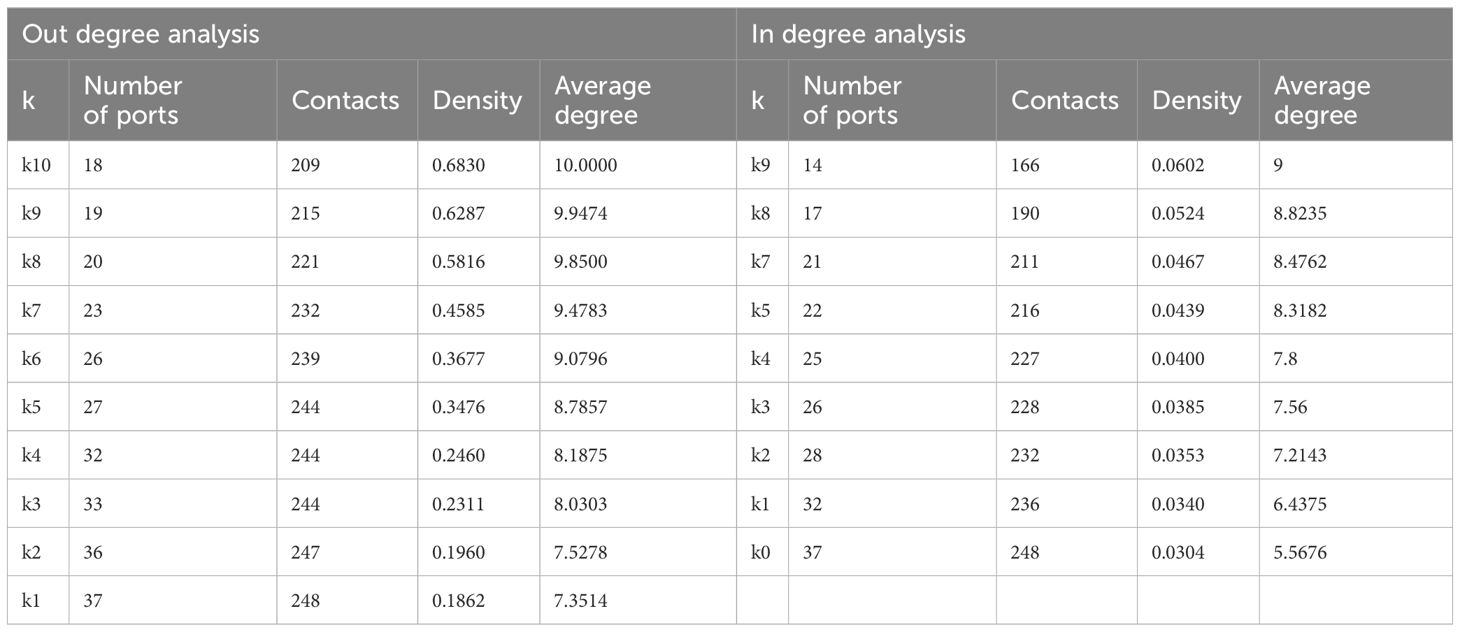
Table 2 Results for each parameter after k-core resolution.
According to the data in the table, with the increase of k value, the number of removed ports increases, the number of inter-port links increases, the density decreases, and the average degree increases. It can be seen that in the port network system along the South China Sea, with the k-core resolution gradually in-depth and constantly removed ports, the size of the port network gradually reduced from the initial 37 ports composed of the initial network system down to 18 ports composed of 10 k-core out of the degree of network and 14 ports composed of 9 k-core into the degree of network. Density describes the ratio of the number of actual connections between ports to the maximum number of reachable connections. In this process, the density of the out-degree network gradually increases from 0.1862 in the initial network to 0.6830 in the k10 network, and the density of the in-degree network gradually increases from 0.0304 in the initial network to 0.0602 in the k9 network, which shows that the direct connections between ports are constantly increasing and the port network is more closely connected. The average degree describes the average value of the degree of each port in the subgraph, in this process, the average degree of out-degree increased from 7.3514 to 10.0000, and the average degree of in-degree increased from 5.5676 to 9. After removing the weakly connected ports, the k-connectivity between ports in the subgraph has increased significantly. Among them. In terms of out-degree, the difference between k5 and k4 networks, k3 and k2 networks are more than 0.5, in terms of in-degree, the difference between k5 and k4 networks is also more than 0.5, and the subgraphs of each port on the core subgraphs of in-degree and out-degree are stratified, which can be seen that there is a gap in the ability of their connectivity.
3.2 Hierarchical analysis of container port system along the South China Sea
3.2.1 Hierarchical structural analysis
Based on the previous section, the nodes with degree values less than k and their k-core after forest edges are removed to do the hierarchical division. After repeatedly removing ports with degree value less than (k+1) in the network, the remaining ports form k levels, based on which, the out-degree parsing is divided into 10, 9, 8, 7, 6, 5, 4, 3, 2 and 1 levels, and the in-degree parsing is divided into 9, 8, 7, 5, 4, 3, 2 and 1 levels. The number of ports and the number of internal connections at each level are organized in the following Table 3.
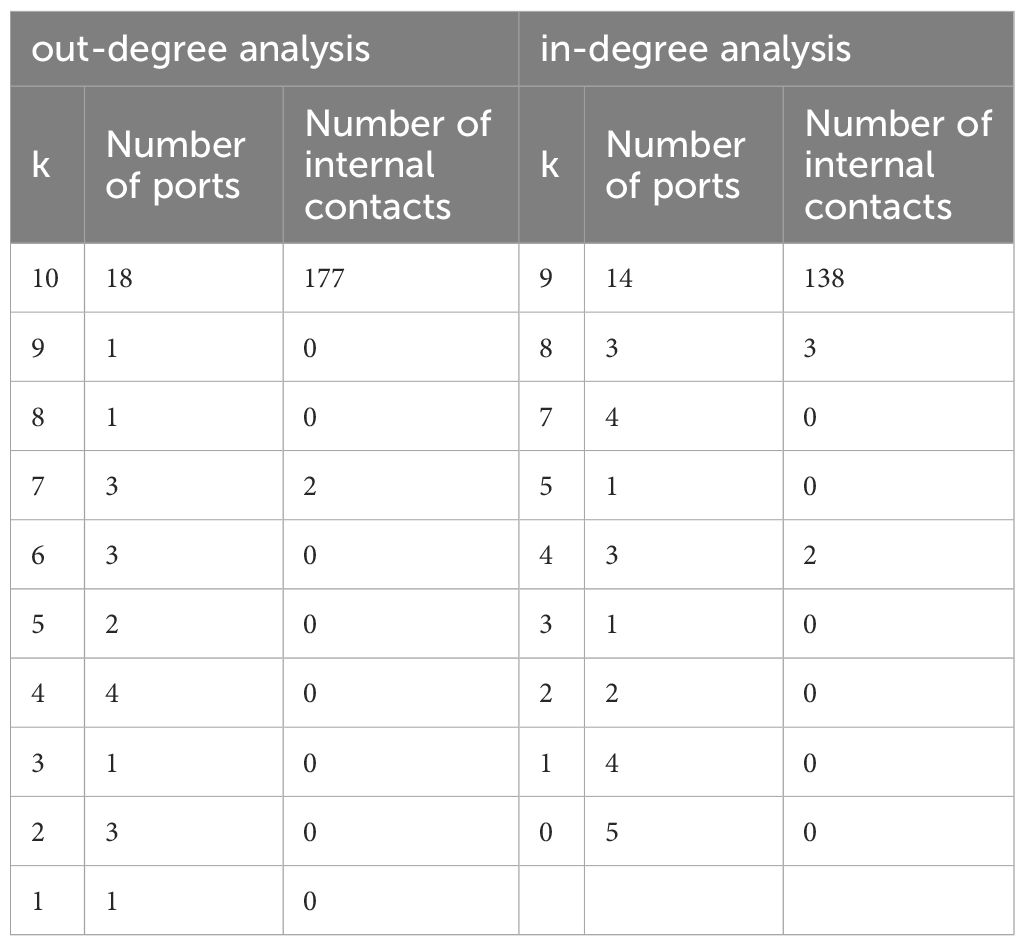
Table 3 Number of ports and internal connections at all levels.
By employing a hierarchical approach to categorize the dichotomous network, the port network in the South China Sea can be segmented into ten levels according to out-degrees and nine levels based on in-degrees. About the out-degree, the highest core level comprises 18 ports, accompanied by 177 internal direct links. The remaining levels consist of 4 ports or fewer, with 9, 8, 3, and 1 level(s) containing only 1 port. These levels possess loose internal links, and the number of links is essentially 0. In terms of in-degree, the core level exhibits the highest number of ports, totaling 14, with 138 direct links. The remaining levels, on the other hand, have 5 ports or fewer. Specifically, there are 5 levels with only 1 port and 3 levels with only 1 port. The remaining levels have a maximum of 5 ports, with 5 and 3 levels consisting of only 1 port each. These levels exhibit a loosely organized internal structure. Based on the aforementioned port hierarchy, the interconnections among the different levels are structured in the following manner.
In response to the analysis of out-degree (as shown in Table 4), which examines the number of connections from ports at one level to ports at other levels, it is evident that ports at level 10 exhibit higher accessibility. These ports have direct connections with ports at levels 9, 8, 7, 6, 5, 4, 2, and 1. Following this, the 7-level ports demonstrate a connectivity relationship with ports at the 6-level and 5-level, in addition to the 10-level ports. Similarly, the 6-level and 5-level ports also exhibit a connectivity relationship with the 7-level ports, in addition to the 10-level ports. On the contrary, the ports located in levels 9, 8, 2, and 1 establish direct connections exclusively with the ports in level 10, resulting in a total of six relationships. It is evident that, expect for level 10, the ports in level 7 are the most commonly used ports for cargo collection. Furthermore, ports in all levels tend to rely on level 7 ports for the transshipment of cargo. Additionally, ports in levels 6 and 5 also serve as important connectors between ports in all levels. In the accessibility analysis (Table 5), the examination of the number of connections between ports at different levels reveals that ports at level 9 exhibit exceptionally high accessibility. However, ports at level 0 are an exception, as they are connected to ports at all other levels. Notably, ports at levels 7 and 8 demonstrate the most significant performance in terms of connectivity, with 16 and 10 connections, respectively. The ports in level 4 exhibit a greater number of connections with ports in other levels, expect of 6 connections with ports in level 9. Additionally, there are connections with ports in levels 8, 7, and 2. It is worth noting that ports in level 0 do not establish connections with ports in other levels. The number of connections between ports in level 8 pointing to level 9 and ports in level 7 pointing to level 9 is significantly high, with 19 and 17 connections respectively. Additionally, there is a high number of direct connections. This indicates that the ports in level 9 exhibit a higher level of centralization. Furthermore, the majority of ports at this level are primarily used for cargo collection purposes.
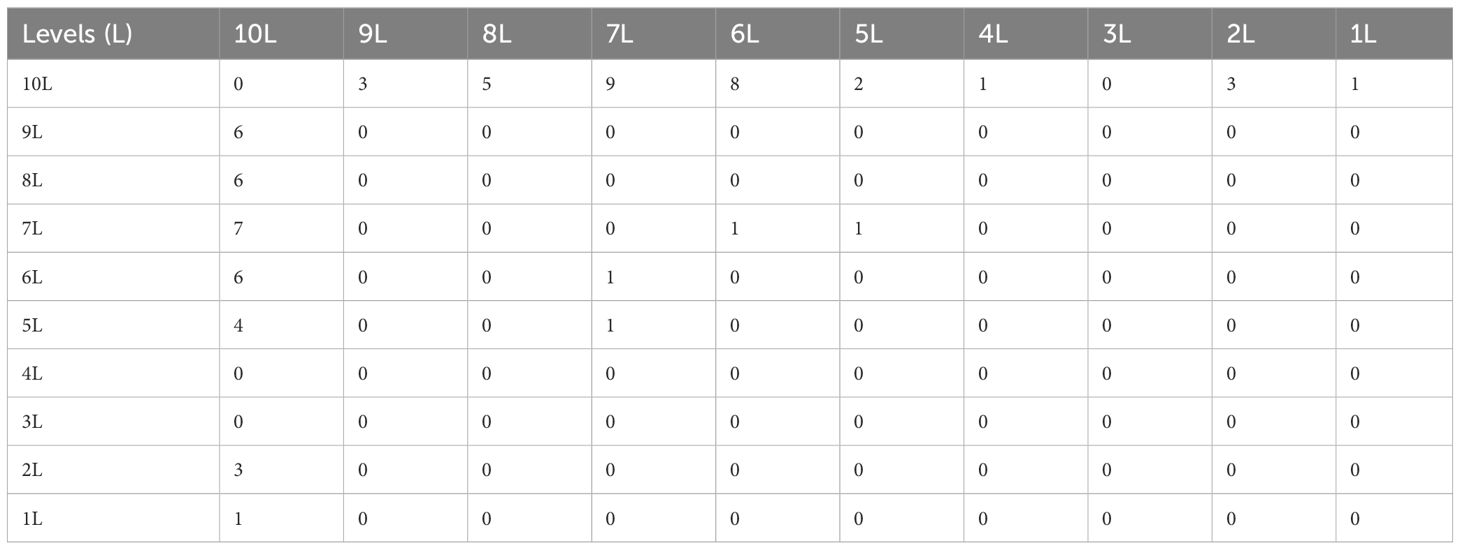
Table 4 Out-degree analysis.

Table 5 In-degree analysis.
3.2.2 K-core node depth
To conduct a precise evaluation of the interconnection between low-level ports and ports at other levels, and to ascertain whether a port is a neighboring port of the core-level port, the k-core node depth indicator is introduced. This indicator is derived based on Equation (1) mentioned earlier. Table 6 presents the k-core depth values of low-level ports following the resolution of in-degree and out-degree. During the parsing of k-core nodes, the degree of the core level of the neighboring ports is utilized as a criterion to assess the connectivity between the higher-level ports and the lower-level ports. The specific indices are then employed to determine the depth of the k-core nodes. In terms of the out-degree, it is observed that the depth of each port is 10, indicating that all lower-level ports can connect to the highest core-level ports and establish connections with them. Among the aforementioned ports, namely Nanjing, Tangshan, Jinzhou, Yingkou, and others, there is a comparatively limited number of connections. This observation indicates that inland ports have a lower demand for shipments to the core ports, primarily due to their geographic location. The ports of Qinzhou and Gaimei exhibit a connection number of 6 and demonstrate a close association with the core ports. About the point of entry, ports that are classified as level 2 or higher can establish direct connections with core ports. However, it should be noted that certain ports in level 1, such as Yingkou port, possess a depth of only 7. Additionally, it is worth mentioning that the Tangshan port is the sole port that is linked to ports in level 7. The significance of Tangshan port as a transshipment hub for cargo to level 1 ports in the international container transportation process is evident.
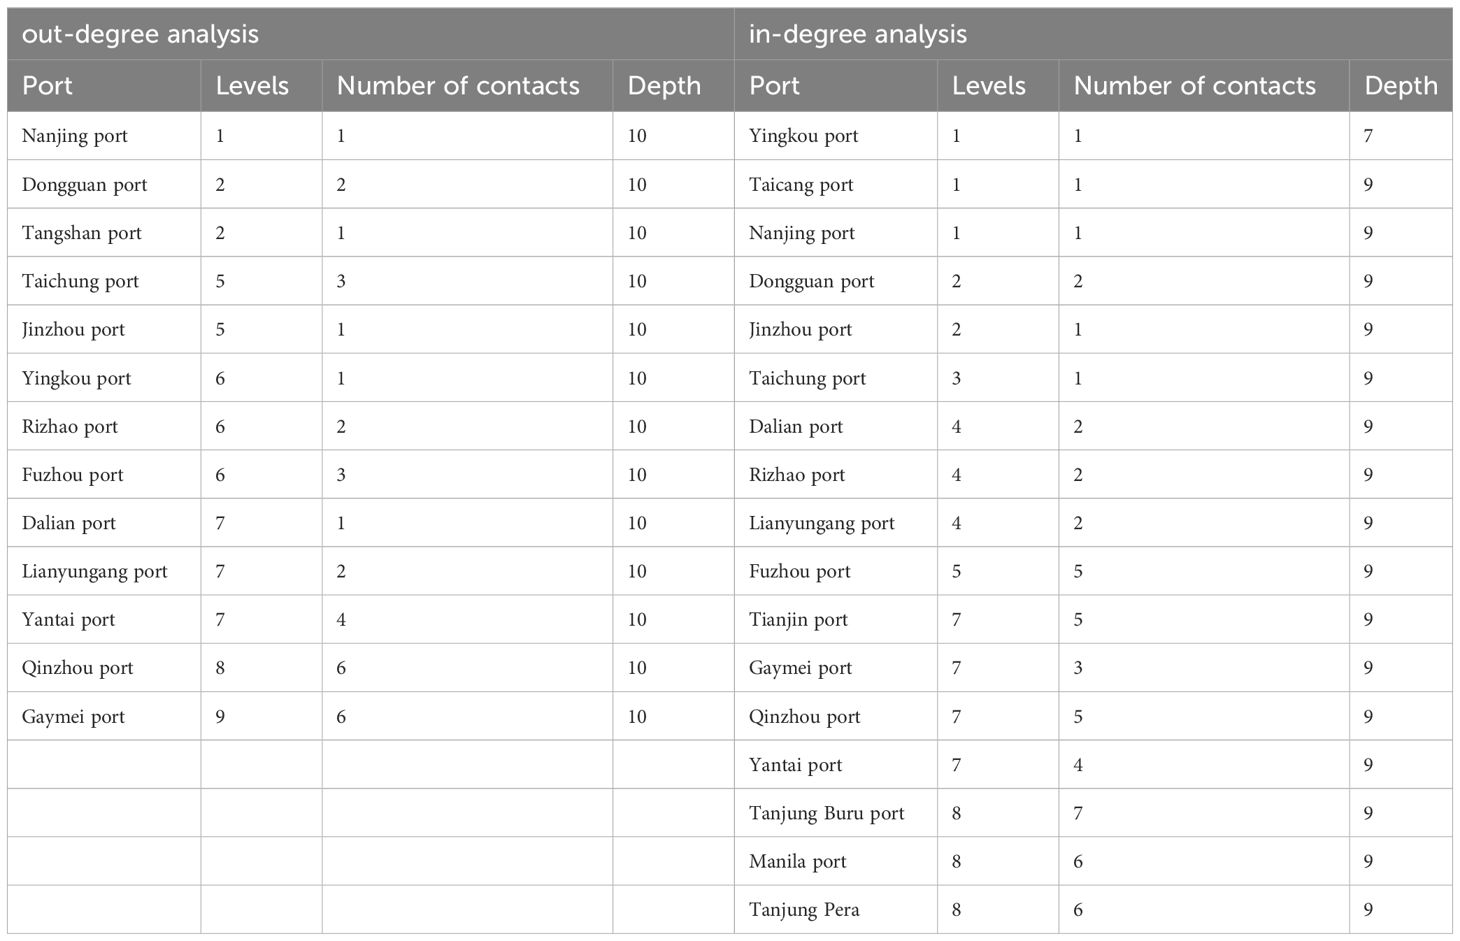
Table 6 K-core depth value of port.
3.2.3 Core structure analysis
Both the out-degree resolved and in-degree resolved core structures, namely k10 and k9, consist of 18 ports. The topologies of these structures are depicted in Figures 4 and 5.
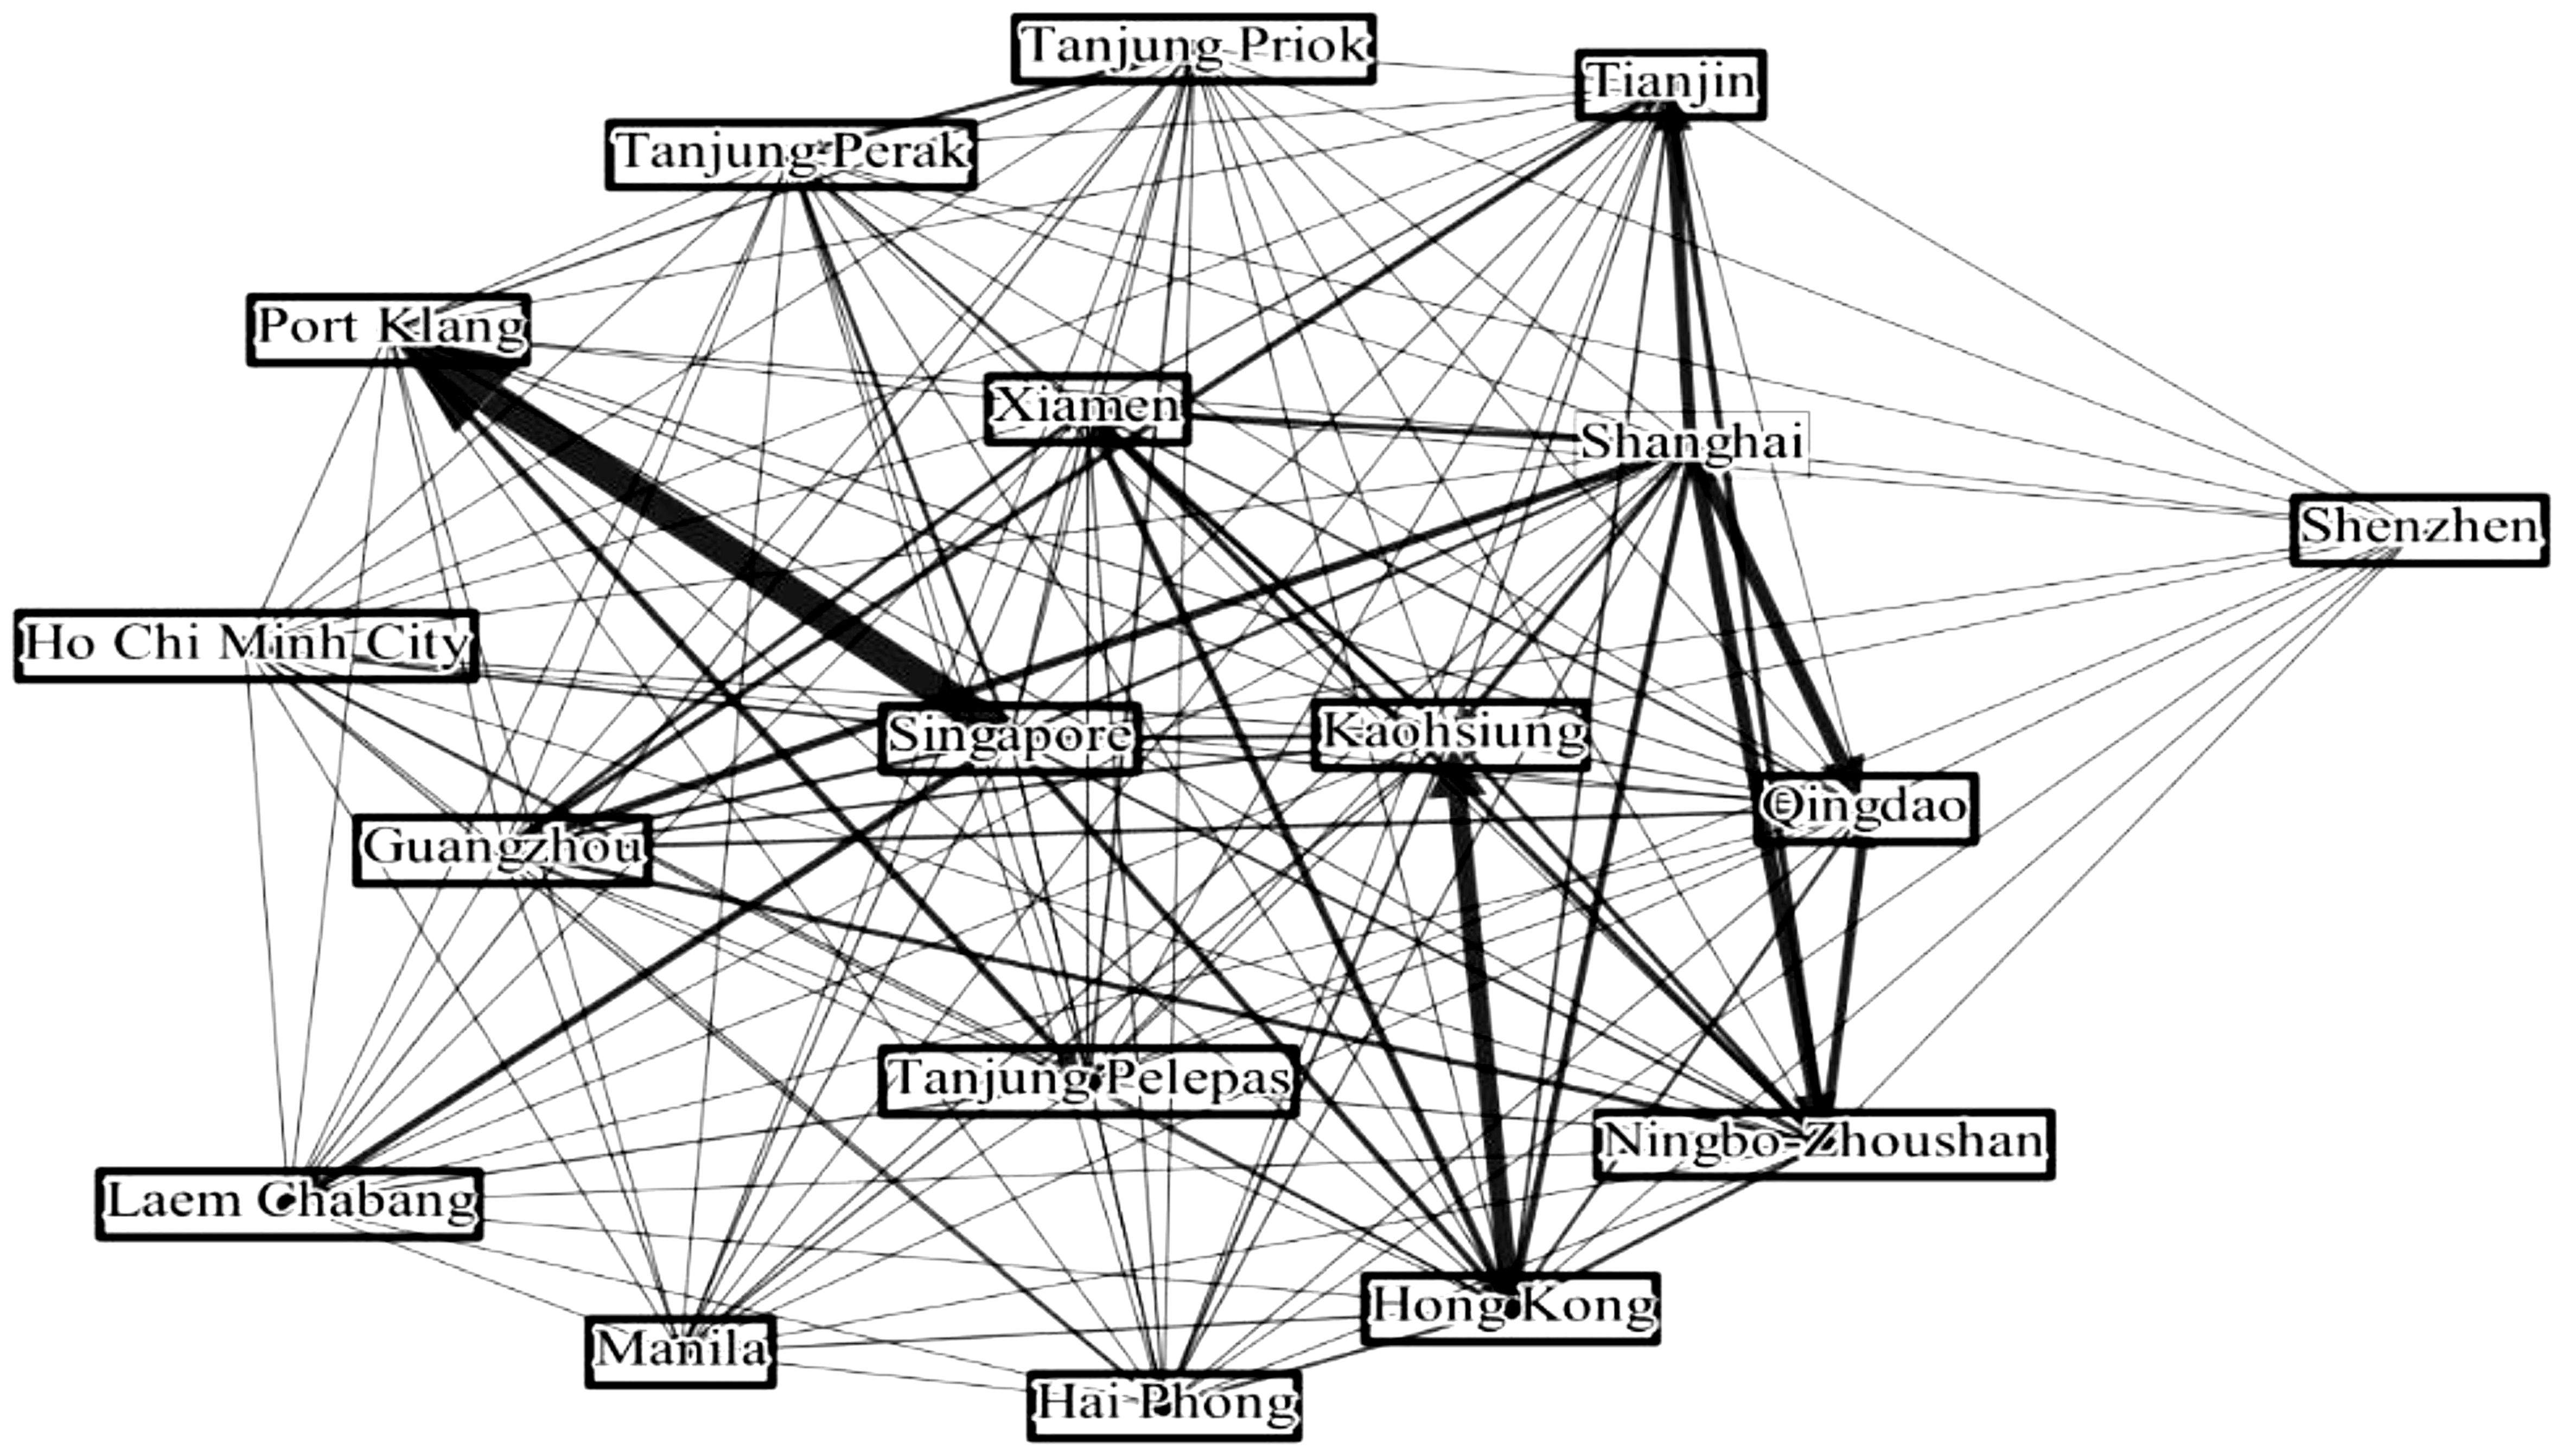
Figure 4 Out-degree analysis of k10 port topology diagram.
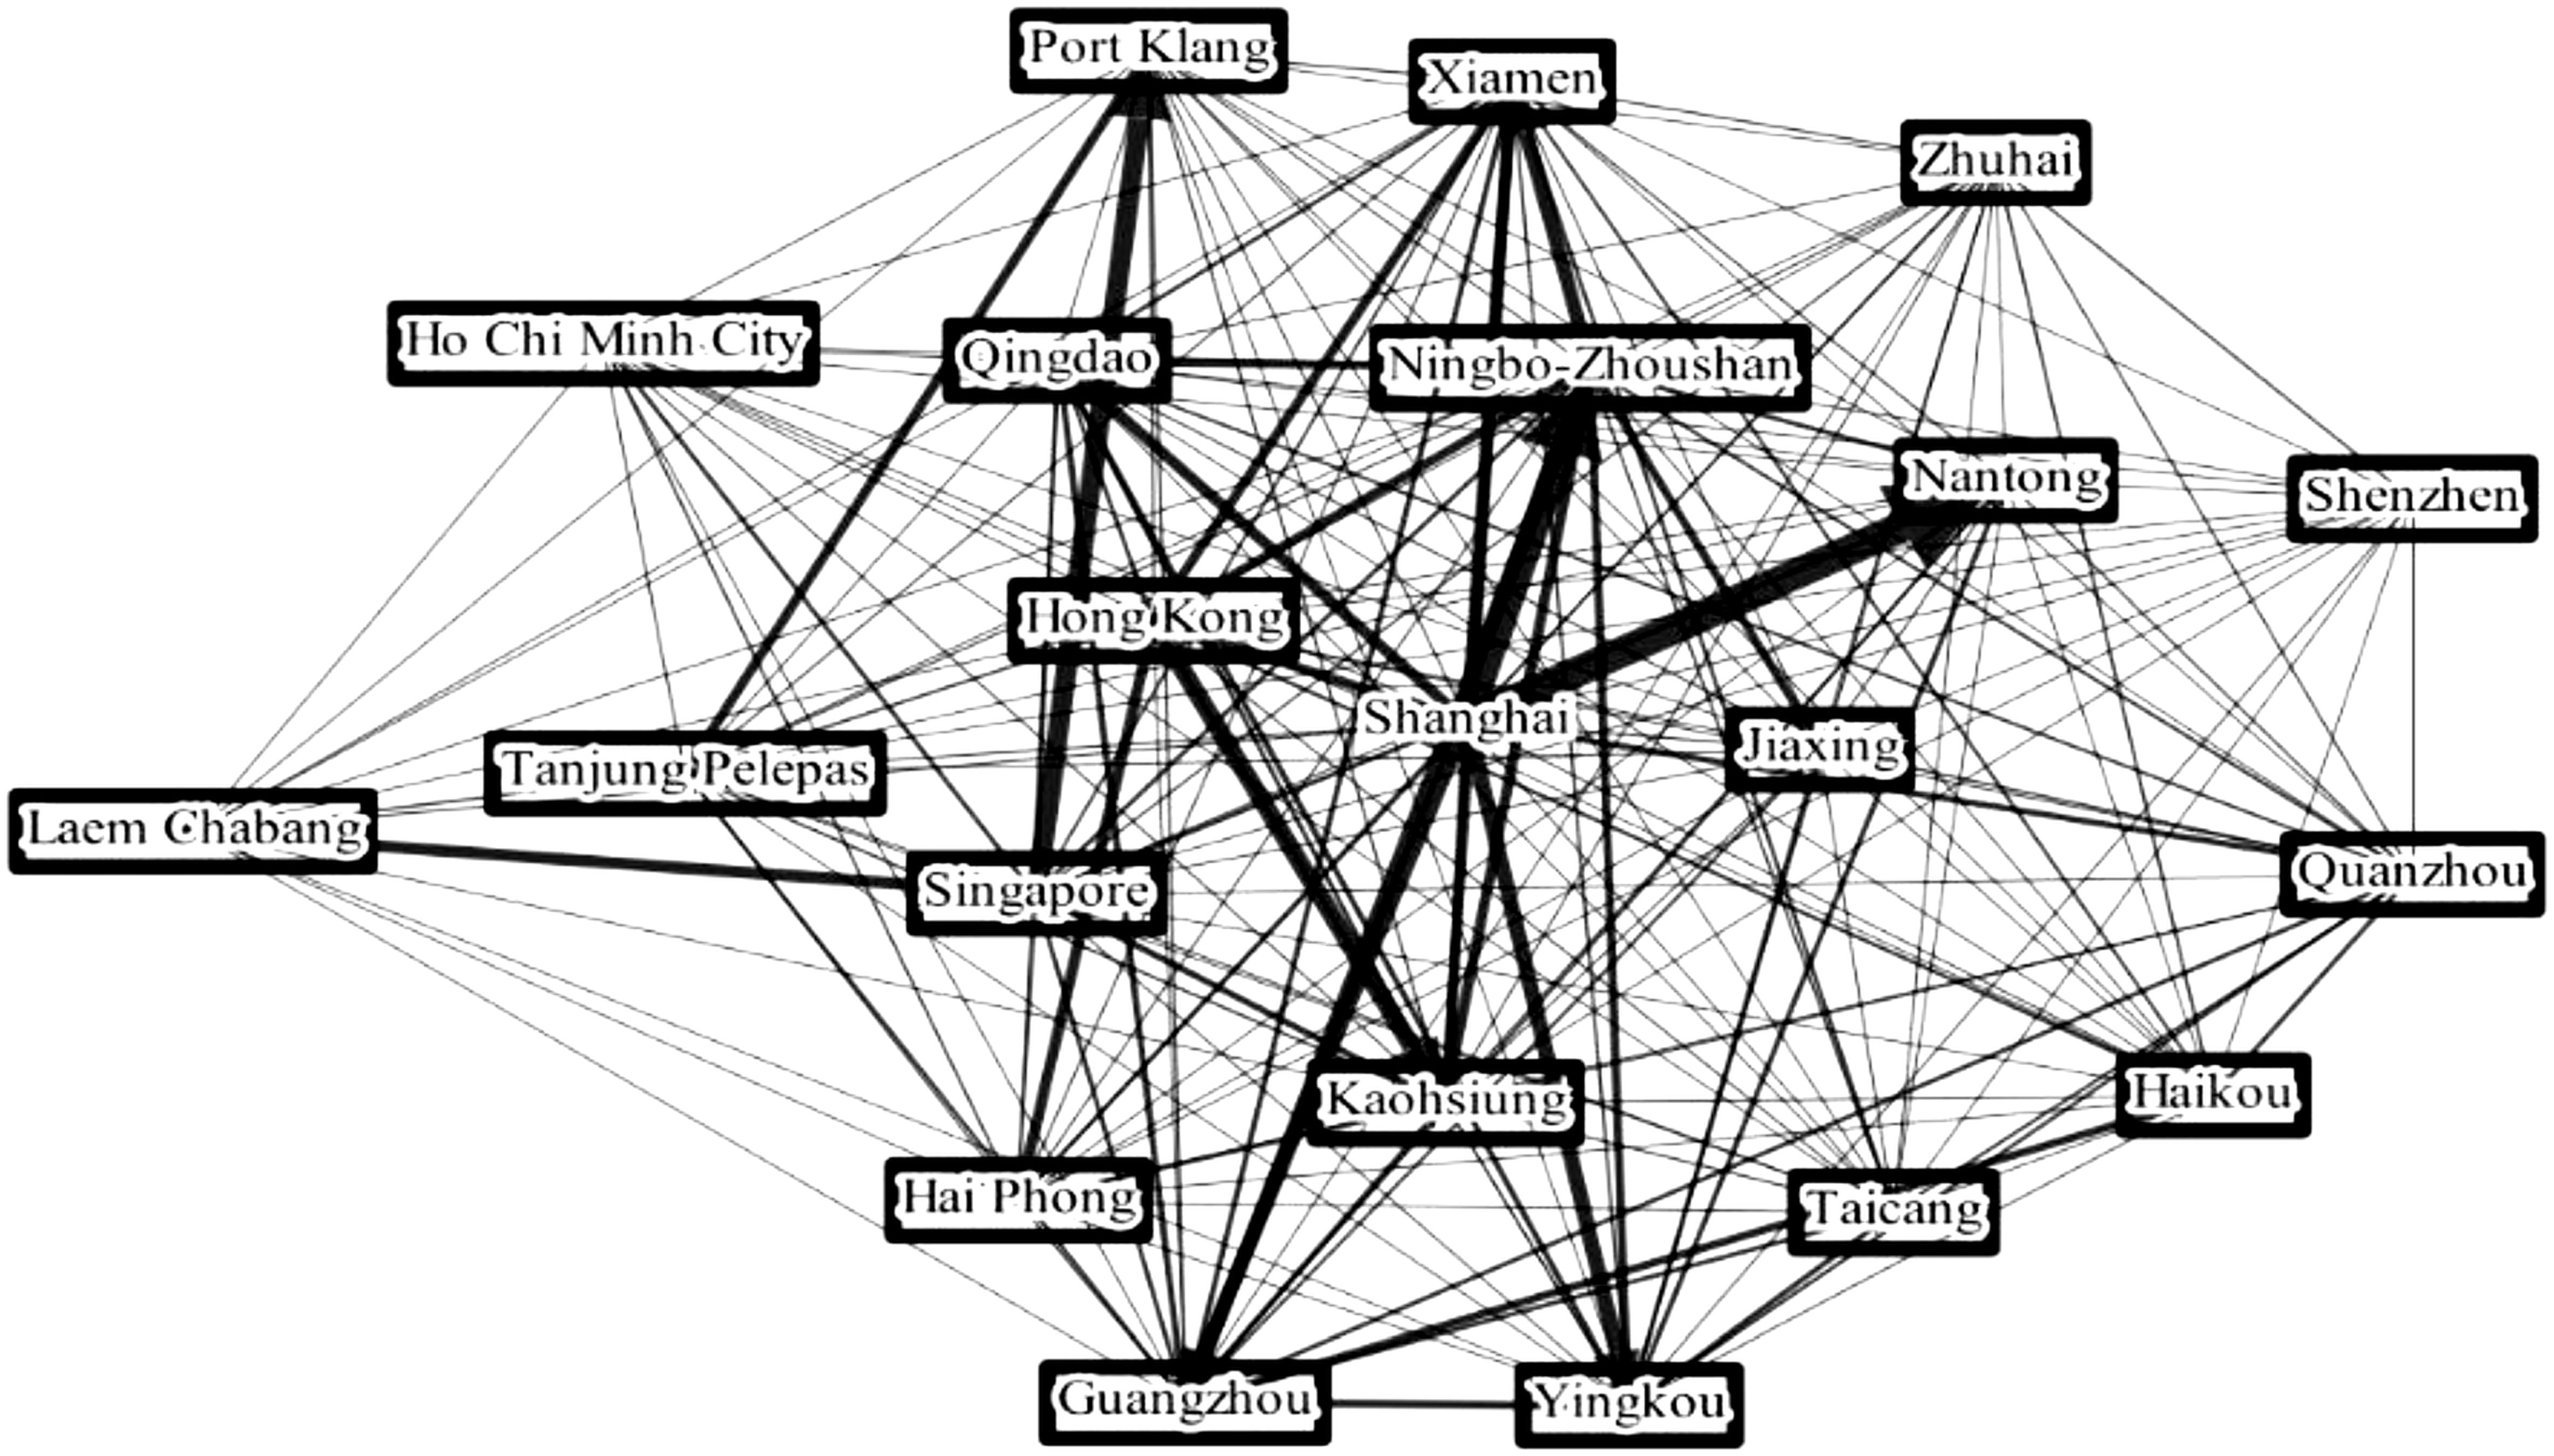
Figure 5 In-degree analysis of the k9 port topology.
3.2.3.1 Core structure small world properties
The small-world properties of a network topology can be characterized by its aggregation factor and average shortest path length. It can be inferred from the Equation (2) mentioned earlier. The measurement of the distance between nodes in a network is determined by the number of edges on the shortest path connecting them. The average shortest path length of a network is the average value of the distances between any two nodes, which can be calculated using Equation (3) mentioned earlier.
From the analysis of Table 7, it is evident that the aggregation coefficient of the k10 level port, after conducting an out-degree analysis, is 0.86. Similarly, the aggregation coefficient of the k9 level port, after conducting in-degree analysis, is 0.781. These findings indicate that both levels of ports exhibit higher aggregation characteristics compared to the overall structural level. Furthermore, the average shortest path length of the two levels of ports is shorter than the overall structural level of 1.778, with values of 1.143 and 1.294 respectively. The network characteristics of a small world are readily apparent.
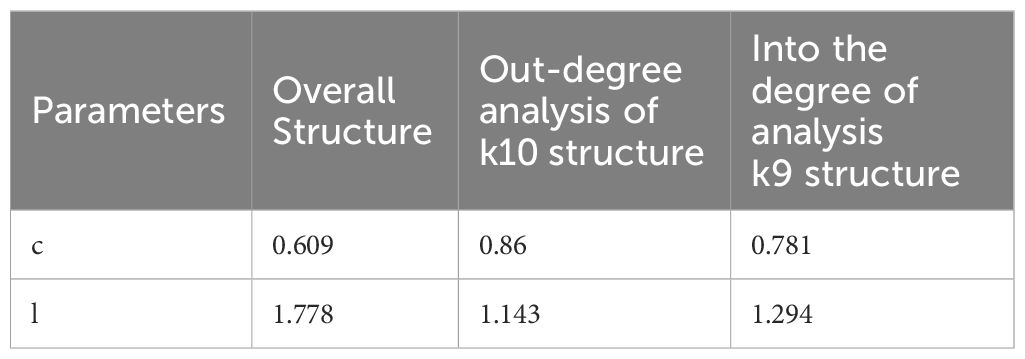
Table 7 Aggregation coefficient and average path length.
3.2.3.2 Analysis of port influence at the highest level
The analysis reveals that the ports within the core port structure exhibit a significant degree of overlap following the analysis of access degree. To investigate the individual impact of each port on the overall network structure, we analyzed the aggregation coefficient, average shortest path length, and proximity to the center potential of the remaining network structure after removing each port separately. The results of this analysis are presented in Table 8, as calculated using the equations provided. The information provided in (4) (5) above.
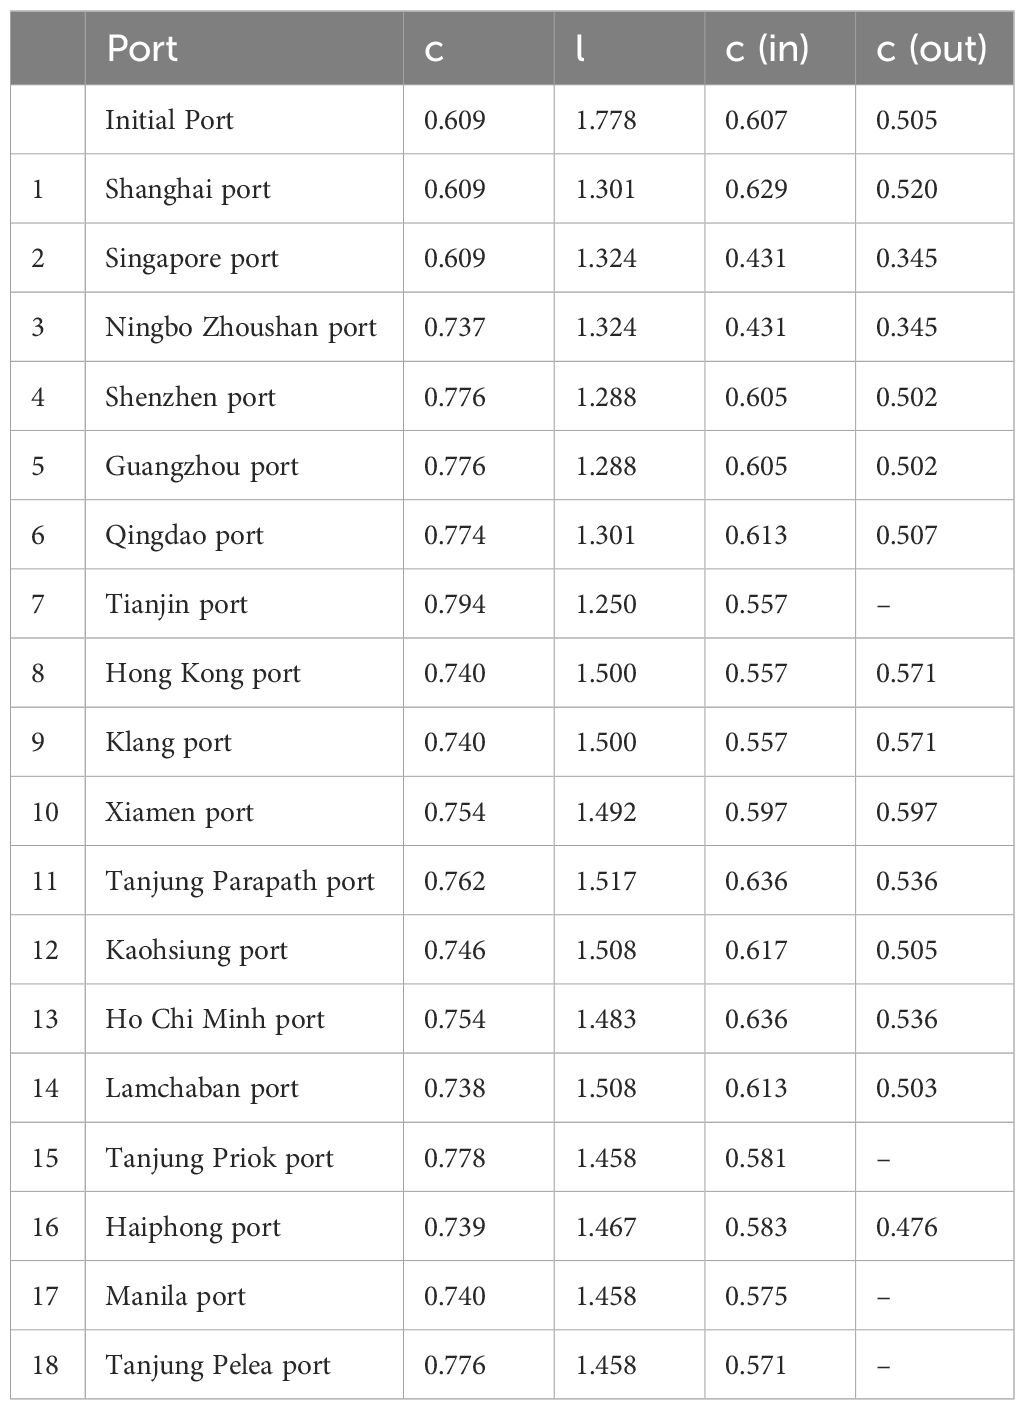
Table 8 Aggregation coefficient, average path length, and near center potential.
About the aggregation coefficients, when comparing the overall structure, it is observed that, expect for the ports of Singapore and Shanghai, the aggregation coefficients of the remaining network have increased after the removal of all ports. Notably, the port of Tianjin experienced a significant increase of 0.131 in its aggregation coefficient. This was followed by the port of Tanjung Bru, which saw the aggregation coefficient of the remaining network after removal rise to 0.778. Similarly, the ports of Shenzhen, Guangzhou, and Tanjung Pelepra also experienced an increase in the aggregation coefficient of the remaining network after removal, reaching 0.776. The ports of Shanghai and Singapore exhibit robust connectivity with other ports, leading to a greater consolidation of the overall network structure. In terms of the average shortest distance, the ports in the core port level exhibit a significant advantage over the overall network structure. This finding supports the notion that the direct connections between ports are primarily concentrated in the high-level ports, as discussed in the preceding section. Revised 2: In terms of proximity centrality, the removal of ports such as Singapore, Ningbo Zhoushan, Tianjin, Hong Kong, Klang, Tanjung Pelepra, Manila, Tanjung Priok, Haiphong, Xiamen, Shenzhen, and Guangzhou results in a decrease in the proximity centrality potential (in) of the remaining network. Similarly, the removal of ports such as Singapore, Ningbo Zhoushan, Haiphong, Shenzhen, Guangzhou, and Laem Chabang leads to a decrease in the proximity centrality potential (out). This indicates that each of the aforementioned ports holds a higher centrality within the port network and serves as a key hub for centralized connectivity among ports. It is evident that the aforementioned ports exhibit high centrality within the port network and serve as crucial hub ports that are centrally connected to other ports. These ports play a significant role in facilitating the distribution and establishment of international routes.
4 Conclusion
Based on the routes of popular shipping companies with a total capacity exceeding eighty percent of the world, this paper constructs a directed dichotomous shipping network, carries out a complex network analysis of the target ports within the routes, divides the ports into tiers after finding the number of cores using k-core analysis, and discusses the relationships between tiers and between ports at higher levels, and draws the following conclusions:
(1) The results of the port hierarchy analysis indicate that the out-degree routes between ports have formed a more stable connection relationship, but the receiving routes are still in a passive position, and the port’s connection relationship is affected by the port hierarchy. In terms of the out-degree connections, the out-degree routes show the characteristics of cross-tier distribution, and there are clear pointing relationships between ports in different tiers. Tiers 6 and 5, such as the ports of Fuzhou and Yingkou, as well as the ports of Rizhao (tier 6) and Jinzhou and Taichung (tier 5), as transshipment hubs can share the pressure of the ports of Shanghai and Singapore (tier 10) and the ports of Dalian and Jinzhou (tier 7) on out-degree routes to avoid the pressure of the ports that are popular gathering ports in out-degree routes. As a popular container port, it avoids congestion on the out-degree routes. However, the number of in-degree connections is still strongly correlated with the port’s tier. Ports in tier 9 such as Shanghai Port and Singapore Port have very high accessibility and have established connections with ports in all tiers, especially ports in Tianjin and Yantai ports (tier 7), and ports in Dalian, Lianyungang, and Rizhao (tier 8); ports in tier 4 such as Manila Port have connections with other ports, except for the 6 connections they have with the ports in tier 9 such as Shanghai Port and Singapore Port (tier 9). In addition to the six connections with the ports of Shanghai, Singapore, etc. (level 9), there are also connections with ports in levels 8, 7, and 2. Therefore, the ports in Tier 9 and Tier 4 are required to undertake both collection and transshipment functions, while ports in other tiers, such as Quanzhou Port, Haikou Port, Jiaxing Port, Nantong Port, and Zhuhai Port, have lower functional attributes and some redundancy in capacity.
(2) The results of the k-core node depth analysis show that the high-level ports undertake the transshipment function of cargo concentration and redistribution within the network. All low-level ports can point to the most core level ports and establish connections with them, among which Nanjing Port, Tangshan Port, Jinzhou Port, Yingkou Port and other ports have a relatively small number of connections, but the connection relationship of the low-level ports shows a significant unidirectionality against the high-level ports, which shows that the low-level ports do not take on the auxiliary transshipment role of the high-level ports and that the high-level ports can independently take on the role of the centralized evacuation of the cargoes after completing the cargo collection of the low-level ports in the network. After completing the collection of goods from the lower-level ports, the higher-level ports in the network can independently undertake the centralized evacuation of goods, such as Yingkou Port, Dalian Port, Lianyungang Port, Fuzhou Port, Jinzhou Port, Taichung Port, Nanjing Port, Dongguan Port, Rizhao Port, Yantai Port, Qinzhou Port, Gaimei Port, and Taicang Port. These ports are evenly distributed around the South China Sea and are closely connected to the land transport network.
(3) The results of the core structure analysis point to the obvious small-world characteristics among the ports of Singapore, Ningbo Zhoushan Port, Haiphong Port, Shenzhen Port, Guangzhou Port, and Linchaban Port. The distance traveled by routes within high-level ports is optimized to a higher degree, and most of the shipping activities, cargo flows, or information exchanges are concentrated among high-level ports, and the core-edge structure is conducive to enhancing the stability and operational efficiency of the network.
5 Discussion
Based on the above conclusions, the following countermeasures are proposed to further promote the low-carbon development of the ocean, optimize the structure of the container port system of the countries along the South China Sea, and ensure that the port logistics of the countries along the South China Sea can seek a balance between efficient capacity and environmental protection.
(1) The concentration of cargo collection and transshipment functions in high-level ports within the South China Sea coastal national container shipping network may lead to a waste of resources in low-level ports, so the network structure can be further optimized by reducing the redundancy of capacity in high-level ports and improving the functions of low-level ports, to reduce the overall carbon emissions, improve the operational efficiency and resource utilization rate of the entire shipping network, and reduce unnecessary energy consumption. At the same time, low-level ports, such as Quanzhou Port, Haikou Port, Jiaxing Port, Nantong Port, and Zhuhai Port, should strengthen their infrastructure construction, improve their shipping service level, enhance their transshipment efficiency, and increase their cargo-carrying capacity, to reduce their dependence on high-level ports.
(2) In the coastal container shipping network of the South China Sea, low-level ports directly transport goods to high-level ports. This pattern makes it necessary for high-level ports to undertake the centralized exercise of transshipment and container flow distribution functions, effectively reducing transshipment links and duplicated transport, as well as lowering waiting time at ports and energy consumption by ships, thus helping to reduce overall energy consumption and greenhouse gas emissions. However, this model has also resulted in the existence of idle available resources at lower- level ports. To further improve the energy efficiency of the overall network, an optimal operating model for ports needs to be planned and implemented. Regarding the connectivity function attributes of low-level ports, subsequent research could aim to explore and optimize multi-modal transport systems. Hub transshipment ports such as Yingkou and Rizhao ports as well as Fuzhou ports within the network should be vigorously developed. By integrating maritime, land, and rail transport, low-level ports can be promoted as effective nodes in a multi-modal transport system, leading to a more efficient and low-carbon flow of goods.
(3) The small-world nature of high-level ports optimizes route planning and cargo movement, reducing unnecessary sailing distances and the number of calls, thereby reducing fuel consumption and carbon emissions. Such characteristics help to enhance the sustainability of the supply chain and reduce the impact of unforeseen events on the entire supply chain, which in turn reduces transport disruptions and carbon emissions. In addition, due to the high frequency of use of high-level ports such as Singapore Port, Ningbo Zhoushan Port, Haiphong Port, Shenzhen Port, Guangzhou Port, and Port of Laem Chabang, they have a stronger drive for green technology innovations (e.g., LNG-powered ships, electric ships, etc.). Therefore, subsequent studies should deeply analyze the operation and management strategies (e.g., scheduling, cargo handling, resource allocation, etc.) of high-level ports to improve port efficiency and further reduce carbon emissions.
From a technical standpoint, the current study exhibits certain limitations. Firstly, the complexity of port networks encompasses a multitude of entities and interactions (e.g., ships, cargo, and information flows) and is subject to non-structural influences like policies, regulations, and economic factors during operation. However, k-core analysis typically relies on static network structures, which hinders its ability to fully encapsulate the complexity and dynamism of port networks. Therefore, future research could consider integrating data such as transport records, port capacity, and cargo flow from various time periods. This data can be used to study the dynamic evolution of ports through dynamic network analysis, by representing the data as a network structure using graph theory, and taking into account the addition, removal, and changes of nodes and edges over time. This approach could provide a more comprehensive understanding of the dynamic evolution of port networks.
Secondly, the K-core approach primarily focuses on analyses grounded in network topology, but it falls short in fully considering the comprehensive factors (e.g., policy, economic elements, environmental factors, etc.) introduced by the port’s unique geo-environment. These factors also exert an influence on the hierarchical structure of the port system. Consequently, no single approach can entirely capture the full complexity of the shipping network. In subsequent research, we can enhance the decomposition process of k and employ the precise k-core method. This method takes into account both the local feature information and global structure information within the network. We can apply the k-core to the center of gravity centrality and propose a hybrid centrality for the multivariate assessment of node importance. This is achieved by combining the Shannon entropy of the neighborhood degree centrality, neighborhood precise k-core, and precise gravity centrality. Furthermore, indicators related to low carbon evaluation are selected to assign weights to the port nodes. This approach aims to obtain a more comprehensive understanding of the network, thereby optimizing the transport strategy, reducing unnecessary transport, and ultimately, lowering carbon emissions.
Data availability statement
The original contributions presented in the study are included in the article/supplementary material. Further inquiries can be directed to the corresponding authors.
Author contributions
YL: Writing – review & editing. ZW: Writing – original draft. LS: Writing – original draft. JY: Writing – original draft.
Funding
The author(s) declare financial support was received for the research, authorship, and/or publication of this article. This study was funded by 2022 Innovation Project of Guangxi Graduate Education(YCSW2022478)and Beibu Gulf Ocean Development Research Center under Key Research Base of Humanities and Social Sciences in Guangxi Universities and Marine Science Program for Guangxi First-Class Discipline, Beibu Gulf University. (BHZXSKY2107).
Conflict of interest
The authors declare that the research was conducted in the absence of any commercial or financial relationships that could be construed as a potential conflict of interest.
Publisher’s note
All claims expressed in this article are solely those of the authors and do not necessarily represent those of their affiliated organizations, or those of the publisher, the editors and the reviewers. Any product that may be evaluated in this article, or claim that may be made by its manufacturer, is not guaranteed or endorsed by the publisher.
References
AK-BHD M. (2021). WMO greenhouse gas bulletin (Geneva, Switzerland: World Meteorological Organization).
Anas A., Aykut O., Fabio B. (2022). Ports’ role in shipping decarbonisation: A common port incentive scheme for shipping greenhouse gas emissions reduction. Cleaner Logistics Supply Chain 3, 100021. doi: 10.1016/j.clscn.2021.100021
Chen G. Y., Xu B., Wu F., Fang H. W. (2020). Hierarchical classification of container shipping hubs on the 21st century maritime silk road based on complex networks. China Water Transport 20, 39–41.
Chen J. H., Li P. P., Wang X., Yi K. (2023). Above management: Scale development and empirical testing for public opinion monitoring of marine pollution. Mar. Pollut. Bull. 192, 114953. doi: 10.1016/j.marpolbul.2023.114953
Ducruet C., Notteboom T. (2012). The worldwide maritime network of container shipping: spatial structure and regional dynamics. Global Networks 12, 395–423. doi: 10.1111/j.1471-0374.2011.00355.x
Guo J. K., He Y., Hou Y. J. (2018). Spatial linkages and regional differences in the shipping network of China’s coastal container ports. Prog. Geogr. 37, 1499–1509. doi: 10.18306/dlkxjz.2018.11.006
Huang Y. F., Wei M. H., Wang Y., Guo X. Y., Huang M. Z. (2023). Current situation and trend of green shipping logistics development in China under the guidance of “Dual carbon” Goal. J. Dalian Maritime Univ. 49, 1–16. doi: 10.16411/j.cnki.issn1006-7736.2023.01.001
Jiang J. L., Lee L. H., Chew E. P., Gan C. C. (2015). Port connectivity study: An analysis framework from a global container liner shipping network perspective. Transportation Res. Part E: Logistics Transportation Rev. 73, 47–64. doi: 10.1016/j.tre.2014.10.012
Kevin C., Wang Y. H. (2012). The hierarchical configuration of the container port industry: an application of multiple linkage analysis. Maritime Policy Manage. 39, 169–187. doi: 10.1080/03088839.2011.650719
Li Z. F., Zhang X. L., Xu M. Q., Shi Y. L., Jiang S. F. (2015). East asian container port system hierarchy. Syst. Eng. 33, 78–84.
Lv K. J., Zhang R. R. (2012). Network structure and characteristics of world shipping centres based on complex networks. Syst. Engineering-Theory Method. Appl. 21, 87–92.
Meng X. Q. (2014). Implications of the international carbon emission trading system for the establishment of carbon market in China. Acad. exchanges 1), 78–81. doi: 10.3969/j.issn.1000-8284.2014.01.016
Parth V., Paul S F., M. Granger M., James C. (2016). Shore power for vessels calling at U.S. Ports: benefits and costs. Environ. Sci. Technol. 50, 1102–1110. doi: 10.1021/acs.est.5b04860
Qin X. S. (2014). Port logistics carbon management system based on internet of things technology. Railway Transport Economy 36, 88–92. doi: 10.3969/j.issn.1003-1421.2014.08.018
Qiu Z. P., Liu Z., Guo H. (2021). Study on the international trade effects of global liner shipping networks - social network analysis based on UN LSBCI matrix data. Int. Business (05), 79–95. doi: 10.13509/j.cnki.ib.2021.05.006
Shu Y. Q., Hu A. Y., Zheng Y. Z., Gan L. X., Xiao G. N., Zhou C. H., et al. (2023). Evaluation of ship emission intensity and the inaccuracy of exhaust emission estimation model. Ocean Eng. 287, 115723. doi: 10.1016/j.oceaneng.2023.115723
Tarasova O., Vermeulen A., Sawa Y., Houweling S., Dlugokencky E. (2023). The state of greenhouse gases in the atmosphere using global observations through 2021, EGU General Assembly 2023, Vienna, Austria, 24–28 Apr 2023, EGU23-15201. doi: 10.5194/egusphere-egu23-15201
Theo N., Jean-Paul R. (2005). Port regionalization: towards a new phase in port development. Maritime Policy Manage. 32, 297–313. doi: 10.1080/03088830500139885
Tian W., Deng G. S., Wu P. J., Che W. J. (2007). Complexity analysis of world shipping networks. J. Dalian Univ Technol. (04), 605–609.
Tzeng Y. A., Shih Y. C., Wu C. C., Wu J. H. (2023). Introduction and response strategies of IMO’s new requirements for reducing greenhouse gas emissions from ships. Ship Technol. (57), 87–108.
Wang F. (2022). The application of information technology in the management of port logistics analysis. Market Modernization (20), 28–30. doi: 10.14013/j.cnki.scxdh.2022.20.013
Wang C. J., Chen Y. H. (2017). Identification of strategic pivot points in global shipping. Bull. Chin. Acad. Sci. 32, 348–354. doi: 10.16418/j.issn.1000-3045.2017.04.003
Wang Q., Chen W., Wei C. Z. (2022). Characteristics of Guangdong, Hong Kong and Macao greater bay area port cluster participation in global shipping networks. Trop. Geogr. 42, 236–246. doi: 10.13284/j.cnki.rddl.003431
Wang X. M., Han L. C., Zhang G. C. (2023). Analysis of the maritime industry’s achievement of greenhouse gas emission reduction targets. Ship & Boat 34, 56. doi: 10.19423/j.cnki.31-1561/u.2023.04.056
Wang J. E., Li T. (2022). Progress and prospects of China’s traffic and tourism integration research in the context of a strong transportation state. J. Chin. Ecotourism 12, 1–15. doi: 10.12342/zgstly.20220005
Wang C., Wang M. J., Wang Y. (2018). Identification of key nodes embedded in the “21st Century Maritime Silk Road” shipping network in China. Prog. Geo 37, 1485–1498. doi: 10.18306/dlkxjz.2018.11.005
Wang L. H., Zhu Y. (2017). The evolution of China’s international shipping network based on the 21st century maritime silk road. Acta Geographica Sin. 72, 2265–2280. doi: 10.11821/dlxb201712011
Wu J. F. (2021). Digital transformation trends and innovation platform construction for China’s smart ports. China Ports 10), 20–23.
Wu J., Zhang D., Wang C. P. (2019). Evaluation of port status along the maritime silk road based on complex networks. J. Transport Inf. Saf. 37, 101–108. doi: 10.3963/j.issn.1674-4861.2019.03.013
Xiao G. N., Chen L., Chen X. Q., Jiang C. M., Ni A., Zhang C. Q., et al. (2023). A hybrid visualization model for knowledge mapping: Scientometrics, SAOM, and SAO (IEEE Transactions on Intelligent Transportation Systems). doi: 10.1109/TITS.2023.3327266
Xu S., Ma Y. M. (2013). Research on low carbon port construction standards and development countermeasures. China Ports 06), 6–8.
Xu L., Yang Z. H., Chen J. H., Zou Z. Y., Wang Y. (2024a). Spatial-temporal evolution characteristics and spillover effects of carbon emissions from shipping trade in EU coastal countries. Ocean Coast. Manage. 250, 107029. doi: 10.1016/j.ocecoaman.2024.107029
Xu L., Zou Z. Y., Chen J. H., Fu S. S. (2024c). Effects of emission control areas on sulfur-oxides concentrations——Evidence from the coastal ports in China. Mar. Pollut. Bull. 200, 116039. doi: 10.1016/j.marpolbul.2024.116039
Xu L., Zou Z., Liu L., XIAO G. N. (2024b). Influence of emission-control areas on the eco-shipbuilding industry: A perspective of the synthetic control method. J. Mar. Sci. Eng. 12, 149. doi: 10.3390/jmse12010149
Xu L., Zou Z. Y., Zhou S. R. (2022). The influence of COVID-19 epidemic on BDI volatility: An evidence from GARCH-MIDAS model. Ocean Coast. Manage. 229, 106330. doi: 10.1016/j.ocecoaman.2022.106330
Yang X. “Reducing PM2.5 emissions from ships and realising green development of shipping,” in Reform and Innovation, Overcoming Difficulties and Promoting Development - Proceedings of the 2013 Academic Symposium of “Suzhou, Zhejiang, Fujian, Guangdong, Guangxi and Shanghai” Nautical Societies. (Guangzhou).
Yang Q. P., Yan J., Zhang M. J., Li H.l., Fang S. S., Gong X. X., et al. (2021). Implications of green development of German inland waterway shipping for China’s shipping development. Port Waterway Eng. (07), 106–110 + 191. doi: 10.16233/j.cnki.issn1002-4972.20210630.007
Yehuda H. (1981). Containerization and the load center concept. Economic Geogr. 57 (2), 160–176. doi: 10.2307/144140
Yu H., Huang M. Z., He J. L., Tan C. (2023). The clustering strategy for stacks allocation in automated container terminals. Maritime Policy Manage. 50, 1102–1117. doi: 10.1080/03088839.2022.2119616
Zhen L., D. Z. G., Wang X. F. (2020a). A review of research on green port and shipping management. System Eng. Theor. Prac 40, 2037–2050. doi: 10.1016/j.trb.2020.06.004
Keywords: low carbon, South China Sea, container port, k-core analysis, complex network
Citation: Li Y, Wu Z, Sun L and Yue J (2024) Study on the hierarchical structure of container port systems along the South China Sea in the context of low carbon emissions. Front. Mar. Sci. 11:1339515. doi: 10.3389/fmars.2024.1339515
Received: 21 November 2023; Accepted: 05 March 2024;
Published: 27 March 2024.
Edited by:
Jihong Chen, Shenzhen University, ChinaReviewed by:
Guangnian Xiao, Shanghai Maritime University, ChinaNitin Agarwala, National Maritime Foundation, India
Copyright © 2024 Li, Wu, Sun and Yue. This is an open-access article distributed under the terms of the Creative Commons Attribution License (CC BY). The use, distribution or reproduction in other forums is permitted, provided the original author(s) and the copyright owner(s) are credited and that the original publication in this journal is cited, in accordance with accepted academic practice. No use, distribution or reproduction is permitted which does not comply with these terms.
*Correspondence: Zongnan Wu, NjcwNzE0NjYwQHFxLmNvbQ==; Liang Sun, c2wxNDQzNTIxOTg3QDE2My5jb20=