 Yanjiao Li
 Jun Lin1,2,3*
 Wei Zhong
- 1College of Oceanography and Ecological Science, Shanghai Ocean University, Shanghai, China
- 2Engineering Technology Research Center of Marine Ranching, Shanghai Ocean University, Shanghai, China
- 3Key Laboratory of Marine Ecological Monitoring and Restoration Technologies, Ministry of Nature Resources, Shanghai, China
- 4Buoy Maintaining Department, East China Sea Forecasting and Hazard Mitigation Center, Shanghai, China
Suspended shellfish aquaculture, utilizing longlines and buoys fixed on the sea surface, is a crucial source of global seafood. However, typhoons, as the most common disasters in coastal regions, can generate massive waves and pose a threat to the safety of suspended aquaculture facilities. Therefore, it is essential to investigate the risk levels associated with suspended aquaculture farms during typhoon waves. The example of a large-scale suspended mussel farm in the East China sea was examined in this study. The wave conditions under extreme wind conditions (25m/s) and different typhoon paths were predicted using the SWAN model and modeled results compared well with the observed wave and wind data. The results indicated that when the center of the east-side typhoon was located at the same latitude as the farm, it will face the highest risk level. However, for the west-side and intermediate sweeping typhoons, the risk level reached highest in the farm, when the typhoon center is lower than the latitude of it. Under the combined effects of wind fetch and topography, the risk level in the southeast farming area of the island is the highest under different wind conditions. The farms to the northwest of the island face a higher risk level during the passage of east-side sweeping typhoons, while the southern farms of the island experience an elevated risk level during the west-side and intermediate sweeping typhoons. It is suggested that farming regions with lower risk levels are more conducive to the cultivation of species with longer culture cycles. Conversely, regions considered at higher risk are more suitable for species with shorter culture cycles. The study affords a reference for the optimization and insurance of suspended aquaculture farms.
1 Introduction
Global aquaculture has grown and expanded dramatically, with production have reached record-high of 122.60 million tonnes in 2020 (FAO, 2022). Even though shellfish is a significant part of the aquaculture industry, it rarely receives the same attention as shrimp and finfish when discussing how to increase aquaculture productivity (Botta et al., 2020). China is the largest producer of seafood around the world, with a significant output of 15.26 million tonnes production of shellfish in 2021. This figure represents approximately 69% of the total aquaculture production worldwide. Shellfish is one of the most important non-fed species in aquaculture, this is primarily due to their ability to feed directly on plankton present in the water column, thereby eliminating the need for an external food source (Maar et al., 2023). Owing to the deterioration of coastal water quality and spatial limitations, aquaculture is increasingly being extended into deeper oceanic regions (Long et al., 2024). Nonetheless, as aquaculture has developed, there is now a greater chance of it being exposed to high winds and waves. As one of the most destructive natural catastrophes in offshore locations, typhoons may produce typhoon waves and cause damage to the aquaculture facilities (Bi et al., 2020; Zhang et al., 2021).
Gouqi Island is known as the hometown of mussels, with farming area of 12 km2, and the production of mussels reached 223 800 tons in 2022, accounting for more than 98% of the total mussel production of Zhejiang Province. Situated along the southeast coast of China, it experiences a typical subtropical monsoon climate predominantly influenced by the Pacific subtropical high-pressure system. Consequently, the region frequently was attacked by tropical cyclones (TCs) during the summer and fall seasons, making it one of the most seriously affected areas by typhoons globally. The most rapid phase of mussel growth occurs between July and August, and the peak of harvest period is typically from late August to mid-September, which correspond to the peak of typhoons (Chen et al., 2012; Lin et al., 2016a). Tropical cyclones cause particularly severe disaster damage among extreme weather and climate events (Liu et al., 2019). In the period from 2000 to 2022, a total of 643 tropical cyclones were generated in the northwestern Pacific Ocean. Of these, 282 entered the 24-hour warning line surrounding China’s coastline. Additionally, 189 of these cyclones made landfall and 25 made landfall specifically in Zhejiang Province (Ying et al., 2014; Lu et al., 2021) (Figure 1). An average of 3.3 tropical cyclones will affect it annually (Wu et al., 2021).
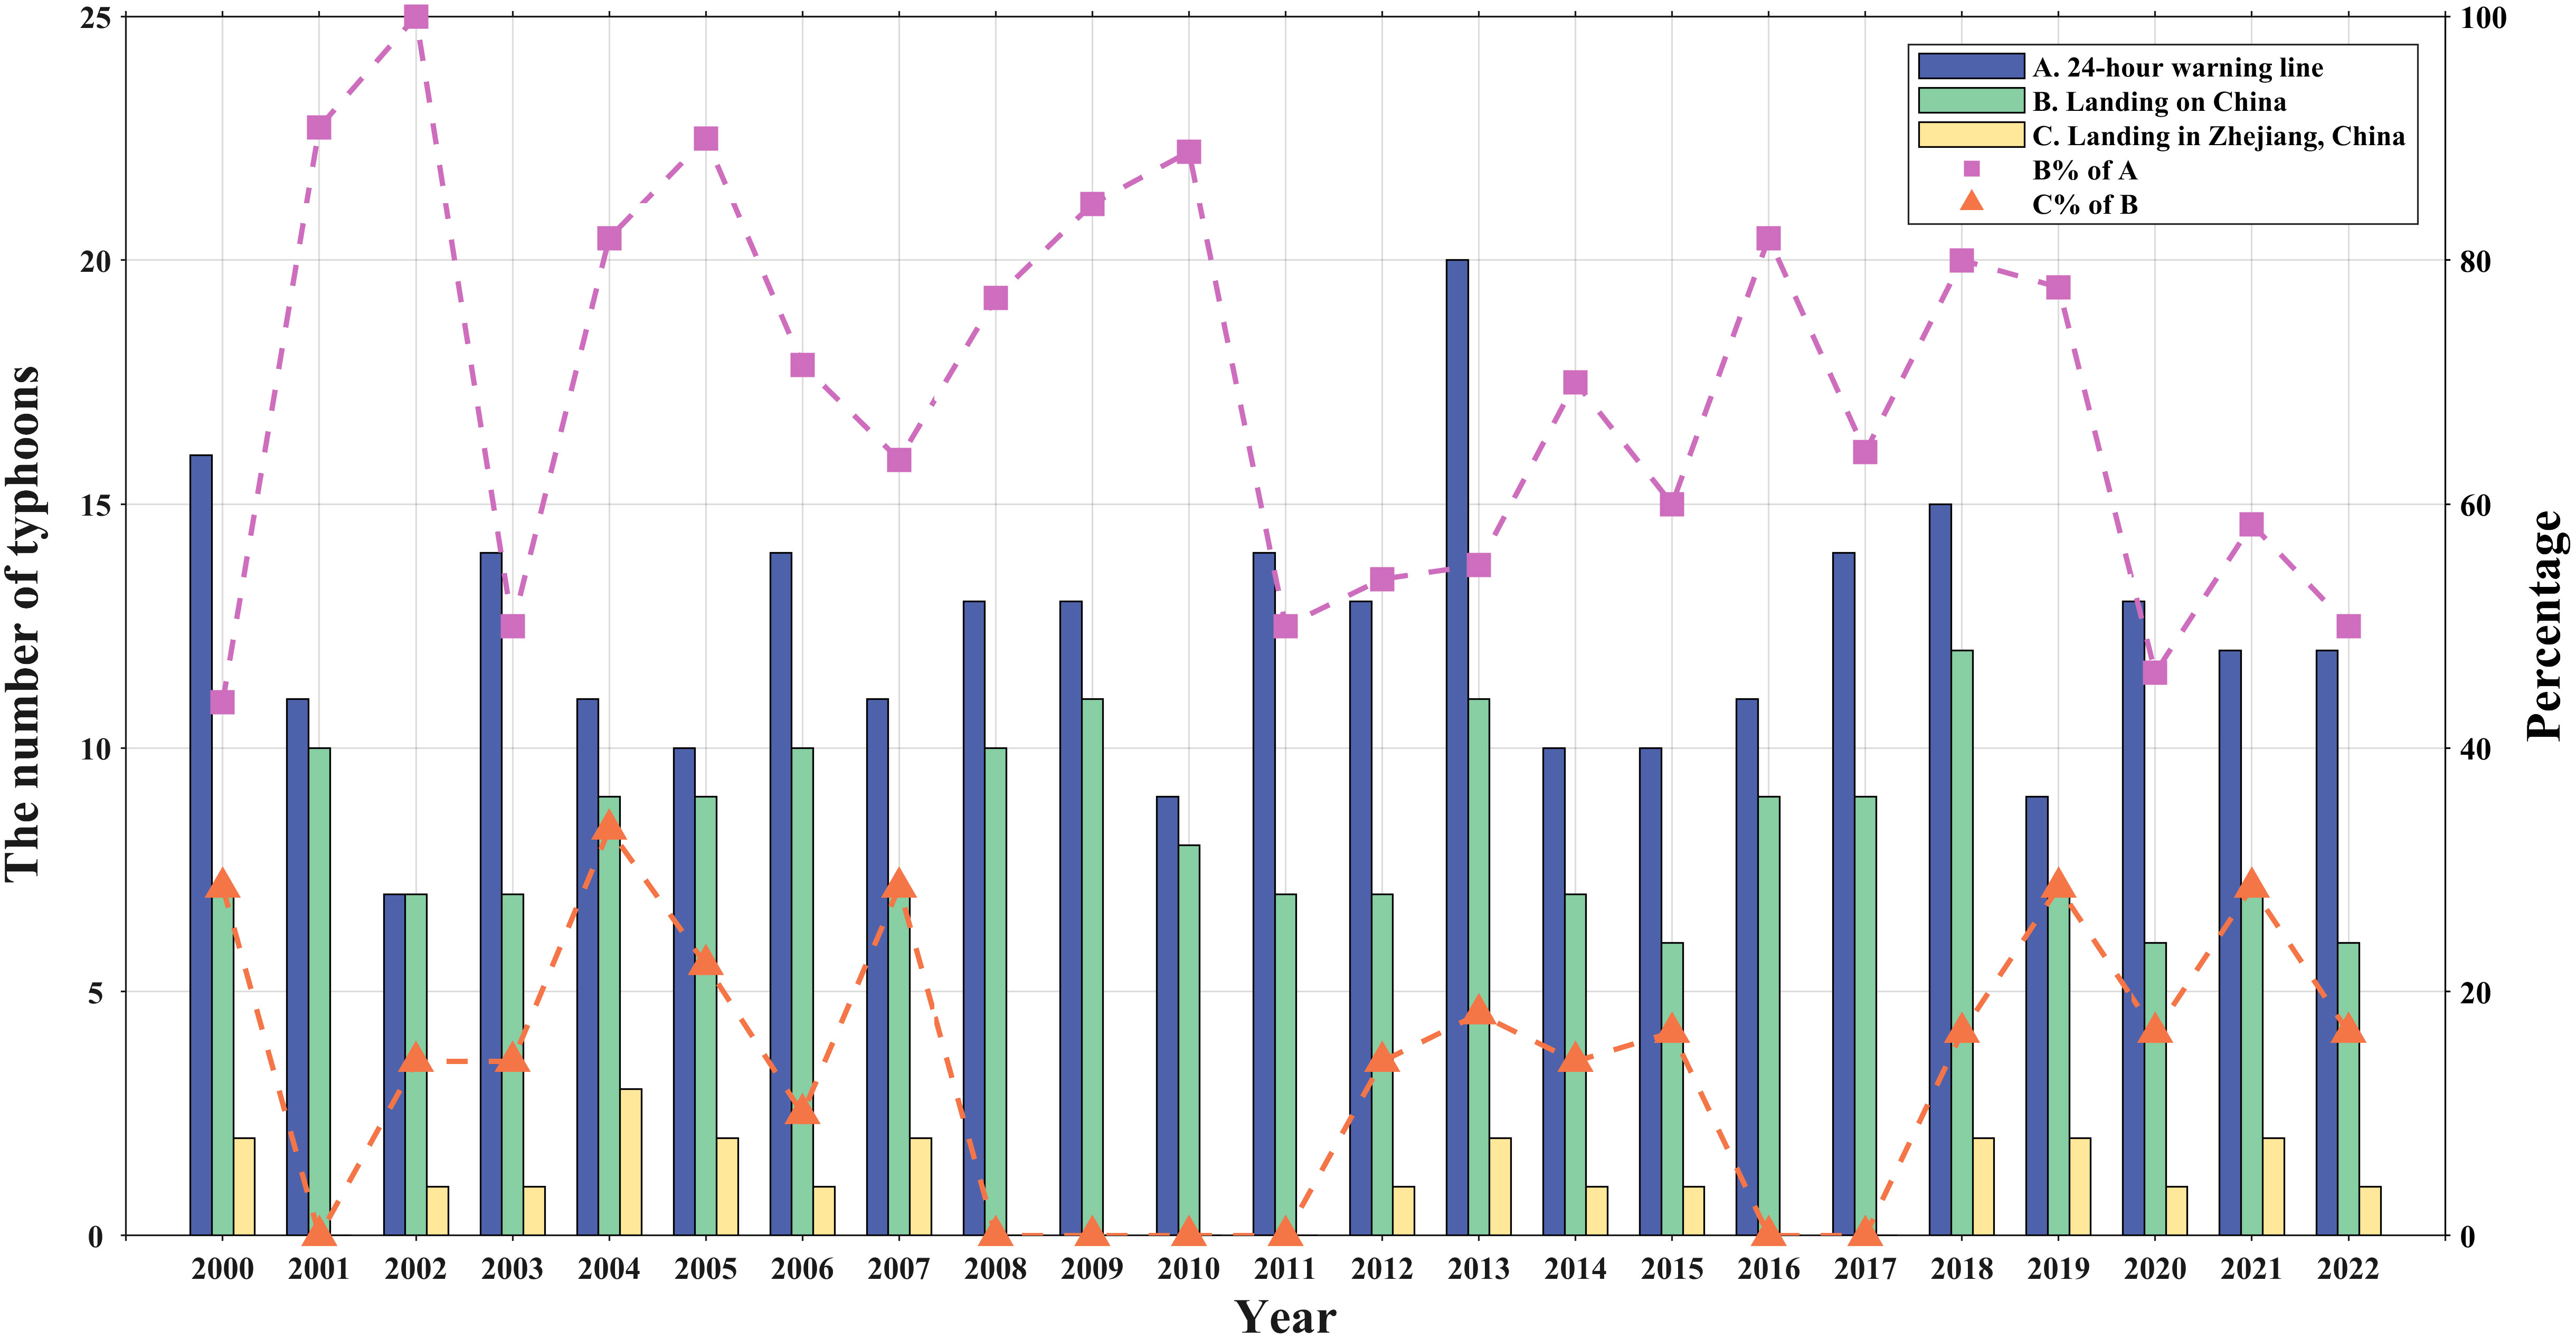
Figure 1 Number of typhoons entering 24-hour warning line of China coastline, landing on China and landing in Zhejiang province from 2000 to 2022. Colored dashed lines indicate percentages.
Suspended longline form was adopted to culture mussels in Gouqi Island, which is consist of a buoy, mussel ropes, longline, mooring line and anchor block (Lin et al., 2016b; Zhong et al., 2022). Suspended culture can keep the shellfish on the surface of the ocean with plenty of natural food and protect it from predators (Mascorda Cabre et al., 2021). But the suspended aquaculture facilities make it more susceptible to wave damage during typhoons (Xie et al., 2010; Huang et al., 2011). For suspended mussel farms, gale-force winds (ranging from 17.20 m/s to 20.70 m/s) will impact the operational tasks of fishermen. Stronger gale-force winds (from 20.80 m/s to 24.40 m/s) may lead to the shedding of mussel individuals due to collisions with ropes or the effects of wave and current forces. Furthermore, storms (with wind speeds ranging from 24.50 m/s to 28.40 m/s or higher) have the potential to cause significant damage to mussel farm facilities, such as the breakage of longline and mooring lines. As a result, the annual production of mussels of Gouqi Island fluctuates dramatically, the destruction of aquaculture facilities caused by the passage of typhoons has brought substantial economic losses.
Many scholars have conducted studies on the hydrodynamic characteristics of the suspended aquaculture farm. Field observations and large-scale numerical simulations have previously demonstrated that aquaculture farms can influence tidal flow at the scale of bays and the open ocean (Stevens et al., 2007; Plew, 2011a, b; Lin et al., 2016b; Liu and Huguenard, 2020; Zhong et al., 2022). Suspended shellfish farms induce current reduction of surface water layer (He et al., 2022), generate turbulence (Stevens and Petersen, 2011) and increase water exchange time (Liu and Zhang, 2022). Also, there are many researchers have studied the typhoon-induced wave field and risk level using numerical wave model (He et al., 2020; Aydoğan and Ayat, 2021), such as SWAN (Simulating Waves Nearshore) model in Hainan Island (Jiang et al., 2023), Taiwan Island (Shih et al., 2018), and Guishan Island (Xianwu et al., 2021). While few studies have explored temporal-spatial distribution of wave fields around mussel farm during typhoons, and the risk levels of typhoon wave damage at different farming areas have not been assessed.
This study aimed to simulate the typhoon-induced wave field characteristics of a large-scale suspended mussel farm in Gouqi Island during typhoons, and to evaluate the risk level of significant wave height. The introduction of the study area, tropical cyclone data sources, SWAN model, and numerical model setup are presented in Section 2. In section 3, the model results are compared against the filed observations to evaluate the model performance. Model results of three kinds of typhoon paths and 16 kinds of constant wind forcing are analyzed in Section 4. The relationship between wind and wave and risk level of typhoon-induced wave are discussed in section 5. Conclusions and implications of this study are summarized in section 6.
2 Materials and methods
2.1 Study area
The Ma’an Archipelago, located in the northeastern region of Shengsi County, including Huaniao Island, Bixiashan Island, Lvhua Island, Gouqi Island and Shengshan Island (Figure 2B). The majority of existing suspended mussel farms are distributed along the island coastline, primarily situated in the northwest, southwest, and southeast waters. (Figure 2C). This location serves three purposes: first, the water depth is appropriate for aquaculture; second, it is handy for fisherman to salvage work; and third, the island will also act as a shelter during typhoons. In order to comprehensively assess the risk of typhoon-induced waves in this area, the locations are classified shown in Figure 2C as follows: current mussel farms (F1 to F5), undeveloped farming areas (S6 to S8) and the marginal points of the farms for assessing risk (R9 to R11). It is also vital to classify the typhoons impacting Gouqi Island. Because the rotating wind fields caused by the typhoons on different tracks are different, resulting in distinct local wind directions.
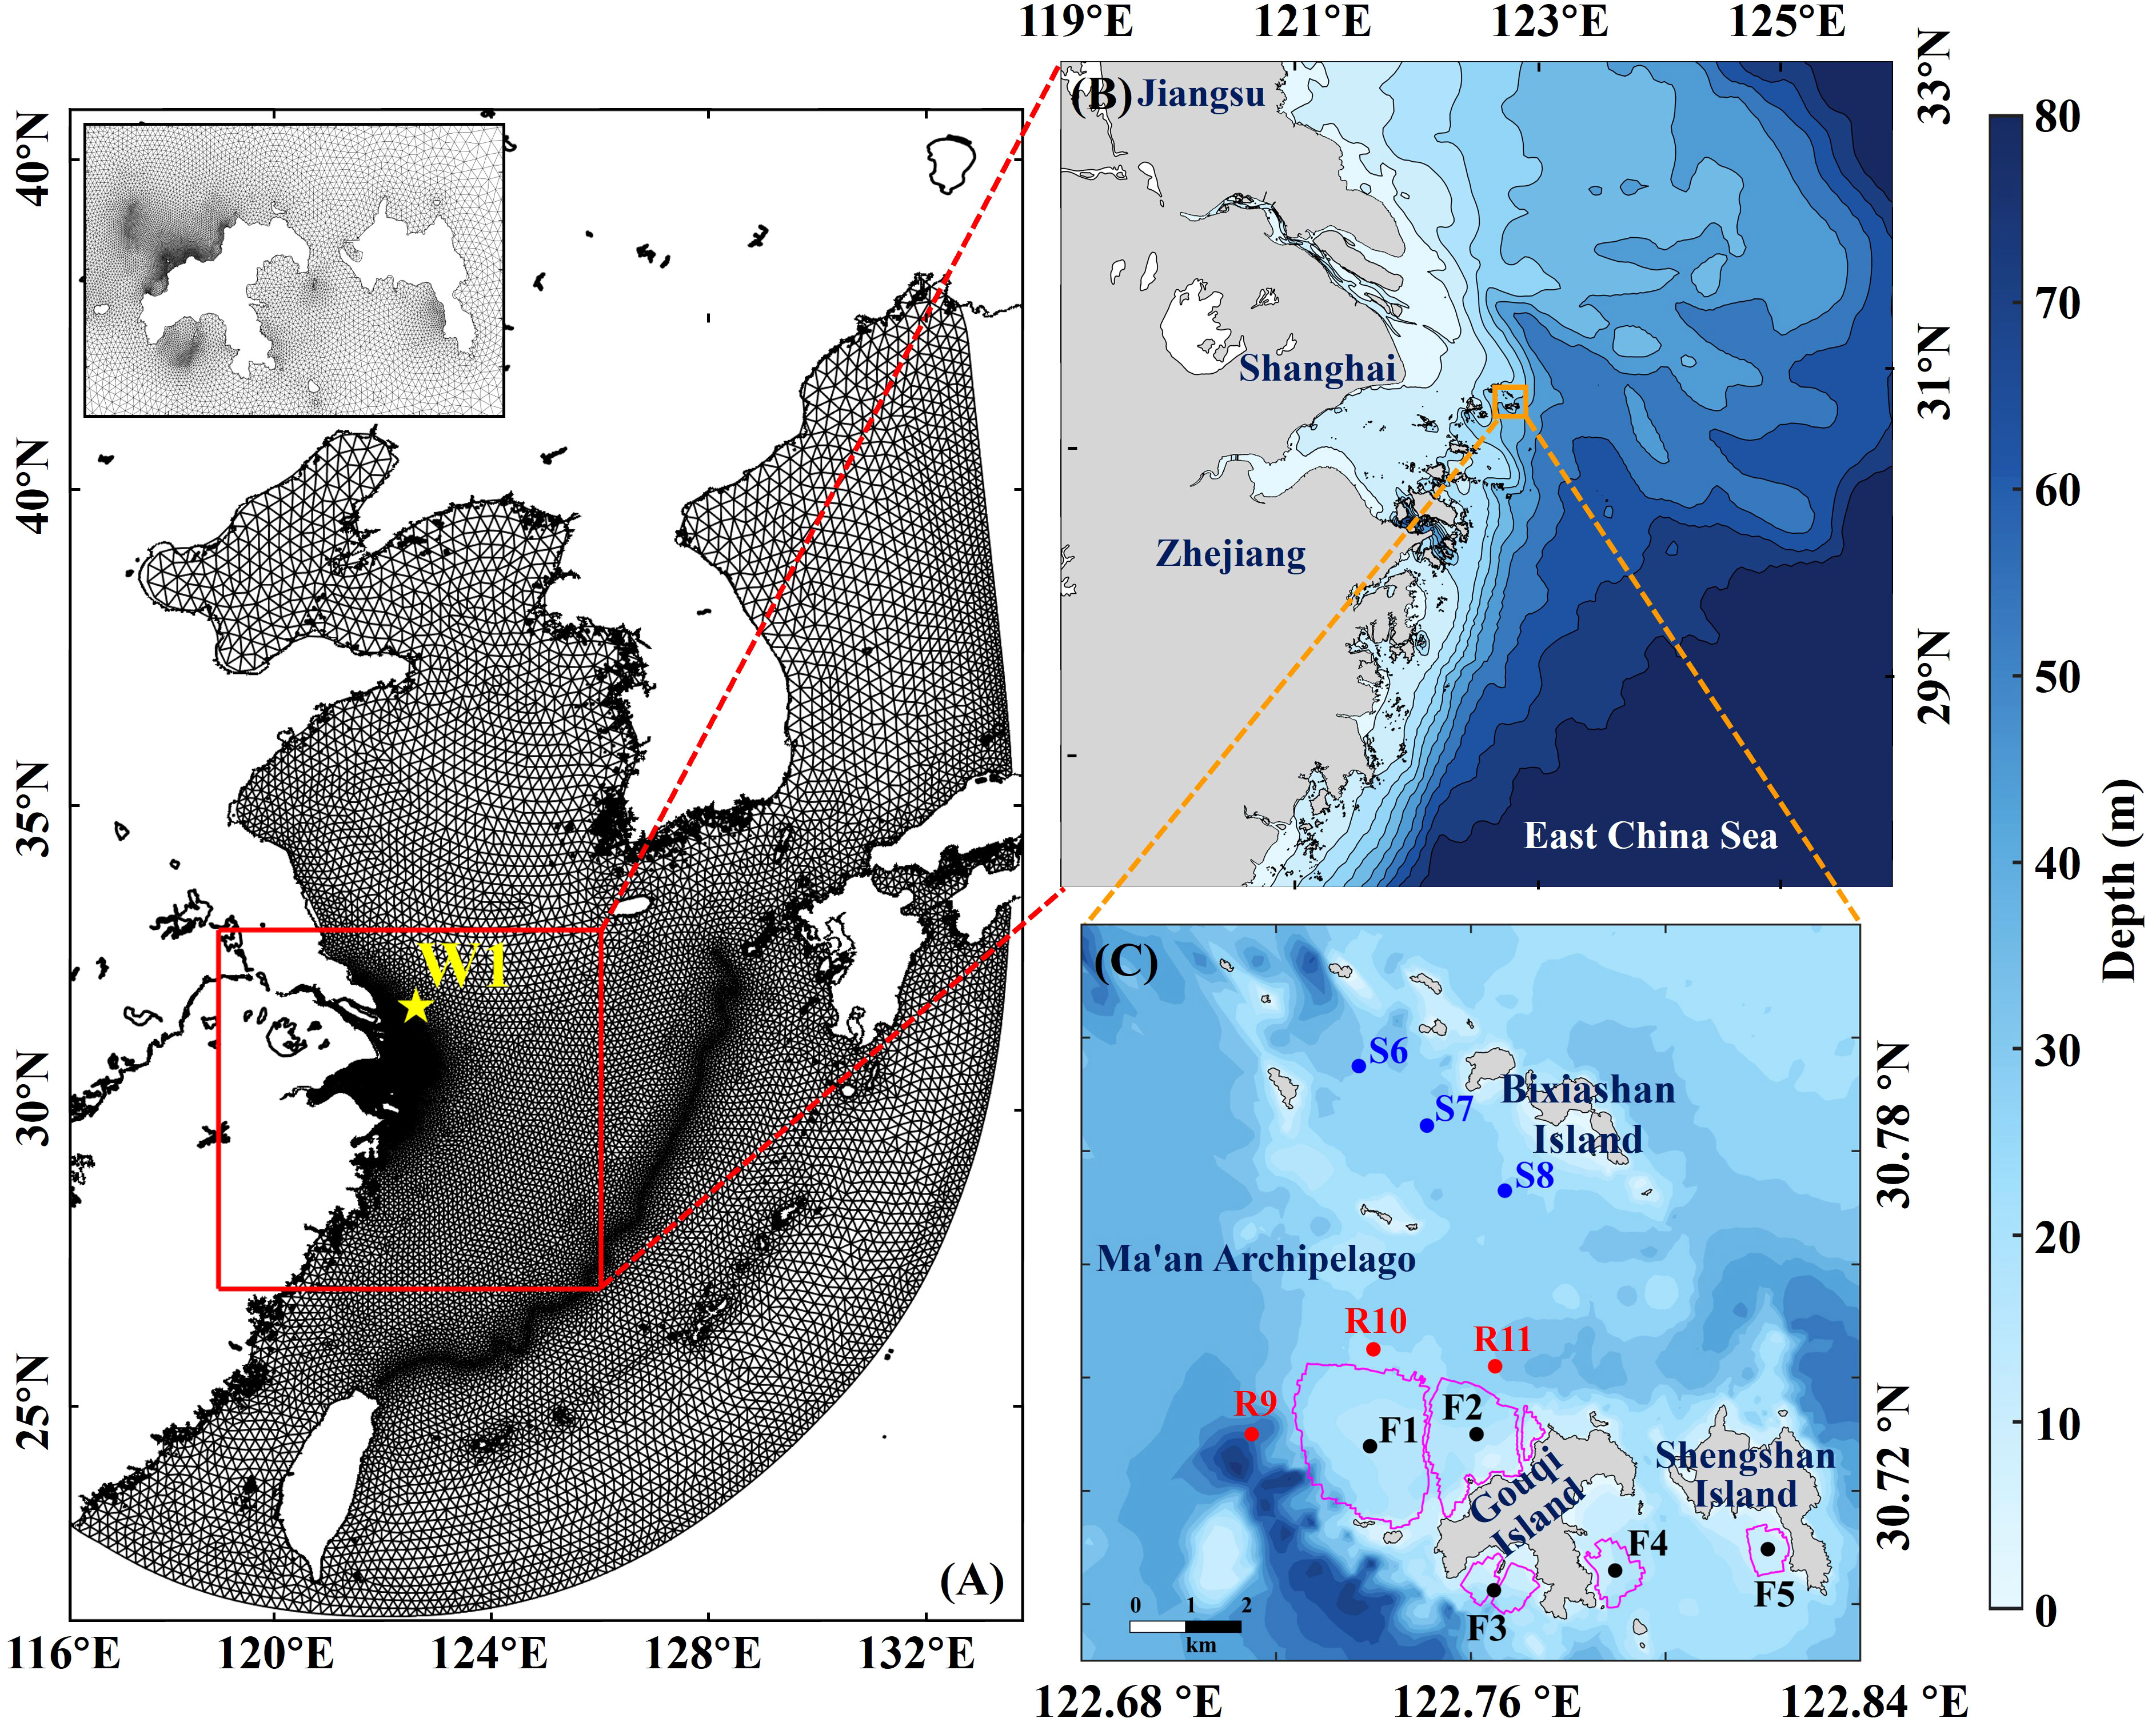
Figure 2 Map of the study area, wave buoy sites and model grid. (A) Geographic location of Changjiang Estuary (Red rectangle). The model domain and mesh. The wave buoy MF05003 is located at W1 (122°36′53.28″, 31°44′7.8″). (B) Geographic location of Gouqi Island. Orange rectangle indicates the range of Gouqi Island area. (C) Location of mussel farm indicated by black dots. From F1 to F5 represent current mussel farms. From S6 to S8 represent undeveloped farming areas by blue dots. From R9 to R11 represent the marginal points of the farms for assessing risk. The pink lines indicate the borderlines of current mussel farms.
2.2 Typhoon data
The data of typhoon tracks in the northwest Pacific Ocean from 2000 to 2022 is downloaded from the China Meteorological Administration Tropical Cyclone Data Center (https://tcdata.typhoon.org.cn/zjljsjj.html) (Ying et al., 2014; Lu et al., 2021), and the Tropical Cyclone Best Track Dataset of China Meteorological Administration on Central Meteorological Observatory Typhoon Network (http://typhoon.nmc.cn/web.html).
In this study, typhoons that pass within 300 km of Gouqi Island between 2000 and 2022 are categorized into three groups: (1) West sweep type (TPW), (2) Intermediate sweep type (TPM) and (3) East sweep type (TPE). The first type of typhoon track enters within 300 km of the center of the island, with the center of the typhoon situated on its western flank. The second is the typhoon center entering within a 100 km range of Gouqi Island and subsequently passed over Gouqi Island, before moving directly northward. The third type is within 300 km of Gouqi Island, and the center of the typhoon is located on the east side of the island.
Between 2000 and 2022, there were recorded instances of 16 typhoons that approached within a distance of 100 km, and 44 that entered at a range of 300 km without nearing a distance of 100 km. For each classification track, three typhoons were selected. The following are the primary selection criteria for these typhoons: (1) the typhoon center entered within 300 km. (2) The typhoon is moving across Gouqi Island or its surrounding, greatly affecting the island. (3) Given that TPW may make landfall more readily than the other two types, the wind speed of the typhoon center has to be greater than 17.20 m/s. (4) For TPM and TPE, the wind speed of typhoon center has to be greater than 32.70 m/s. Figure 3 illustrates the classification outcomes and the chosen typhoon tracks.
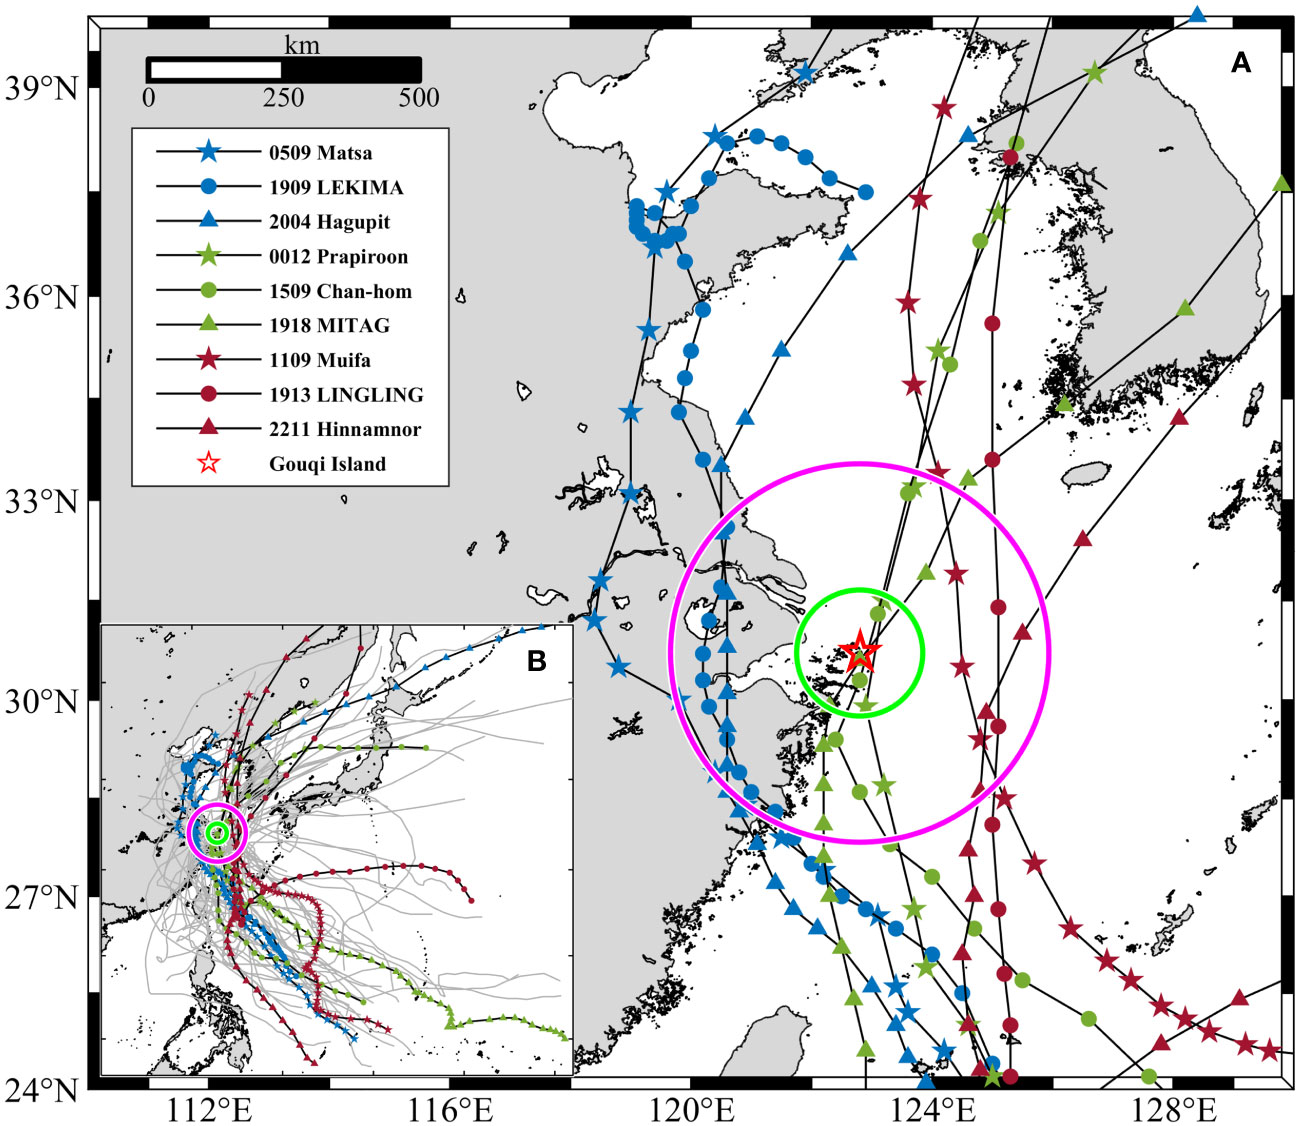
Figure 3 Typhoon tracks divided into three categories. The green and pink circles represent 100 km and 300 km circles centered on Gouqi Island, respectively. The nine selected typhoons are shown in (A). All typhoons that made landfall between 2000 and 2022 within a 300 km are represented by the solid grey line of (B). TPW, TPM, and TPE are indicated by blue, green and red respectively. The location of Gouqi Island is indicated by the red pentagram.
2.3 Numerical model
2.3.1 Wave numerical model
In recent studies, the most widely used wave models mainly include WaveWatch III model, WAM (Wave Model) and the aforementioned SWAN model. In this study, the third-generation near-shore shallow sea wave model SWAN41.31 developed by Delft University of Technology in the Netherlands is used to simulate the wind wave of Gouqi Island in Shengsi County, Zhoushan City, Zhejiang Province. In the SWAN wave model, the wave action balance equation is used, which has two kinds of Cartesian coordinate system and spherical coordinate system. The control equation in the spherical coordinate system used in this study is:
the terms on the left hand side of (Equation 1) λ is longitude, φ is latitude. Right side of (Equation 1), S represent source terms, including wind input, whitecapping, depth-induced breaking, bottom friction, absolute value of the triad wave-wave interactions and absolute value of the quadruplet wave-wave interactions. The governing equation of the S is expressed as follows shown in (Equation 2):
where Sin represents the input of wind energy, Sds denotes wave energy dissipation, where Sds,w denotes wave energy dissipation caused by white wave effect, Sds,b denotes wave energy dissipation caused by bottom friction, and Sds,br denotes wave breaking caused by water depth. Snl represents wave-wave nonlinear interaction, including the triad wave-wave interactions (Snl3) and the quadruplet wave-wave interactions (Snl4). Snl4 dominates the development of deep-sea wave spectrum technology, which can transfer wave energy from peak frequency to lower or higher frequency, Snl3 can convert wave energy from low frequency to high frequency, which plays an important role in shallow water.
2.3.2 Model setup
In this study, the model uses an unstructured mesh that accommodates complicated coastlines. The model mesh and bathymetry are shown in Figure 2. The entire mesh extent cover 21°N to 43°N, 116°E to 134°E. The mesh covers the entire East China Sea, with a total of 65039 nodes and a total of 33918 cells. For nearshore waters, especially the region around Gouqi Island and Shengshan Island, as well as the channels between mussel farms, grid resolution is higher than in the open sea. The resolution is about 20 m near Gouqi Island, about 200 ~ 500 m of Ma’an Archipelago, and about 11 ~ 15 km at the offshore boundary (Figure 2A).
It is very important to give an accurate wind field input file for the study of typhoon-induced wind waves. ERA5 (ECMWF Reanalysis v5) is the fifth generation ECMWF atmospheric reanalysis of the global climate covering the period from January 1940 to present. ERA5 is produced by the Copernicus Climate Change Service (C3S) at ECMWF. ERA5 provides hourly estimates of a large number of atmospheric, land and oceanic climate variables. The data cover the Earth on a 30km grid and resolve the atmosphere using 137 levels from the surface up to a height of 80km.
ERA5 includes information about uncertainties for all variables at reduced spatial and temporal resolutions. ERA5 provides hourly atmospheric, terrestrial and marine climate data with a resolution of 0.25° × 0.25°, it can provide data with wind speed and pressure at the typhoon center for the model. In this study, the ECWMF reanalysis (https://cds.climate.copernicus.eu/cdsapp#!/dataset/reanalysis-era5-single-levels?tab=form) of the horizontal wind at a height of 10m above the sea surface whit a spatial resolution of 0.25° × 0.25° is used as the wind field drive file. The observation data time interval is 1 h. The computational grid area of the wind field is bounded by 110°E-135°E and 20°N-45°N. The computational area of the wind field covers the calculation mesh in the SWAN model. The data of wind field in the calculation grid are linearly interpolated.
To investigate the response of the wave field in the mussel farming area of Gouqi Island to different wind directions, 16 different wind directions were set up in this study, which are N, NNE, NE, ENE, E, ESE, SE, SSE, S, SSW, SW, WSW, W, WNW, NW, NNW. The wind duration and wind speed are kept the same, respectively 15 days and 25m/s. The basis of this setting is that when the central wind speed of a tropical cyclone reaches 24.5m/s or more, it becomes a severe tropical storm, and the wind speed is stabilized at 25m/s for the discussion of the extreme case. In addition, the life span of a typhoon is around 3-10 days in general, but its life span can reach 15 days or more in special cases, so the modeling duration is set to 15 days.
3 Model validation
3.1 Wind speed and direction
In the present study, wave measurements are observed by the Acoustic Doppler Current Profiler (ADCP, RDI whs-300k) installed on buoys. The wave buoy MF05003 is located at W1 (122°36′53.28″, 31°44′7.8″), near the Yangtze River estuary (see Figure 2A). The observation time of the buoy MF05003 is from 8 June 2022 to 14 June 2023, output once every 30 minutes, receiving rate reached 99.5%.
The wind parameters of the data source were validated using wave buoy observations. The SWAN model runed from 1 June 2022 to the end of the observation period. Model results were evaluated by means of the skill score (SS) (Warner et al., 2005) and correlation coefficient (CC) (Allen et al., 2007), calculated by the following formula (Equations 3, 4):
where N represents the number of samples of time series, X is the variable and is the time average. Xmodel and Xobs are the predicted and observed value respectively, and are the average of the variables. Model performance levels evaluated by SS and CC are categorized as: >0.65 excellent; 0.65-0.5 very good; 0.5–0.2 good;< 0.2 poor (Maréchal, 2004; Allen et al., 2007).
The validation results of the wind data used to drive the wave model are presented in Figure 4 and Table 1. The verification period covers from June to October, which corresponds to the cycle of frequent typhoons. With a few differences in wind direction, the wind speed of ERA5 dataset compares the observed local wind data well, and the overall pattern remains consistent. The comparison results of SS and CC at field station W1 were all greater than 0.65 (Table 1). It is evidence that the ERA5 dataset compares very well with observed local wind speed and direction, indicating that it is can be used as the driving force dataset of the SWAN model.
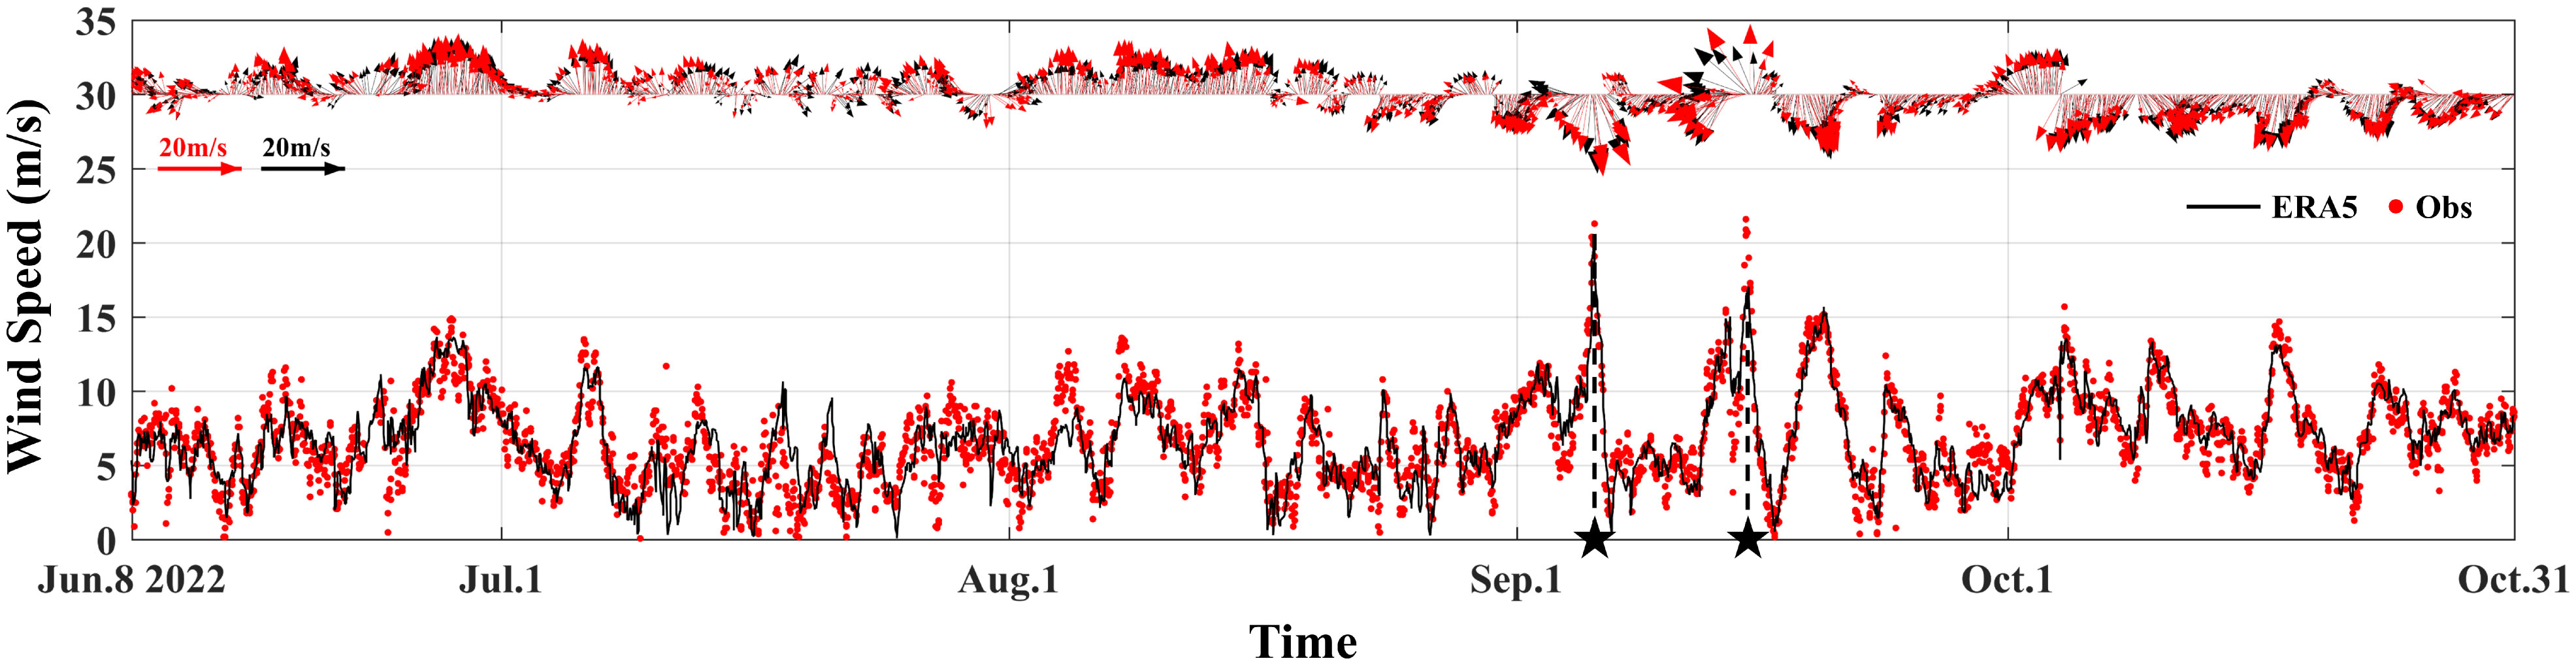
Figure 4 Model-data comparisons of wind speed and direction at W1 from 8 June 2022 to 31 October 2022. Solid black pentagram represents the occurrence time of a typhoon.
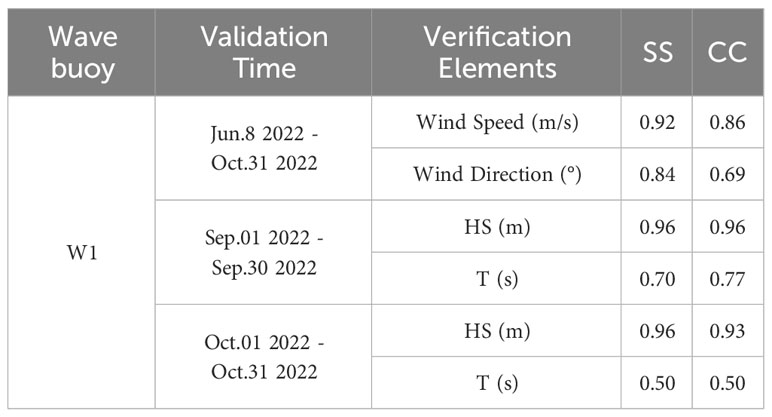
Table 1 Skill Score, Correlation Coefficient of Modeled Winds and Waves.
3.2 Wave significant height and period
The model results of the significant wave height and the average wave period were validated using the observed data of wave buoy. Comparison results of the observed and simulated data of the average wave period and significant wave height at station W1 was presented in Figure 5. Assessment results of model performance were shown in Table 1. Because three typhoons affected the East China Sea in September—Typhoon Hinnamnor (2022) on September 5, Typhoon Muifa (2022) on September 14, and Typhoon Nanmadol (2022) on September 18—there were three peaks in the wave height (Figure 5A).
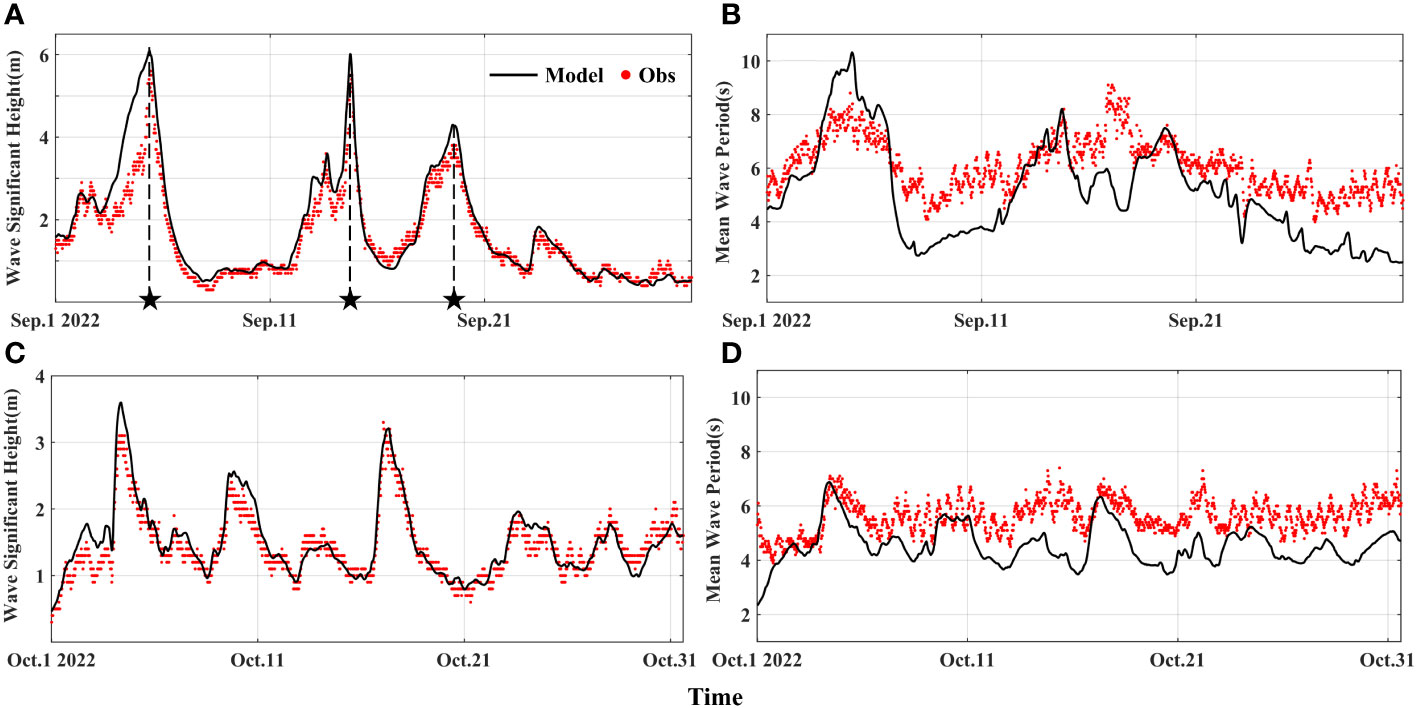
Figure 5 Comparisons between the observed wave parameters (red dots) and the simulated results (black line) from Sep.01 2022 to Sep.30 2022 at station W1 (A, B); from Oct.01 2022 to Oct.31 2022 at site W1 (C, D). The left panel represents the validated results of significant wave height, and the right panel represents the mean wave period of that. Solid black pentagram represents the occurrence time of a typhoon.
SS of significant wave height at station W1 in September 2022 and October 2022 were 0.96 and 0.96, respectively, indicating model performance is good. The CC were 0.96 and 0.93, respectively, indicating model performs excellent on the simulation of significant wave height. The model performs well in simulating the impact of typhoons on significant wave height. The maximum difference between the simulated and observed wave period was about two seconds (Figures 5B, D). The evaluation results of wave period at station W1 was greater than 0.5, ranking “good”. In general, the SWAN model reproduced the temporal variation of significant wave height and period well during typhoon period, and better captured the wave eruption and dissipation processes, indicating that it could be used to study the characteristics of typhoon-induced wave around Gouqi Island (Jiang et al., 2023).
4 Model results
4.1 Statistical characteristics of typhoon-induced winds and waves
In order to understand the relationships between local wind direction and wave field during typhoon, this study simulated the wave field caused by typhoons entering the 300 km range of Gouqi Island from 2000 to 2022, a total of 60 typhoons (Figure 3B). The statistical results of local wind and wave during 60 typhoons in different stations of mussel farms are shown in Figure 6.
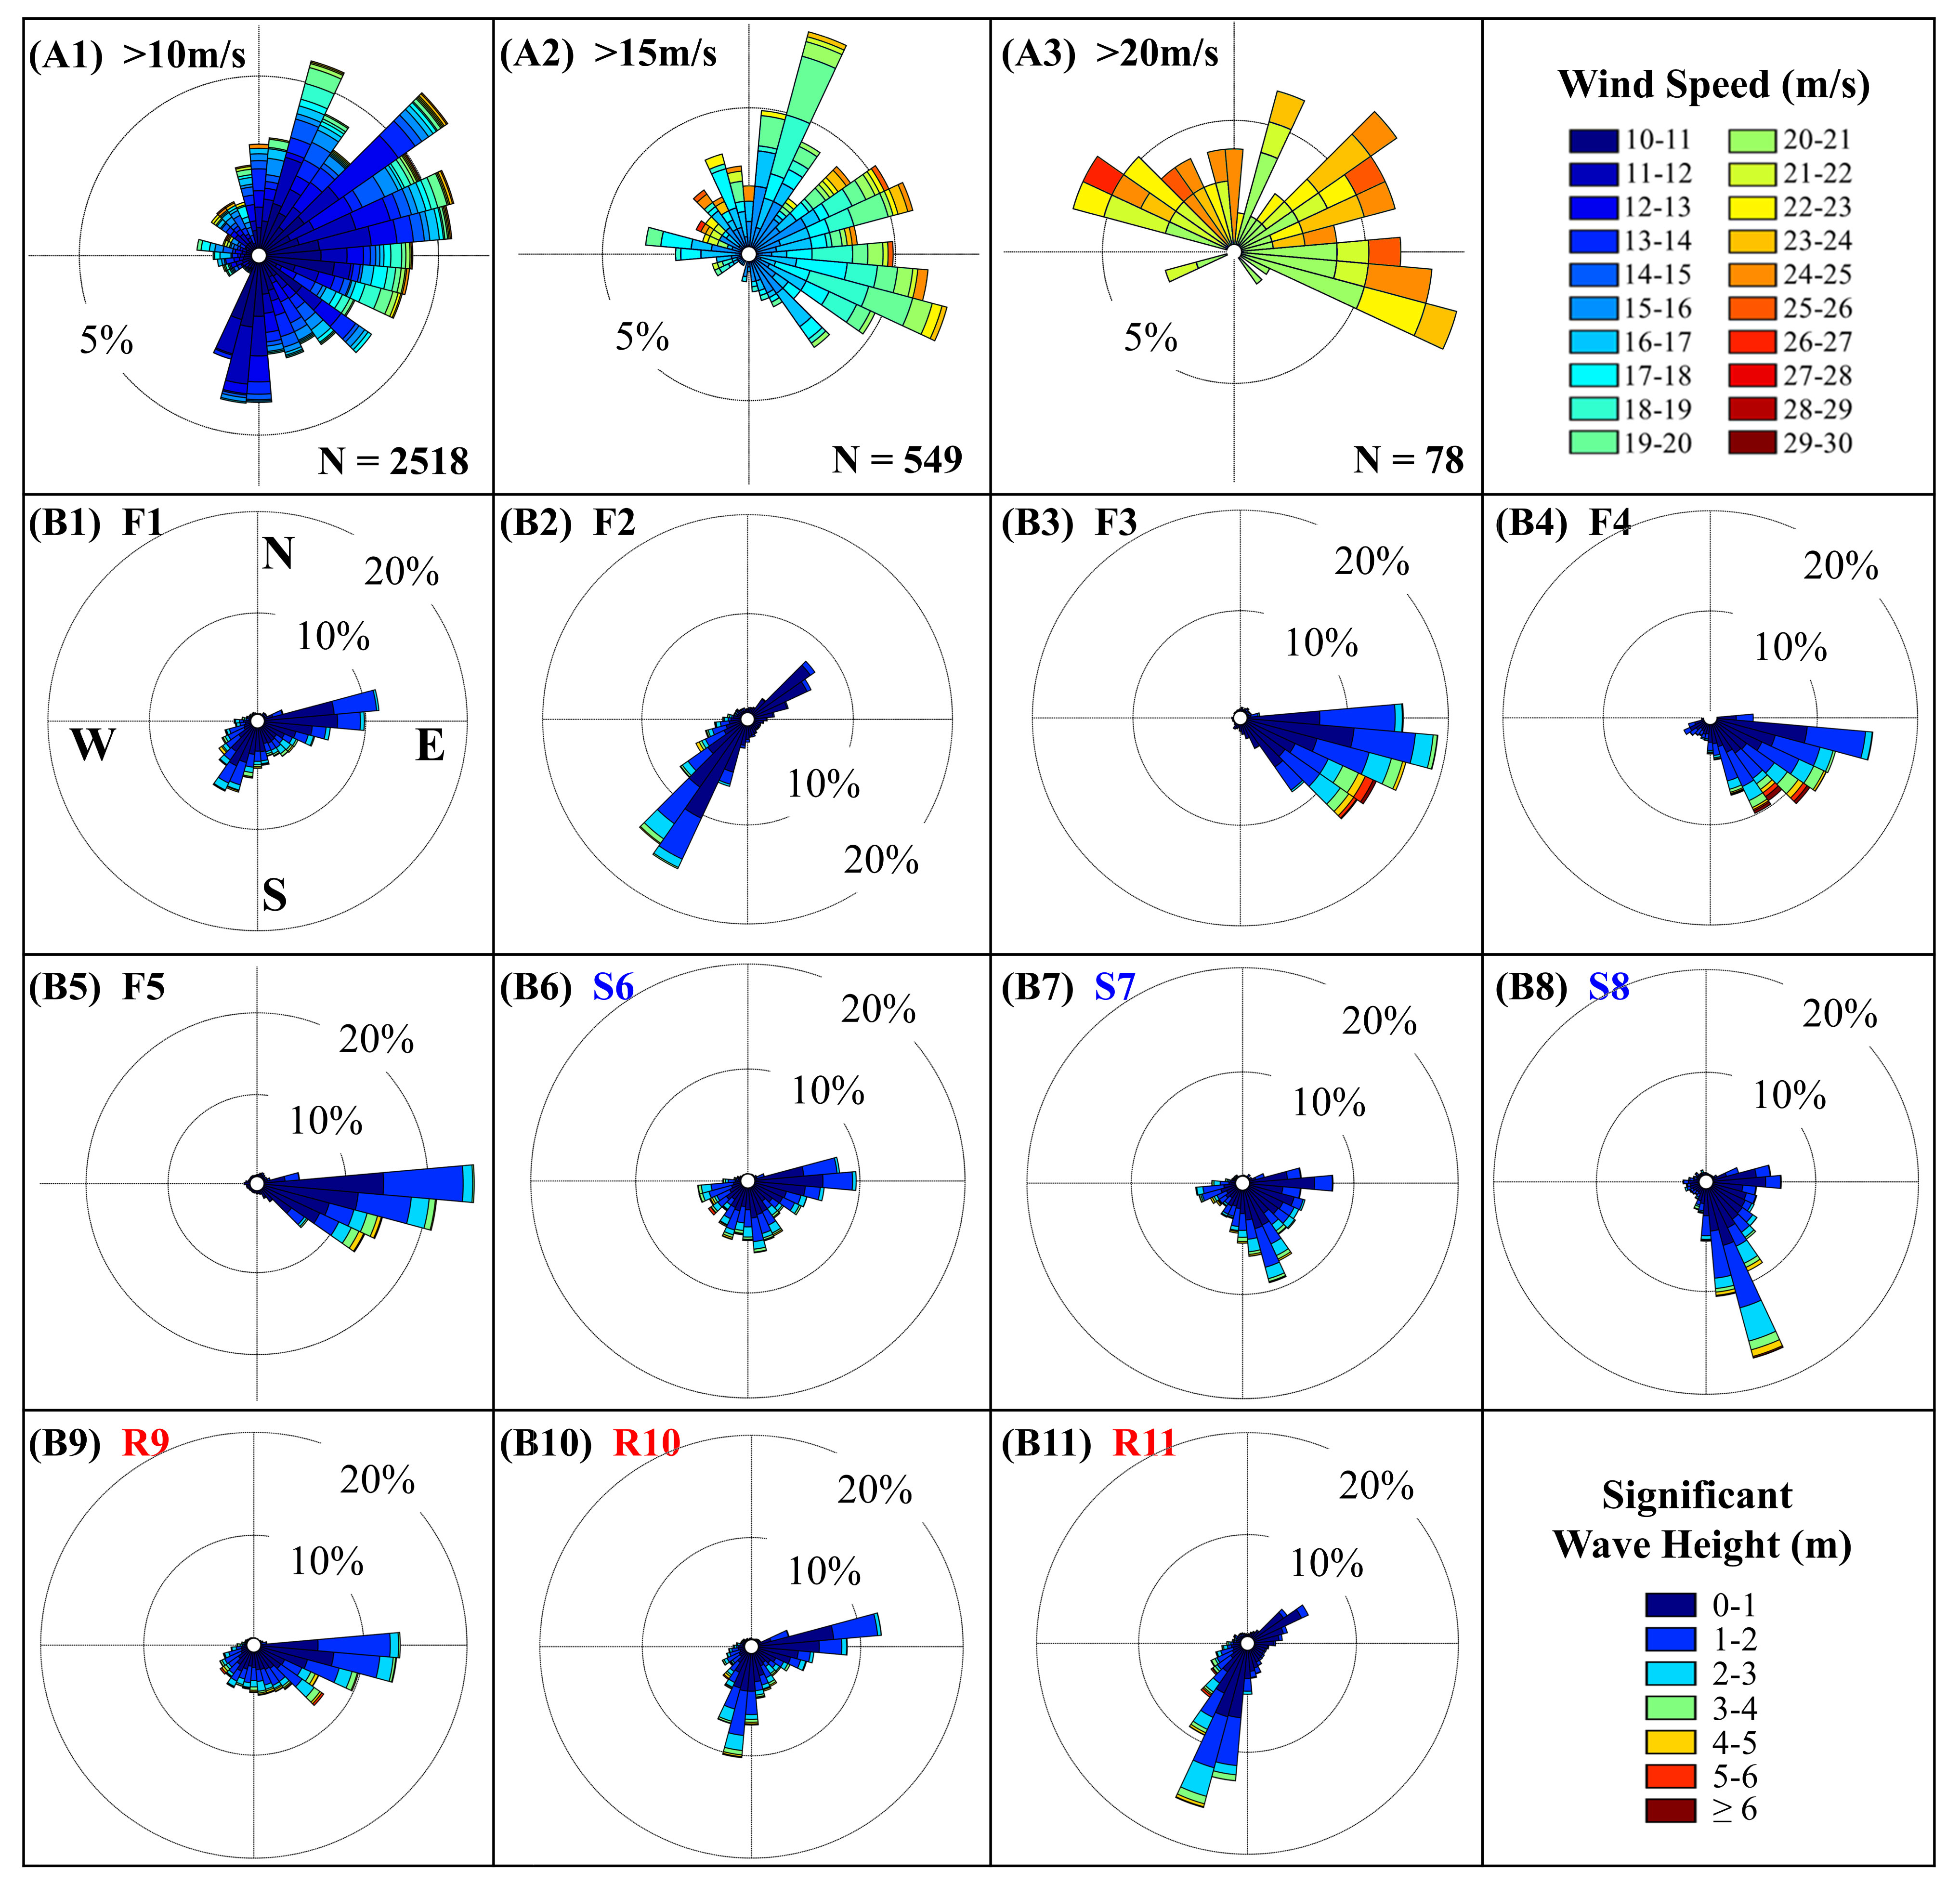
Figure 6 Wind field and wave rose during typhoons within 300 km of Gouqi Island from 2000 to 2022. (A1-A3) represent the wind roses, where N denotes the number of total samples. (B1-B11) represent the wave roses at different stations around the mussel farms.
Results showed that local wind greater than 10 m/s during typhoons mainly occurred in the NE, E, SE, and S, more than 15 m/s in the NE, E and SE, and wind speeds of 15 to 22 m/s occur most frequently (Figure 6). The majority of wind speeds over 23 m/s are located in the NE-E-SE direction, while the northwest is also home to the greatest wind speed of 27 m/s. It is evidence that waves generated by winds are easier influence the southwest and southeast farming area of Gouqi Island.
It should be noted that most of the reanalysis data products are generated after a series of algorithmic corrections using satellite monitoring data and measured data. It is often difficult for satellites to obtain accurate data for typhoon centers that move at high speeds. Therefore, the ERA5 wind field data used as an input file does not reflect the maximum instantaneous wind speed during typhoons, this results in an underestimation of the typhoon disaster by the simulation process (Zhang et al., 2003; Hersbach et al., 2020).
During typhoons, F1 and F2, which are to the north of the island, both have southwest waves (Figure 6). For F1, the south waves are also higher, and it can reach to about 6 m. F3, F4, and F5 are mainly affected by waves from the southeast, among which F4 is the riskiest farm, and the wave height in the southeast direction can reach more than 8m. The wave heights of R9, R10 and R11 at the edge of the mussel farm are much higher than those of F1, and the occurrence frequency of 5~6 m waves increase to more than 10%. This suggests that the waves will bypass the island and that further west or north of the farming area will be at greater risk. For S6, S7 and S8, the wave height of S8 can reach up to 6~7 m, and the wave comes from the southeast. Under the protection of the islands on both sides of S6 and S7, the waves mainly come from the southwest during the typhoon, and the frequency of 4~5 m wave height is less than 10%.
Wind fetch, wind speed, and duration of winds are the primary factors influencing the properties of the wave field. Under the constant wind fetch, wave heights increase with longer time of wind durations and higher wind speeds. Most of the local winds affecting Gouqi Island come from the northwest, north, northeast, east, southeast and south, but the frequency of wave direction occurred distribution in the aquaculture area is different from the wind direction, which is mainly due to the temporal and spatial differences of the local wind in the island and mussel farms.
4.2 Characteristics of typhoon-induced wave fields under three paths
Among the three typhoon track types mentioned above (TPW, TPM and TPE), three typical typhoons were selected from each category to simulate the wave field. A typical typhoon is selected from each category for analysis here, including Matsa, Chan-hom and Muifa. The spatial distributions of global and local wave fields before, during, and after the passage of three typical typhoons are shown in Figure 7. The time series of significant wave heights at different locations (F1 to F5 and S6 to S8) during typhoons in mussel farming areas are shown in Figure 8.
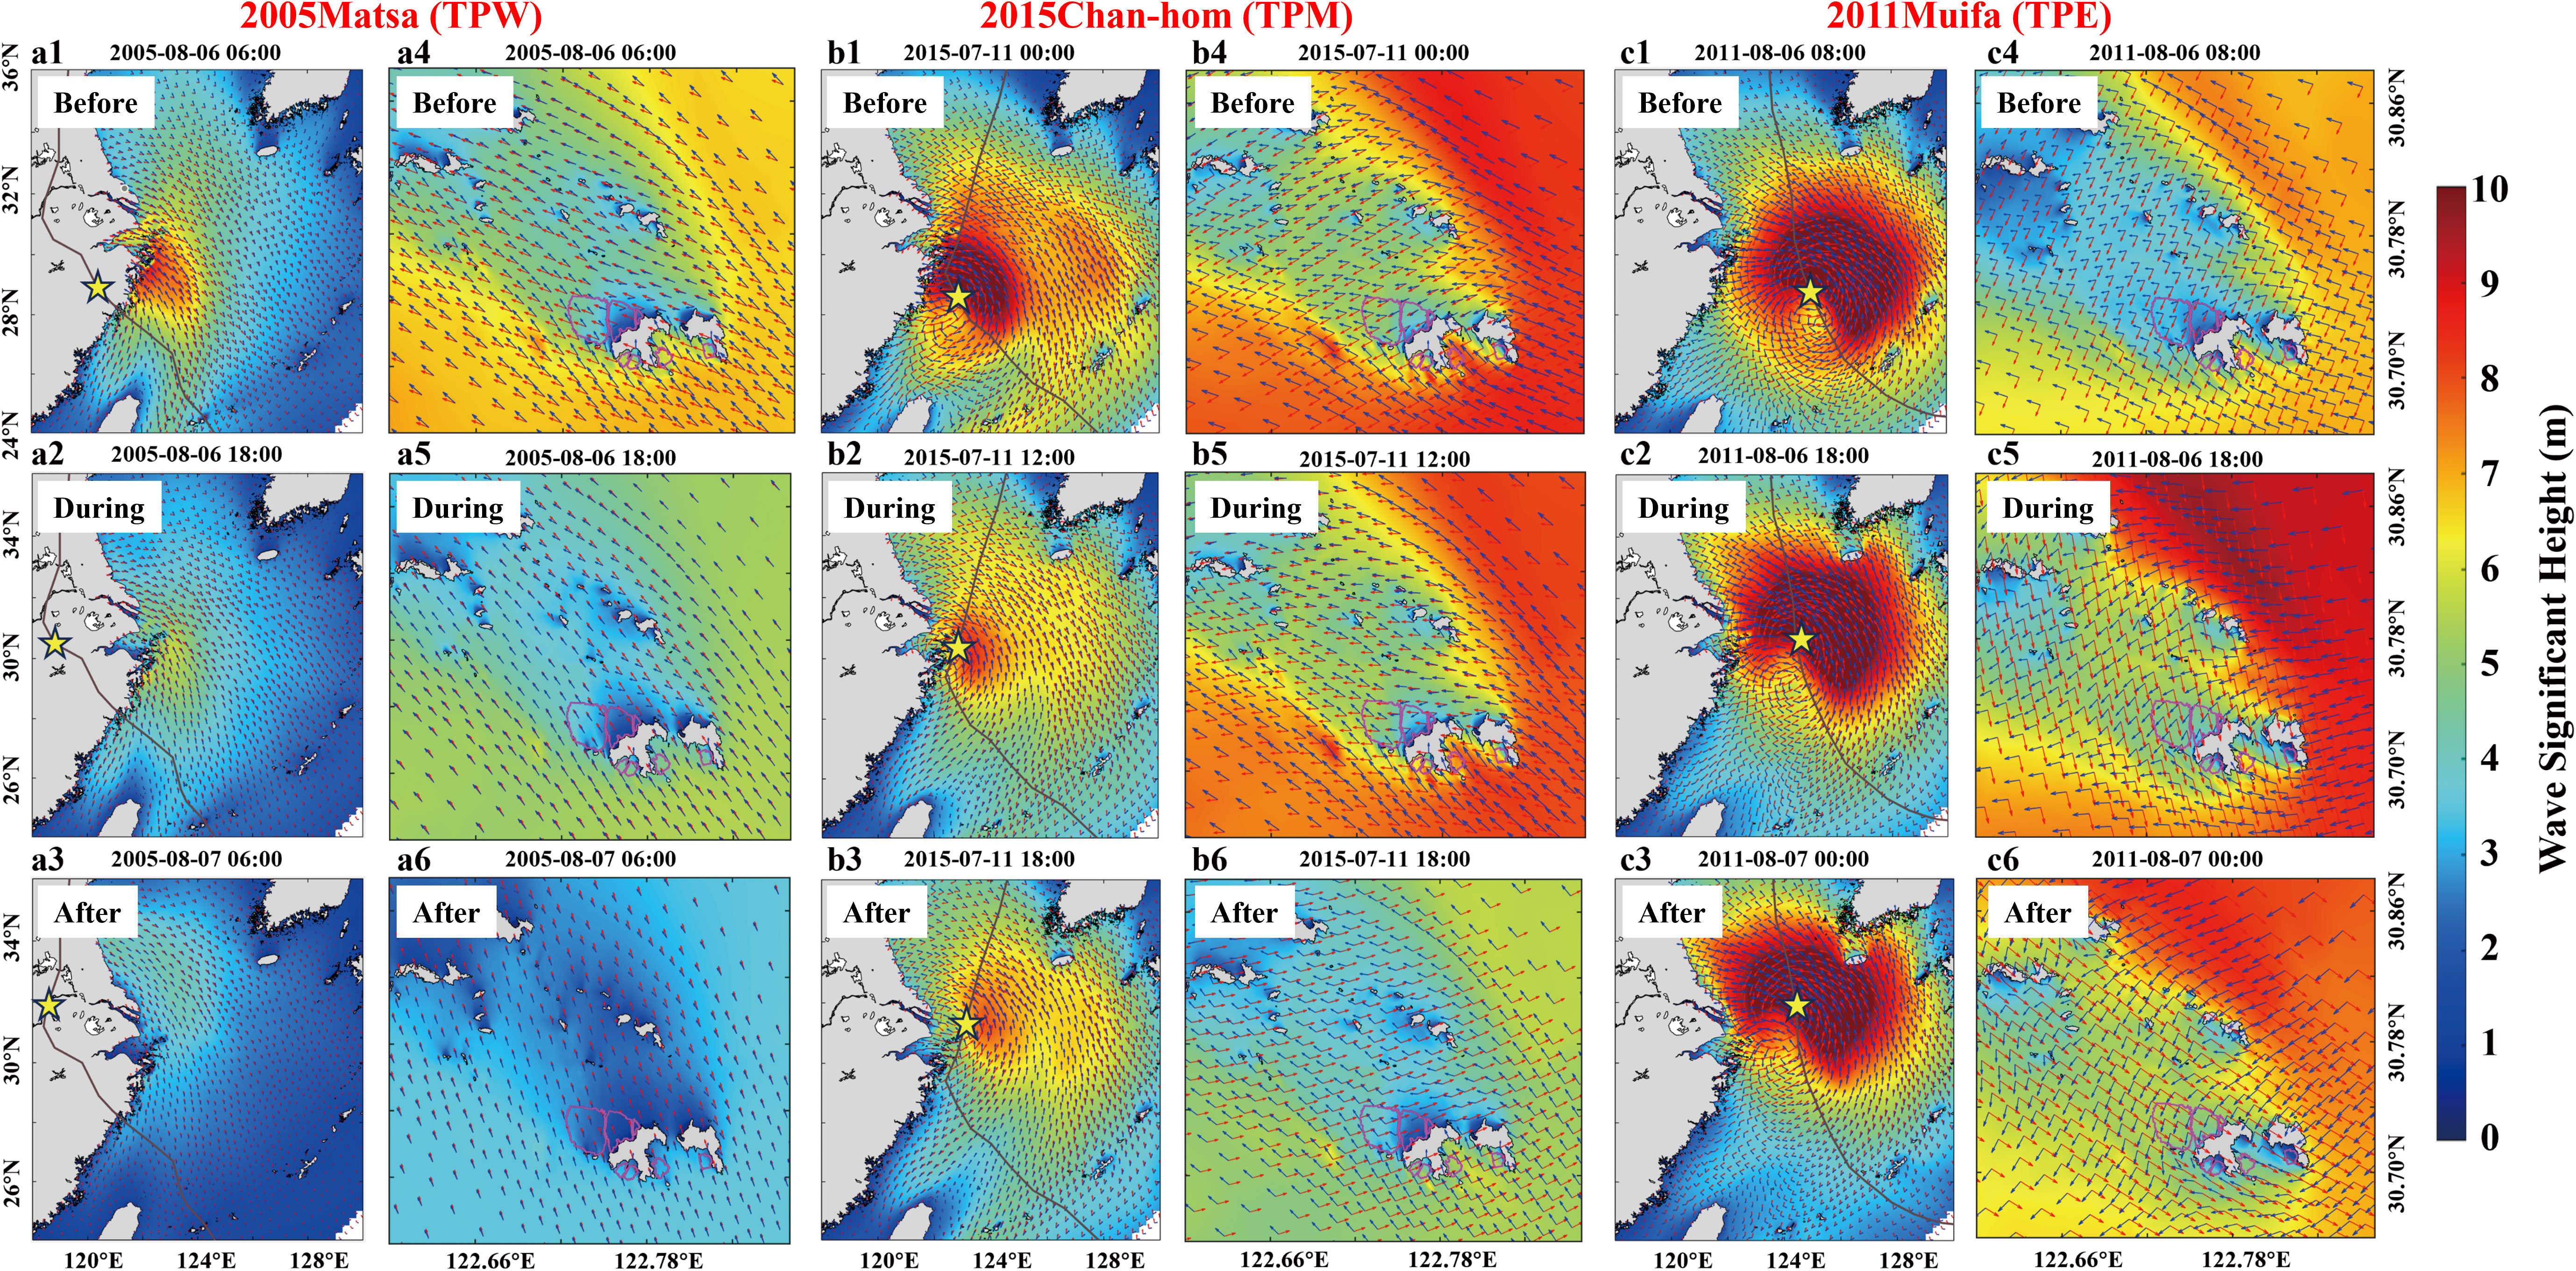
Figure 7 Modeled spatial distribution of wind and wave fields in the global and mussel farming area of before, during and after the passage of the typhoon under the three paths. Left two panel (a1-a6) represents the results of type TPW (Matsa), middle two panel (b1-b6) represents type TPM (Chan-hom), and the right two panel (c1-c6) represents type TPE (Muifa). The red arrow indicates the wind direction, the length of the arrow indicates the wind speed, the blue arrow indicates the wave direction, and the length of the arrow indicates the speed of wave propagation. The black solid line represents the typhoon path, the yellow pentagram represents the location of the typhoon center, and the pink line represents the existing mussel farms.
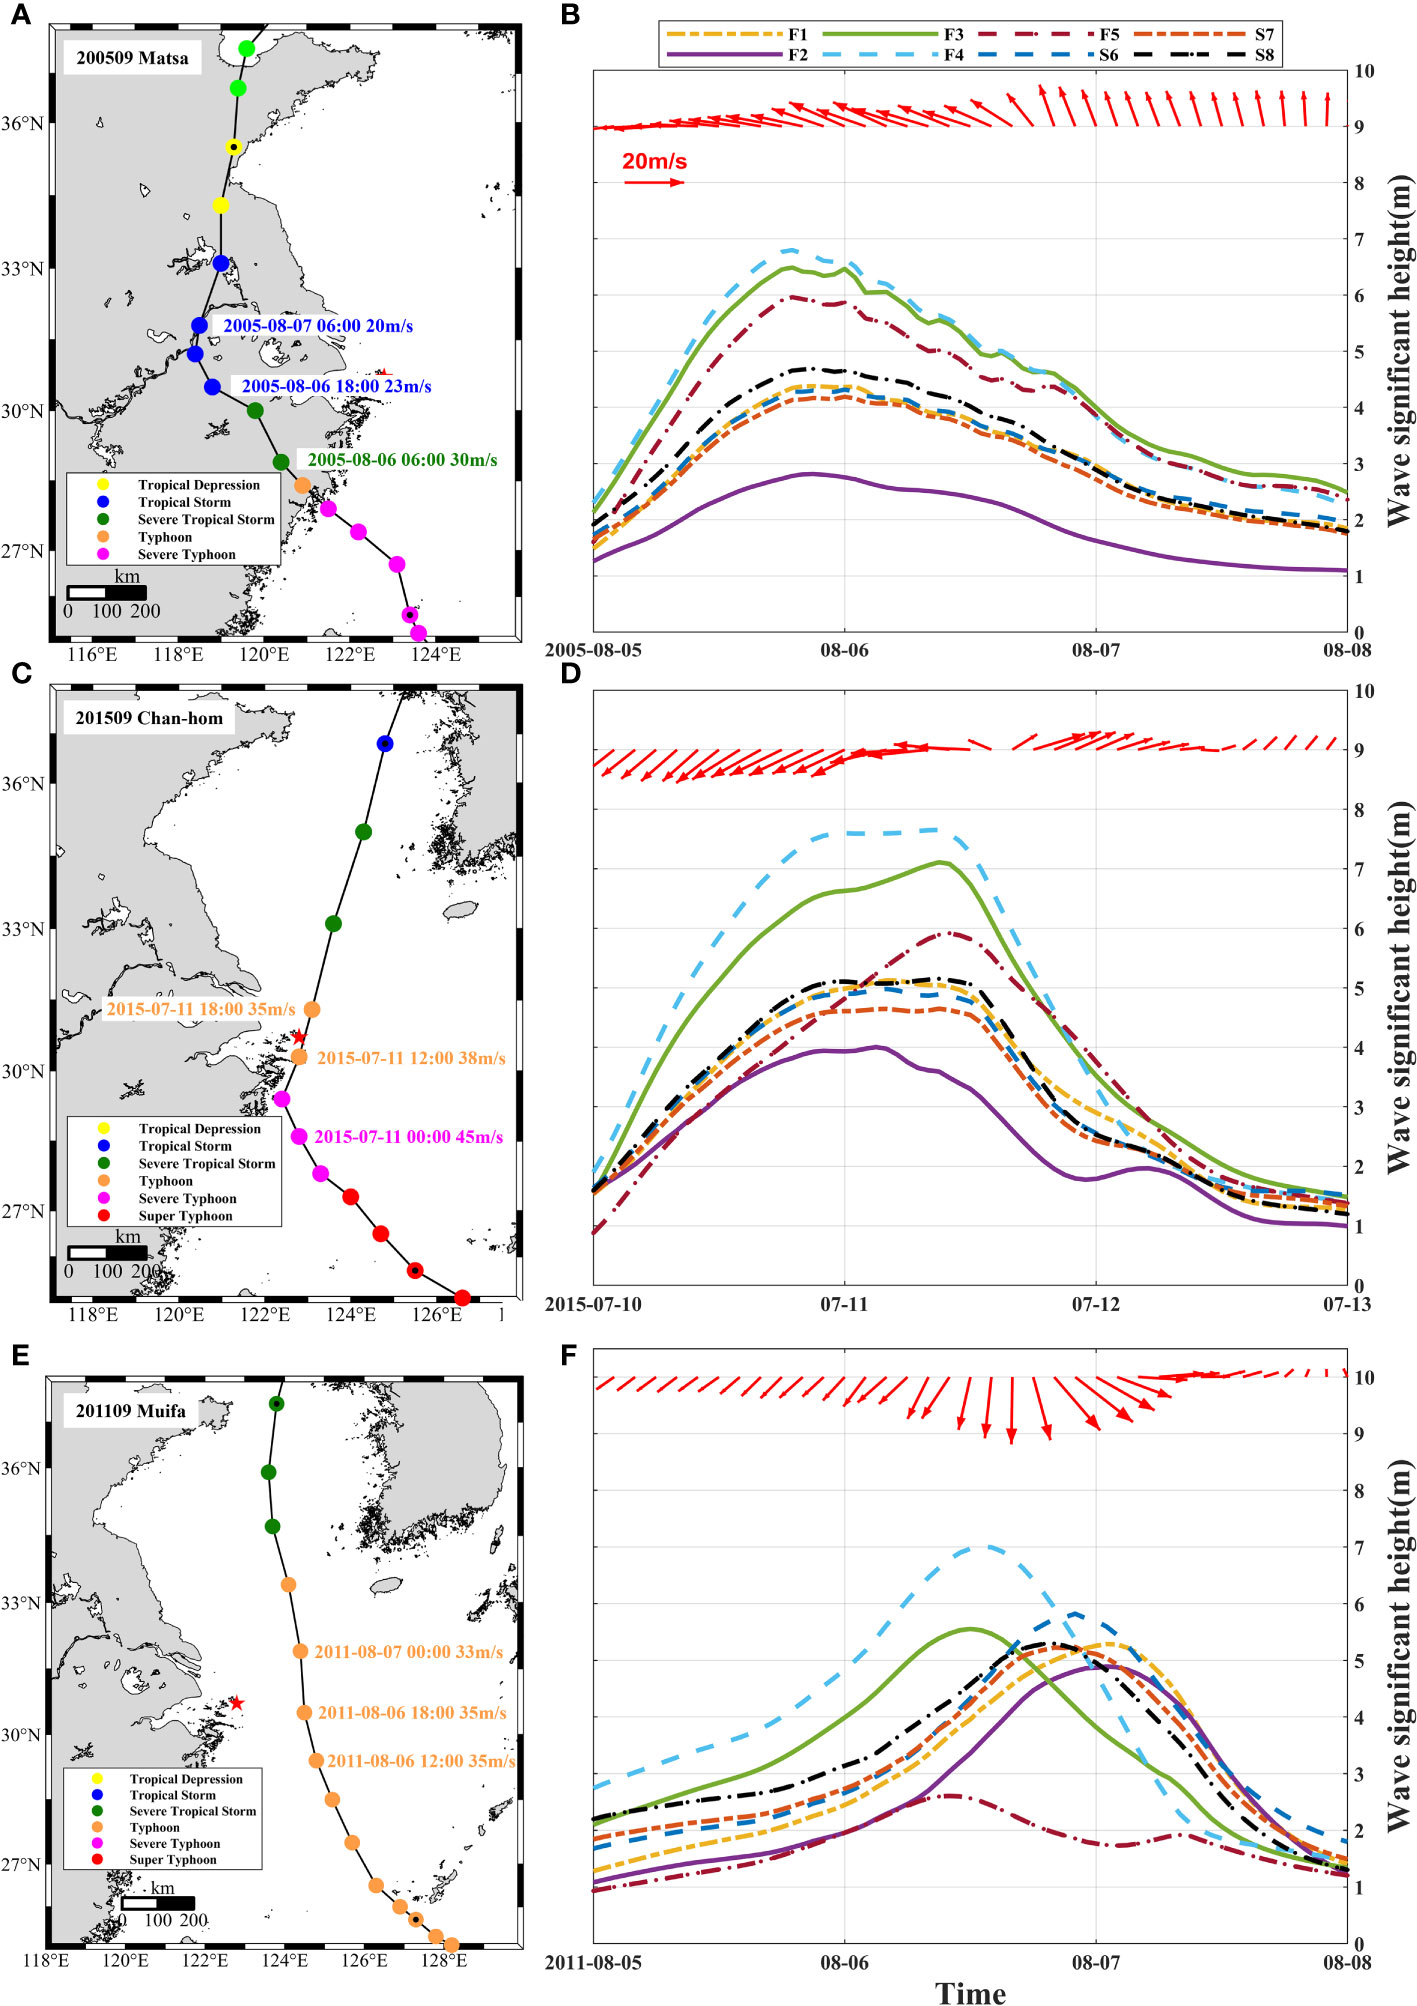
Figure 8 Time series of significant wave heights at different stations (From F1 to F5 and S6 to S8) in the mussel farm during the passage of typhoons of three paths (TPW, TPM and TPE). (A, B) represents Typhoon Matsa. (C, D) indicates Typhoon Chan-hom. (E, F) represents Typhoon Muifa. The red arrows in the right panels indicate the direction and magnitude of local wind at Gouqi Island.
In terms of type TPW (Matsa), the center of the typhoon is always located to the west of Gouqi Island (Figure 7A1-A3), and the local wind direction in the study area changes from east to southeast (Figure 7A4-A6). The wave heights at station F1 and F2 are much smaller due to the blockage of the island. The center of TPW typhoon is still moving northward and is getting weaker. Eventually, the winds will gradually turn southward.
Wind direction of TPM (Chan-hom) changes from NE to ESE when the center of the typhoon is still at low latitudes. The local wind direction stayed to the southeast with the center of the TPM reaching Gouqi Island, and at this time the wave height in the sea had reached 8m. The center of the typhoon passed through island and continued to move northward, under the influence of the rotating wind field, the local wind direction changed to WSW, due to the lagging nature of the wave field, the waves are still coming from the southeast. F3, F4 and F5 are easily damaged by waves come from southeastern (Figure 7B).
The center of TPE (Muifa) is situated to the east of the island, and the local wind direction changed from NNE to NNW and finally to NW (Figure 7C). Wave direction changes from SE to NE due to swell domination. With changes of the wave direction, the significant wave height at F4 is the largest initially, while growing progressively greater at F1 and F2.
The time series of wave height changes during typhoons in different location of the aquaculture area are also different (Figure 8). TPW (Matsa) has moved to 25.60°N on August 5, with a maximum wind speed of 45 m/s, and has developed into a severe typhoon. At this time, Gouqi Island was already affected by the outer edge of the Matsa, and the swell of farming area was less than 3m, and the wind direction was east. Then Matsa made landfall in Zhejiang and weakened into a typhoon, with a maximum wind speed of 35 m/s. When it moved to the same latitude with Gouqi Island, the intensity of Matsa have weakened into a tropical storm, with the maximum wind speed of 23 m/s and local wind direction is southeast (Figure 8A). Meanwhile, station F4 has the biggest significant wave height, about 7 m, due to there is no sheltering of the island and waves coming from the southeast. Slightly lower than F4 and similar to F5, F3 is situated southwest of Gouqi Island. Nevertheless, diffracted waves have the ability to increase its wave height to about 7 m (Figure 8B). Similar patterns and wave heights in F1, S6, S7, and S8 suggest that new mussel farms can be considered. Since F2 is shielded by the island, it always has the lowest wave height.
For TPM (Chan-hom), wave heights of F1 to S8 continue to increase, due to the impact of northeast wind. The wave height of F4 is always greater than that of other stations during Chan-hom, with the maximum value can reach 7.5 m/s. As the typhoon eye approaches Gouqi Island, the wind is coming from the east and the waves are propagating from the southeast, reaching a maximum wave height of F3, F4 and F5 in the absence of island protection (Figure 8D). The wave heights of F1, S6, S7 and S8 are comparable, whereas F2 remains the smallest.
There is a noticeable temporal variation in the wave height fluctuation during the passage of TPE type (Muifa). The wave heights of F3 and F4 increase first when the typhoon center is lower than the latitude of Gouqi Island. As the typhoon center moves northward, the wave direction shifts from southeast to northeast, the wave height of the northern culture area rises, and F3 and F4 start to decrease (Figure 8F). In conclusion, the TPW and TPM exhibit their maximum wave heights when the center of the typhoon is situated at a low latitude. While the peak wave height for TPE type occurs when the center is located at an identical latitude.
4.3 Characteristics of wave fields under extreme wind conditions
In view of the complexity of the typhoon path, in addition to analyzing the characteristics of the actual typhoon waves, in order to more comprehensively evaluate the spatial distribution characteristics of typhoon waves in mussel farms, we chosen the typical wind speed of 25 m/s and simulated wave fields under the driving of 16 kinds of wind directions. Overall, the wave field surrounding Gouqi Island is dominated by the N, NE, ESE, and S wave directions without considering the blocking effect of islands (Figure 9). In the extreme situation, the wave heights of F1 and F2 are smaller, while the farms located in the southwest and southeast of the island are higher, even experiencing huge waves of 14m. The highest significant wave height will reach its maximum value in 48 hours, based on 15 days of winds at 25 m/s. However, not many typhoons are able to stay in one place for longer than 12 hours in reality, therefore it is important to be aware of typhoons with unusual paths and extended lives.
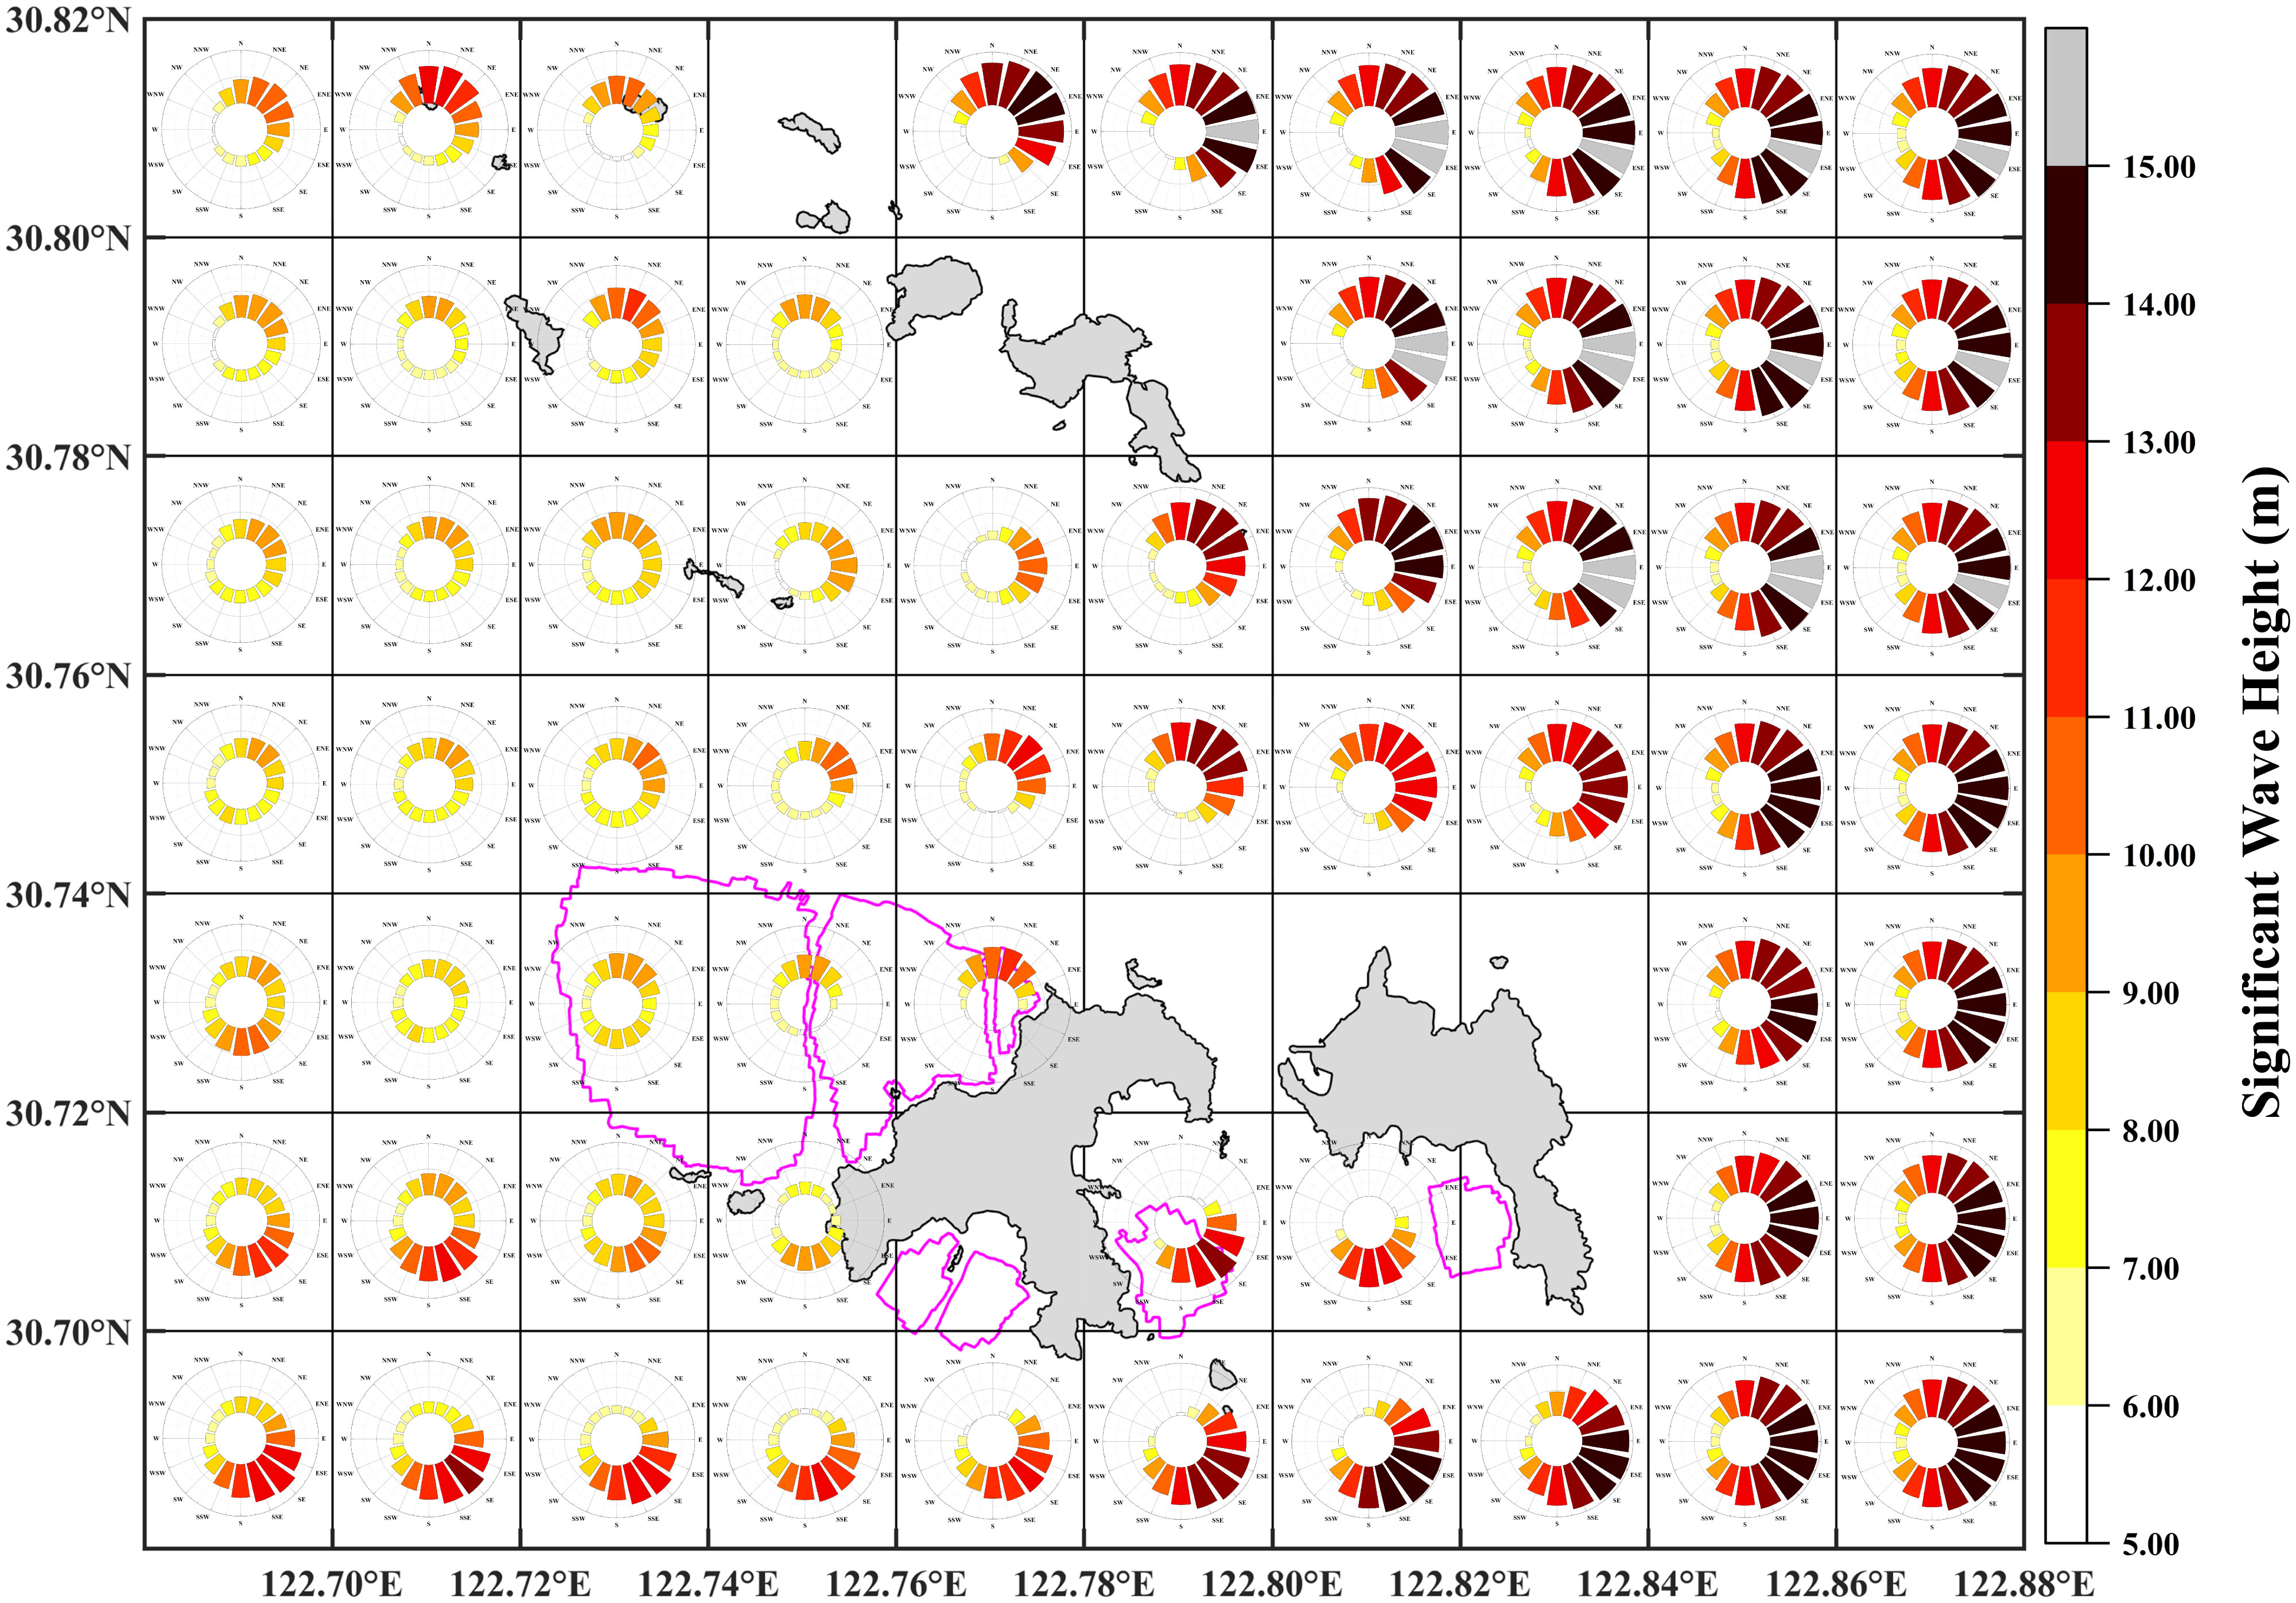
Figure 9 Spatial distribution of wave rose under extreme wind conditions (25 m/s) in 16 wind directions around mussel farms. The wave height in each direction of the Wind Rose chart is the maximum wave height in that direction.
Modeled results of significant wave height under extreme wind conditions at different stations of mussel farms are shown in Figure 10. There is a maximum wave height about 9 m of F1 and F2 under the wind of NNE direction (Figure 10). F1 and F2 have the minimum wave height when the wind direction is southeast, due to the island can block the wind and waves. In particular, because F1 is situated to the west of F2, waves from the southeast are avoided, resulting in the wave height of F1 being higher than F2 overall. As a result, the F1 wave height minimum happens when the wind direction is ESE, while the F2 wave height minimum is occurred during SSE wind.
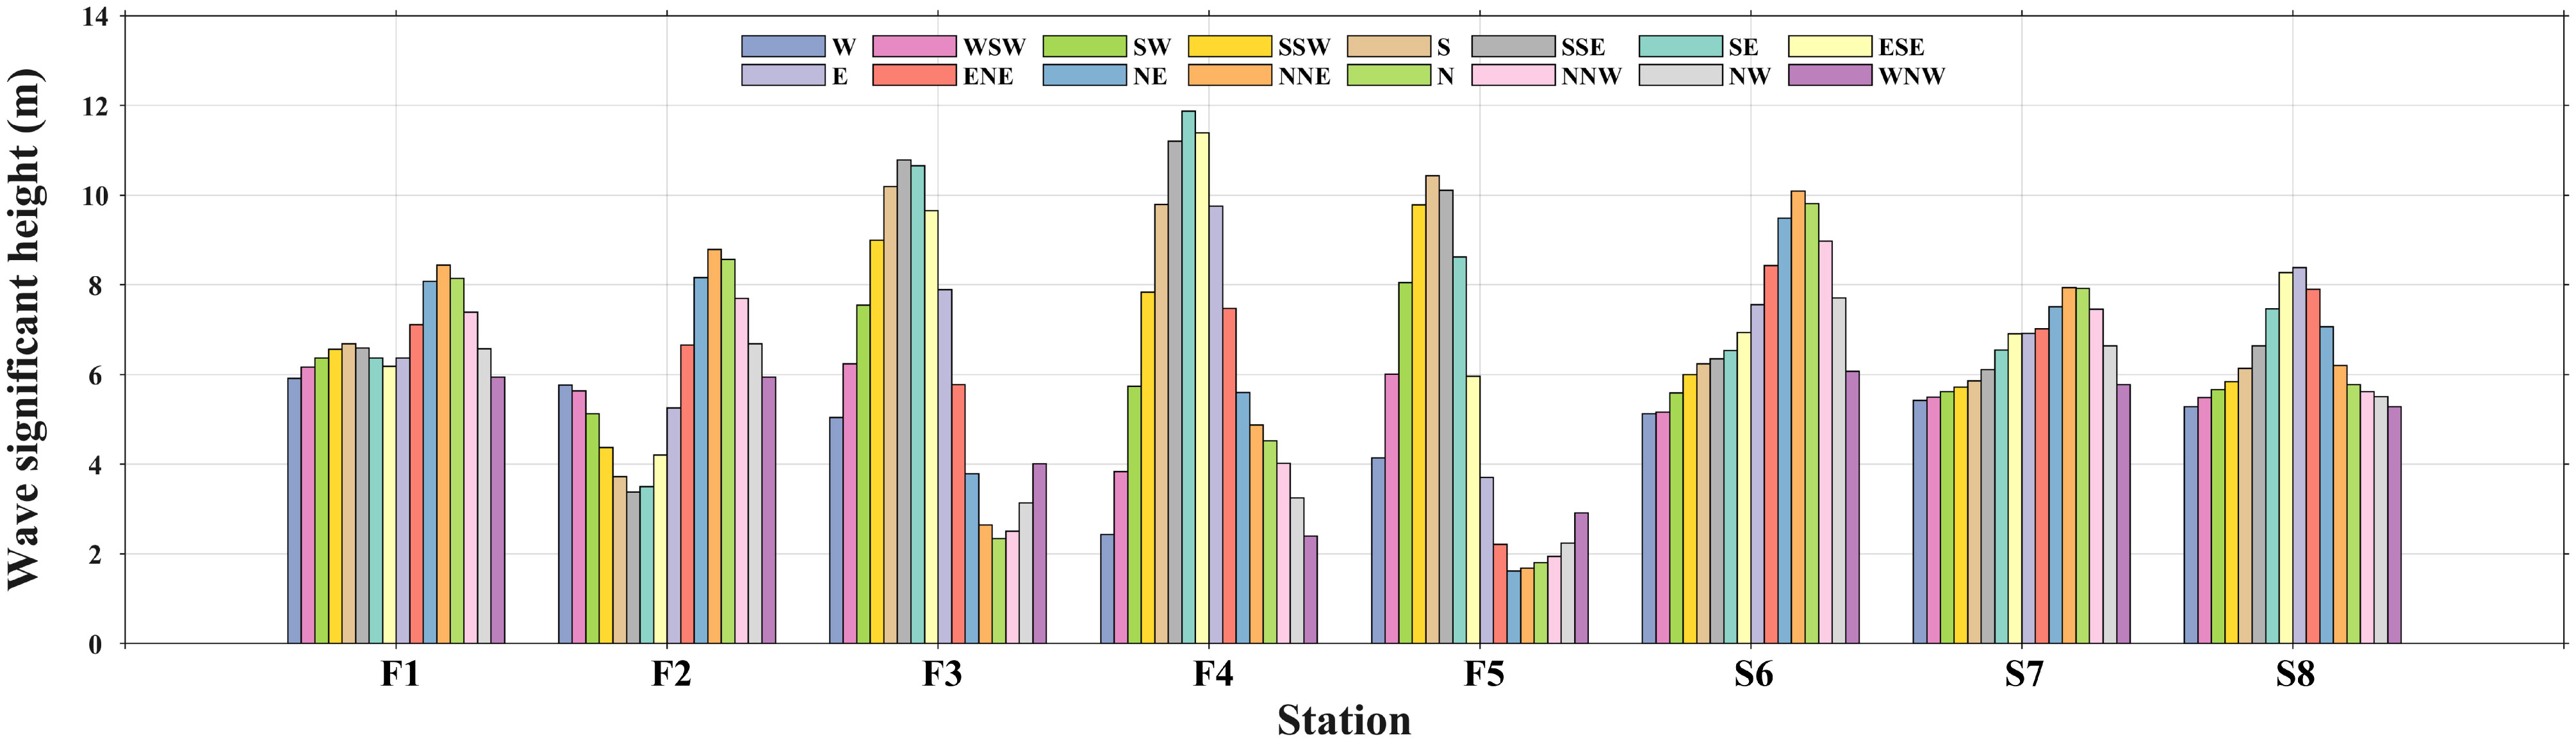
Figure 10 Significant wave height of different stations in the mussel farm under extreme wind conditions (25 m/s) in 16 wind directions.
F3 is completely protected by Gouqi Island and has the lowest wave height values when there is a northerly wind. However, waves will diffract from the middle of Gouqi and ShengShan islands, resulting in even higher wave height values for F5, with the minimum value occurring in the direction of the wind as NE. F4 has the highest wave height about 12 m for wind direction SE. Westerly wind experiences the smallest wave height, due to the sheltering of islands. The highest wave height for the undeveloped farming area (S6, S7, and S8) occurs at S6 in the case of northeast wind and at S8 in the case of east wind. S7 is situated between S6 and S8, and it has the smallest wave height due to the protection of the islands.
5 Discussion
5.1 Relationships between typhoon induced winds and waves
There is no invariable wind field and symmetrical wave field during the movement of typhoon center, the relationship between winds and waves is related to wind duration, wind fetch, topography, and the strength of the subtropical high pressure. Typhoons are characterized by an unequal distribution of air pressure, and powerful wind fetch are naturally distributed unevenly. In general, wave and wind directions are basically the same in the right front quadrant of the typhoon forward direction (from east to west or northwest), and the relative wind speed is higher. This is due to the proximity to the western Pacific subtropical high pressure. The wind field constantly affects waves in this quadrant, where energy is continuously accumulated, wave height greatly increases. However, there is a time lag in the response of waves to wind in the left quadrant of the typhoon path. The area here have short wind fetch and are dominated by swells, the wave significant height decreases. The asymmetry of wave field is more obvious than wind field (Moon et al., 2004; Liu et al., 2007; Zhou et al., 2008).
In addition to the influence of wind field, the intensity and energy of typhoon are also important factors that determine the asymmetry of wave field. The TPW type typhoon is not discussed here because its characteristics on the sea surface after landfall are atypical. Right Front (RF), Right Behind (RB), Left Behind (LB) and Left Front (LF) represent the NE, SE, SW and NW of the typhoon center, respectively. Taking Chan-hom as an example, the effects of three different typhoon intensities: super typhoon, strong typhoon and typhoon are discussed. While Muifa is used to illustrate the impact of typhoon energy on the same typhoon intensity. The decrease in energy due to the loss of continuous heat supply as the center of the typhoon moves further north.
It is evident that the wave height initially increases, then decreases as the distance from the typhoon center increases (Figure 11). Additionally, there is a gradual decrease in wave height with the reduction of typhoon intensity in both RF and LF. Typhoon-induced waves are always obstructed and diffracted by islands in the LF quadrant, leading to the manifestation of the lowest values (blue pentagram in Figure 11). The asymmetry of the typhoon and the short wind fetch on the left side result in complex variations in RB and LB. The significant wave height in the RB quadrant exhibits a tendency of first reducing and then growing when the intensity of the typhoon is relatively high (Figures 11A, D). When the intensity of typhoon is relatively low, the wave height typically increases before declining (Figures 11C, F). The unstructured grid points used for calculation are scattered at both ends of the selected line section, which is located at the edge of the typhoon wind circle, resulting in a zigzag-shaped line section (Figure 11E).
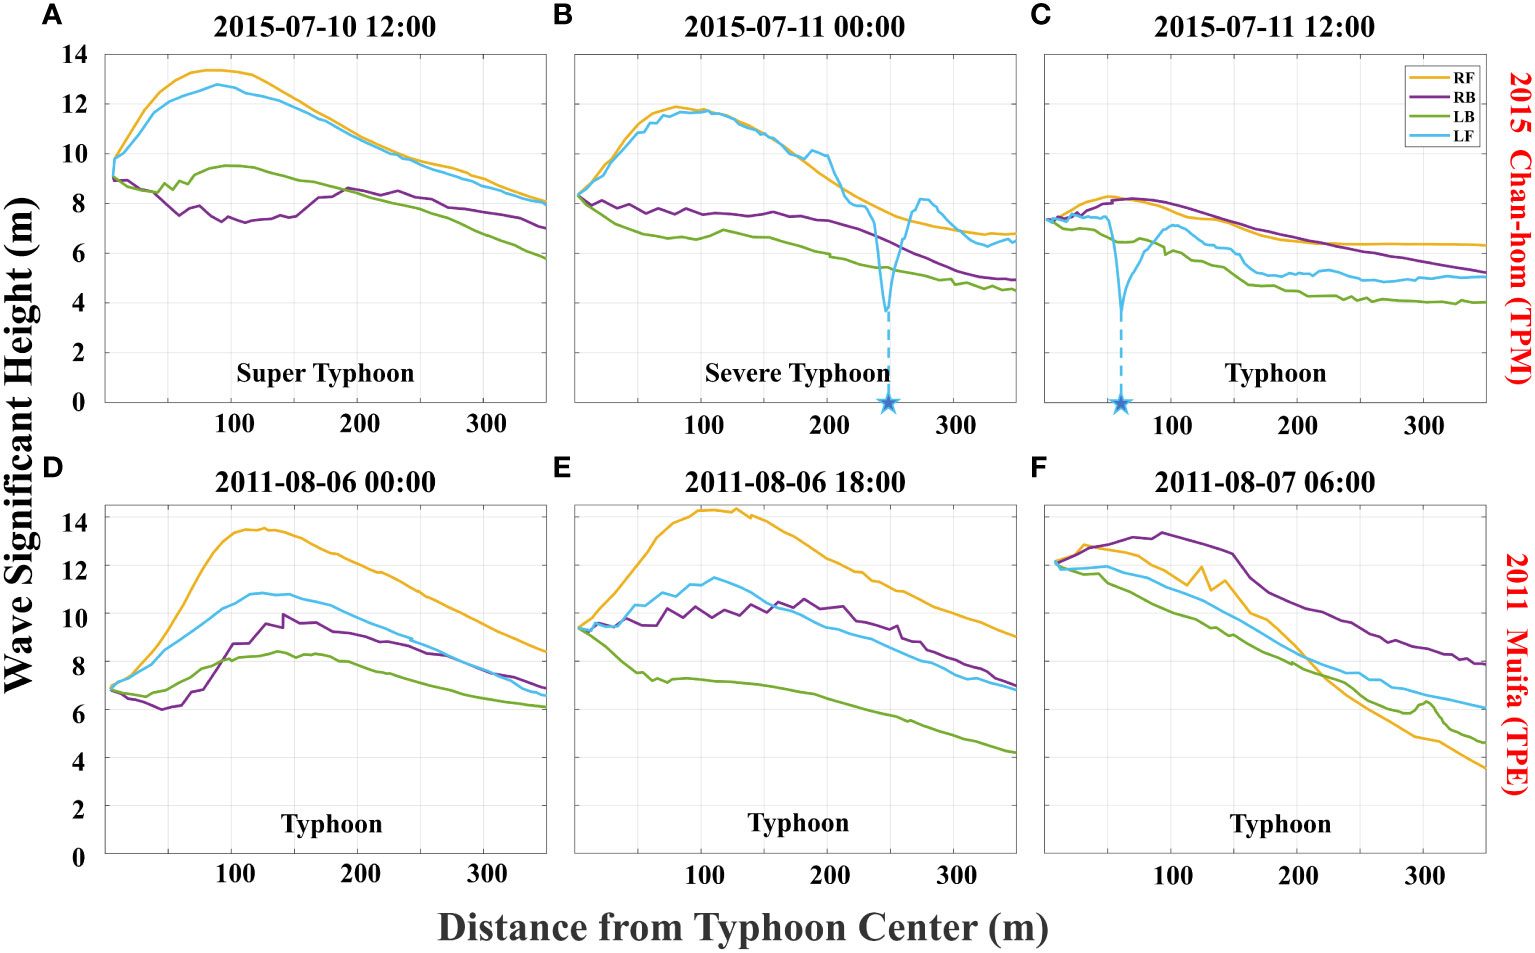
Figure 11 Variation of significant wave height with the distance from the center of the typhoon in the four directions (RF, RB, LB, and LF). Upper panels (A–C) represent the results of TPM type (Chan-hom), lower panels (D–F) represent the results of TPE type (Muifa).
The variation in wave height within the LB quadrant closely parallels that observed in the RB. There is a notable trend in wave height changes, this is characterized by RF>LF>LB>RB when the intensity of the typhoon is high. Due to the northward shift of the typhoon center and the impact of topography, the wave heights follow the pattern: RF>LF>RB>LB. As the center of the typhoon moved northward, the energy is no longer able to consistently maintain heat supply, leading to the wave height of RB exceeding that of RF. The findings indicate a significant correlation between the asymmetry of the wave field and both the intensity and energy of typhoons.
The asymmetry and hysteresis of the waves result in various types of waves dominating Gouqi Island at distinct times. The correlation coefficients, calculated for wind and wave parameters across the entire typhoon transit time series, do not adequately elucidate the changing processes of dominant wind waves and swells. Divide the time series into three distinct periods: T1(Before), T2(During) and T3(After) (Figure 12B). The correlation coefficients between the winds and waves for the three time periods are shown in Table 2.
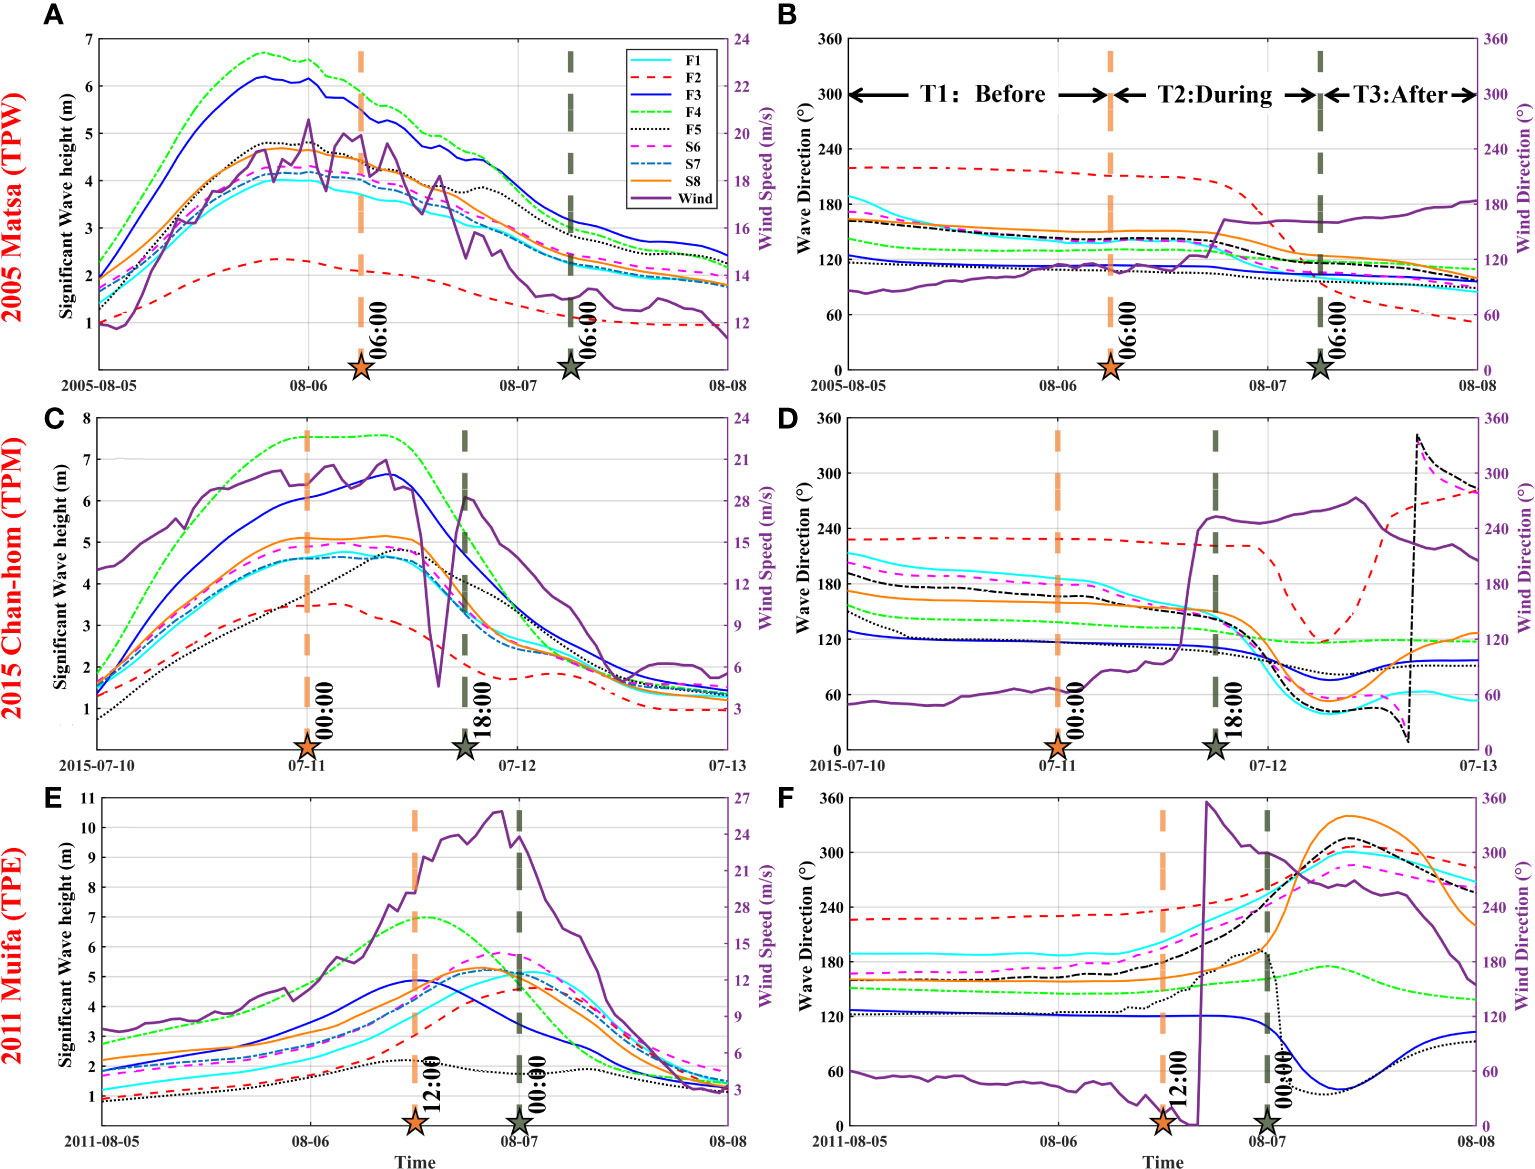
Figure 12 Time series variations of significant wave height and local wind speed (left), average wave direction and local wind direction (right) at F1 to F5 and S6 to S8. Upper panels (A, B) represent the results of Matsa, middle panels (C, D) represent the results of Chan-hom, and lower panels (E, F) represent the results of Muifa. Orange and olive green dotted lines used to divide before, during and after period of typhoon paths.
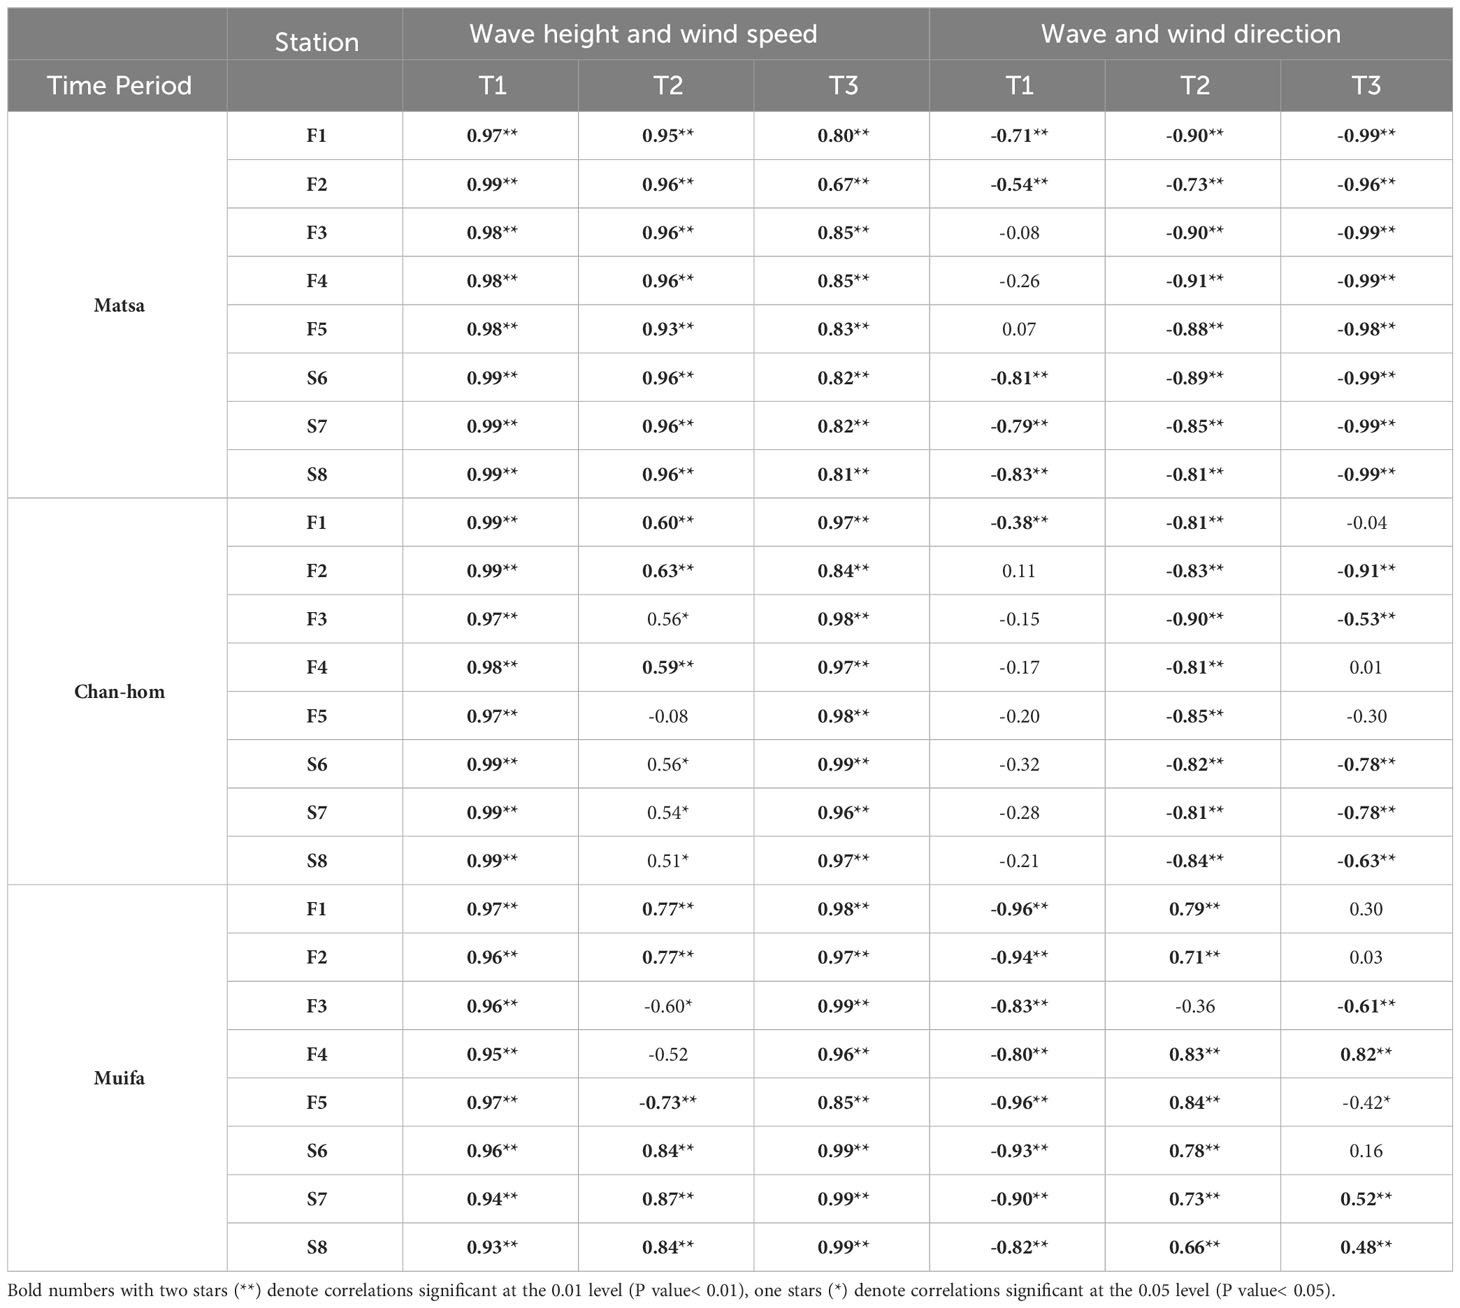
Table 2 Correlation between winds and waves.
For TPW type, the wind and wave direction on the right side of the track basically coincides with the movement direction of the typhoon (Figures 12A, B). During the T1 period, the latitude of the typhoon center was lower than that of Gouqi Island. The dominated wave at this time was primarily swells. The correlation between wind direction and wave direction within the farms is suboptimal, minimum is 0.07. Wind waves are predominant when winds persist in the same direction during T2 and T3. It is worth noting that F2 is protected by the Gouqi island and impacted by a mixed waves dominated by swells.
In the case of TPM type typhoons, swells predominantly govern the wave structure on Gouqi Island. As the typhoon center traverses Gouqi Island, the local wind direction on the island undergoes a sudden change due to the influence of the rotating wind field (Figures 12C, D). Variations in wind fields lead to a decrease in the duration of wind hours and a reduction in the size of wind fetch. Similarly, the Gouqi Island area is predominantly influenced by swells during the passage of TPE type typhoons. The correlation coefficient of farm F3 is only -0.36 during T2. As the wave direction alters, the angle between the winds and waves directions progressively reduces (Figures 12E, F). Concurrently, the correlation coefficient exhibits a corresponding increase at T3. The results underscore the pronounced lag characteristics observed in waves.
Generally, the sea area of Gouqi Island is predominantly impacted by swells originating from the northeast (NE), east (E), and southeast (SE) due to the hysteresis of the wave field. The swells of shallow water concentrate the energy, leading to an increase in wave height. Therefore, greater emphasis should be placed on the farm F1 effected by diffracted waves and the farm F4 devoid of island protection. However, this study merely provides a qualitative analysis. For a more quantitative assessment of wind waves and swells, it is imperative to employ specific methodologies in the further study (Hwang et al., 2012; Zheng et al., 2019).
5.2 Assessment of risk levels of typhoon-induced waves
In according with the technical directives for risk assessment and zoning of marine disaster—Part 2: Ocean wave (Ministry of Natural Resources of the People’s Republic of China, 2022), the ocean wave intensity levels in offshore waters are categorized into four levels. This classification is based on the significant wave height at each grid point: extremely strong, strong, relatively strong and general, corresponding to levels I (Hs ≥ 14.0 m), II (9.0 m ≤ Hs < 14.0 m), III (6.0 m ≤ Hs < 9.0 m) and IV (4.0 m ≤ Hs < 6.0 m) respectively.
The variability in wave field characteristics across individual typhoons introduces uncertainty and contingency to the assessment of typhoon-induced wave risk levels within the Gouqi Island area. Consequently, the evaluation will be conducted with respect to both extreme conditions and actual typhoons. Under extreme situations, the 16 wind directions manifest with varying weights during typhoons. Therefore, the weights of the 16 wind directions were determined based on the frequency of wind direction with a wind speed exceeding 20 m/s in section 4.1 during typhoons from 2000 to 2022, the results of weights are 0.05, 0.07, 0.12, 0.14, 0.12, 0.14, 0.01, 0.00, 0.00, 0.00, 0.00, 0.03, 0.00, 0.12, 0.10, 0.10, respectively (from 0° to 337.5°). The risk levels are assessed by significant wave heights of each grid point, are determined through the follow formula (Equation 5):
where HS represents the significant wave height for each grid point; N is the total number of the wind directions; MHSn is the maximum wave height of the nth wind direction and Wn is the weight of the nth direction for each grid. The wave risk map in extreme cases with different wind direction frequencies of study area is constructed using a 0.005°×0.005° matrix diagram (Figure 13A).
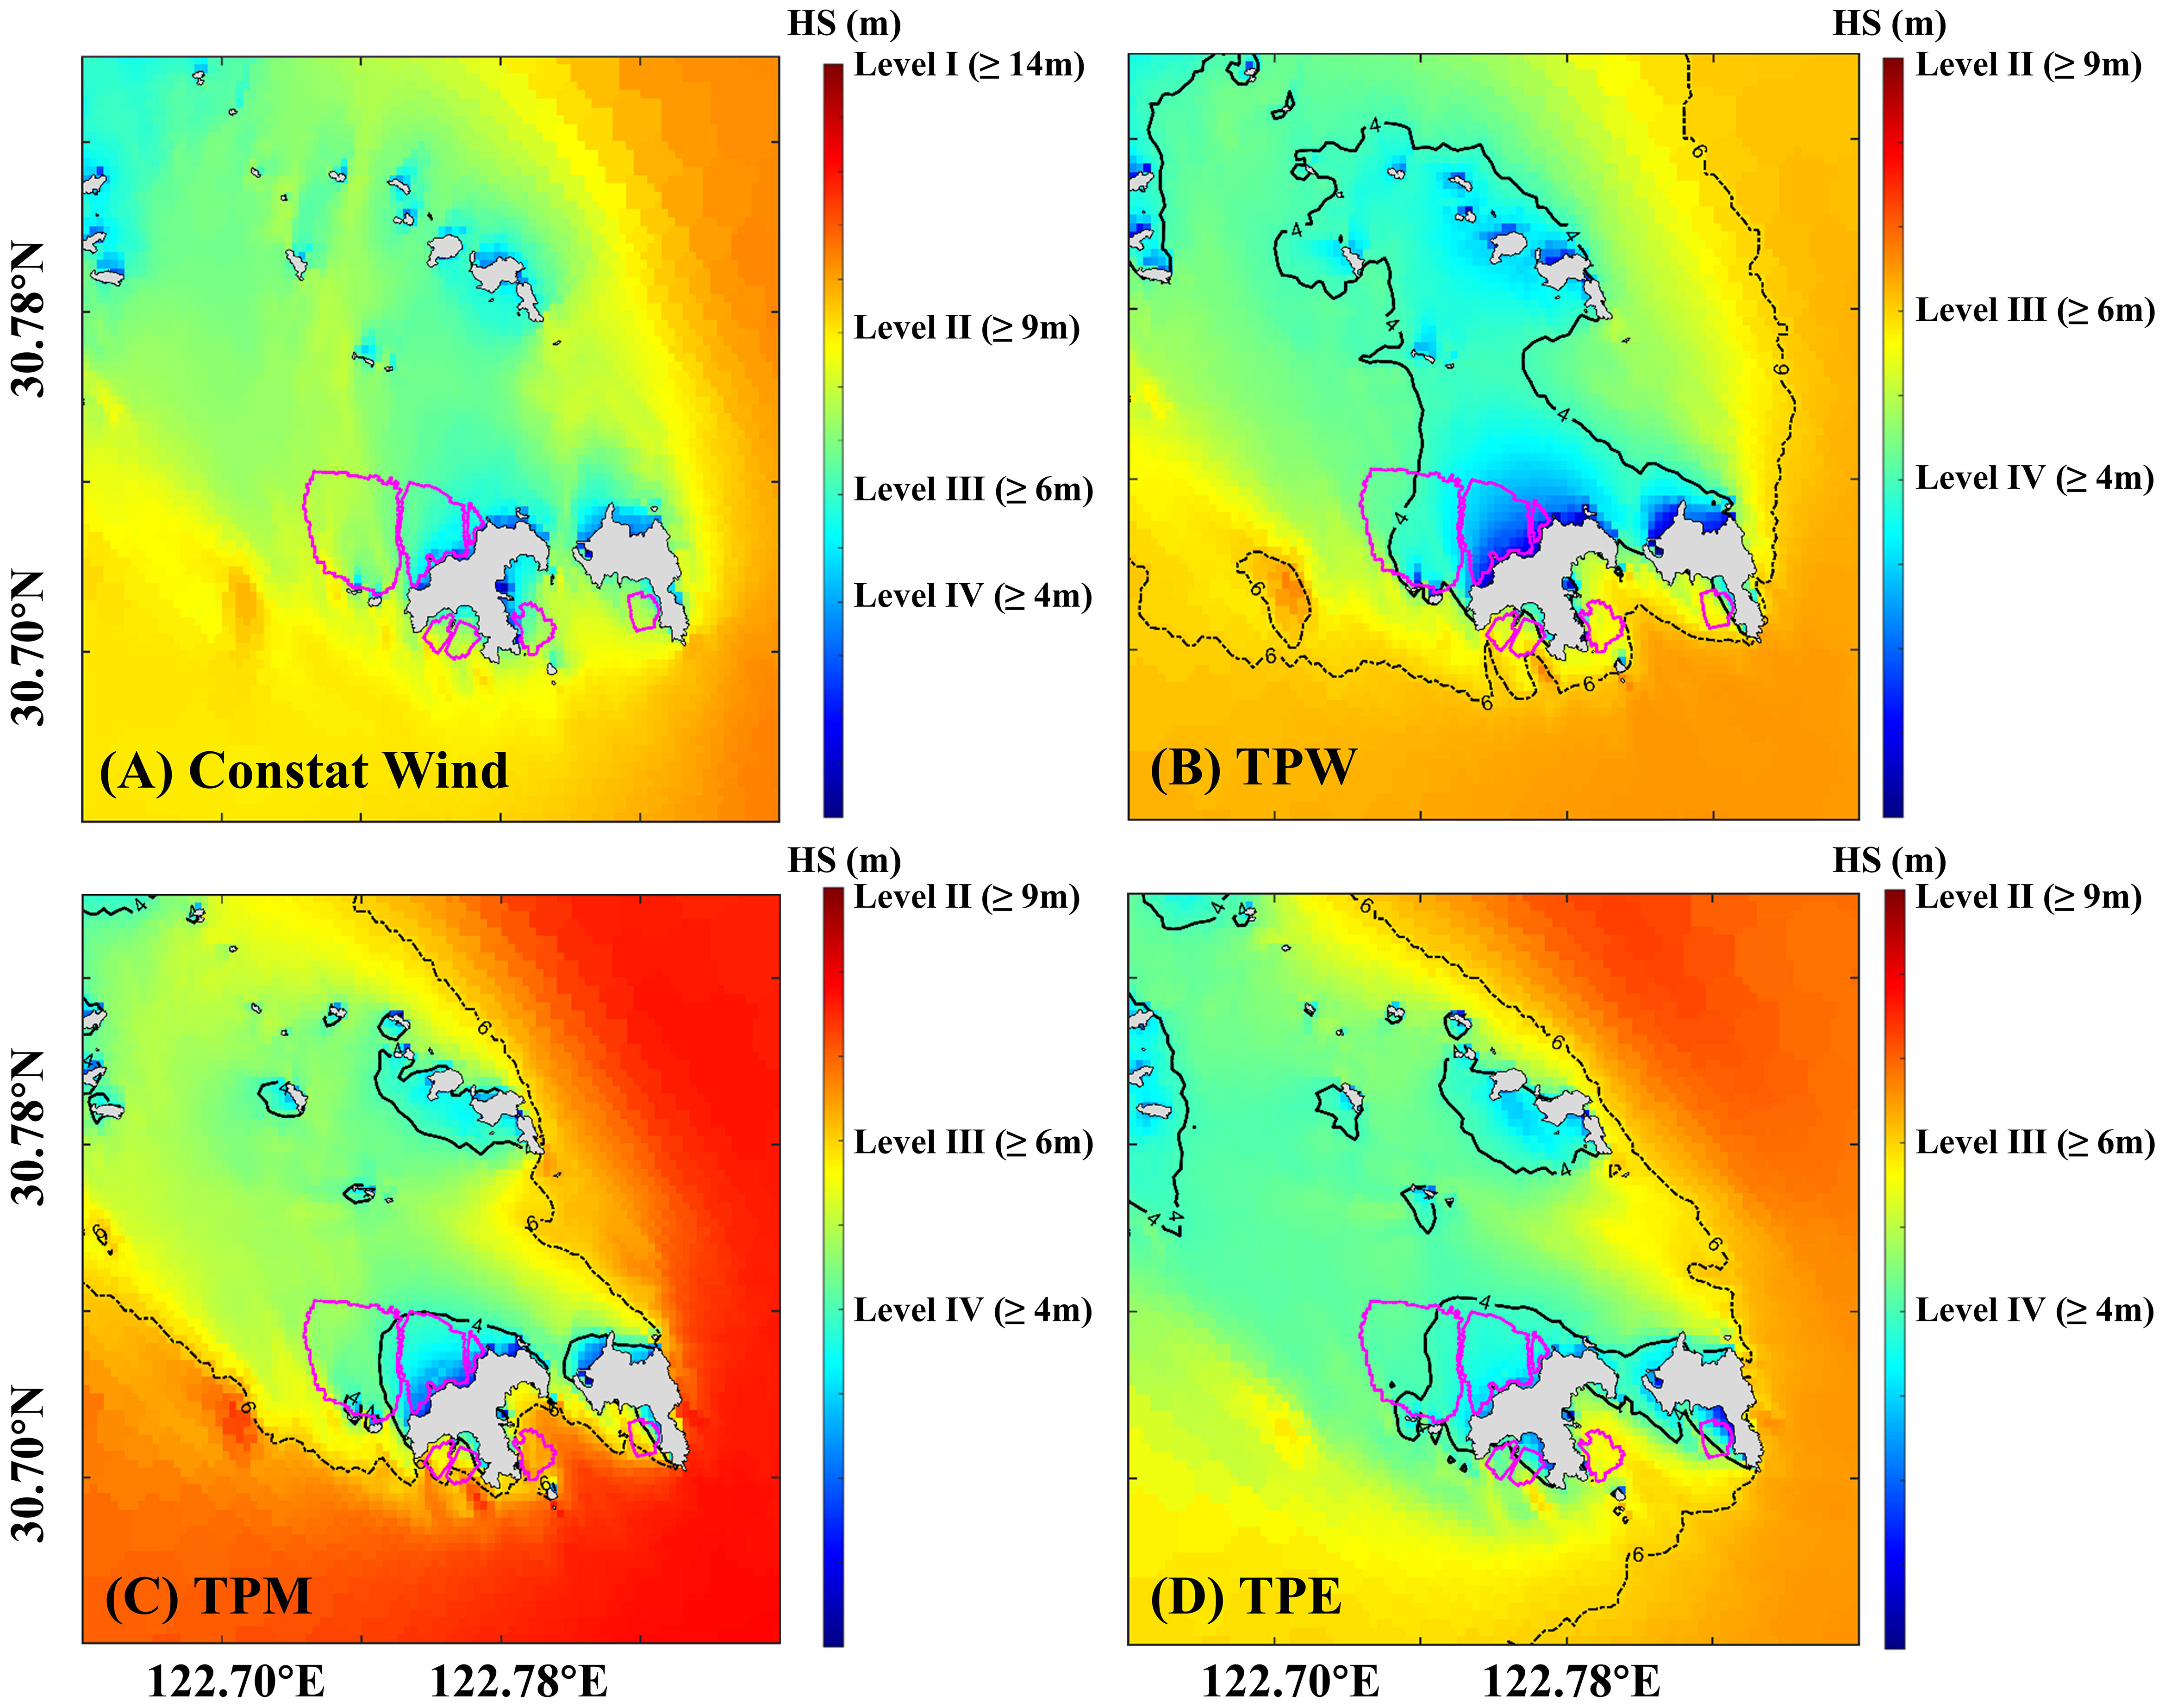
Figure 13 Risk level maps of (A) extreme wind conditions, (B) TPW type, (C) TPM type and (D) TPE type. The solid black line represents the 4m contour and the black dotted line represents the 6m contour.
Figures 13B–D display the average value of maximum significant wave height caused by TPW (Matsa, LEKIMA and Hagupit), TPM (Prapiroon, Chan-hom and MITAG) and TPE (Muifa, LINGLING and Hinnamnor) types typhoon, respectively. The method of average calculation entails computing the mean of the maximum significant wave height for each typhoon within the designated track categories (Tian and Zhang, 2021; Jiang et al., 2023). This methodology mitigates the influence of individual variations stemming from the unpredictable paths of typhoons. Simultaneously, it elucidates the overarching distribution and interrelation of various typhoon paths, emphasizing their shared spatial characteristics. The matrix enables a more visual depiction of the typhoon-induced wave distribution and risk level at large-scale suspended mussel farms. (Equation 6) shows how to calculate the significant wave height
for each category, HSi is the maximum significant wave height of matrix; hi is the maximum value of each typhoon; k is the total number of the typhoons; i represent the number of mesh points in matrix.
In extreme cases (Figure 13A), the risk level is high and the most severe wave height can approach more than 9 m, defined as Level II. The risk levels in the western section of the F1 farm, as well as F3, F4, and F5 located in the southern of islands, are significantly high. This lack of island blocking increases both the risk and wave heights. The topography of the island protects the F2, resulting in a lower risk level. For TPW, TPM and TPE types, the area surrounding Gouqi Island controlled by swells from southeastern. F4 presents the highest risk similarly. The landfall of TPW type attenuates wind speed and reduces risk compared to other types. In contrast, TPM and TPE do not make landfall, often maintaining high wind speeds that significantly impact the farms. Consequently, it is crucial to prioritize typhoon forecasting and early warning systems for TPM and TPE.
In summary, under the influence of extreme conditions and three types of typhoon paths, the risk level will reach Level II. Given that the data source utilized is an average dataset for reanalysis, it is important to note that the measurements of wind speed and wave height may be underestimated. Therefore, in the event of a super typhoon or with long circling time, the risk level may reach Level I. The risk of proposed development area is comparable to the current farms F1 and F2. Furthermore, the depth of water in this region is conducive to large-scale cultivation. In the western of the proposed marine area, water depths approach 40 m, presenting opportunities for deep-water net cage culture. In the event of a typhoon, it is imperative to focus on safeguarding the farms situated in the southern and northwestern parts of the islands.
6 Conclusions
In this study, the SWAN wave numerical model was adopted to simulate the wave field around the mussel farm, and the ERA5 reanalysis dataset was used as the driving force. The model results compared well with the measured data during typhoon period. The temp-spatial distribution characteristics of local wind field and wave field of Gouqi Island during typhoon period from 2000 to 2022 are analyzed statistically, and the typhoons within 300km of Gouqi Island are divided into three categories (TPW, TPM and TPE), and the wave response to typhoon under extreme conditions and three categories of typhoons is simulated.
Local wind speed of Gouqi Island exceeding 20 m/s were predominantly found in the NW, NE, and SE from 2000 to 2022. The influence of waves varies significantly across different farms due to variations in topography and wind fetch. The occurrence of huge waves in F1 and F2 is infrequent, whereas the frequency of wave heights exceeding 7 m in F4 is notably high, predominantly from the southeast direction.
For TPW and TPM types, the waters surrounding Gouqi Island were impacted by the southeast swells prior to the passage of the typhoon. Following the propagation of the swells to the shallow water, wave energy accumulates, leading to a significant increase in wave height. This phenomenon is particularly pronounced in the southern farms. TPE type is continuously impacted by swells (SE-E-NE), so the wave height is the highest when the typhoon center reaches the same latitude, and the northern farms like F1 is seriously damaged. The results in extreme cases can provide valuable reference points when the path of typhoon is irregular or it persists for an extended period. Similarly, the southeast wave height of F4 is the highest.
The wave field exhibits both asymmetry and hysteresis, which are closely linked to the intensity and energy of the typhoon. The greater the intensity, the higher the energy, and the more asymmetry. Typhoons in the northwest Pacific are influenced by the subtropical high pressure, characterized by strong wind speed and significant wave height in the NE, and decrease in SW direction. When the local wind direction is NW, W, or SW, the wind speed is typically lower, the duration of the wind is shorter, and the directions of waves and winds do not be consistent. The risk assessment levels of F1 and F2 are less than F3, F4 and F5.
In conditions characterized by extreme wind and three types of typhoons, the wave height of F4 exceed 6m. This would consequently result in a risk level that could reach above level III. As such, it is advised to cultivate blue mussel (Mytilus edulis) with a short growing cycle (one year) here. Alternatively, other farms can opt for cultivating three-year mature hard-shell mussel (Mytilus coruscus). Such measures are recommended to mitigate the economic losses caused by typhoons. It is also noted that the risk of TPE types, F1 and F2 is greatly increased. The suspended mussel farms at the periphery have been destroyed, while the nearshore facilities are safeguarded due to the wave energy consumption by the cultivated mussel ropes selves.
Simultaneously, we also found that if the mussels in the offshore farms were affected by a typhoon, the quality of the mussels would be very good the following year, and the size and fat would increase. This is attributed to the diminished density of mussel farming and a decrease in competition for food resources. Therefore, when determining the breeding density and orientation of the longline, it is imperative to consider both quantity and quality. Reasonable orientation should be established to minimize damage caused by typhoon-induced waves.
The risk levels of the offshore current farms are high, rendering it infeasible to further expand the breeding area. The proposed S6, S7, and S8 exhibit a comparable level of risk to F1 and F2, thus presenting potential for further development. Opportunities for the development of deep-water net cage cultivations are also available at a depth of 40 m on its western side.
Data availability statement
The original contributions presented in the study are included in the article/supplementary material. Further inquiries can be directed to the corresponding author.
Author contributions
YL: Methodology, Validation, Writing – original draft, Conceptualization, Software. JL: Data curation, Resources, Supervision, Writing – review & editing, Conceptualization, Funding acquisition. WZ: Writing – review & editing, Methodology, Software. SW: Data curation, Writing – review & editing. LL: Data curation, Writing – review & editing.
Funding
The author(s) declare financial support was received for the research, authorship, and/or publication of this article. This research was supported by the National Natural Science Foundation of China (Grant 42376207), the Capacity building project of local colleges and universities of the Shanghai Science and Technology Commission (No. 23010502500) and the National Key R&D Program of China (Grant 2019YFD0901302). This study was also funded by the project of “Study on the germplasm, environment and culture strategy of mussel culture in sea area around Gouqi Island”, Shengsi County, Zhejiang Province.
Conflict of interest
The authors declare that the research was conducted in the absence of any commercial or financial relationships that could be construed as a potential conflict of interest.
Publisher’s note
All claims expressed in this article are solely those of the authors and do not necessarily represent those of their affiliated organizations, or those of the publisher, the editors and the reviewers. Any product that may be evaluated in this article, or claim that may be made by its manufacturer, is not guaranteed or endorsed by the publisher.
References
Allen J. I., Somerfield P. J., Gilbert F. J. (2007). Quantifying uncertainty in high-resolution coupled hydrodynamic-ecosystem models. J. Mar. Syst. 64, 3–14. doi: 10.1016/j.jmarsys.2006.02.010
Aydoğan B., Ayat B. (2021). Performance evaluation of SWAN ST6 physics forced by ERA5 wind fields for wave prediction in an enclosed basin. Ocean. Eng. 240, 109936. doi: 10.1016/j.oceaneng.2021.109936
Bi C.-W., Zhao Y.-P., Sun X.-X., Zhang Y., Guo Z.-X., Wang B., et al. (2020). An efficient artificial neural network model to predict the structural failure of high-density polyethylene offshore net cages in typhoon waves. Ocean. Eng. 196, 106793. doi: 10.1016/j.oceaneng.2019.106793
Botta R., Asche F., Borsum J. S., Camp E. V. (2020). A review of global oyster aquaculture production and consumption. Mar. Policy 117, 103952. doi: 10.1016/j.marpol.2020.103952
Chen Q., Zhang S., Lin J., Zhao J., Ye L. (2012). Growth conditions of Mytilus edulis Linnaeus and its relationship with environmental factors in Gouqi island. J. Shanghai. Ocean. Univ. 21, 809–815. doi: CNKI:SUN:SSDB.0.2012-05-024
FAO (2022). The state of World Fisheries and Aquaculture 2022. Rome: Food and Agriculture Organization of the United Nations. doi: 10.4060/cc0461en
He J., Yang K., Tang W., Lu H., Qin J., Chen Y., et al. (2020). The first high-resolution meteorological forcing dataset for land process studies over China. Sci. Data 7, 25. doi: 10.1038/s41597-020-0369-y
He Y., Xuan J., Ding R., Shen H., Zhou F. (2022). Influence of suspended aquaculture on hydrodynamics and nutrient supply in the coastal yellow sea. JGR. Biogeosci. 127, e2021JG006633. doi: 10.1029/2021JG006633
Hersbach H., Bell B., Berrisford P., Hirahara S., Horányi A., Muñoz Sabater J., et al. (2020). The ERA5 global reanalysis. Quart J. Royal Meteoro. Soc. 146, 1999–2049. doi: 10.1002/qj.3803
Huang B., Guan C., Cui Y., Li J., Jiang Z., Zhou Y. (2011). The survey and technology resolving of influence on cage farming in Shandong caused by Meari typhoon. Fish. Modern. 38, 17–21. doi: 10.3969/j.issn.1007-9580.2011.04.004
Hwang P. A., Ocampo Torres F. J., García-Nava H. (2012). Wind sea and swell separation of ID wave spectrum by a spectrum integration method. J. Atmospheric. Oceanic. Technol. 29, 116–128. doi: 10.1175/JTECH-D-11-00075.1
Jiang F., Tian Z., Zhang Y., Udo K. (2023). Risk map of typhoon induced wave fields around Hainan Island. Appl. Ocean. Res. 137, 103603. doi: 10.1016/j.apor.2023.103603
Lin J., Deng M., Zhang S., Yan Q. (2016a). Seasonal variation of surface water temperature and its ecological impacts in a mussel aquaculture farm. J. Shanghai. Ocean. Univ. 25, 918–926. doi: 10.12024/jsou.20150901542
Lin J., Li C., Zhang S. (2016b). Hydrodynamic effect of a large offshore mussel suspended aquaculture farm. Aquaculture 451, 147–155. doi: 10.1016/j.aquaculture.2015.08.039
Liu G., Gao Z., Chen B., Fu H., Jiang S., Wang L., et al. (2019). Extreme values of storm surge elevation in Hangzhou Bay. Ships. Offshore. Structures. 15, 1–12. doi: 10.1080/17445302.2019.1661618
Liu H., Xie L., Pietrafesa L., Bao S. (2007). Sensitivity of wind waves to hurricane wind characteristics. Ocean. Model. 18, 37–52. doi: 10.1016/j.ocemod.2007.03.004
Liu X., Zhang X. (2022). Impacts of high-density suspended aquaculture on water currents: observation and modeling. JMSE 10, 1151. doi: 10.3390/jmse10081151
Liu Z., Huguenard K. (2020). Hydrodynamic response of a floating aquaculture farm in a low inflow estuary. J. Geophys. Res.: Oceans. 125, e2019JC015625. doi: 10.1029/2019jc015625
Long L., Liu H., Cui M., Zhang C., Liu C. (2024). Offshore aquaculture in China. Rev. Aquacult. 16, 254–270. doi: 10.1111/raq.12837
Lu X., Yu H., Ying M., Zhao B., Zhang S., Lin L., et al. (2021). Western north pacific tropical cyclone database created by the China meteorological administration. Adv. Atmos. Sci. 38, 690–699. doi: 10.1007/s00376-020-0211-7
Maar M., Larsen J., Schourup-Kristensen V., Taylor D. (2023). Nutrient extraction and ecosystem impact by suspended mussel mitigation cultures at two contrasting sites. Sci. Total. Environ. 888, 164168. doi: 10.1016/j.scitotenv.2023.164168
Maréchal D. (2004). A soil-based approach to rainfall-runoff modelling in ungauged catchments for England and Wales. Available at: https://dspace.lib.cranfield.ac.uk/handle/1826/915 (Accessed February 27, 2024).
Mascorda Cabre L., Hosegood P., Attrill M. J., Bridger D., Sheehan E. V. (2021). Offshore longline mussel farms: a review of oceanographic and ecological interactions to inform future research needs, policy and management. Rev. Aquacult. 13, 1864–1887. doi: 10.1111/raq.12549
Ministry of Natural Resources of the People’s Republic of China (2022). Technical directives for risk assessment and zoning of marine disaster-Part 2: Ocean wave. Beijing China: Ministry of Natural Resources of the People’s Republic of China.
Moon I.-J., Ginis I., Hara T. (2004). Effect of surface waves on air–sea momentum exchange. Part II: behavior of drag coefficient under tropical cyclones. J. Atmos. Sci. 61, 2334–2348. doi: 10.1175/1520-0469(2004)061<2334:EOSWOA>2.0.CO;2
Plew D. R. (2011a). Depth-averaged drag coefficient for modeling flow through suspended canopies. J. Hydraul. Eng. 137, 234–247. doi: 10.1061/(ASCE)HY.1943-7900.0000300
Plew D. R. (2011b). Shellfish farm-induced changes to tidal circulation in an embayment, and implications for seston depletion. Aquacult. Environ. Interact. 1, 201–214. doi: 10.3354/aei00020
Shih H.-J., Chen H., Liang T.-Y., Fu H.-S., Chang C.-H., Chen W.-B., et al. (2018). Generating potential risk maps for typhoon-induced waves along the coast of Taiwan. Ocean. Eng. 163, 1–14. doi: 10.1016/j.oceaneng.2018.05.045
Stevens C., Petersen J. (2011). Turbulent, stratified flow through a suspended shellfish canopy: implications for mussel farm design. Aquacult. Environ. Interact. 2, 87–104. doi: 10.3354/aei00033
Stevens C. L., Plew D. R., Smith M. J., Fredriksson D. W. (2007). Hydrodynamic forcing of long-line mussel farms: observations. J. Waterway. Port. Coastal. Ocean. Eng. 133, 192–199. doi: 10.1061/(ASCE)0733-950X(2007)133:3(192
Tian Z., Zhang Y. (2021). Numerical estimation of the typhoon-induced wind and wave fields in Taiwan Strait. Ocean. Eng. 239, 109803. doi: 10.1016/j.oceaneng.2021.109803
Warner J. C., Geyer W. R., Lerczak J. A. (2005). Numerical modeling of an estuary: A comprehensive skill assessment. J. Geophys. Res. 110, 2004JC002691. doi: 10.1029/2004JC002691
Wu Z., Huang L., Wang F., Zhang S., Zhang S. (2021). Impacts of tropical cyclones on mussel culture area and yield in Shengsi. J. Agric. Sci. Technol. (Beijing). 23, 171–183. doi: 10.13304/j.nykjdb.2019.1044
Xianwu S., Shuxian Z., Qiang L., Jian F., Qiang C., Ning J., et al. (2021). Research on numerical simulation of typhoon waves with different return periods in nearshore areas: case study of Guishan island Waters in Guangdong province, China. Stoch. Env. Res. Risk A. 35, 1771–1781. doi: 10.1007/s00477-020-01960-4
Xie B.-T., Liu D.-F., Li H.-J., Gong C. (2010). Design code calibration of offshore platform against typhoon/hurricane attacks. China Ocean. Eng. 24, 431–442. doi: 10.1080/14634988.2010.543383
Ying M., Zhang W., Yu H., Lu X., Feng J., Fan Y., et al. (2014). An overview of the China meteorological administration tropical cyclone database. J. Atmos. Oceanic. Technol. 31, 287–301. doi: 10.1175/JTECH-D-12-00119.1
Zhang Y., Guo J., Liu Q., Huang W., Bi C., Zhao Y., et al. (2021). Storm damage risk assessment for offshore cage culture. Aquacult. Eng. 95, 102198. doi: 10.1016/j.aquaeng.2021.102198
Zhang Z., Qi Y., Shi P., Li C., Li Y. (2003). Application of an optimal interpolation wave assimilation method in south china sea. J. Trop. Oceanogr. 22 (4), 34–41. doi: 10.1007/BF02860423
Zheng C., Li C., Wu H., Wang M. (2019). Wind-Sea, Swell and Mixed Wave Energy. Berlin, Germany: Springer Oceanography. 101–111. doi: 10.1007/978-981-10-8114-9_8
Zhong W., Lin J., Zou Q.-P., Wen Y., Yang W., Yang G. (2022). Hydrodynamic effects of large-scale suspended mussel farms: Field observations and numerical simulations. Front. Mar. Sci. 18. doi: 10.3389/fmars.2022.973155
Keywords: typhoon track, wave field, mussel farm, risk level, site selection
Citation: Li Y, Lin J, Zhong W, Wang S and Li L (2024) Risk level assessment of typhoon-induced wave fields around a large-scale suspended mussel farm. Front. Mar. Sci. 11:1351316. doi: 10.3389/fmars.2024.1351316
Received: 06 December 2023; Accepted: 22 February 2024;
Published: 12 March 2024.
Edited by:
Donald B. Olson, University of Miami, United StatesReviewed by:
Yen-Chiang Chang, Dalian Maritime University, ChinaFan Zhang, East China Normal University, China
Copyright © 2024 Li, Lin, Zhong, Wang and Li. This is an open-access article distributed under the terms of the Creative Commons Attribution License (CC BY). The use, distribution or reproduction in other forums is permitted, provided the original author(s) and the copyright owner(s) are credited and that the original publication in this journal is cited, in accordance with accepted academic practice. No use, distribution or reproduction is permitted which does not comply with these terms.
*Correspondence: Jun Lin, amxpbkBzaG91LmVkdS5jbg==