 Gisela Bichler
 Gohar A. Petrossian
 Kierston Viramontes1,2
- 1School of Criminology and Criminal Justice, California State University San Bernardino, San Bernardino, CA, United States
- 2School of Criminology and Criminal Justice, Center for Criminal Justice Research, San Bernardino, CA, United States
- 3Department of Criminal Justice, John Jay College of Criminal Justice, New York, NY, United States
Introduction: Illegal, unreported, and unregulated (IUU) fishing is a serious environmental crime with severe economic, social, and security implications. Efforts to monitor IUU fishing could be enhanced by using patterns of at-sea transshipment of fish to detect illicit subgroups.
Methods: Using data from Global Fishing Watch, this study investigates repeat transshipment events among vessels observed to operate in the U.N. FAO Area 81 during 2015-2021. Ship-to-ship transfer networks mapping potential encounters among 30 refrigerated cargo vessels (carriers) and 613 fishing vessels exhibit distinct communities that extend beyond this region.
Results: Highly central, carriers associated with open registries (flags of convenience) and exhibiting high operational deficiencies form networks that shadow the activities of national fleets.
Discussion: Observed between group linkages among vessels draw attention to these parallel trade currents embedding regional activity into the larger fishing industry, providing a focus for monitoring and conservation efforts.
1 Introduction
1.1 IUU fishing
Illegal, unreported, and unregulated (IUU) fishing includes any fishing and related activity conducted in contravention of national and international laws and agreements. Illegal fishing involves a range of activities, such as fishing in prohibited areas, fishing without a license (or in violation of the terms of the license), using prohibited gear or methods, and fishing in protected areas or during a closed fishing season. Unreported fishing, in turn, refers to non-reporting or misreporting of fish catches to relevant national authorities or regional fisheries management organizations (RFMOs). Lastly, unregulated fishing includes such activities as fishing in the high seas without a nationality (i.e. without a flag), or fishing within the convention area of an RFMO while flying the flag of a country not party to the RFMO (FAO, 2001).
Estimated to generate up to $36 billion in annual losses, IUU fishing is one of the most pressing issues of our time, with impacts that reach beyond the economic sphere and encompass catastrophic environmental and social impacts (Pauly and Zeller, 2016). For example, IUU fishing vessels often encroach on sovereign states’ exclusive economic zones, and operators use environmentally destructive methods (such as bottom trawling and blast fishing), frequently conducting their illicit activities with forced labor (McDowell et al., 2015; Urbina, 2015; McDonald et al., 2021). Investigations also find that unregulated at-sea transshipment enables other crimes, such as money laundering, as well as trafficking in weapons, drugs, and wildlife (UNODC, 2011; Boerder et al., 2018; Seto et al., 2020).
While a significant proportion of IUU fishing has historically occurred within the economic zones of coastal countries, the increasing overexploitation and subsequent depletion of the fisheries resources in these territories have triggered the expansion of fishing vessel operations beyond national jurisdictions and into the high seas, putting additional pressures on the oceans and escalating concerns about transnational organized crime involvement (Swartz et al., 2010; Telesetsky, 2014; Petrossian, 2019; Belhabib and Le Billon, 2020; Selig et al., 2022). Recent estimates suggest that over 30% of the global fish stocks are biologically unsustainable, nevertheless, harvesting of fisheries resources continues to grow, and there is no sign of stopping the aggressive overexploitation of the oceans (FAO, 2020). One of the factors enabling the expansion of IUU fishing is at-sea transshipment between fishing vessels and carriers, also known as refrigerated cargo vessels or reefers (Agnew et al., 2009; Kroodsma et al., 2017; Greenpeace, 2020).
The United Nations Food and Agriculture Organization defines at-sea transshipment as “transferring the catch from one fishing vessel to either another fishing vessel or to a vessel used solely for the carriage of cargo” while at sea (FAO, 1996). Transshipping fish while at sea makes fishing more operationally efficient by removing the costs associated with making multiple port visits to off-load catch (Interpol, 2014). Importantly, carriers not only transship fish for fishing vessels, but they also exchange food, supplies, fuel, crew, and gear, all of which are essential for the vessels to maximize earning potential (Petrossian et al., 2022). For these reasons, at-sea transshipment has become a critical segment of the ocean-to-table supply chain (Miller et al., 2021). Supply chains of perishable goods connect activities that link the production or harvesting of raw materials, to processing, and delivery to end consumers via retail (bought at a grocery store) or manufacturing (e.g., used in a dish served at a restaurant).
The problem at hand is that while research shows that critical segments of supply chains are vulnerable to interference by criminal actors, it is difficult to observe interference directly [e.g (D’amato and Papadimitriou, 2013; McElwee et al., 2017; Silvis et al., 2017; Soon et al., 2019)]. This issue is particularly salient for IUU fishing, as critical segments of the supply chain are nearly unobservable (Telesetsky, 2014). For example, described as intra-supply chain interference, covert criminal interactions can occur between actors embedded within a legal infrastructure (Soon et al., 2019). In this scenario, lawful and illegal transactions occur among legal actors during regular operations, making it difficult to distinguish the legality of actions. For instance, a licensed vessel may offload catch taken during a run that strayed into a marine protected area, thereby mixing legal cargo with fish procured inside a restricted area (Boerder et al., 2018). Tangent to legal trade, inter-supply chain interference occurs when illegal actors infiltrate the legal market introducing their illicit goods postproduction (Soon et al., 2019). In this instance, IUU activity is not defined by the fish, rather it is the status of the harvester that alters the status of a catch, e.g., selling illegal harvests through an intermediary or offloading fish from an unregistered or licensed vessel, operating with fraudulent documentation (Pedroza, 2013).
Addressing this investigative challenge, the current study demonstrates an approach to detecting communities of vessels at high-risk of IUU involvement. Building on the limited research in this area (reviewed in Section 1), we adopt a social network framework to identify potential intra-supply chain interference during at-sea transshipment activities involving fishing vessels and refrigerated carriers using publicly accessible data (described in Section 2). Applying the dynamic multivariate protocol explained in Section 3, this study shows that investigating the structure of interactions exposes some of the social mechanisms that are likely to underpin suspicious activity operating in the shadows at a critical junction of the ocean-to-table supply chain. Then, after reporting findings (Section 4), we discuss conservation research and policy implications (Section 5).
1.2 Identifying IUU communities
Within any community of actors, it is possible to identify subgroups with interaction patterns that exhibit distinctive characteristics compared to the network in its entirety. Discovering distinct subgroups of actors exposes some of the complexity of large networks (Lancichinetti and Fortunato, 2009) and investigations of criminal activity embedded within supply chains often involves looking for subgroups of actors participating in both lawful and illegal operations [e.g (Basu, 2014; Bichler and Malm, 2015; Magalingam et al., 2015; Manning et al., 2016; Magliocca et al., 2021)]. Studies find that central actors are instrumental to facilitating within group interconnectivity, as well as linking to other subgroups of an illicit supply chain [e.g (Malm et al., 2011; Pedroza, 2013; Bichler et al., 2017; Collins et al., 2021)]. Notably, the term illicit is commonly used to describe the mix of deviant and criminal behavior commonly observed to interfere with supply chains. Illicit is a broader term and its use is important as some supply chain interference involves behavior deemed illegal in some contexts but lawful in others (i.e., supplying fuel is lawful, unless the supplier knowing abets an illegal operation in furtherance of a crime).
Understanding the structure of criminal enterprise activity, particularly linking different sectors of the supply chain in lawful and illegal activity, is critical to developing effective disruption strategies [e.g (Duxbury and Haynie, 2018; Keskin et al., 2022; Anzoom et al., 2023; Hilend et al., 2023)]. Not all actors associated with an illicit supply chain are engaged in illegal behavior, nor are all segments in the chain equality compromised, thus, efforts to identify subgroups with the aim of disrupting criminal interference seek to uncover interactions among actors that directly support or involve illegal activity. However, little is known about generative social mechanisms and resulting substructures that are endemic to IUU transshipment; to date, only four studies have approached this challenge using encounter data.
Focusing on shipping lanes in the southern Indian Ocean used to transit to and from Australia, Ford et al. demonstrate but do not confirm, that centrality analysis could identify focal vessels at high-risk for IUU involvement (Ford et al., 2018). The authors inferred an encounter network among 181 unique vessels using 6 months of AIS detected movement by linking vessels observed to pass within 10 km to other vessels on a given day. One tanker (ranked highest on all measures) and four carriers were observed to be centrally positioned in the network. While authors conclude that the configuration of connections observed around highly central vessels suggests that subnetworks may exist, they did not present a community detection analysis.
Stamato and Park illustrate the potential of using network models to identify local patterns of vessel-to-vessel interactions (Stamato and Park, 2020). Juxtaposing dynamic visualization techniques, they demonstrate that while a network approach integrating a vessel attribute (histories of IUU involvement) can expose important patterns of connectivity among vessels with known and unknown IUU involvement, graphs quickly become obtuse when interactive media are not available; inadvertently they highlight the need to de-clutter the analysis. In a subsequent investigation of 10,000 potential transshipment encounters, these authors used a community detection algorithm (Gephi’s Louvain modularity method) to identify subnetwork patterns, uncovering 68 distinct communities of varying size and transshipment activity (Park and Stamato, 2020). However, the authors did not focus on a specific segment of the supply chain; this investigation used all encounter data involving one fishing, and one other vessel capable of transporting fish over long distances (but not confirmed to be a carrier).
Advancing this line of inquiry, Petrossian et al. examined global at-sea transshipment between fishing and carrier vessels occurring between 2015-2020 (Petrossian et al., 2022). These authors discovered a set of 130 highly active (central) refrigerated cargo vessels (22% of carriers) that accounted for 72% of the at-sea transshipments involving 1,831 fishing vessels. Transshipment activities were not evenly distributed among the 12 distinct communities of actors identified; three subgroups accounted for almost half of all transshipments. Taken together, while the studies described here push IUU community detection research forward, there is room for continued advancement.
1.3 Community detection analysis
Discovering subgroups of highly connected actors provides insight into the complexity of large networks (Wasserman and Faust, 1994; Albert and Barabási, 2002; Lancichinetti and Fortunato, 2009). As such, most network software includes many subgroup detection algorithms, also described as subgraph or community detection methods, enabling researchers to search for meaningful groupings for different types of networks. There are two general approaches. Top-down methods perform functions on the whole network, iteratively testing how to best split the network into subgraphs, i.e., the Girvan-Newman algorithm finds structurally important connections (edge-split points) that would fragment the network into separate components. Bottom-up methods assemble groupings or clusters by gathering actors (nodes) based on inclusion rules, i.e., cliques require complete subgroup connectivity in that all actors must be adjacent (meaning directly connected) to every other actor in the group.
Both Park and Stamato and Petrossian et al. used Gephi’s Louvain based modularity function (Park and Stamato, 2020; Petrossian et al., 2022). This community detection method uses a recursive bottom-up approach to identify distinct communities based on hierarchical clustering (Blondel et al., 2008; Lancichinetti and Fortunato, 2009). First the algorithm assigns actors to its own community, then a heuristic finds other communities to merge with (collapsing sets of actors into a single community) to generate the highest modularity score (best fit), given algorithmic restrictions designed to optimize computational efficiency (Glover, 1989; Glover, 1990). Modularity scores, calculated with each configuration evaluated, range between −1 (no clustering observed) and 1 (fully distinct groupings identified). Underpinning this process is density; within-group versus between-group density drives the modularity value used to find the best fitting solution. Density refers to the proportion of linkages observed among members of the group, relative to what would exist if all members were connected to each other. While the modularity function has an advantage over other strategies because it identifies subgroups based on the strength (value of interactions), it is not the optimal approach to apply to at-sea transshipment networks.
1.4 Study objective
While community detection is an important descriptive exercise that is well suited for exploring criminal enterprise (Morselli et al., 2007; Bichler et al., 2013; Anzoom et al., 2023), not all subgroup community detection algorithms are suitable for exploring specific segments of a supply chain. First, prior research used algorithms premised on the idea that the entire network is under investigation, and that distinct subgroups will have greater within-group connectivity than between-group connectivity based on density. While within-group connectivity may be high for some stages of illicit production, research shows that transshipment of illicit goods tends to involve sparse networks of minimally connected actors; in other words, smuggling and transshipment activities favor secrecy afforded by minimal connectivity over the functional efficiency of cohesive groups [e.g (Morselli et al., 2007; Basu, 2014)]. Thus, to investigate sparsely connected sectors of illicit supply chains researchers need techniques that are not sensitive to density (Van Gennip et al., 2013).
Second, linking fishing vessels to carriers could be graphed as two-mode networks when each class of vessel is taken to represent a separate category of actor and within-category linkages are not included. Two-mode networks are represented by bipartite graphs (Wasserman and Faust, 1994). Bipartite graphs use an asymmetric matrix to map the connectivity between two different types of actors (subsets). The matrix is asymmetric because rows represent one type of actor and columns represent the other type, and there is likely to be a different number of actors in each subset. All ties recorded between pairs (cells of the matrix) link actors from different subsets. In this usage, at-sea transshipments, by default, do not include interactions among fishing vessels or among carriers. These interactions are missing. Thus, community detection algorithms designed to identify the best fitting solution by comparing relative density within and between groups for a one-mode network (i.e., encounters among all vessels with no differentiation between types of vessels) may not offer the best solution for observed network mapping only fishing vessel encounters with carriers as represented in a two-mode network [applying (Borgatti and Everett, 1997)].
Third, to identify intra-supply chain interference researchers must select sampling protocol that will reveal, not obscure, embedding mechanisms. Specifically, using geographic boundaries does not make sense when looking for communities of actors within fishing networks. Interactions among focal vessels outside of the target area function to embed these actors within a larger community of relations; these interactions may offer greater insight into IUU activities. For instance, a fishing vessel operating in a focal study area may leave the area to transfer IUU fish to a carrier. Rather than applying a spatially contrived boundary, studies that apply network analytics should use a conventional network approach to sampling so not to distort social boundaries (Bichler, 2019).
Considering the potential limitations of prior research and their use of subgroup detection algorithms, we argue that alternate, context-specific methods are needed to sift through relational patterns to uncover functionally meaningful groups. Using qualitative network-friendly methods in the detection of illegal practices is pertinent and has potential because context-specific applications of subgroup detection, when used in tandem with dynamic multivariate analyses, deepens the enquiry revealing social mechanisms that shape the formation of communities. It follows that the primary objective of this study is to investigate the utility of an alternate protocol for identifying subgroups of vessels at elevated risk of IUU activity when encounter data map two-mode, sparse networks for a single segment of the ocean-to-table supply chain. Advancing Petrossian et al.’s (Petrossian et al., 2022) finding that integrating positional analysis with characteristics of vessel operations is critical to understanding the character of identified subgroups (Petrossian et al., 2022), we also aim to integrate several vessel attributes adopting a multivariate approach to explore the importance of homophily (the tendency to form social relations with others having similar characteristics). Responding to Park and Stamato, we acknowledge that while graph visualization is an essential tool for communicating findings, researchers must select appropriate strategies, as not all layouts and techniques clearly communicate results (Park and Stamato, 2020). Thus, we aim to use comparative techniques in tandem to improve the readability of analytic visualizations. Finally, we extend prior social network studies by exploring relational tie strength (repeated transshipments among pairs of vessels) to investigate the importance of enduring relations among subgroups across observations in search of potential social mechanisms that may facilitate the observed network structure. Four questions are answered here: (1) Do identifiable communities include suspected IUU fishing activities? (2) To what extent do the cross connections link vessels to fishing activity outside of the study region? (3) What are the characteristics of these groups and which vessels are most active (e.g., flag of registration, deviance, relative position, enduring relations)? (4) How does the relative position of carriers change over time?
2 Mapping encounter networks
2.1 Data source
A publicly available dataset of commercial fishing activity was obtained from the Global Fishing Watch (GFW) in March 2022. GFW is a non-governmental organization dedicated to observing transparency in commercial fishing. It aims to advance ocean governance by influencing policies and practices that will protect biodiversity while promoting commercial fishing (https://globalfishingwatch.org). In furtherance of this aim, GFW collaborated with Oceana, SkyTruth, and Google to develop an automated vessel monitoring system (AIS) detection tool that uses satellite technology to identify likely transshipments between vessels. Given the lack of available transshipment data, GFW used information about potential vessel-to-vessel interactions as a proxy measure of vessel encounters (Masroeri et al., 2021). GFW defines an encounter as a continuous interaction between a carrier and fishing vessel lasting over two hours. The automatic detection algorithm classifies vessels as interacting when they are positioned within 500 meters of each other and are at least 10 kilometers from a coast. Despite the potential for missing data (Masroeri et al., 2021; Kumar et al., 2022; Masroeri et al., 2022), GFW AIS data is arguably one of the most complete sources of information used at local and global scales to investigate potential IUU fishing and at-sea transshipments [e.g (Mazzarella et al., 2014; Miller et al., 2018; Purivigraipong, 2018; Welch et al., 2022)].
2.2 Sampling protocol
Figure 1 illustrates the 2-step sampling protocol we used to extract seven years (2015–2021) of potential vessel-to-vessel encounters from the commercial activity detected by the GFW AIS. Step 1 involved identifying all encounters between 21 carriers and 141 fishing vessels observed to interact within the FAO Area 81 during the study period.
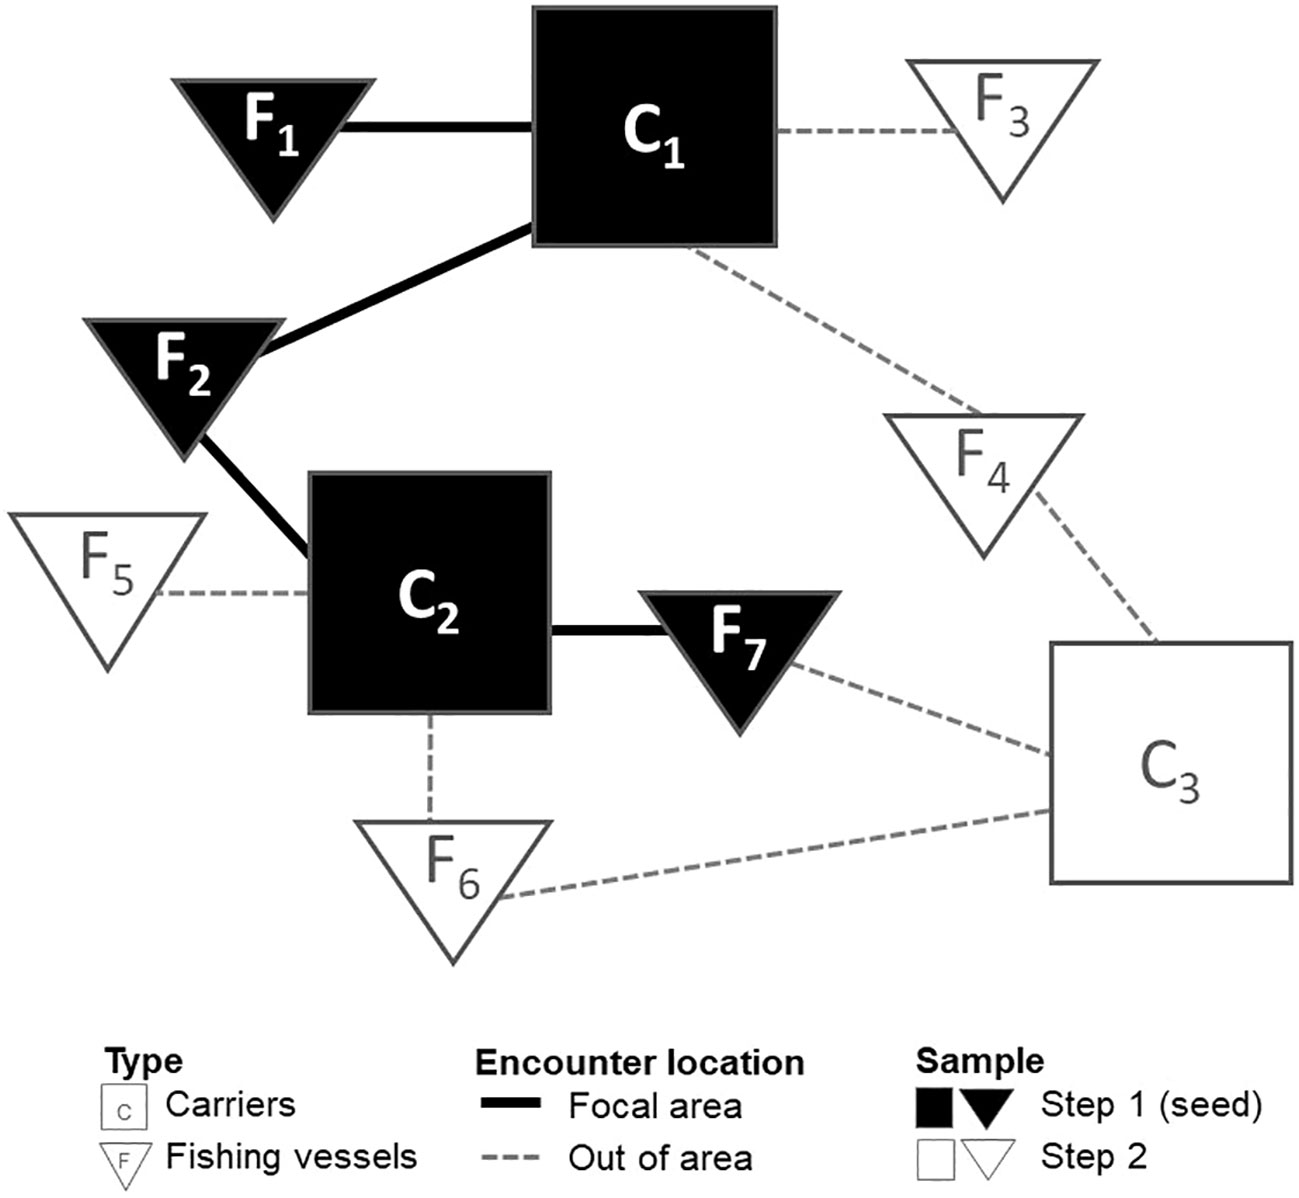
Figure 1 Two-step sampling protocol. The image illustrates sampling protocols for Step 1 encounters (black lines) among seed vessels with black symbols and vessels identified in step 2 are represented by white symbols with encounters shown as dashed grey lines.
We selected FAO Area 81 (Figure 2), a subregion under the auspices of the Western and Central Pacific Fisheries Commission (WCPFC) because the WCPFC experiences one of the highest proportions of transshipment, which is partially due to the presence of the world’s important tuna fisheries within its convention area (Borgatti and Everett, 1997). Over 50% of global tuna catches occur in this area; estimated at about $22 billion at the final point of sale, it is a critical sector of the supply chain (Galland et al., 2016; Seto et al., 2020). In addition, we selected this region because the WCPFC is also one of the few RFMOs with relatively robust management plans in place, suggesting the highest potential for data availability (Ewell et al., 2017). The 162 vessels observed in the study region constitute the seeds of the sampling strategy. In total, these vessels had 392 qualifying encounters.
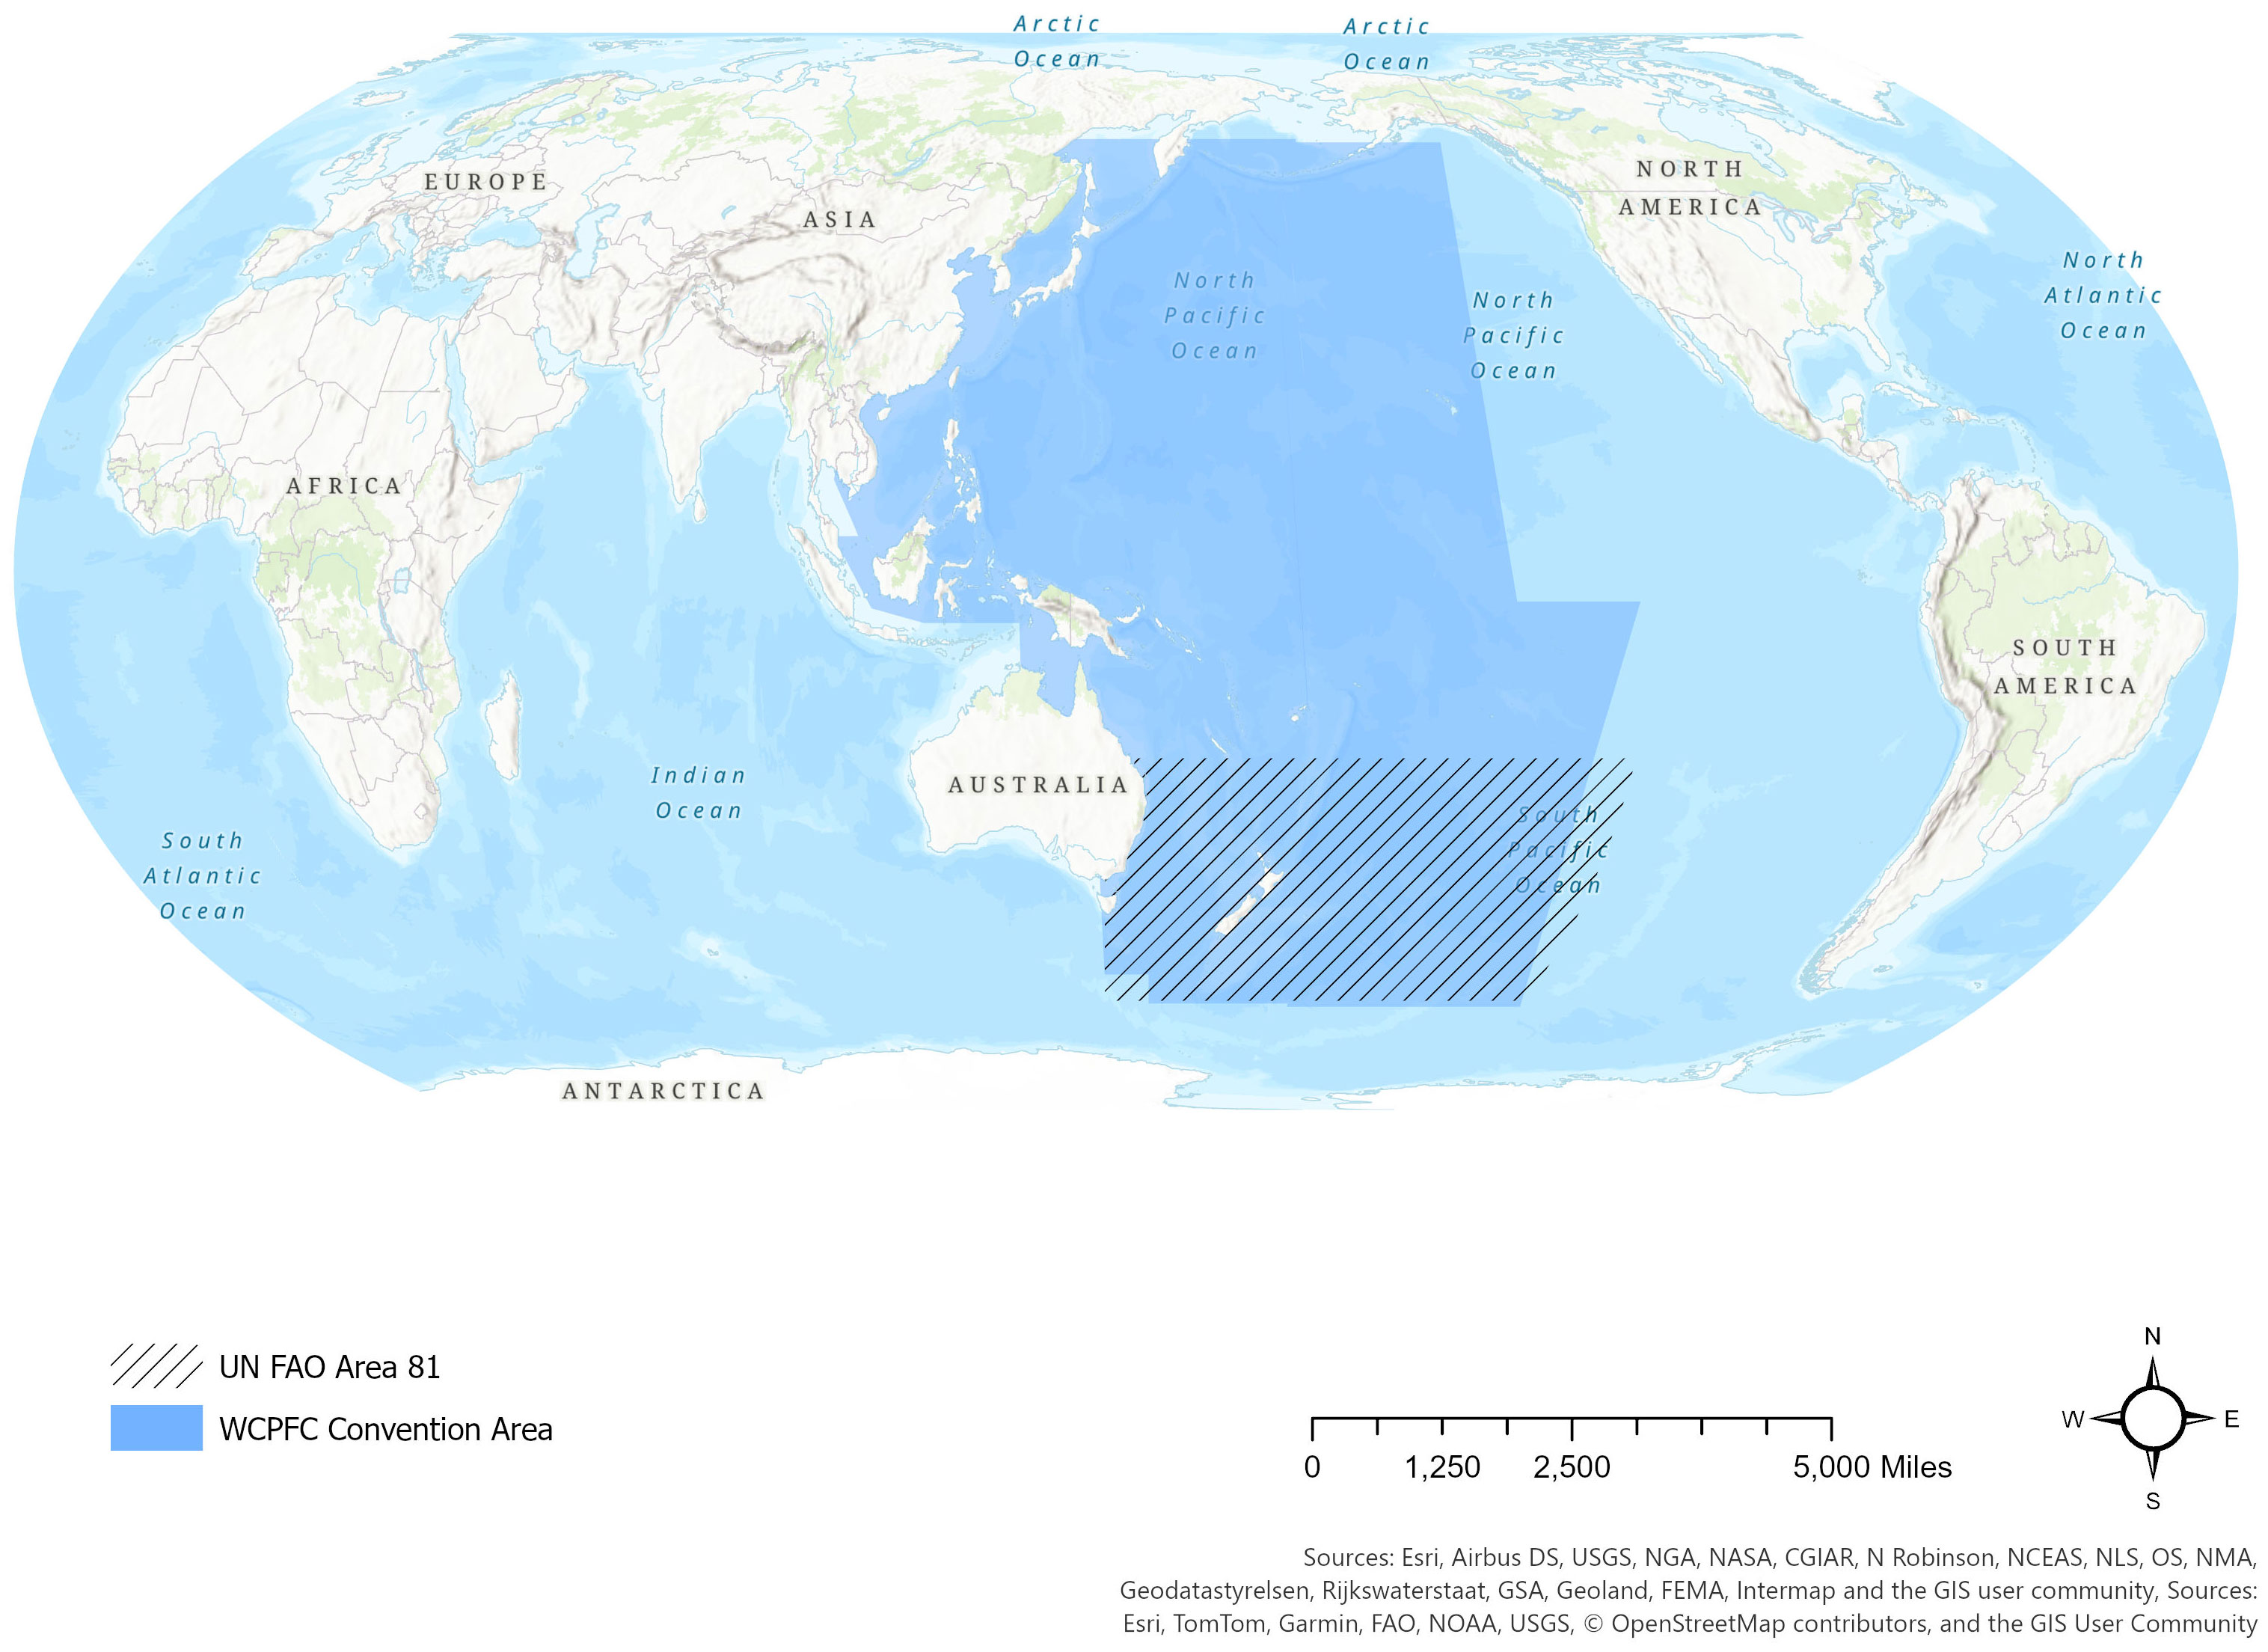
Figure 2 Study region. The blue region identifies the Western Central Pacific Fisheries Commission Convention area, and the hash lines depict the focal study area, UN Food and Agriculture Organization Area 81.
To situate these potential transshipments within the larger community of commercial fishing, we traced other encounters involving the 162 seed vessels occurring elsewhere during the study period. Returning to Figure 2, this second step identifies fish transfers involving additional vessels that encountered seed vessels (e.g., fishing vessels number 3-6 and carrier 3). Carriers were observed to be involved in 3,604 additional transshipments, and the fishing vessels were observed to be involved in 397 additional encounters outside of area 81. Combining encounters identified in both steps is critical to understanding how focal fishing activity is embedded in a larger network, and this may advance efforts to identify the vessels involved in bridging lawful and IUU fishing activity. This initial set included 4,393 vessel encounters.
2.3 Exclusion criteria
Two exclusion criteria were applied to focus on potential intra-supply chain interference; that is, encounters among legal actors potentially engaged in illegal activity. First, we excluded encounters involving unidentifiable vessels. This means that all encounters must involve vessels with an IMO (International Maritime Organization) or MMSI (Maritime Mobile Service Identity) identification number because these numbers were used to generate attribute information described below (Section 3.1). Due to missing vessel identification data, the initial sample was reduced to 3,594 encounters. Then, given that this investigation aims to detect subgroups within the larger fishing community, we also applied an encounter threshold to remove pendants. In network terms, pendants are actors with only one connection to anyone in the network. We reasoned a single at-sea transshipment in a seven-year period was not sufficient to establish “membership” in a community. To be included in the study, fishing vessels must have been involved in two or more encounters with carrier vessels during the study period. This criterion left us with 3,307 total encounters representing 1,657 unique combinations (or pairs) of vessels. The sample is comprised of 30 carriers and 613 fishing vessels, of which 70% of carriers and 23% of fishing vessels were observed to participate in at-sea transshipments in the focal study area.
2.4 Network generation
Eight networks were generated by connecting fishing vessels to carriers in a directed arc. One network mapped all activity observed, and seven mapped annual networks. Arcs are ties or linkages that denote the direction of fish offload, with fishing vessels transferring their catch to carriers. While both sets of vessels engage in fishing activity, these vessels participate in distinct functions within the supply chain, thus, the resulting networks could be considered two-mode networks. As explained previously, two-mode networks represent interactions between two distinct types of actors using a bipartite graph. Networks were valued by the number of encounters observed each year.
3 Detecting illicit communities and influential actors
3.1 Identifying vessels at high-risk of IUU activity
3.1.1 Record of detentions and violations
The first proxy measure of IUU activity was a record of detentions and violations of international maritime conventions. While shipowners/operators are responsible for complying with international maritime conventions and flag states must monitor compliance, many vessels operate at a distance from home ports, making routine inspection difficult. Harmonized inspection programs fill the void, using port state authority to board and inspect vessels operating outside of their flag’s jurisdiction. These coordinated efforts facilitate greater transparency of fleet operations at a regional level without having to contact each port state for a data request. FAO Area 81 falls within the Tokyo MOU.
Aiming to promote maritime safety and conservation, the Tokyo MOU established the Port State Control Committee in 1993. This international collaboration among 21 maritime administrations coordinates a harmonized vessel inspection program to establish greater oversight of shipping activities in the Asia-Pacific region. Working to eliminate substandard shipping and safeguard working and living conditions on board ships, the Port State Control Committee provides public access to the results of inspections, including deficiencies and violations detected, ship risk level, and detentions along with vessel identification (IMO number, Ship name, Callsign, MMSI, and Flag) and other inspection details (type of inspection and date of inspection).
Looking up the IMO, ship name and operator, we used this data source to record the number of detentions, violations, and inspections occurring within the study period (https://www.tokyo-mou.org; went offline July 2022, back online September 2022); 162 vessels were listed in the Tokyo MOU database, of which, 101 were detained. During the period observed 43% of the carriers had violations, with the number of deficiencies cited ranging from 8 to 322 (mean = 148, SD =93).
3.1.2 Flags of convenience
The second proxy for potential IUU involvement was flag of convenience (FOC) registration. FOC registration occurs when ships are operated or taxed under the laws of a country different from its home country to save money. The International Transport Workers’ Federation (ITF) maintains a list of vessel registries reputed to have open policies, meaning they will accept vessels for registration (a.k.a. ascribe nationality to), without requiring a local presence. Historically, these registries have minimal oversight and are routinely criticized as permitting substandard ships to operate. The ITF is an international trade union federation of 670 transport workers’ unions representing over 18 million transport workers from some 147 countries (https://www.itfseafarers.org/en/focs/current-registries-listed-as-focs). At the time of the study, four countries represented in the encounter data were classified as FOCs by the ITF’s Fair Practices Committee. We modified the list, discounting Vanuatu as this registry is located within FAO Area 81, and the three vessels in question were operating within the vicinity of their flag state.
We extracted vessel registration information from IHS-Markit (https://news.ihsmarkit.com; accessed March 2022-May 2022). IHS-Markit provides commercial shipping information, analytics, and solutions for governments and financial markets. We extracted flag, MMSI, type of vessel, name of the vessel, group owner, operator, and registered owner. As reported in Table 1, about 91% of fishing vessels are registered with Asian nations, and FOC represents about 53% of carrier vessels.
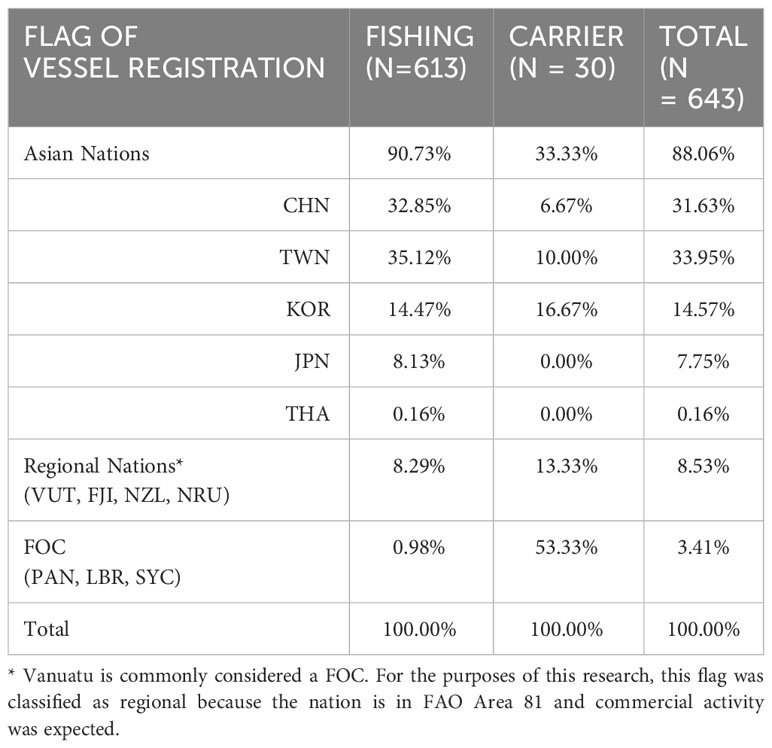
Table 1 Vessel registration.
3.2 Subgroups with faction analysis
Commonly used community detection algorithms identify subgroups by patterns of connectivity. Fundamentally, most approaches rely on cohesion (Borgatti et al., 2018). Using different thresholds of connectivity, approaches drill down to or build up subgroups of actors with greater within-group connectivity than between-group connectivity for one-mode graphs. Because our sparse graph does not readily lend itself to this type of analysis, we opted for a faction analysis (Borgatti and Everett, 1997).
Faction analysis does not require a threshold level of connectivity. Instead, the algorithm optimizes a cost function that measures the degree to which a partition consists of connected clique-like structures using a block modeling process. Starting with an objective of finding two partitions in the graph (two factions), the algorithm arbitrarily assigns every actor to a group, then proceeds through an iterative process moving actors between partitions in a search for the best fitting solution. The number of missing ties within each group and observed ties between the groups are counted as errors or costs to the solution. In other words, the cost represents the sum of differences in the number of actors and links between the adjacency matrices of two graphs. The solution selected is the one that minimizes cost (e.g., lowest Hamming distance).
Repeating the estimation with an increasing number of factions (or decreasing if you start with a high number) will change the cost of the solution (i.e., change of the Hamming distance). When the value ceases to show meaningful change with the addition of another faction (or reduction in specified factions), the optimal solution is thought to be achieved. As implemented in UCINET (Borgatti et al., 2002), the faction analysis we used optimizes the search for partitions using a tabu heuristic, where actors (nodes) checked for fit are only assessed once (Glover, 1989; Glover, 1990), making this a relatively efficient option for subgroup detection in large networks (de Amorim et al., 1990).
3.3 Dynamic positional analyses
The social mechanisms underpinning how relations form among actors have implications for operational success of the network. Thus, augmenting subgroup detection analysis, this study includes dynamic and multivariate positional analyses to begin an investigation into several social mechanisms widely shown to shape social relations, deviant or otherwise—tie strength and homophily, activity, and preferential attachment [e.g (Bichler, 2019)].
Writing about the role that ties of varying durability play in generating strong, resilient networks, Granovetter (Granovetter, 1973; Granovetter, 1983) noted that strong, enduring ties tend to form among actors with the same characteristics (homophily). Homophily, often measured as actor attributes, may represent the same nationality or ethnicity, age cohort, or social status. Relational tie strength is considered a function of factors like the frequency, duration, and intensity of contact. Applied to at-sea transshipments, subgroups with many strong ties (repeat encounters) are more likely to be observed among vessels with similar characteristics, such as national flag [e.g., extrapolating from (Petrossian et al., 2022) and (Park and Stamato, 2020)]. It follows, that if deviant carriers are more strongly connected than national carriers within the subgroup, it might be reason to suspect that these vessels have a greater influence in shaping the subgroup culture.
Carrier activity is also a key factor. Measured with the in-degree centrality metric, we calibrated carrier activity using the number of transshipments received. In-degree centrality is one of the ways of operationalizing central positioning, permitting researchers to rank the importance of actors. In-degree centrality ranks the relative position of actors based on in-coming ties, i.e., transshipments received (Freeman, 1979). Highly central actors are generally interpreted as being influential or important within the network. In a valued network capturing all encounters, a carrier with high indegree centrality might receive a lot of offloads from a small number of fishing vessels or infrequent transshipments from many fishing vessels.
In this context, carriers that are more active could be construed as having greater operational success. More successful carriers are likely to play critical roles in embedding the subgroup within the larger community [extrapolating from (Burt and Merluzzi, 2014; Burt, 2015)]. While strong ties are important for generating and sustaining group norms and supporting the formation of a shared culture, weak ties, those infrequent ties to different sets of actors (i.e., different factions), support the acquisition of new information and promote flexibility and network resilience; weak ties are critical for organizational survival and success in a changing market environment (Burt, 1992). If so, these central actors may play a vital role in cross-group linkages of illicit supply chains [e.g (Morselli et al., 2007; Bichler et al., 2017; Duxbury and Haynie, 2018; Bright et al., 2019)]. Adding a dynamic context, preferential attachment, the tendency of prominent, popular actors with many connections to attract more relations at a higher rate than less connected actors, may emerge as a critical social mechanism generating communities of actors (Barabási and Albert, 1999) with implications for network disruption efforts (Diviák, 2023). Maximal disruption of illicit supply chains may result from strategic efforts to target deviant carriers exhibiting preferential attachment, that is, those observed to have increased in-degree centrality over time.
4 Results
4.1 Observed network
Figure 3 presents a multivariate illustration of the full encounter network. Immediately evident, refrigerated carriers differ in their centralization and level of deficiency. While FOC carriers are spread throughout the network, subgroups of vessels tend to cluster by flag; Chinese, Taiwanese and Korea fishing fleets occupy different regions of the network. Carriers appear to cluster in sectors that include at least one highly deficient vessel.
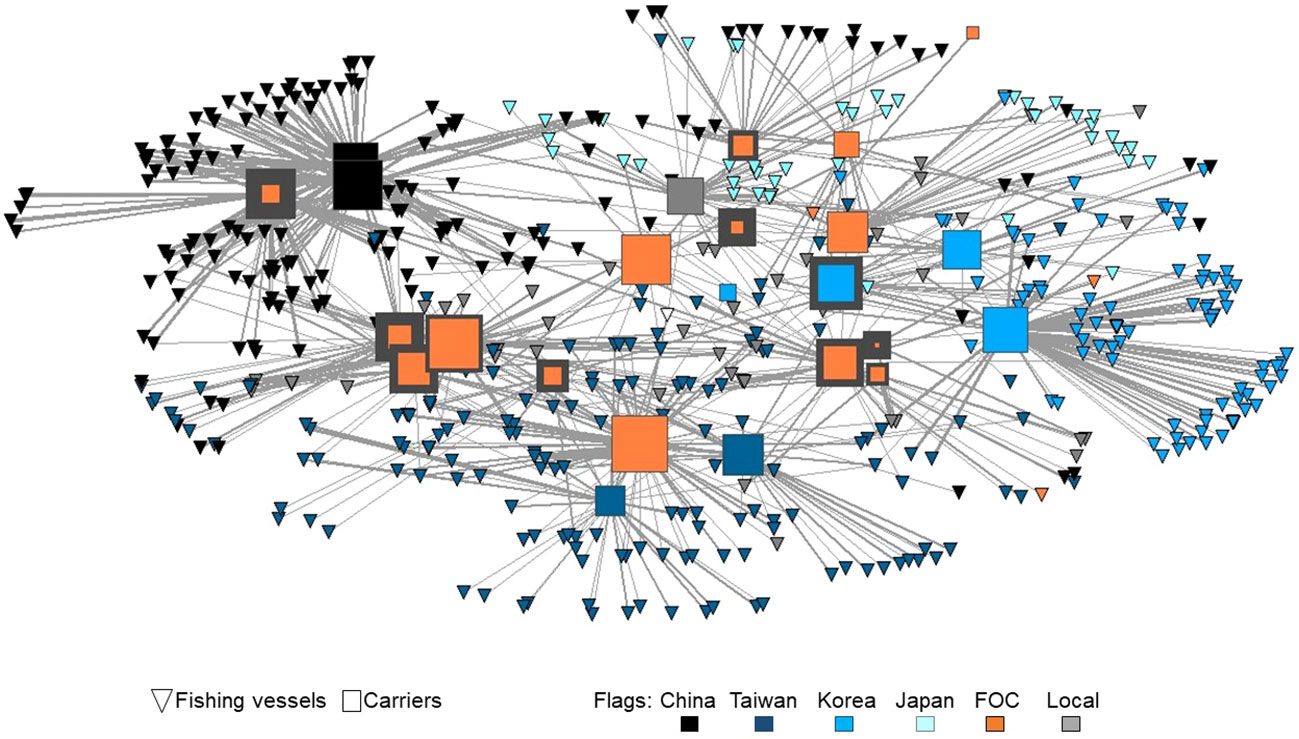
Figure 3 Illustration of study data, all encounters 2015-2021. Symbol size varies by overall in-degree centrality, and rim width contrasts carriers by the number of deficiencies recorded. As used here, indegree centrality ranks carriers by the relative volume of transfers received, with larger symbols indicating greater activity. Line width differs by the number of encounters between pairs of vessels and symbol color represents the flag state. The graph layout represents geodesic distance with socially proximate vessels (similar patterns of connectivity) positioned nearer to each other.
4.2 Faction identification
Starting with a two-factor solution, we identified factions by increasing the number of factions to a maximum of 30 (the number of carriers in the data), or until the Hamming Distance failed to show substantive change. As indicated in Figure 4, there was a substantive improvement in fitness until the five partitions solution, with minor gains until 8 partitions. Fitness plateaued with successive estimations.
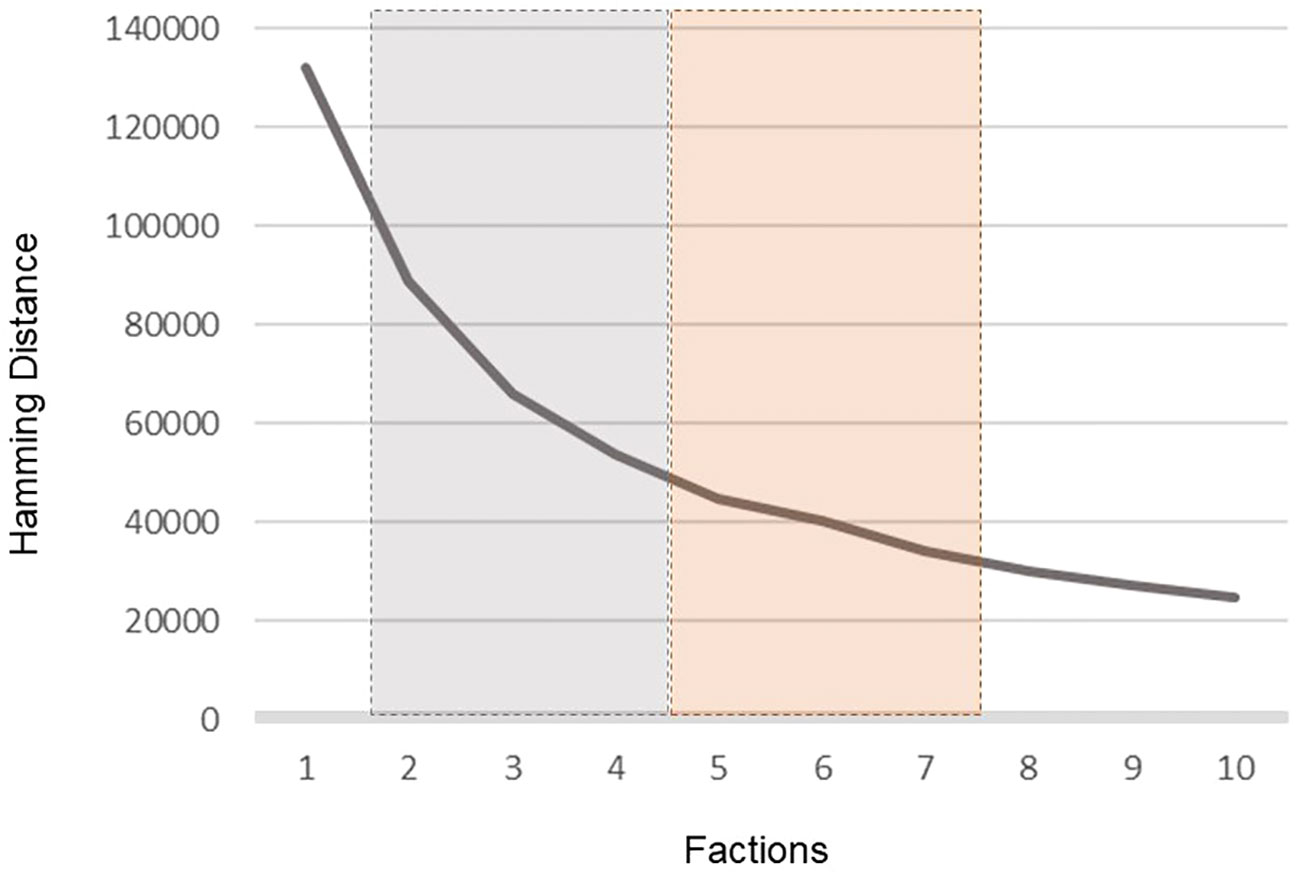
Figure 4 Hamming distance scores. Hamming distance scores indicate the dissimilarity between matrices. Lower values indicate more similarity. The grey region highlights large improvements in fit observed with each successive introduction of additional factions and the orange region highlights where the inclusion of additional factions does not materially improve the fitness of the solution.
Examining the between-faction encounters provided a deeper comparison of solutions (see Figure 5). Setting a threshold for maximal between-factions encounters at<5%, we sought to identify the most parsimonious solution with the lowest concentrations of cross-faction activity. This means that the largest number of unique between-faction ties must constitute less than 5% of all unique ties. Unique ties represent all observed pairs, temporarily ignoring repeat encounters. Recall that the sampling procedure involved a two-step selection process extending outside of the initial focal region and that 30% of the carriers included in the were not observed to engage in at-sea transfers in this region even though they interacted with focal seed fishing vessels during the study period. Thus, some cross-faction activity is expected because these carriers are not observed in the study region during this time.
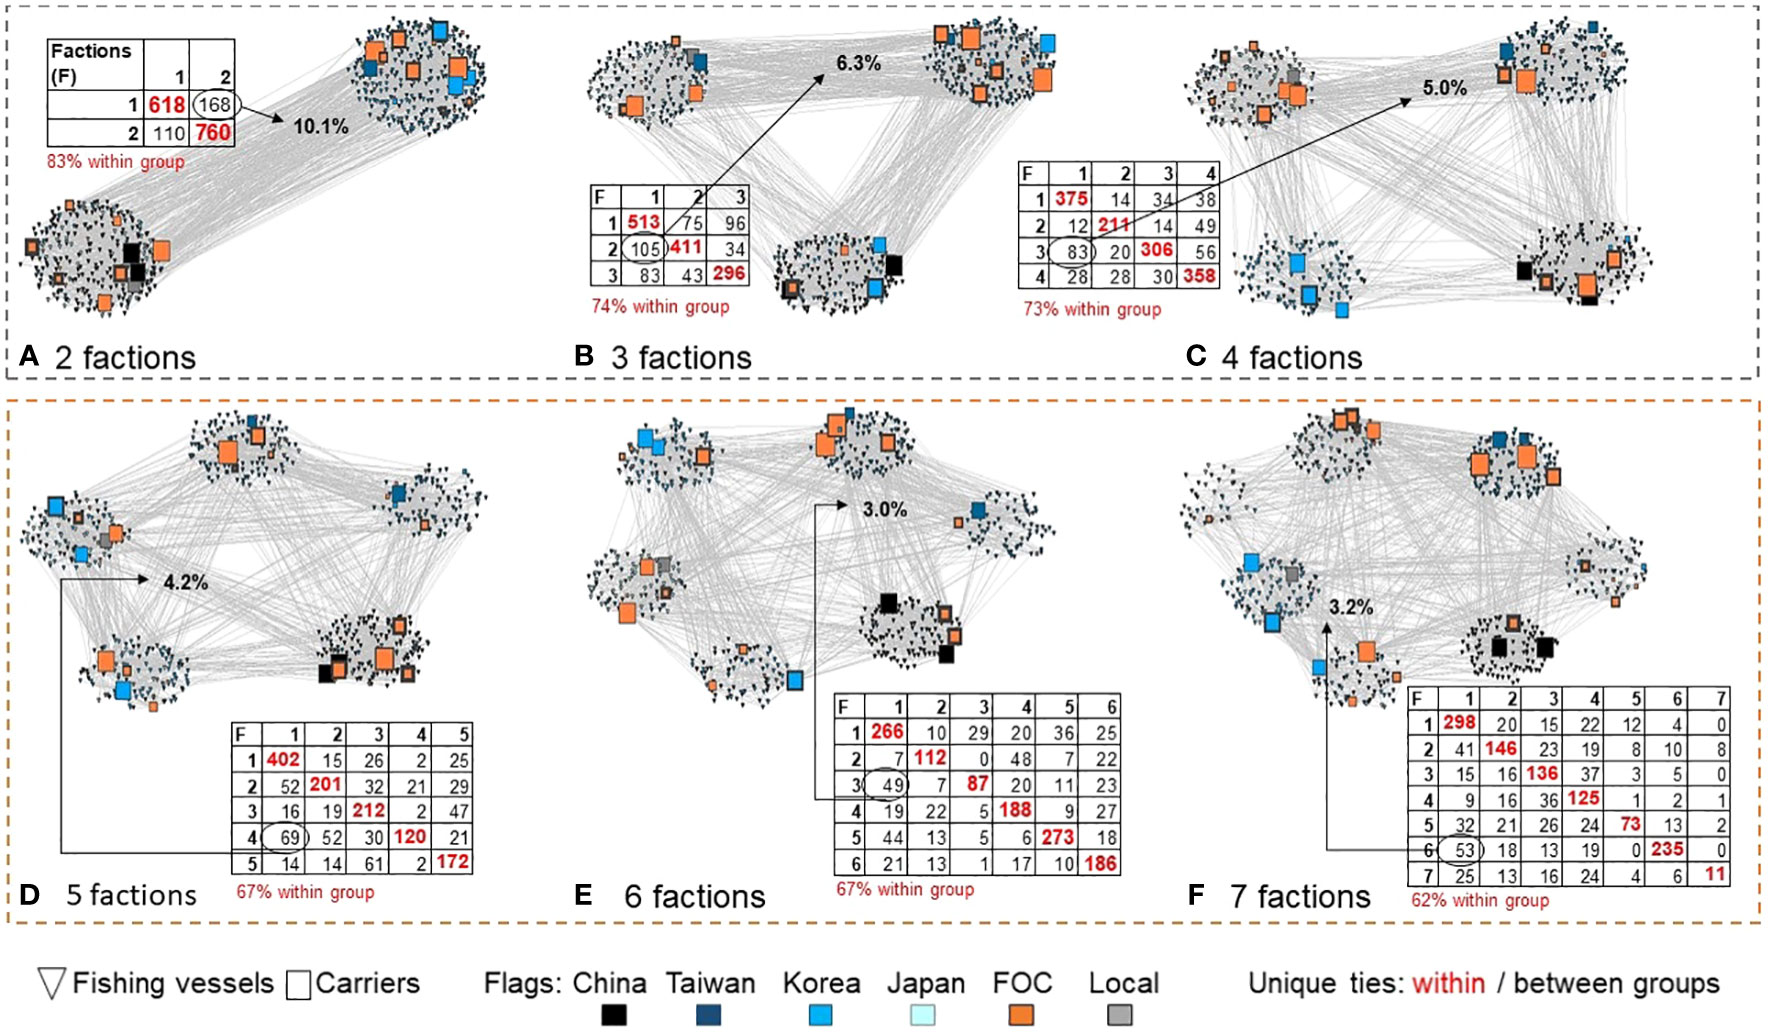
Figure 5 Visualization of partitions. Panels (A‐F) depict factions with symbol size indicating carrier centrality, rim variation representing defficencies, and tabular inserts reporting within- and between-faction ties. The largest set of between-group transshipments is indicated; for example, (A) the two-factor solution results in 168 at-sea encounters from fishing vessels classified as Faction 1 to carriers allocated to Faction 2. This represents 10.1% of the unique vessel pairings observed.
Evident by the volume of cross-faction linkages reported in the diagonals of the insert tables (black text), the volume of between-faction encounters reduces with the inclusion of additional factions up to a point. The first solution observed to meet the<5% criterion is the solution with five factions. Notably, at a five-factor solution, groups were generally partitioned into national fleets with some transshipment involving FOC flagged carriers; 67% of all interactions were within faction.
Focusing on Panel D, the five-factor solution, the largest faction (Faction 1) includes 402 of the at-sea within group transshipment interactions (red text); due to repeated encounters, this represents a total of 1,052 of all encounters observed. Calculating the row and column marginals reveals that the carriers in Faction 1 (dominated by Chinese vessels) receive transfers from 85.5% fishing vessels within their faction, but this constitutes 72.7% of the vessels they interact with. Turning to the off diagonals, we observe the largest between-group interaction to involve 69 fishing vessels from Faction 4 (largely Taiwanese and Korean vessels) transferring cargo to carriers in Faction 1, whereas only two fishing vessels from Faction 1 offloaded to carriers in Faction 4; a clear direction of influence is observed.
4.3 Faction characteristics
To better understand the faction characteristics and strength of relations within and across factions, Figure 6 illustrates the between-group connectivity for the valued graph, given a five-factor solution arranged by faction (X-axis) and in-degree centrality scores indicating relative potential transshipments of fish (Y-axis). Recall that in a valued graph, connections between pairs of vessels are weighted by the number of encounters observed. The graphs depict factions, named by the dominant non-FOC carrier’s flag, shown alongside a second analysis, where vessels are arranged by geodesic distance using node repulsion and equal distance bias. We use the number of encounters to indirectly measure the strength of potential relations between fishing vessels and carriers. This analysis aims to investigate whether a two-pronged approach, focusing on repeated encounters over time, can enhance the detection of distinct, enduring subgroups.
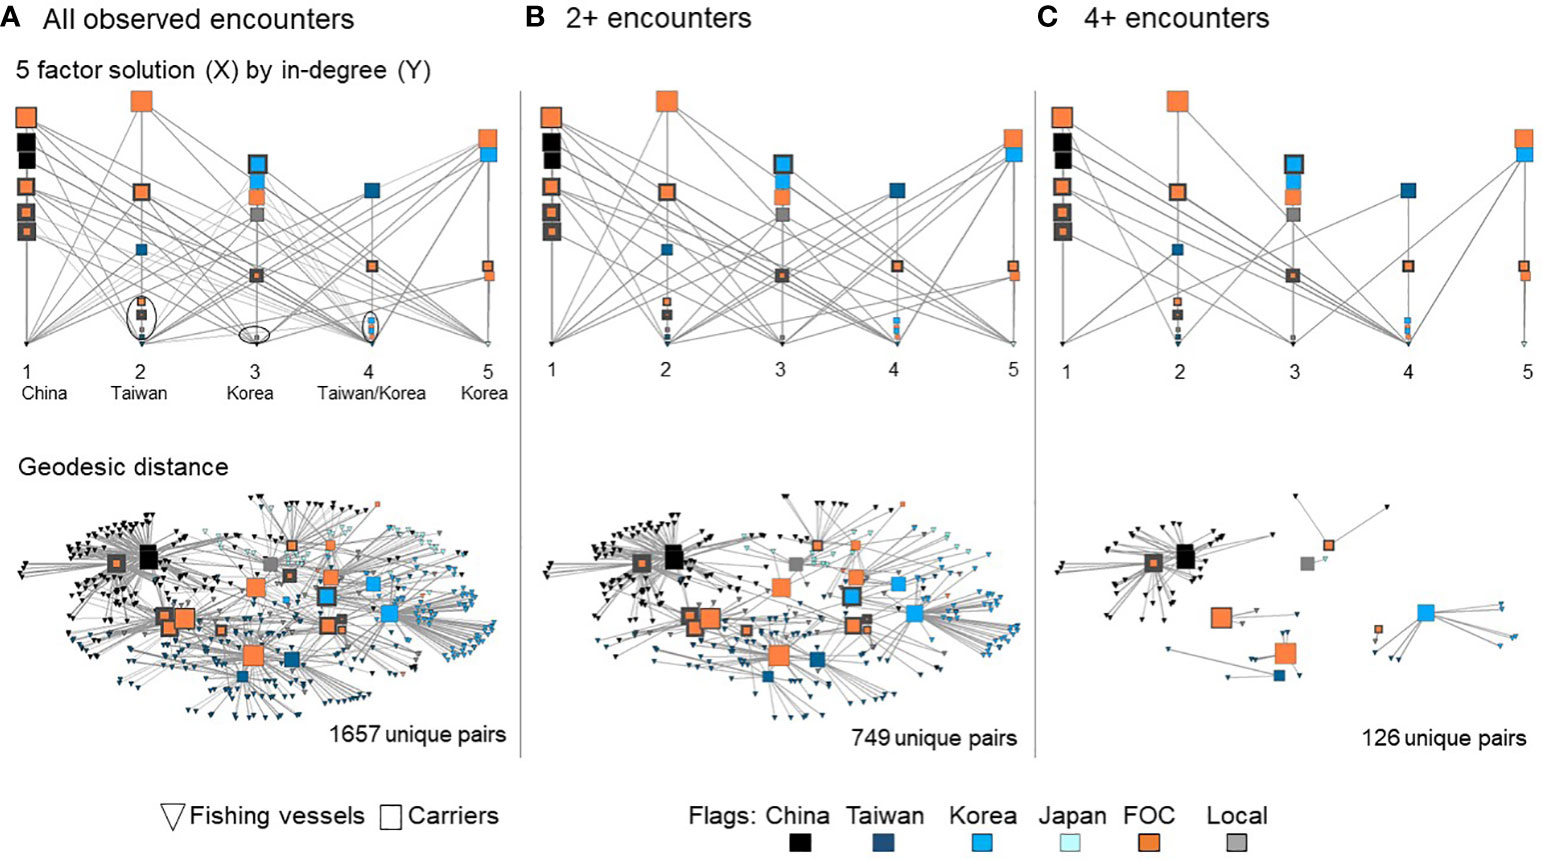
Figure 6 Comparative visualization of valued encounter networks. Figure shows the full network with all encounters (A), vessels involved in two or more encounters (B), and four plus encounters (C). For both sets of graphs, symbol size varies by overall in-degree centrality and rim width contrasts carriers by the number of deficiencies recorded. Line width differs by the number of encounters, and symbol color represents the flag state.
Intra-supply chain interference within communities. Within factions, many encounters involve fishing vessels of the same flag, with partitions identifying national fleets (see Figure 6). Repeat relations, involving two or more encounters, are a prominent feature of subgroups. However, of the top ten most central carriers (selecting the most central from each faction), 60% are FOC-flagged vessels. Additionally, with one exception, highly deficient FOC carriers (denoted by thick symbol rims) also interact with many vessels within the faction. These deviant actors are highly centralized based on many weak ties. The network exhibits one dominant faction; Faction 1 (dominated by Chinese vessels) has the greatest number of strong relations, and this faction has two sets of highly central and highly deficient carriers.
Overlapping communities. Between-faction connections occur through many weak ties (infrequent encounters over a 7-year observation period); however, some strong connections are observed to cross factions, linking different subgroups. Central carriers play a prominent role in generating overlapping communities; each faction includes at least one highly central carrier estimated to participate in four or more transfers with some fishing vessels in other factions. Of note, multiple Faction 1 carriers are strongly connected to fishing vessels in all but the 5th faction. Thus, carriers of Faction 1 play a dominant role in facilitating the network.
All carriers were observed to interact with fishers inside and outside of the focal region; with a median of 85% of transactions occurring outside the focal region with other fishers, carriers are instrumental hubs facilitating transshipment and embedding the region into the larger ocean-to-table supply chain. The ellipses depicted in Panel A of Figure 6 draw attention to carriers only receiving transshipments outside of the focal region; Factions 2, 3, and 4 include several carriers that were observed to receive fish from vessels that fished in the study region but transshipped cargo when they were outside of the study area (4/7, 1/6, and 4/6 respectively). Notably, considering the volume of encounters represented by these out of area transfers, 9% of Faction 2 encounters involve area fishers transferring cargo outside the study region,<1% of Faction 3 transfers, and 8.5% of Faction 4 transfers. While these carriers have weak ties, they play a role in embedding regional activity into the broader scope of the at-sea transshipment network.
4.4 Structural change
4.4.1 Network evolution
Table 2 shows that detected encounters vary by year, but overall, the GFW AIS data identified more activity post-2017. The variable, total encounters, counts the number of vessel-to-vessel interactions recorded for the valued network capturing all eligible at-sea transshipments (repeat interactions), and the unique pairs describe the number of interactions observed when considering only the unique pairs of interacting vessels, i.e., in 2015, 79 pairs of vessels interacted but some pairs engaged in more than one transshipment (96 total encounters). Over time, commercial fishing activity involved a greater number of vessels. Additionally, each year, multiple interactions occur among some pairs of vessels, and this trend of repeat interactions is increasing.
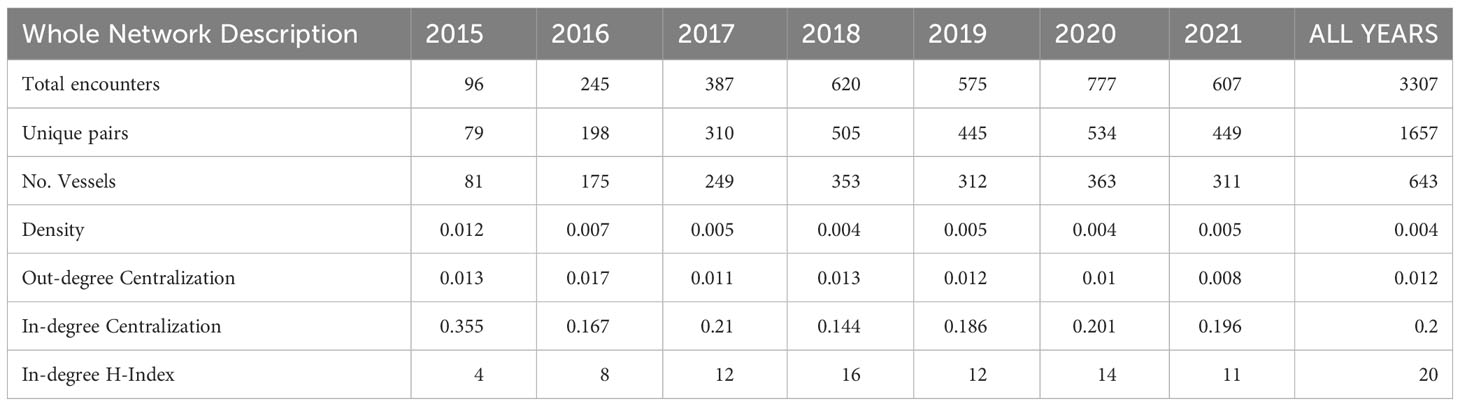
Table 2 Description of networks.
Centralization metrics, reported as proportions, highlight the importance of active vessels. Centralization metrics reveal the extent to which the graph is organized around its most central actor. Centralization is a ratio of the sum of differences between the most central actor and all others divided by the maximum possible. Values range from 0 to 1, where a value of 0 indicates a complete graph (where all actors are connected to each other) and 1 indicates a maximally centralized graph (where the structure is characterized as a star shape with all other actors only connected to the most central actor). Centralization values typically fall between these extreme values, often indicating there is a set of central actors. Notably, other metrics are needed to determine if these points are spread through the graph or concentrated as a cluster in an identifiable structural center (Wasserman and Faust, 1994; Borgatti et al., 2018).
The centralization metrics reported are based on in- and out-degree centrality. As used here, in-degree centralization calculates the proportion of fishing vessels that extend a connection, meaning transfer fish to, the most active (popular) carrier. While in-centralization varies, the most active carrier overall (all years) collects fish from 20% of the fishing vessels. Conversely, out-degree centralization explores the influence of fishing vessels, by calculating the activity of these vessels in relation to the number of carriers they interact with. In other words, the most prolific fishing vessel accounts for 1.2% of carrier onboardings.
With the number of vessels operating in the region increasing, it is not surprising that the overall density of the network decreases. Density is commonly used to measure the overall connectivity among a set of actors in a network; values range from 0 to 1, with 1 indicating that all permutations were observed. This means that every actor in the network connects to every other actor; as used here, all vessels would encounter each other. The extremely small values reported in Table 1 indicate that the networks are the opposite of dense; they are sparse. In part, this is a byproduct of network generation protocols. Linking fishing vessels to carriers results in a sparser network by default because network generation protocols omit within type encounters, i.e., among fishing vessels.
The Hirsch index (also called the H-index) is commonly used to measure the citation impact of a scholar or a journal; the value of the H-index is the number of papers with a citation count > h. Applied to the positional importance of entities in a network, the H-index is a positional metric indicating that there are at least H neighbors with a degree centrality score no less than H (Lü et al., 2016). For the current study, we provide the in-degree H-index to compare carriers. Substantive change is observed; in 2015, at least 4 carriers had an in-degree score of at least 4, and after peaking in 2018 at 16, fishing operations during 2021 revealed 11 carriers encountered at least 11 fishing vessels.
To investigate more directly whether relationships are enduring, in that fishing vessels continue to interact with specific carriers over time, we explored two stability metrics. When used to analyze the dynamic relative association between actors of two networks, the Pearson Correlation Coefficient indicates the similarity of tie values across two observations. In other words, this coefficient answers to what extent vessels participated in the same number of at-sea encounters in 2018 as they were in 2019. Values of -1 suggest that at time1, vessels exhibit the opposite pattern of connectivity than they did at time2; values of +1.00 reflect perfect structural equivalence, indicating that vessels participated in the same number of encounters in both observations. The results presented in Table 3 suggest that, in general, moderately strong, significant relations are observed across most years, suggesting that overall, highly active vessels remain active in the following year and vessels infrequently observed to transship remain relatively inactive in the following year. Except for the pandemic, the strength of this correlation increases over time, suggesting that preferential attachment may be at play. Preferential attachment is a tendency that favors popular, highly connected actors (Barabási and Albert, 1999). This suggests that vessels involved in more encounters have a stronger ability to attract additional business (more encounters) which may result in greater operational success (Burt and Merluzzi, 2014; Burt, 2015).
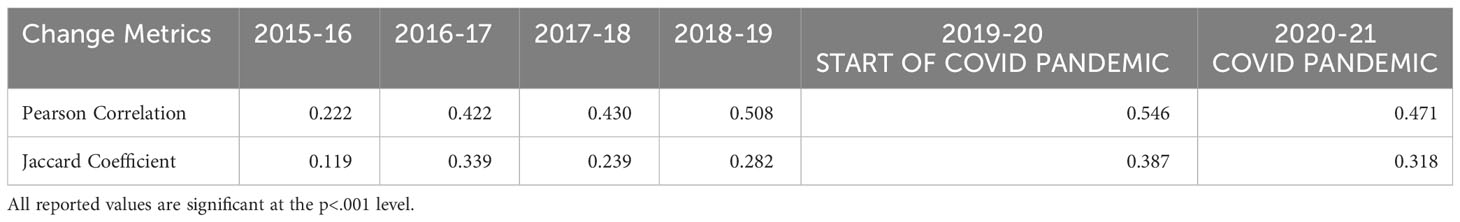
Table 3 Observed evolution in encounter networks.
Taking two networks at a time, the Jaccard similarity coefficient calculates the proportion of encounters that appear in both networks.
Since our observations compare different years, we interpret the Jaccard to reveal the proportion of encounters occurring in time1 that also appear in time2, using a rolling window of annual observations for unique pairs of vessels, i.e., 2015 compared to 2016, 2016 compared to 2017, etcetera. This coefficient was calculated on binary networks, where at least one encounter occurred (valued at 1) or not (valued at 0).
Jaccard values will range between 0 and 1, with 0 meaning no overlap between networks and 1 meaning perfect overlap. In other words, if the value is 1 then 100 percent of the relations in the first network appear in the second network. As used here, these values are indicative of the consistency of encounters among unique pairs of vessels. We found that stability in the network varies from year to year, but the highest years of stability in the network are 2016-2017 with 33.9% and 2019-2020 with 38.7%. This level of consistency suggests evolution is occurring within a network. Had the values been consistently below 0.20, we would interpret the networks as changing so much between observations that they constitute different networks. Akin to the Pearson Correlation Coefficient described above, when applied to networks, the significance of the Jaccard value was determined by an algorithm that compares the proportion of 2,500 randomly generated network permutations that were equivalent or exceeded the observed value. All reported values are significant at the p<.001 level.
4.4.2 Positional change
Comparing the average in-degree centrality score of carriers within each faction overall and by flag (within faction), Table 4 shows that Carriers belonging to Faction 1 (Chinese flagged or operated carriers) experienced sustained growth in activity, and those belonging to Faction 5 (Korean carriers) exhibited dramatic decline in activity. For example, in 2020, carriers in Faction 1 participated in an average of 3.96 (rounding to 4) encounters, whereas carriers from Faction 5 were observed to be involved in an average of 4.58 encounters in 2015, but this declined to an average of 2.41 in 2021 (and all this activity involved FOC vessels, as Korean carriers were no longer operating in the area). The activity (popularity) of FOC carriers of three factions (1, 3, and 5) increased over time.
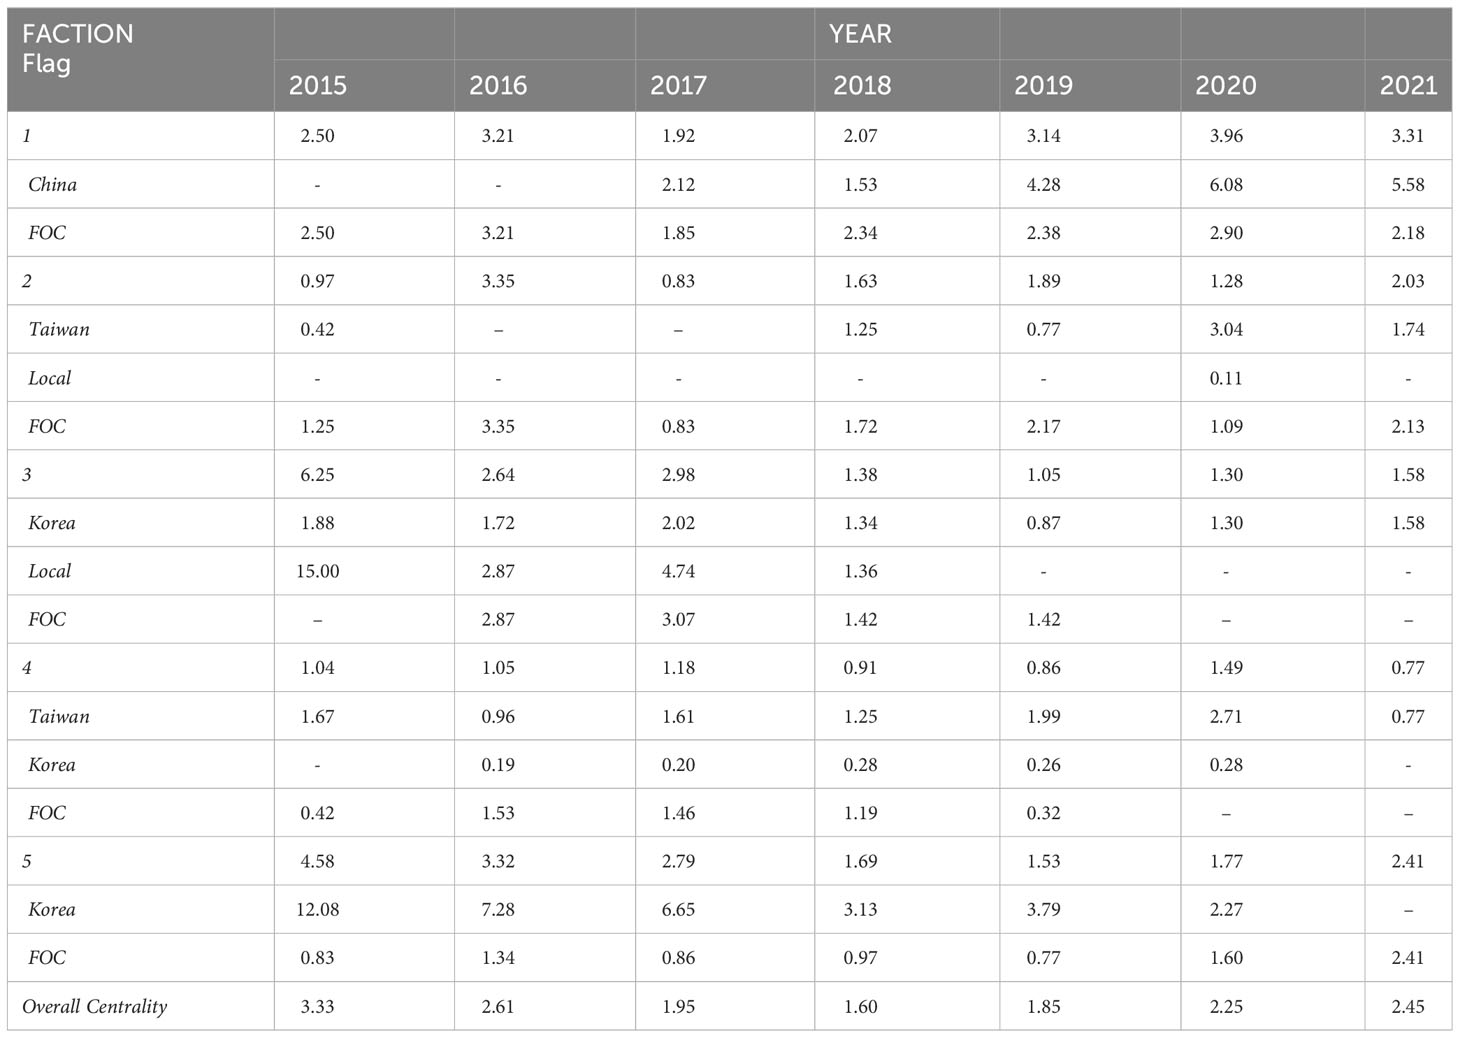
Table 4 Average in-degree centrality by faction and flag for carriers.
5 Discussion
Despite mounting evidence showing that at-sea transshipment activities have directly contributed to the depletion of high-risk species, such as tuna, sharks, mackerel, billfishes, salmon, squid, and crab (Gianni and Simpson, 2005; Miller et al., 2018; Seto et al., 2020), the fundamental challenge facing IUU researchers is that it is difficult to determine whether a specific set of vessels is engaging in lawful or illegal fishing activities. Most transshipment activities happen on the high seas at remote locations, beyond the authority of the coastal countries. This situation makes it relatively easy to obscure the origin of the catch, subsequently complicating the efforts at ports to distinguish the status of the fish offloaded by carriers. Reduced transparency undermines the efforts of regional fisheries management organizations (RFMOs) to effectively monitor the fisheries resources exploited within their convention areas (Boerder et al., 2018; Seto et al., 2020), a role that these organizations were charged with by the United Nations Fish Stocks Agreement in 1995 (UNCLOS, 1995). Using encounter data to map a single segment of the ocean-to-table supply chain, this study sought to investigate what a social network framework reveals about the structural characteristics of illicit supply chain interference, specifically how IUU fishing might be embedded within subgroups.
5.1 Consistencies with prior research
Consistent with prior research, this study affirmed that network methods and analytics could support targeted conservation efforts and policies aimed at identifying highly central carriers within identifiable communities of actors that are at elevated risk of IUU involvement (Greenpeace, 2020; Petrossian et al., 2022). First, this study found evidence of distinct communities involving multiple carriers and fishing vessels, with one community dominating the network; Faction 1 represented 32% of all encounters within the network, with carriers receiving transfers from 85.5% fishing vessels within their faction. Second, within each community, we found highly central carriers that engaged in many transshipment encounters, which suggests that centrality is a useful indicator to identify important actors. Third, while the general pattern of encounters within subgroups exhibited flag homophily (suggestive of a general preference among fishing vessels to offload to carries of the same national origin), each faction also included highly deficient FOC carriers that appeared to shadow other highly active (central) flag state carriers. This interaction pattern draws attention to the potential role played by national and FOC carriers in facilitating intra-supply chain interference [e.g (Miller et al., 2018; Greenpeace, 2020; Park and Stamato, 2020; Petrossian et al., 2022)]. Considered together, these findings reaffirm the importance of using multiple analytics to identify potential IUU activity.
5.2 Contributions
Knowledge gained here extends existing targeted conservation efforts and prevention policies that focus on the mechanisms and activities at the highest risk for intra-supply chain interference, the goal being to make the supply chain more resilient to interference (Marteache et al., 2020). First, the findings suggest that potential intra-market illicit supply involves strong and weak ties embedding overlapping subgroups into a global network. By using a 2-step sampling strategy, this study showed that weak ties (unrepeated interactions) and strong ties (repeated encounters between pairs of vessels) embedded highly central actors into the larger fishing industry, thereby extending the influence of deviant carriers beyond the focal region to the broader activity of national fleets. Observing that overlapping communities link different enduring subgroups through bridging hubs suggests that geographically constrained analyses can be misleading. Bridging hubs are highly active vessels that interact within different subsets of actors. This network position is associated with greater information control benefits and economic success (Burt and Merluzzi, 2014; Burt, 2015). When actors are both hubs and bridges, they are likely to have a positional advantage that facilitates their ability to control what is flowing through the network, as such, curtailing their illicit activity may have greater impact on IUU fishing beyond a target region. Thus, a more nuanced, multifaceted investigation of vessel position within and beyond the focal region could identify influential IUU actors.
Second, regarding network change, we found that, in general, relations evolve over time. Factions do not engage in consistent levels of activity, and the positional importance of specific carriers shifts, with some becoming more central and others becoming less central. Flag of registration was not necessarily predictive of high centrality as both FOC and non-FOC carriers gained and lost positional advantage during the study period. However, highly active vessels tended to remain active in the following year and vessels infrequently observed to transship tended to remain relatively inactive in the following year. Those carriers that retain relationships with fishing vessels over time have a stronger ability to attract additional business, raising the possibility of preferential attachment [e.g (Barabási and Albert, 1999)]. Metrics capturing this mechanism of change are well developed and can be used to support targeted interdiction efforts aimed at disrupting illicit supply chains (Duxbury and Haynie, 2018; Bright et al., 2019; Diviák, 2023).
5.3 Next steps to advance conservation research
There are three key directions for future research. First, this study exposed the inherent weakness of relying on conventional indicators of potential IUU activity, suggesting that rather than relying on port state inspection programs and FOC status alone, new composite approaches are needed to uncover illicit intra-supply chain interference. For example, Greenpeace (2020) identified behavioral criteria, arguing for example, that “risky reefers” have a broad geographic scope of operations, spend a lot of time on the high seas and within areas with no satellite tracking, and they visit ports that are known for low regulations found in countries that are not a party to the 2009 Port States Measures Agreement (Greenpeace, 2020). These criteria could be operationalized with network methods.
Second, while this study demonstrated the potential utility of social network analytics, continued network-oriented investigation stands to enhance our understanding of how IUU fishing interweaves within the fishing industry and what structural characteristics this illicit interference shares with other supply chains (Magliocca et al., 2021). This line of inquiry is particularly salient as current data sources have noted limitations and community detection algorithms vary, raising the possibility of generating false positives, that is identifying vessels at high risk of IUU involvement that do not engage in illegal fishing activity. To extend this investigation, future research could evaluate potential change mechanisms, such as preferential attachment, more directly with dynamic multivariate stochastic actor-oriented modeling to add greater statistical rigor to prediction models [e.g (Kalish, 2020)]. Also, machine learning and other strategies can be used to impute illegal harvesting and missing transshipment encounters, i.e., detect unobserved events (Masroeri et al., 2021; Kumar et al., 2022; Masroeri et al., 2022). This would allow conservation researchers to test the robustness of findings under different scenarios of data completeness.
Third, we need to take a more integrated approach to IUU fishing activities. Supply chain segments can overlap if one or more group members are sufficiently connected to other criminal operations. Since deviant actors often engage in different activities, i.e., processing, transshipment, and money laundering [e.g (Malm et al., 2011; Collins et al., 2021)], efforts to map criminal interactions must be sensitive to roles played by actors (Basu, 2014; Bichler et al., 2017). Moreover, actors may participate in different markets, particularly if involved in illegal transport, i.e., refrigerated cargo vessels can transfer different types of illicit food commodities, drugs, and labor (UNODC, 2011; Boerder et al., 2018; Seto et al., 2020). This complex activity pattern blurs the line between crime groups and supply chains for different commodities. Applied to IUU fishing, this means we need a full set of encounters (among all vessels), as well as linkages to personnel (owners, shared crews) and ports, to better understand the supply chain and identify criminal interference [e.g (Telesetsky, 2014; Collins et al., 2021)]. Future investigations could extend our understanding of the supply chain by: scripting critical activities or mechanisms and applying multimodal network analytics [e.g (Bichler et al., 2013; Bichler, 2019)]; integrating data sources, such as seizure data or United Nations trade data to investigate the vulnerabilities endemic to each trade segment [e.g (Marteache et al., 2015; Petrossian et al., 2015; Miller et al., 2018; Ospina-Alvarez et al., 2022)]; or using qualitative network-friendly methods to expose how the associations among crew members, beneficial managers, owners, and port authorities facilitate non-compliance [e.g (Pedroza, 2013; Collins et al., 2021)].
6 Conclusion
Using GFW AIS data to identify potential vessel-to-vessel encounters as a proxy measure for likely transshipments, this study investigated whether distinct communities can be detected and whether potentially deviant actors (FOC vessels and vessels with recorded deficiencies) maintained a central position. Applying social network analytics, we observed cross-group connections and the extent to which the cross-connections link vessels to fishing activity outside of the study region. Then, we considered the characteristics of subgroups and active vessels (e.g., the flag of registration, deviance, relative position) to query the use of a social network framework to detect potential IUU activity. Finding that a small set of potentially deviant carriers play a critical role in embedding regional fishing within a larger global context, thereby raising the possibility that they engage in intra-supply chain interference, we investigated if the relative position of carriers changes over time. Finding a dynamic network suggestive of preferential attachment favoring prominent actors in some national fleets, this study confirms knowledge generated by previous studies and extends this line of inquiry, highlighting the need for continued network-oriented investigation of IUU fishing.
Data availability statement
Publicly available datasets were analyzed in this study. This data can be found here: https://globalfishingwatch.org/map-and-data/.
Author contributions
GB: Conceptualization, Formal analysis, Funding acquisition, Investigation, Methodology, Project administration, Supervision, Visualization, Writing – original draft, Writing – review & editing. GP: Conceptualization, Methodology, Writing – original draft, Writing – review & editing, Funding acquisition. KV: Data curation, Formal analysis, Writing – original draft. NM: Conceptualization, Funding acquisition, Supervision, Writing – review & editing.
Funding
The author(s) declare financial support was received for the research, authorship, and/or publication of this article. The authors acknowledge that they received partial institutional research support through a Centers and Institutes Seed Grant (CISG), for a Wildlife Crime Initiative from the corresponding author’s Office of Academic Research, as well as support for open access publishing from the John Jay College of Criminal Justice, Office of Advancement of Research and the Dale Sechrest Fund for Excellence in Criminal Justice.
Acknowledgments
Authors would like to thank the reviewers for their feedback that has significantly improved the paper.
Conflict of interest
The authors declare that the research was conducted in the absence of any commercial or financial relationships that could be construed as a potential conflict of interest.
Publisher’s note
All claims expressed in this article are solely those of the authors and do not necessarily represent those of their affiliated organizations, or those of the publisher, the editors and the reviewers. Any product that may be evaluated in this article, or claim that may be made by its manufacturer, is not guaranteed or endorsed by the publisher.
References
Agnew D. J., Pearce J., Pramod G., Peatman T., Watson R., Beddington J. R., et al. (2009). Estimating the worldwide extent of illegal fishing. PloS One 4 (2), e4570. doi: 10.1371/journal.pone.0004570
Albert R., Barabási A. L. (2002). Statistical mechanics of complex networks. Rev. Modern Physics. 74 (1), 47. doi: 10.1103/RevModPhys.74.47
Anzoom R., Nagi R., Vogiatzis C. (2023). Uncovering illicit supply networks and their interfaces to licit counterparts through graph-theoretic algorithms. IISE Trans. 56 (3), 224–240. doi: 10.1080/24725854.2022.2162169
Barabási A. L., Albert R. (1999). Emergence of scaling in random networks. Science 286 (5439), 509–512. doi: 10.1126/science.286.5439.509
Basu G. (2014). The strategic attributes of transnational smuggling: Logistics flexibility and operational stealth in the facilitation of illicit trade. J. Transp. Secur. 7, 99–113. doi: 10.1007/s12198-013-0132-0
Belhabib D., Le Billon P. (2020). Illegal fishing as a trans-national crime. Front. Mar. Sci. 162. doi: 10.3389/fmars.2020.00162
Bichler G. (2019). Understanding Criminal Networks: A Research Guide (CA, USA: University of California Press).
Bichler G., Bush S., Malm A. (2013). Bad actors and faulty props: Unlocking legal and illicit art trade. Global Crime 14 (4), 359–385. doi: 10.1080/17440572.2013.828999
Bichler G., Malm A. (2015). “The routine nature of transnational crime,” in The criminal act: The role and influence of routine activity theory (London, UK: Palgrave Macmillan), 33–58.
Bichler G., Malm A., Cooper T. (2017). Drug supply networks: a systematic review of the organizational structure of illicit drug trade. Crime Sci. 6, 1–23. doi: 10.1186/s40163-017-0063-3
Blondel V., Guillaume J. L., Lambiotte R., Lefebvre E. (2008). Fast unfolding of communities in large networks. J. Statist. Mech. Theory Exp. 10, P10008. doi: 10.1103/PhysRevE.83.036103
Boerder K., Miller N. A., Worm B. (2018). Global hot spots of transshipment of fish catch at sea. Sci. Adv. 4, eaat7159. doi: 10.1126/sciadv.aat7159
Borgatti S. P., Everett M. G. (1997). Network analysis of 2-mode data. Soc Networks 19 (3), 243–269. doi: 10.1016/S0378-8733(96)00301-2
Borgatti S. P., Everett M. G., Freeman L. C. (2002). Ucinet for Windows: Software for Social Network Analysis (Harvard, MA: Analytic Technologies).
Borgatti S. P., Everett M. G., Johnson J. C. (2018). Analyzing Social Networks (Thousand Oaks, Sage Publications Ltd.).
Bright D., Koskinen J., Malm A. (2019). Illicit network dynamics: The formation and evolution of a drug trafficking network. J. Quant. Criminol 35, 237–258. doi: 10.1007/s10940-018-9379-8
Burt R. S. (1992). Structural Holes: The Social Structure of Competition (Cambridge, MA: Harvard University Press).
Burt R. S. (2015). Reinforced structural holes. Soc Networks 43, 149–161. doi: 10.1016/j.socnet.2015.04.008
Burt R. S., Merluzzi J. (2014). “Embedded brokerage: Hubs versus locals,” in Contemporary perspectives on organizational social networks, vol. 40. (Bingley, UK: Emerald Group Publishing), 161–177.
Collins C., Nuno A., Broderick A., Curnick D. J., De Vos A., Franklin T., et al. (2021). Understanding persistent non-compliance in a remote, large-scale marine protected area. Front. Mar. Sci. 8, 650276. doi: 10.3389/fmars.2021.650276
D’amato I., Papadimitriou T. (2013). Legitimate vs illegitimate: the luxury supply chain and its doppelganger. Intl. J. Retail. Dist. Manage. 41 (11/12), 986–1007. doi: 10.1108/IJRDM-01-2013-0015
de Amorim S. G., Barthélemy J. P., Ribeiro C. C. (1990). Clustering and Clique Partitioning: Simulated Annealing and Tabu Search Approaches (Ecole des Hautes Etudes Commerciales, Ecole Polytechnique, Université McGill).
Diviák T. (2023). Structural resilience and recovery of a criminal network after disruption: a simulation study. J. Exp. Criminol. 19, 1–29. doi: 10.1007/s11292-023-09563-z
Duxbury S. W., Haynie D. L. (2018). Building them up, breaking them down: Topology, vendor selection patterns, and a digital drug market’s robustness to disruption. Soc Networks 52, 238–250. doi: 10.1016/j.socnet.2017.09.002
Ewell C., Cullis-Suzuki S., Ediger M., Hocevar J., Miller D., Jacquet J. (2017). Potential ecological and social benefits of a moratorium on transshipment on the high seas. Mar. Policy 81, 293–300. doi: 10.1016/j.marpol.2017.04.004
FAO (1996). State of World Fisheries and Aquaculture (Rome: Food & Agriculture Organization United Nations).
FAO (2001). International Plan of Action to Prevent, Deter and Eliminate Illegal, Unreported and Unregulated Fishing (Rome: FAO). Available at: https://www.fao.org/3/y1224e/y1224e.pdf.
Ford J. H., Bergseth B., Wilcox C. (2018). Chasing the fish oil—do bunker vessels hold the key to fisheries crime networks? Front. Mar. Sci. 5. doi: 10.3389/fmars.2018.00267
Freeman L. C. (1979). Centrality in social networks: I. conceptual clarification. Soc Networks 1, 215–239. doi: 10.1016/0378-8733(78)90021-7
Galland G., Rogers A., Nickson A. (2016). Netting billions: a global valuation of tuna (Washington, DC, USA: The Pew Charitable Trust).
Gianni M., Simpson W. (2005). The Changing Nature of High Seas Fishing: how flags of convenience provide cover for illegal, unreported and unregulated fishing. Australian Department of Agriculture, Fisheries and Forestry, International Transport Workers’ Federation, and WWF International. Available at: https://www.agriculture.gov.au/agriculture-land/fisheries/iuu/high-seas.
Granovetter M. S. (1973). The strength of weak ties. Am. J. Sociol 78 (6), 1360–1380. doi: 10.1086/225469
Granovetter M. (1983). The strength of weak ties: A network theory revisited. Sociol. Theory 1, 201–233. doi: 10.2307/202051
Greenpeace (2020). Fishy Business: How transshipment at sea facilitates illegal, unreported, and unregulated fishing that devastates our oceans (Greenpeace). Available at: https://media.greenpeace.org/archive/Report–Fishy-Business-27MZIFJ83AQUL.html. (accessed Feb. 17, 2024).
Hilend R., Bell J. E., Griffis S. E., Macdonald J. R. (2023). Illicit activity and scarce natural resources in the supply chain: A literature review, framework, and research agenda. J. Bus. Logis. 44 (2), 198–227. doi: 10.1111/jbl.12331
Interpol (2014). Port Security Project (Lyon, France: Interpol). Available at: https://www.interpol.int/en/Crimes/Maritime-crime/Port-Security-Project.
Kalish Y. (2020). Stochastic actor-oriented models for the co-evolution of networks and behavior: an introduction and tutorial. Organ. Res. Methods 23 (3), 511–534. doi: 10.1177/1094428118825300
Keskin B. B., Griffin E. C., Prell J. O., Dilkina B., Ferber A., MacDonald J., et al. (2022). Quantitative investigation of wildlife trafficking supply chains: A review. Omega 115, 102780. doi: 10.1016/j.omega.2022.102780
Kroodsma D., Miller N., Roan A. (2017). The Global View of Transshipment: Revised Preliminary Findings (Global Fishing Watch). Available online at http://globalfishingwatch.org.
Kumar S., Muhal H., Chaudhary I., Dabas K. (2022). “Identification of IUU transshipment activity using AIS data,” in 2022 3rd International Conference for Emerging Technology (INCET). 1–7 (Belgaum, India: IEEE). doi: 10.1109/INCET54531.2022.9825321
Lancichinetti A., Fortunato S. (2009). Community detection algorithms: a comparative analysis. Phys. Rev. E 80, 056117. doi: 10.1103/PhysRevE.80.056117
Lü L., Zhou T., Zhang Q. M., Stanley H. E. (2016). The H-index of a network node and its relation to degree and coreness. Nat. Commun. 7, 10168. doi: 10.1038/ncomms10168
Magalingam P., Davis S., Rao A. (2015). Using shortest path to discover criminal community. Digit. Investig. 15, 1–17. doi: 10.1016/j.diin.2015.08.002
Magliocca N., Torres A., Margulies J., McSweeney K., Arroyo-Quiroz I., Carter N., et al. (2021). Comparative analysis of illicit supply network structure and operations: Cocaine, wildlife, and sand. J. Illicit Econ. Dev. 3 (1), 50–73. doi: 10.31389/jied.76
Malm A., Bichler G., Nash R. (2011). Co-offending between criminal enterprise groups. Global Crime 12 (2), 112–128. doi: 10.1080/17440572.2011.567832
Manning L., Smith R., Soon J. M. (2016). Developing an organizational typology of criminals in the meat supply chain. Food Policy 59, 44–54. doi: 10.1016/j.foodpol.2015.12.003
Marteache N., Sosnowski M. C., Petrossian G. A. (2020). “A review of responses to IUU fishing around the world through the lens of situational crime prevention,” in The Emerald Handbook of Crime, Justice and Sustainable Development (UK: Emerald Publishing), 485–512.
Marteache N., Viollaz J., Petrossian G. A. (2015). Factors influencing the choice of a safe haven for offloading illegally caught fish: a comparative analysis of developed and developing economies. Crime Sci. 4, 1–13. doi: 10.1186/s40163-015-0045-2
Masroeri A. A., Aisjah A. S., Agam V., Pradenta M., Samudya M. A. (2022). “Analysis of fuzzy logic systems types 1 and 2 in identifying of IUU fishing and transshipment: A case study in Indonesia’s vulnerable waters,” in IOP Conference Series: Earth and Environmental Science, Vol. 972. 012060 (Surabaya, Indonesia: IOP Publishing). doi: 10.1088/1755-1315/972/1/012060
Masroeri A. A., Aisjah A. S., Jamali M. M. (2021). “IUU fishing and transhipment identification with the miss of AIS data using Neural Networks,” in IOP Conference Series: Materials Science and Engineering, Vol. 1052. 012054 (Surabaya, Indonesia: IOP Publishing). doi: 10.1088/1757-899X/1052/1/012054
Mazzarella F., Vespe M., Damalas D., Osio G. (2014). “Discovering vessel activities at sea using AIS data: Mapping of fishing footprints,” in 17th International conference on information fusion (FUSION). 1–7 (Piscataway, USA: IEEE). JRC89602
McDonald G. G., Costello C., Bone J., Cabral R. B., Farabee V., Hochberg T., et al. (2021). Satellites can reveal global extent of forced labor in the world’s fishing fleet. P Natl. Acad. Sci. 118 (3), e2016238117. doi: 10.1073/pnas.2016238117
McDowell N. G., Coops N. C., Beck P. S., Chambers J. Q., Gangodagamage C., Hicke J. A., et al. (2015). Global satellite monitoring of climate-induced vegetation disturbances. Trends Plant Sci. 20 (2), 114–123. doi: 10.1016/j.tplants.2014.10.008
McElwee G., Smith R., Lever J. (2017). Illegal activity in the UK halal (sheep) supply chain: Towards greater understanding. Food Policy 69, 166–175. doi: 10.1016/j.foodpol.2017.04.006
Miller N., Hochberg T., Kroodsma D., Linder H., Park J. (2021). Revealing the Supply Chain at Sea: A Global Analysis of Transshipment and Bunker Vessels (Global Fishing Watch). Available at: https://globalfishingwatch.org/wp-content/uploads/Global-Transshipment-Analysis-Reveals-the-Supply-Chain-at-Sea.pdf.
Miller N. A., Roan A., Hochberg T., Amos J., Kroodsma D. A. (2018). Identifying global patterns of transshipment behavior. Front. Mar. Sci. 5, 240. doi: 10.3389/fmars.2018.00240
Morselli C., Giguère C., Petit K. (2007). The efficiency/security trade-off in criminal networks. Soc Networks 29 (1), 143–153. doi: 10.1016/j.socnet.2006.05.001
Ospina-Alvarez A., de Juan S., Pita P., Ainsworth G. B., Matos F. L., Pita C., et al. (2022). A network analysis of global cephalopod trade. Sci. Rep. 12 (1), 322. doi: 10.1038/s41598-021-03777-9
Park A. J., Stamato S. Z. (2020). “Social network analysis of global transshipment: A framework for discovering illegal fishing networks,” in 2020 IEEE/ACM International Conference on Advances in Social Networks Analysis and Mining, (The Hague, Netherlands: IEEE/ASONAM). 776–783. doi: 10.1109/ASONAM49781.2020.9381417
Pauly D., Zeller D. (2016). Catch reconstructions reveal that global marine fisheries catches are higher than reported and declining. Nat. Commun. 7 (1), 10244. doi: 10.1038/ncomms10244
Pedroza C. (2013). Middlemen, informal trading and its linkages with IUU fishing activities in the port of Progreso, Mexico. Mar. Policy 39, 135–143. doi: 10.1016/j.marpol.2012.10.011
Petrossian G. A. (2019). The last fish swimming: the global crime of illegal fishing (USA: Bloomsbury Publishing).
Petrossian G. A., Barthuly B., Sosnowski M. C. (2022). Identifying central carriers and detecting key communities within the global fish transshipment networks. Front. Mar. Sci. 9, 798893. doi: 10.3389/fmars.2022.798893
Petrossian G. A., Marteache N., Viollaz J. (2015). Where do “undocumented” fish land? An empirical assessment of port characteristics for IUU fishing. Eur. J. Crim. Pol. Res. 21, 337–351. doi: 10.1007/s10610-014-9267-1
Purivigraipong S. (2018). Review of satellite-based AIS for monitoring maritime fisheries. Eng. Trans. 21 (1), 81–89. Available at: https://ph02.tci-thaijo.org/index.php/ET/article/view/244198.
Selig E. R., Nakayama S., Wabnitz C. C., Österblom H., Spijkers J., Miller N. A., et al. (2022). Revealing global risks of labor abuse and illegal, unreported, and unregulated fishing. Nat. Commu. 13 (1), 1612. doi: 10.1038/s41467-022-28916-2
Seto K., Miller N., Young M., Hanich Q. (2020). Toward transparent governance of transboundary fisheries: The case of Pacific tuna transshipment. Mar. Policy 136, 104200. doi: 10.1016/j.marpol.2020.104200
Silvis I. C. J., Van Ruth S. M., van der Fels-klerx H. J., Luning P. A. (2017). Assessment of food fraud vulnerability in the spices chain: An explorative study. Food Control 81, 80–87. doi: 10.1016/j.foodcont.2017.05.019
Soon J. M., Manning L., Smith R. (2019). Advancing understanding of pinch-points and crime prevention in the food supply chain. Crime Prev. Community Safe 21 (1), 42–60. doi: 10.1057/s41300-019-00059-5
Stamato S., Park A. J. (2020). “Static and dynamic social network models for the analysis of transshipment in illegal fishing,” in IEEE International Conference on Big Data (Big Data), Vol. 2020. 2563–2568. (Atlanta, USA: IEEE). doi: 10.1109/BigData50022.2020.9378202
Swartz W., Sala E., Tracey S., Watson R., Pauly D. (2010). The spatial expansion and ecological footprint of fisheries (1950 to present). PloS One 5 (12), e15143. doi: 10.1371/journal.pone.0015143
Telesetsky A. (2014). Laundering fish in the global undercurrents: Illegal, unreported, and unregulated fishing and transnational organized crime. Ecol. LQ 41, 939. doi: 10.15779/Z38656G
UNCLOS (1995). United Nations Convention on the Law of the Sea (United Nations). Available at: https://www.un.org/depts/los/convention_agreements/texts/unclos/unclos_e.pdf.
UNODC (2011) World Drug Report. Available at: https://www.unodc.org/unodc/en/scientists/world-drug-report-2011.html.
Urbina I. (2015). Sea slaves’: The human misery that feeds pets and livestock Vol. (NY, USA: The New York Times).
Van Gennip Y., Hunter B., Ahn R., Elliott P., Luh K., Halvorson M., et al. (2013). Community detection using spectral clustering on sparse geosocial data. SIAM J. Appl. Mathematics 73 (1), 67–83. doi: 10.1137/120882093
Wasserman S., Faust K. (1994). Social network analysis: Methods and applications (Cambridge, UK: Cambridge University Press).
Keywords: network analysis, IUU fishing, at-sea transshipment, refrigerated cargo carriers, deficiencies, intra-supply chain interference, illicit community detection
Citation: Bichler G, Petrossian GA, Viramontes K and Marteache N (2024) Detecting communities at high-risk of IUU fishing: networks of shadow encounters in Area 81 of the Western Central Pacific. Front. Mar. Sci. 11:1355481. doi: 10.3389/fmars.2024.1355481
Received: 14 December 2023; Accepted: 23 January 2024;
Published: 26 February 2024.
Edited by:
Isidro Maya Jariego, Sevilla University, SpainReviewed by:
Gabriela Oanta, University of A Coruña, SpainJorge P. Rodríguez, Instituto de Física Interdisciplinar y Sistemas Complejos (IFISC), CSIC-UIB, Spain
Copyright © 2024 Bichler, Petrossian, Viramontes and Marteache. This is an open-access article distributed under the terms of the Creative Commons Attribution License (CC BY). The use, distribution or reproduction in other forums is permitted, provided the original author(s) and the copyright owner(s) are credited and that the original publication in this journal is cited, in accordance with accepted academic practice. No use, distribution or reproduction is permitted which does not comply with these terms.
*Correspondence: Gisela Bichler, Z2JpY2hsZXJAY3N1c2IuZWR1