 Ismael Cross1
 María E. Rodríguez1
 Silvia Portela-Bens1
 Manuel A. Merlo1
 Aaron Gálvez-Salido2
 Rafael Navajas-Pérez2
 Laureana Rebordinos1*
- 1Área de Genética, Facultad de Ciencias del Mar y Ambientales, Instituto Universitario de Investigación Marina (INMAR), Universidad de Cádiz, Cádiz, Spain
- 2Departamento de Genética, Universidad de Granada, Granada, Spain
Pleuronectiformes are flatfishes with high commercial value and a prominent example of successful marine adaptation through chromosomal evolution. Hence, the aim of this study was to analyze the 14 relative abundance of repetitive elements (satellite DNA and transposable elements (TE)) in the 15 genome of 10 fish species (8 flatfish) delving into the study of the species of special relevance, 16 Senegalese sole, Solea senegalensis. The results showed differences in the abundance of repetitive elements, with S. senegalensis exhibiting the highest frequency and coverage of these elements reaching the 40% of the genome and not at random distribution. It is noteworthy the presence of relevant peaks of Helitrons in centromeric/pericentromeric positions mainly in the bi-armed chromosomes 1, 2, 4, 6, 7, and 9. The position of the centromeres of this species determined through the genomic localization of the family of satellite DNA PvuII, and other repetitive sequences was obtained de novo. This allowed us to know the genomic position of the centromeres in 19 out of the 21 chromosomes of S. senegalensis. Helitrons showed an accumulation of tandem copies mainly in the pericentromeric positions of chromosomes 1 and 2, occupying a region, in the first case, of 600Kb of tandem repeats. That has only been previously described in mammals and plants. Divergence and copy number studies indicated the presence of active families in the species’ genome and the existence of two important events of transposon activity (burst) in the genome of S. senegalensis, mainly accentuated in Helitrons. The results showed that only the families of DNA transposons exhibited a landscape with symmetrical bell-shaped distribution. The phylogenetic analysis of Helitron families revealed the presence of two large groups of families and the presence of four groups of sequences with heterogeneous distribution among chromosomes. Finally, the phylogenomic analysis of 8615 sequences belonging to Helitron insertions from 5 families of flatfish and two external species, allowed to classify the copies into nine groups of sequences with different levels of divergence and clusters, including some branches with distant phylogenetically species. The implications of this study will help to expand the knowledge of chromosome structure and evolution of these species.
1 Introduction
The knowledge of the genome composition and their architecture is essential for understanding the evolutionary processes that occur in species. One of the most abundant and important components of genomes are repetitive elements. These repetitive sequences can be classified in satellite DNA and transposable elements (TEs). Satellite DNA plays a notable role in the evolution of chromosomes, including sex chromosomes, and in the organization and chromosomal speciation (Ruiz-Ruano et al., 2016; Robles et al., 2017; Kretschmer et al., 2022). On the other hand, TEs are sequences that have been present in eukaryotic genomes for a long time, and have had a major influence over millennia (Feschotte and Pritham, 2007; Raskina et al., 2008; Belyayev, 2014; Sotero-Caio et al., 2017; Bourque et al., 2018). These sequences can move through the genome and insert themselves into new chromosomal regions, which contributes significantly to genetic diversity (Makalowski, 2000; Gao et al., 2016; Yuan et al., 2018). Initially, these mobile elements, as long as satellites, did not attract much attention from researchers and were erroneously treated as “junk DNA”. However, recently TEs are recognized as evolutionarily and functionally critical components in genome evolution (Biémont, 2010; Chuong et al., 2017) and are involved in processes of speciation, sex determination, chromosomal rearrangements, creation of new genes, adaptation to the environment, migratory patterns, climate change, etc (Long et al., 2003; Kvikstad and Makova, 2010; Chalopin et al., 2015b; Auvinet et al., 2018; Platt et al., 2018; Carotti et al., 2021; Zhao et al., 2022).
TEs have colonized all sequenced species to date, but with varying success. The abundance of these elements can vary between 4-60% of vertebrate genomes sequenced to date (Sotero-Caio et al., 2017; Chang et al., 2022). Although the mobility of TEs is generally deleterious to the host, the accumulation of TEs in genomes represents a source of raw genetic material that can be used during evolution to benefit a variety of cellular functions, including those related to embryogenesis (Jachowicz et al., 2017; Chang et al., 2022). Among other findings, TEs have been related to the adaptive evolution of warm-blooded fish, such as the opah fish, which contains the highest percentage of LTR elements known in teleosts to date, and where it has been shown that the expansion of these elements in their genome contributed to the opah’s endothermic capacity and adaptation to deep-sea environments (Wang et al., 2022a). In syngnathid fish, TEs have also played a fundamental role in their evolution and adaptation to the environment, through the recent expansion of TEs in the vicinity of existing supernumerary genes in this group of fish (Small et al., 2022). Furthermore, the fundamental role that TEs have played in the adaptive success and invasiveness of tunicates has been demonstrated (Wei et al., 2020). Finally, TEs have been implicated in the diversification of zinc finger genes in animals, where these elements have been linked to the expansion of TEs throughout metazoan evolution (Wells et al., 2023).
Based on their transposition mechanism, TEs are classified into retrotransposons (Class I) and DNA transposons (Class II) (Wells and Feschotte, 2020). Class I elements are characterized by their copy-and-paste transposition mechanism, in which their own RNA is reverse-transcribed into its complementary DNA by an RNA-dependent DNA polymerase (RT) and then reintegrated into the host genome (Carducci et al., 2020; Chang et al., 2022). These Class I elements can be further divided into LTR (Long Terminal Repeats), non-LTR, and Penelope retroelements. In turn, all of these retroelements are divided into multiple superfamilies such as different types of LINEs, SINEs, DIRs, Crypton, among others (Wells and Feschotte, 2020). On the other hand, Class II mobile elements use an intermediate DNA to transpose their copies to a new chromosomal position, and in general their transposition mechanism occurs through a cut-and-paste process, in which both DNA strands are separated (Chen et al., 2014; Chalopin et al., 2015a). These DNA transposons can be further divided into subclasses I and II (Bourque et al., 2018; Goerner-Potvin and Bourque, 2018; Carducci et al., 2020). In those of Subclass I, we can find the superfamilies hAT, Merlin, Tc1-Mariner, among others. The major representatives of the subclass II are Helitrons (Rolling Circles, RC) and Maverick, which, unlike the rest of Class II elements, transpose through a copy-and-paste mechanism (Wicker et al., 2007). Specifically, Helitrons represent a new class of transposable element discovered recently in animals and plants (Kapitonov and Jurka, 2001; Thomas et al., 2010; Grabundzija et al., 2016; Xiong et al., 2016). These elements have two notable characteristics. The first of them is that Helitrons replicate and mobilize through a mechanism known as rolling-circle replication (RCR) (Grabundzija et al., 2016; Xiong et al., 2016; Wang et al., 2022b). This transposition mechanism was first described in phages and plasmids (Khan, 2005; Ruiz-Masó et al., 2015; Zattera and Bruschi, 2022). Later, it has been shown that the transposition of a bat Helitron in a human cell assay system generated covalently closed circular intermediates, as predicted by the RCR model (Grabundzija et al., 2016). On the other hand, Helitrons can capture gene sequences, which makes them an element of notable evolutionary importance (Lai et al., 2005; Xiong et al., 2014; Thomas and Pritham, 2015).
Studies to date confirm that the TE content is highly variable among vertebrates, including fish. Thus, the genomes of species of mammals, reptiles, coelacanths, Xenopus, and fish have been shown to have coverage percentages above 20% (Chalopin et al., 2015a) and yet, some compact genomes, such as those of pufferfishes (fugu and tetraodon) and birds are poor in TEs (<5%). The variation percentages can be enormous, with differences of even 10 times (Chang et al., 2022). The composition also varies between organisms, so in most teleosts, amphioxus, tunicates, and Xenopus, DNA transposons predominate, although mammals, birds, coelacanths, and elephant shark are especially poor in these elements, with retroelements being the main transposable elements. In addition, some actinopterygians and nonbony vertebrates show a higher abundance of LINEs and SINEs. Finally, tunicates present mainly LTR retrotransposons.
In recent years, some studies have been conducted on the abundance and diversity of repetitive elements in fish, but the absence of complete genomic maps for a large number of species has made it difficult to study them systematically (Chalopin et al., 2015a, Chalopin et al., 2015b; Gao et al., 2016). The arrival of high-throughput technologies and bioinformatics has provided a wealth of genomic data on fish (Carducci et al., 2020). The data published to date suggest that, compared to other vertebrate genomes, DNA transposons are the most abundant in most fish genomes (Shao et al., 2019). Another general characteristic of Actinopterigii is the presence of more recent copies of TEs than those found in other vertebrate lineages, and in many cases two rapid amplification of TEs are observed (Carducci et al., 2020).
However, many fish families and orders are still in an early stage of genome sequencing, and therefore of their knowledge, with a significant deficit of information about them. This is the case of flatfish in which the current information is scarce and the information on abundance, divergence, and chromosomal distribution of repetitive sequences is almost non-existent, where frequently only general abundance data obtained during the semi-automatic process of genome sequencing and annotation are available (Chalopin et al., 2015a; Gao et al., 2016; Chalopin and Volff, 2017; Shao et al., 2019; Lü et al., 2021).
The Senegalese sole (Solea senegalensis) is among the most important flatfish, with a wide distribution along the eastern coast of the Atlantic Ocean and in the Mediterranean Sea and a high economic value (Imsland et al., 2004; Díaz-Ferguson et al., 2007, Díaz-Ferguson et al., 2012). This commercial interest has promoted the increase in genomic resources in the last decade (Robledo et al., 2017; García-Angulo et al., 2018; Cross et al., 2020; Merlo et al., 2021; Rodríguez et al., 2021; de la Herrán et al., 2023), including an initial version of its genome (Guerrero-Cózar et al., 2021) and a recent improved version (de la Herrán et al., 2023). Due to the absence, until 2023, of a quality sequenced genome in this species, repetitive sequence studies on Senegalese sole had been limited to the sequence analysis of some BAC clones mapped on the chromosomes of the species (García et al., 2019; Rodríguez et al., 2019; Cross et al., 2020; Rodríguez et al., 2021; Ramírez et al., 2022) and the study of TEs in the Hox gene clusters of three flatfish species, including S. senegalensis (Mendizábal-Castillero et al., 2022).
The present study has allowed us to study the abundance of repetitive elements in 8 species of the order Pleuronectiformes, and two species outside this order (Carangiforme and Spariforme) from recent sequenced genomes available in databases. We have studied in more depth the repetitive elements of the S. senegalensis and described the abundance, divergence and distribution of TEs by chromosomes of this species.
2 Materials and methods
2.1 Transposable element annotation
We investigated the composition, abundance, chromosome distribution, and evolution of repetitive elements in the genome of S. senegalensis. To achieve this, we first conducted a comparative analysis of repetitive sequences in S. senegalensis and eight other fish species from five Pleuronectiformes families: S. senegalensis (Soleidae), Cynoglossus semilaevis (Cynoglossidae), Scophthalmus maximus (Scophthalmidae), Paralichthys olivaceus (Paralichthydae), Hippoglossus hipoglossus, Hippoglossus stenolepis, Reinhardtius hippoglossoides and Platichthys stellatus (Pleuronectidae). In addition, we included Seriola aureovittata from the Carangidae family, which belongs, like Pleuronectiformes, to the Carangaria clade, and Sparus aurata from the Sparidae family as an outgroup taxon. We downloaded the genome sequences of these species from the National Center for Biotechnology Information (NCBI) database and ENSEMBL (Supplementary Table 1).
To identify and map repetitive elements, RepeatMasker v.4.0.8 (http://www.repeatmasker.org) (Smit et al., 2015), with the rmblastn engine (version 2.2.27+), the Dfam3.6_Consensus and Repbase-20181026 libraries (Storer et al., 2021) was used. Mapping was conducted with the following parameters: -s -x -a -e rmblast -species Teleostei -source -gff -no_is -frag 20000. The repetitive elements were classified into six broad groups: Retroelements, DNA transposons, Helitrons, Simple Repeats, Satellites, and Low complexity sequences. We measured the abundance of repeat elements as the number of loci per megabase (NL/Mb) and the coverage (% genome masked). To analyze the abundance and distribution of repetitive elements along the chromosomes of S. senegalensis, we additionally utilized RepeatMasker separately on the 21 single-chromosome sequences of this species (2n=42).
We constructed a de novo repeat library of S. senegalensis using RepeatModeler v.1.0.11, which includes RECON v.1.08 and RepeatScout v.1.0.5 (Bao and Eddy, 2002; Price et al., 2005; Smit and Hubley, 2015; Flynn et al., 2020). We then used RepeatMasker and RepClassifier to improve the annotation of the RepeatModeler de novo library. The S. senegalensis genome was used as input in RepeatMasker for a new run, and the de novo improved library was used as the database. Finally, a combined analysis using RepeatMasker with the masked genome from Teleostei database and the de novo library was performed. To determine the genome proportion of TE classes, we used ParseRM (Kapusta et al., 2017) (data available in the doi: 10.6084/m9.figshare.25239952).
2.2 Analysis of genomic distribution
To visualize the genomic distribution of different TE classes in the chromosomes of S. senegalensis, we developed custom Python scripts (v3.10.9) to analyze the RepeatMasker results obtained from the combined analysis described above. We used a sliding-windows approach with a non-overlapping window size of 1 Mb to obtain the content of the different repetitive main groups (measured as NL/Mb and coverage) along the twenty-one chromosomes. We then examined the gene density along the chromosomes of S. senegalensis using the genome annotation from Ensembl (https://ftp.ensembl.org/pub/rapid-release/species/Solea_senegalensis/GCA_919967415.2/ensembl/geneset/2022_08/ and the sliding-windows approach described previously. The distribution results for both TEs and genes were plotted using Circos (Krzywinski et al., 2009) and Mapchart (Voorrips, 2002). To assess the relationship between the distributions of different TE classes and genes, we calculated Spearman’s rank correlation on the windows, using SPSS v.29 software.
2.3 Characterization of centromeric sequences
According to previous data, the majority of centromeres of S. senegalensis are occupied by the satellite-DNA family PvuII (Robles et al., 2017). For detection of other tandemly-arrayed candidate sequences, raw fastq Illumina paired sequences were filtered according to the following parameters: 100bp length and quality Q>33. A total of 500K paired reads were randomly selected to run RepeatExplorer (Novak et al., 2010) with default options and a custom database of repeated sequences. In order to characterize the maximum number of tandem repeats irrespective of their percentage of representation, the process was repeated five times. Sequences assigned to a cluster in a previous round were removed with DeconSeq (deconseq_run.py, https://github.com/fjruizruano/satminer).
Additionally, dot plots were constructed using Genome Pair Rapid Dotter (gepard) (Krumsiek et al., 2007), and visually inspected to find potential repetitive candidate regions. The tandem organization of these regions was confirmed with Tandem Repeats Finder (Benson, 1999). For annotation, consensus sequences were blasted against REXdb (Metazoa 3.0). Non-annotated clusters were manually annotated using BLAST (Altschul et al., 1990) against our ad hoc database or Danio rerio (danRer10) Dfam data (Wheeler et al., 2013). Clustal Omega (Goujon et al., 2010) and tRNAscan-SE 2.0 (Lowe and Eddy, 1997) were also used to explore the structure of the characterized sequences. For mapping, consensus sequences were blasted against the single chromosome sequences, and then mapped at a high/medium sensitivity using Geneious. The process was automated using Python scripts (v3.10.9 and R v4.2.3), and the library karyoploteR v1.25.0 (Gel and Serra, 2017). The secondary structure of candidate sequences was predicted using the software pack ViennaRNA v2.5.1 (Lorenz et al., 2011).
2.4 Analysis of divergence and landscapes
To analyze the divergence of TEs in the genome of S. senegalensis, Kimura distances (K-values) (Kimura, 1980) were calculated for all copies of each TE element in order to estimate the age and history of transposition of transposable elements. Copies that are very similar (low K-values) indicate recent activity and appear on the left side of the landscape graphs. On the contrary, high K values indicate divergent copies generated by older transposition events. The analyses were carried out by TE type and by chromosome. In brief, the output files obtained from the RepeatMasker run on the de novo improved S. senegalensis TE library and processed using ParseRM (Kapusta et al., 2017) was used to generate Repeat Landscape graphs with measurements of Kimura CpG-corrected percentage-divergence from consensus sequence. This analysis was performed on both the whole genome and individual chromosomes. The resulting data was analyzed for DNA transposons, Helitrons, LTR and LINEs, and SINEs. The program also allowed us to analyze the correlation between the copy number of TE families and their median age using Spearman’s rank correlation (SPSS v.29). Significance was calculated using Wilcoxon rank-sum tests between each TE class, using a Bonferroni correction to determine significance.
2.5 Evolution analysis: phylogeny and phylogenomics
In order to analyze the evolution of Helitron families in the genome of S. senegalensis, we used the Helitron families obtained in the de novo analysis with the improved annotation of consensus sequences previously described. The family sequences were used to generate multiple sequence alignments using MAFFT (Katoh et al., 2019). The phylogenetic tree of Helitron families was then constructed using FastTree (v2.1.11) by maximum likelihood method (Price et al., 2010), and graphically edited with MEGA v.11 (Kumar et al., 2018).
Additionally, we extracted all the Helitron copies from the RepeatModeler alignment files of Senegalese sole. The copies were aligned with MAFFT and a phylogeny was constructed as previously described with FastTree. The tree was plotted and branches (Helitron copies) were colored by chromosomes using the ape R-package (Paradis and Schliep, 2019). Two types of trees (radial and circular) were plotted.
Finally, to study Helitron evolution in the analyzed fishes, we used the RepeatModeler software in species belonging to different taxonomic families (S. senegalensis, C. semilaevis, S. maximus, P. olivaceus, H. hippoglossus), and the other two non-Pleuronectiforme species, S. aureovittata and S. aurata (Supplementary Table 1). Then, all Helitron insertions from these genomes were extracted and were used to generate multiple sequence alignments with MAFFT software (v7.245) (Katoh et al., 2019). Then, the phylogenomic tree of Helitron was constructed using FastTree by maximum likelihood method (Price et al., 2010). The graphical trees, with branches colored by species, were constructed with the ape R-package, and to improve the analysis, two types of trees (radial and circular) were also plotted.
3 Results
3.1 The genomic landscape of flatfish species
We quantified the abundance of repetitive elements in ten fish species, comprising eight Pleuronectiformes and two external species. The results revealed significant differences in terms of NL/Mb and coverage among the species. Notably, S. senegalensis exhibited the highest NL/Mb values for repetitive elements among all the species investigated, along with the greatest genome coverage among the flatfish and Carangidae species (Figure 1, Supplementary Table 2). When analyzing different types of repetitive sequences, S. senegalensis consistently displayed the highest NL/Mb values for DNA transposons, retroelements, and satellites among the studied fish species. Interestingly, S. senegalensis (Pleuronectiformes) and S. aurata (Spariformes) showed similar high values for DNA transposons. The abundance of Helitrons was relatively uniform within the Paralichthydae and Pleuronectidae families. Among the flatfish species, Soleidae and Scophthalmidae, as well as Carangidae and Sparidae, exhibited comparable levels of repetitive element abundance. Notably, C. semilaevis displayed the lowest abundance of TEs (DNA transposons, retroelements, and Helitrons) among flatfish species. However, this species demonstrated the highest values for tandem repeats (simple repeats and satellites) and low complexity sequences. The coverage analysis yielded consistent results with the NL/Mb study, although differences were observed, particularly in tandem repeats and low complexity sequences, primarily due to the extended size of tandem repeats. The non-Pleuronectiformes species, S. aurata (47.38%) and S. aureovittata (37.93%), exhibited the highest coverage of repetitive elements (including unclassified elements, Supplementary Table 2), followed by the Pleuronectidae families and S. senegalensis. Regarding specific repetitive elements, S. aurata and S. senegalensis exhibited the highest coverage values for DNA transposons and retroelements, respectively. It is worth noting the substantial abundance of satellite repeats in S. senegalensis and the very low coverage of Helitrons in C. semilaevis.
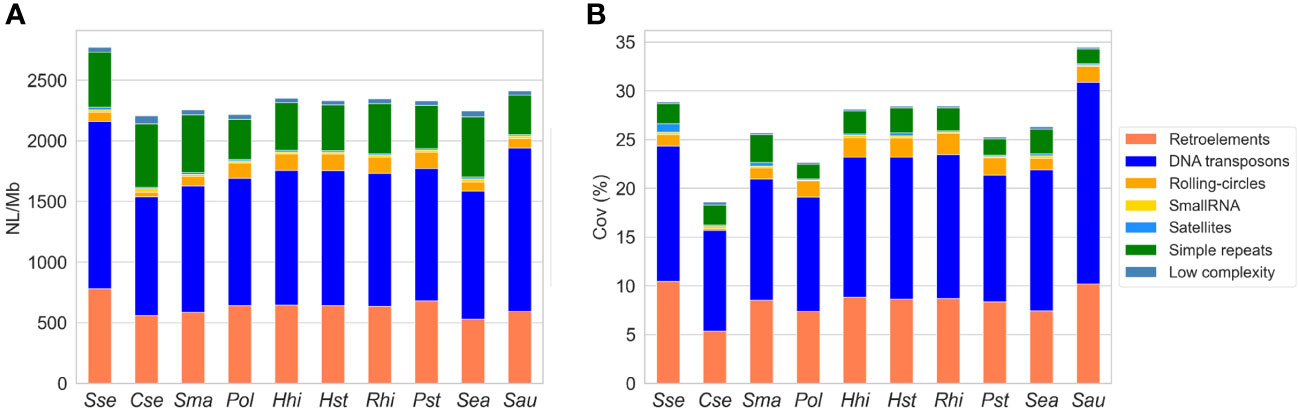
Figure 1 Abundance of repetitive elements in the genomes of ten fish species: S. senegalensis (Sse), C. semilaevis (Cse), S. maximus (Sma), P. olivaceus (Pol), H. hippoglossus (Hhi), H. stenolepis (Hst), R. hippoglossoides (Rhi), P. stellatus (Pst), S. aureovittata (Sea) and S. aurata (Sau). NL/Mb represents the number of loci per megabase (A), and coverage indicates the percentage of repetitive elements in base pairs covered in the analyzed genomes (B). The following TEs categories have been analyzed: DNA transposons (DNA in figure legend), LINEs, LTRs, Helitrons (Rolling circles, RC in figure legends) and SINEs.
The analysis by TEs superfamilies (Supplementary Table 3) shows significant differences in the abundance of loci between species, highlighting the large number of TEs, from almost all the TE families, in the S. senegalensis, surpassing the rest of the species analyzed. Thus, SINEs, LINEs, L2, R1, LTR, and BelPao stand out among the retrotransposons that show greater abundance of loci in the sole than in the rest of the species, including the gilthead sea bream S. aurata. PiggyBac DNA transposons also show this overabundance. It is noteworthy that the CRE/SLACs family, despite being a very minor transposon in the species analyzed, with coverages less than 0.0003% in all species, has a value thirteen times greater in C. semilaevis (coverage 0.004%; Supplementary Table 3).
On the basis of these results, we also carried out a study in S. senegalensis of the abundance of repetitive elements per chromosome (Supplementary Figure 1, Supplementary Table 4). The results showed that abundance is quite homogeny, except for coverage of satellites and Helitrons, where some differences were observed. Concretely, the satellite coverage of chromosome 17 showed, with great differences, the lowest value of coverage in the S. senegalensis genome, and chromosome 9 the highest Helitron coverage.
With the aim to improve the annotation of repetitive elements in the S. senegalensis genome, we constructed a de novo TE database using the RepeatModeler program. More than 2000 families (2150) were extracted, but only 830 were accurately annotated. Subsequently, a re-annotation process was carried out using RepeatMasker and RepClassifier, resulting in the annotation of 1814 families. This de novo TE database was used as a library in a new RepeatMasker analysis, which revealed a coverage of 28.7% (Supplementary Table 5). The masked genome, obtained with the Dfam 3.6 and Repbase databases (organism: Teleostei), was then annotated using RepeatMasker with the improved de novo database. Combining both results, it was determined that approximately 40% (39.5%) of the genome is covered by repetitive sequences. Interspersed TEs account for 34.76% of the genome, with DNA transposons comprising 16.7% and retroelements comprising 11.3%. Among retroelements, LINEs, LTRs, and SINEs make up 7.4,%, 3.1%, and 0.8% of the genome, respectively (Supplementary Tables 6, 7). Helitrons account for 1.4% whereas other DNA transposons are mainly represented by hAT-Ac and TcMar-Tc1, accounting for 9.6% of the genome. Among the LINE elements, L1, L2, Rex-Babar, and RTE-BovB account for 6.37% and notably, Gypsy/DIRS1, belonging to the LTR retroelements, represent 1.3% of the genome (Supplementary Tables 6, 7, Figure 2).
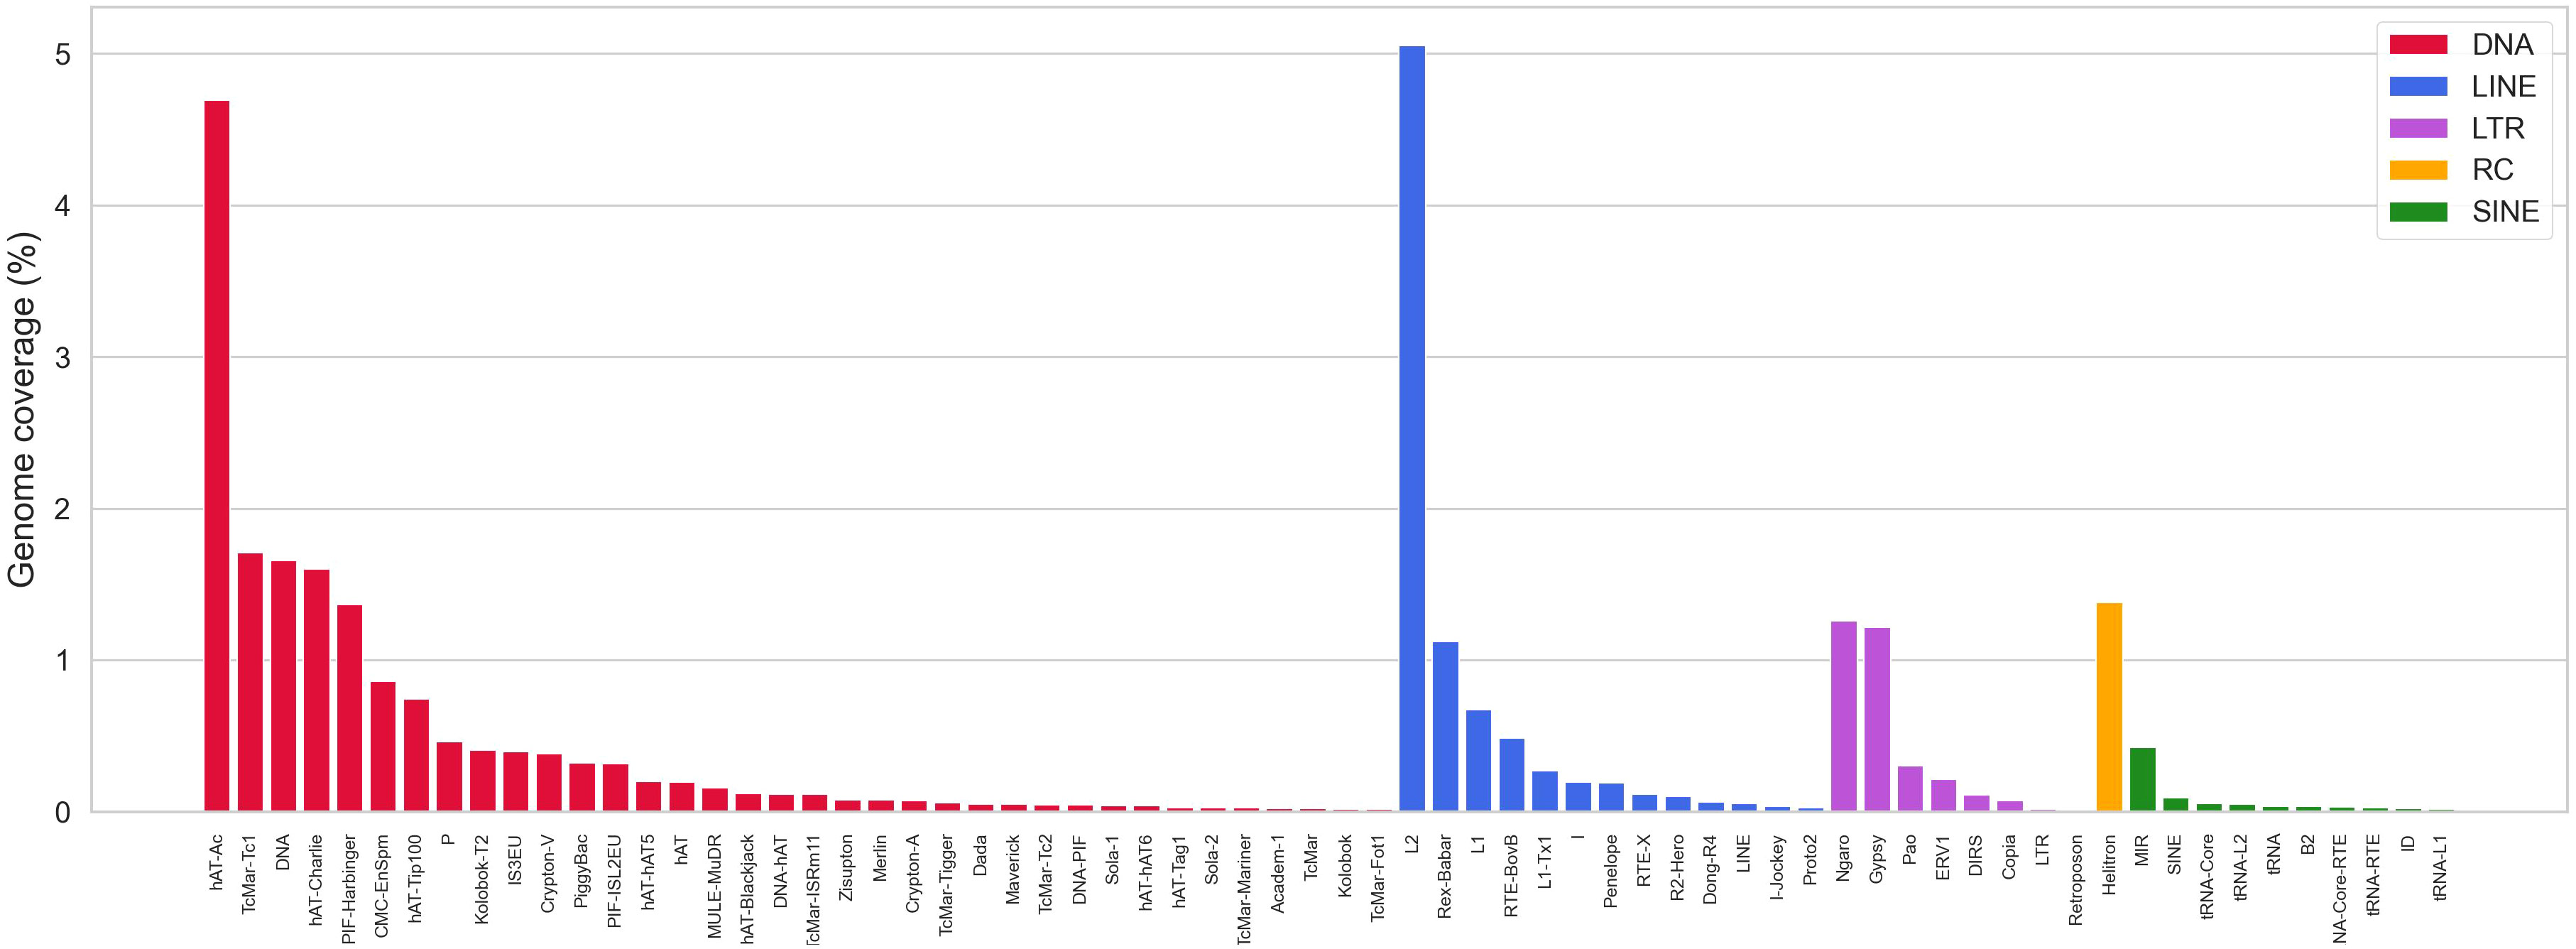
Figure 2 Abundance of repetitive elements in the S. senegalensis genome, measured as the percentage of repetitive elements (in base pairs) covered (Coverage). The following TEs have been analyzed: DNA transposons (DNA in figure legends), LINEs, LTRs, Helitrons (Rolling circles, RC in figure legends) and SINEs. Only the most representative families are showed (full data are available in the Supplemmentary Table 6).
3.2 Genomic distribution of TEs is nonrandom in S. senegalensis
We visualized the distribution of seven major TE classes across the 21 chromosomes of S. senegalensis by means of a sliding windows approach and plotting results in a circos graph (Figure 3A). The results showed an heterogeneous distribution of repetitive sequences from all categories along the chromosomes, with notable peaks of Helitrons and LINEs that, following morphological criteria of the chromosomes, could correspond in many cases to pericentromeric/centromeric regions. To confirm this genomic co-localisation of higher abundance of certain types of TEs with centromeres, we start from the previous information described by Robles et al. (2017) where it was determined, by the cytogenetic technique Fluorescence in situ hybridization (FISH), the existence of a DNA-satellite family, called PvuII, which occupied the centromeres of most pairs of Senegalese sole chromosomes (19 of 21) (Robles et al., 2017). RepeatExplorer followed by BLAST showed that one of the most represented tandemly-repeated sequences corresponded to PvuII satellite DNA family. In silico mapping of cluster 3 sequences showed that PvuII satellite DNA is present in 17 chromosome pairs (1-6, 9-13, 15-17, and 19-21) of the assembly. In all cases a unique signal (spanning from 189 bp of chromosome 12 to a cluster of 596K bp of chromosome 4) was found except for chromosome 19, where two PvuII signals were detected in both terminal regions. Interestingly, BLAST with the consensus motif of PvuII against our de novo database of repeated DNA demonstrated that this family has homology with the L1 LINE family Sse_rnd-5_family-1529 (characterized in this paper). Sse_rnd-5_family-1529 included four consecutive repetitions of PvuII 179-bp consensus motif. All these centromeric coordinates were then plotted for their visualization in circos figure (Figure 3A, Supplementary Table 8).
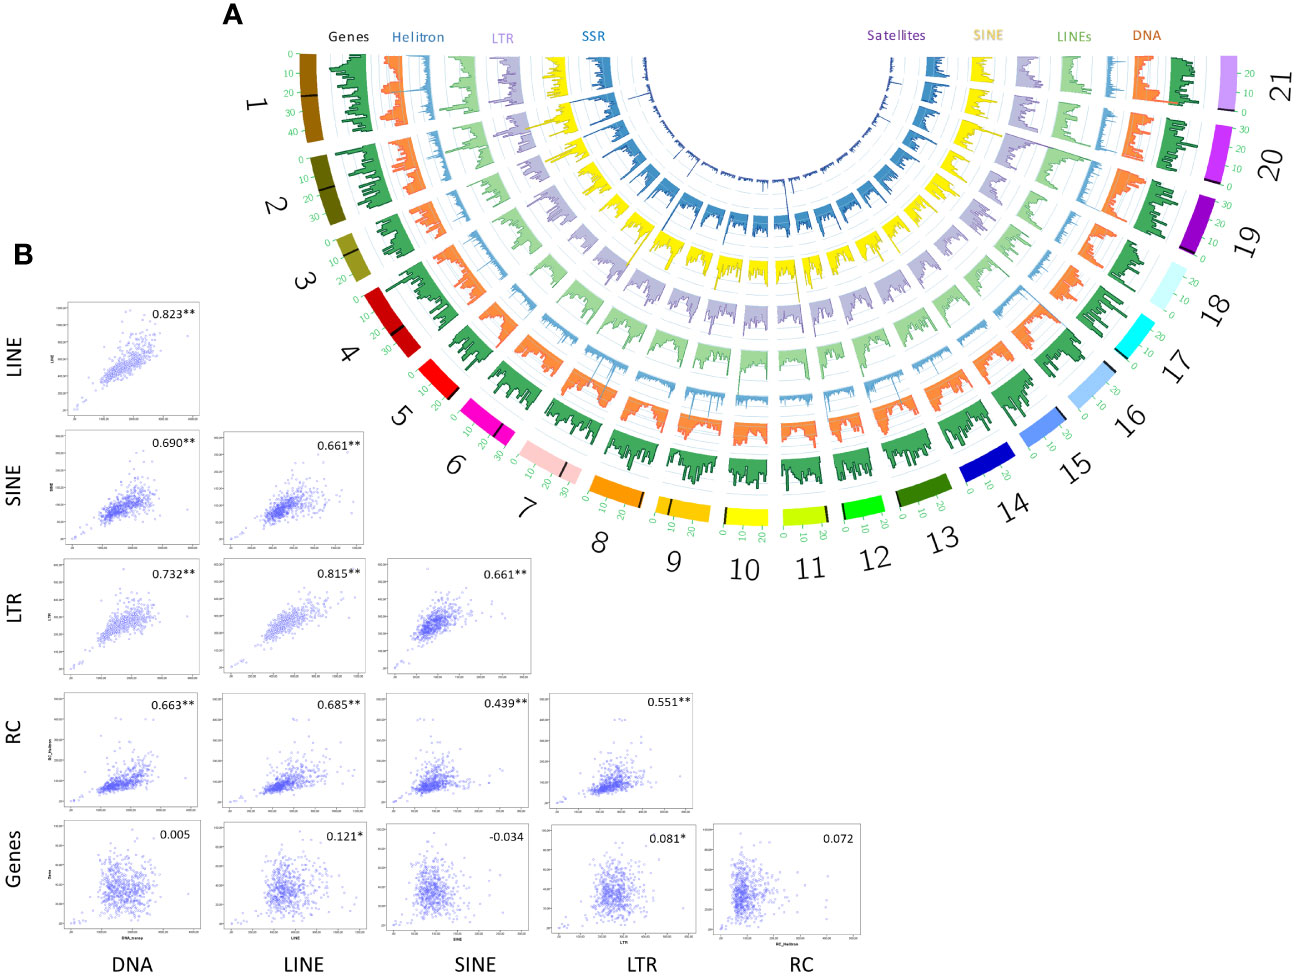
Figure 3 Genomic distribution of TEs in non-overlapping 1Mb windows across S. senegalensis chromosomes showed in a semicircular style with Circos program (A). The following repetitive elements have been analyzed: DNA transposons (DNA in figure legend), LINEs, LTRs, Helitrons (Rolling circles, RC in figure legends), SINEs, Simple Sequence Repeats (SSR) and Satellites. Spearman´s rank correlations of coverage density between genes y major TE classes: DNA transposons (DNA in figure legend), LINEs, LTRs, Helitrons (Rolling circles, RC in figure legends) and SINEs. Significant correlations are indicated by asterisks (B).
As chromosome pairs 7, 8, 14 and 18 showed no PvuII signals, a different approach was followed to characterize their centromeric regions. We explored dot plots corresponding to terminal regions of these chromosome pairs (all of them are acro/telocentric). In chromosome pair 7, the region between positions 22-25 Mb contained an 87-bp motif repeated in tandem 485 times, obtained by RepeatExplorer, which we named rep87. Similarly, on chromosome pair 8, between positions 25.5-28 Mb, in telomeric position, a 120-bp motif repeated 220 times was observed, which was named rep120. By studying the secondary structure of rep87 (chromosome 7) and rep120 (Supplementary Figure 2) we found that it was similar to centromeric DNA from other species (Kasinathan and Henikoff, 2018). Therefore, the coordinates obtained for both repeats were incorporated as centromeric regions (Figure 3A). No centromeric candidate regions were found for chromosome pairs 14 and 18.
After locating centromeric regions, the analysis of the abundance distribution of repetitive elements found that the DNA and LINEs transposons, displayed a v-shape in the majority of the chromosomes, concentrating its copies in telomeric positions, except in the biarmed chromosomes 1-4, 6 and 7, where some centromeric positions was also observed. Additionally, visual inspection of Helitrons revealed notable pattern of distribution across chromosomes, with density peaks mainly in centromeric/pericentromeric positions of biarmed chromosomes 1, 2, 4, 6, 7 and 9 (Figures 3A, 4). In chromosome pair 7, we also detected next to the rep87 centromeric repeat, a region enriched in Helitron, LINEs and Gypsy elements. Similarly, between positions 25.5-28Mb of chromosome 8 a region enriched in Helitrons was detected (Supplementary Figure 3). In addition, distribution curves showed that LTRs were concentrated in telomeric positions, except in the chromosomes 2, 6 and 9, where additional peaks were observed in pericentromeric positions. SINEs presented heterogeny distribution along the chromosomes, higlighting peaks in centromeric position in the chromosomes, 2, 3 and 6. Simple repeats were abundant in telomeric position in all chromosomes and lacking in the centromeric positions. Satellites showed huge peaks in pericentromeric positions of chromsome 2, in one telomeric region of the chromosomes 5, 6, 11, and in interstitial positions of chromosomes 10, 12, 18 and 20. To quantify the co-enrichment of different TE elements, we calculated the density (NL/Mb) of different TE classes in nonoverlapping 1-Mb windows along the genome and calculated the pairwise correlation between group of interest. The results obtained showed significant correlations, always positive, between different TE classes (Figure 3B). The highest significance were observed in DNA-LINE correlation (rho = 0.823), LTR-LINE (rho = 0.815) and DNA-LTR (rho = 0.732).
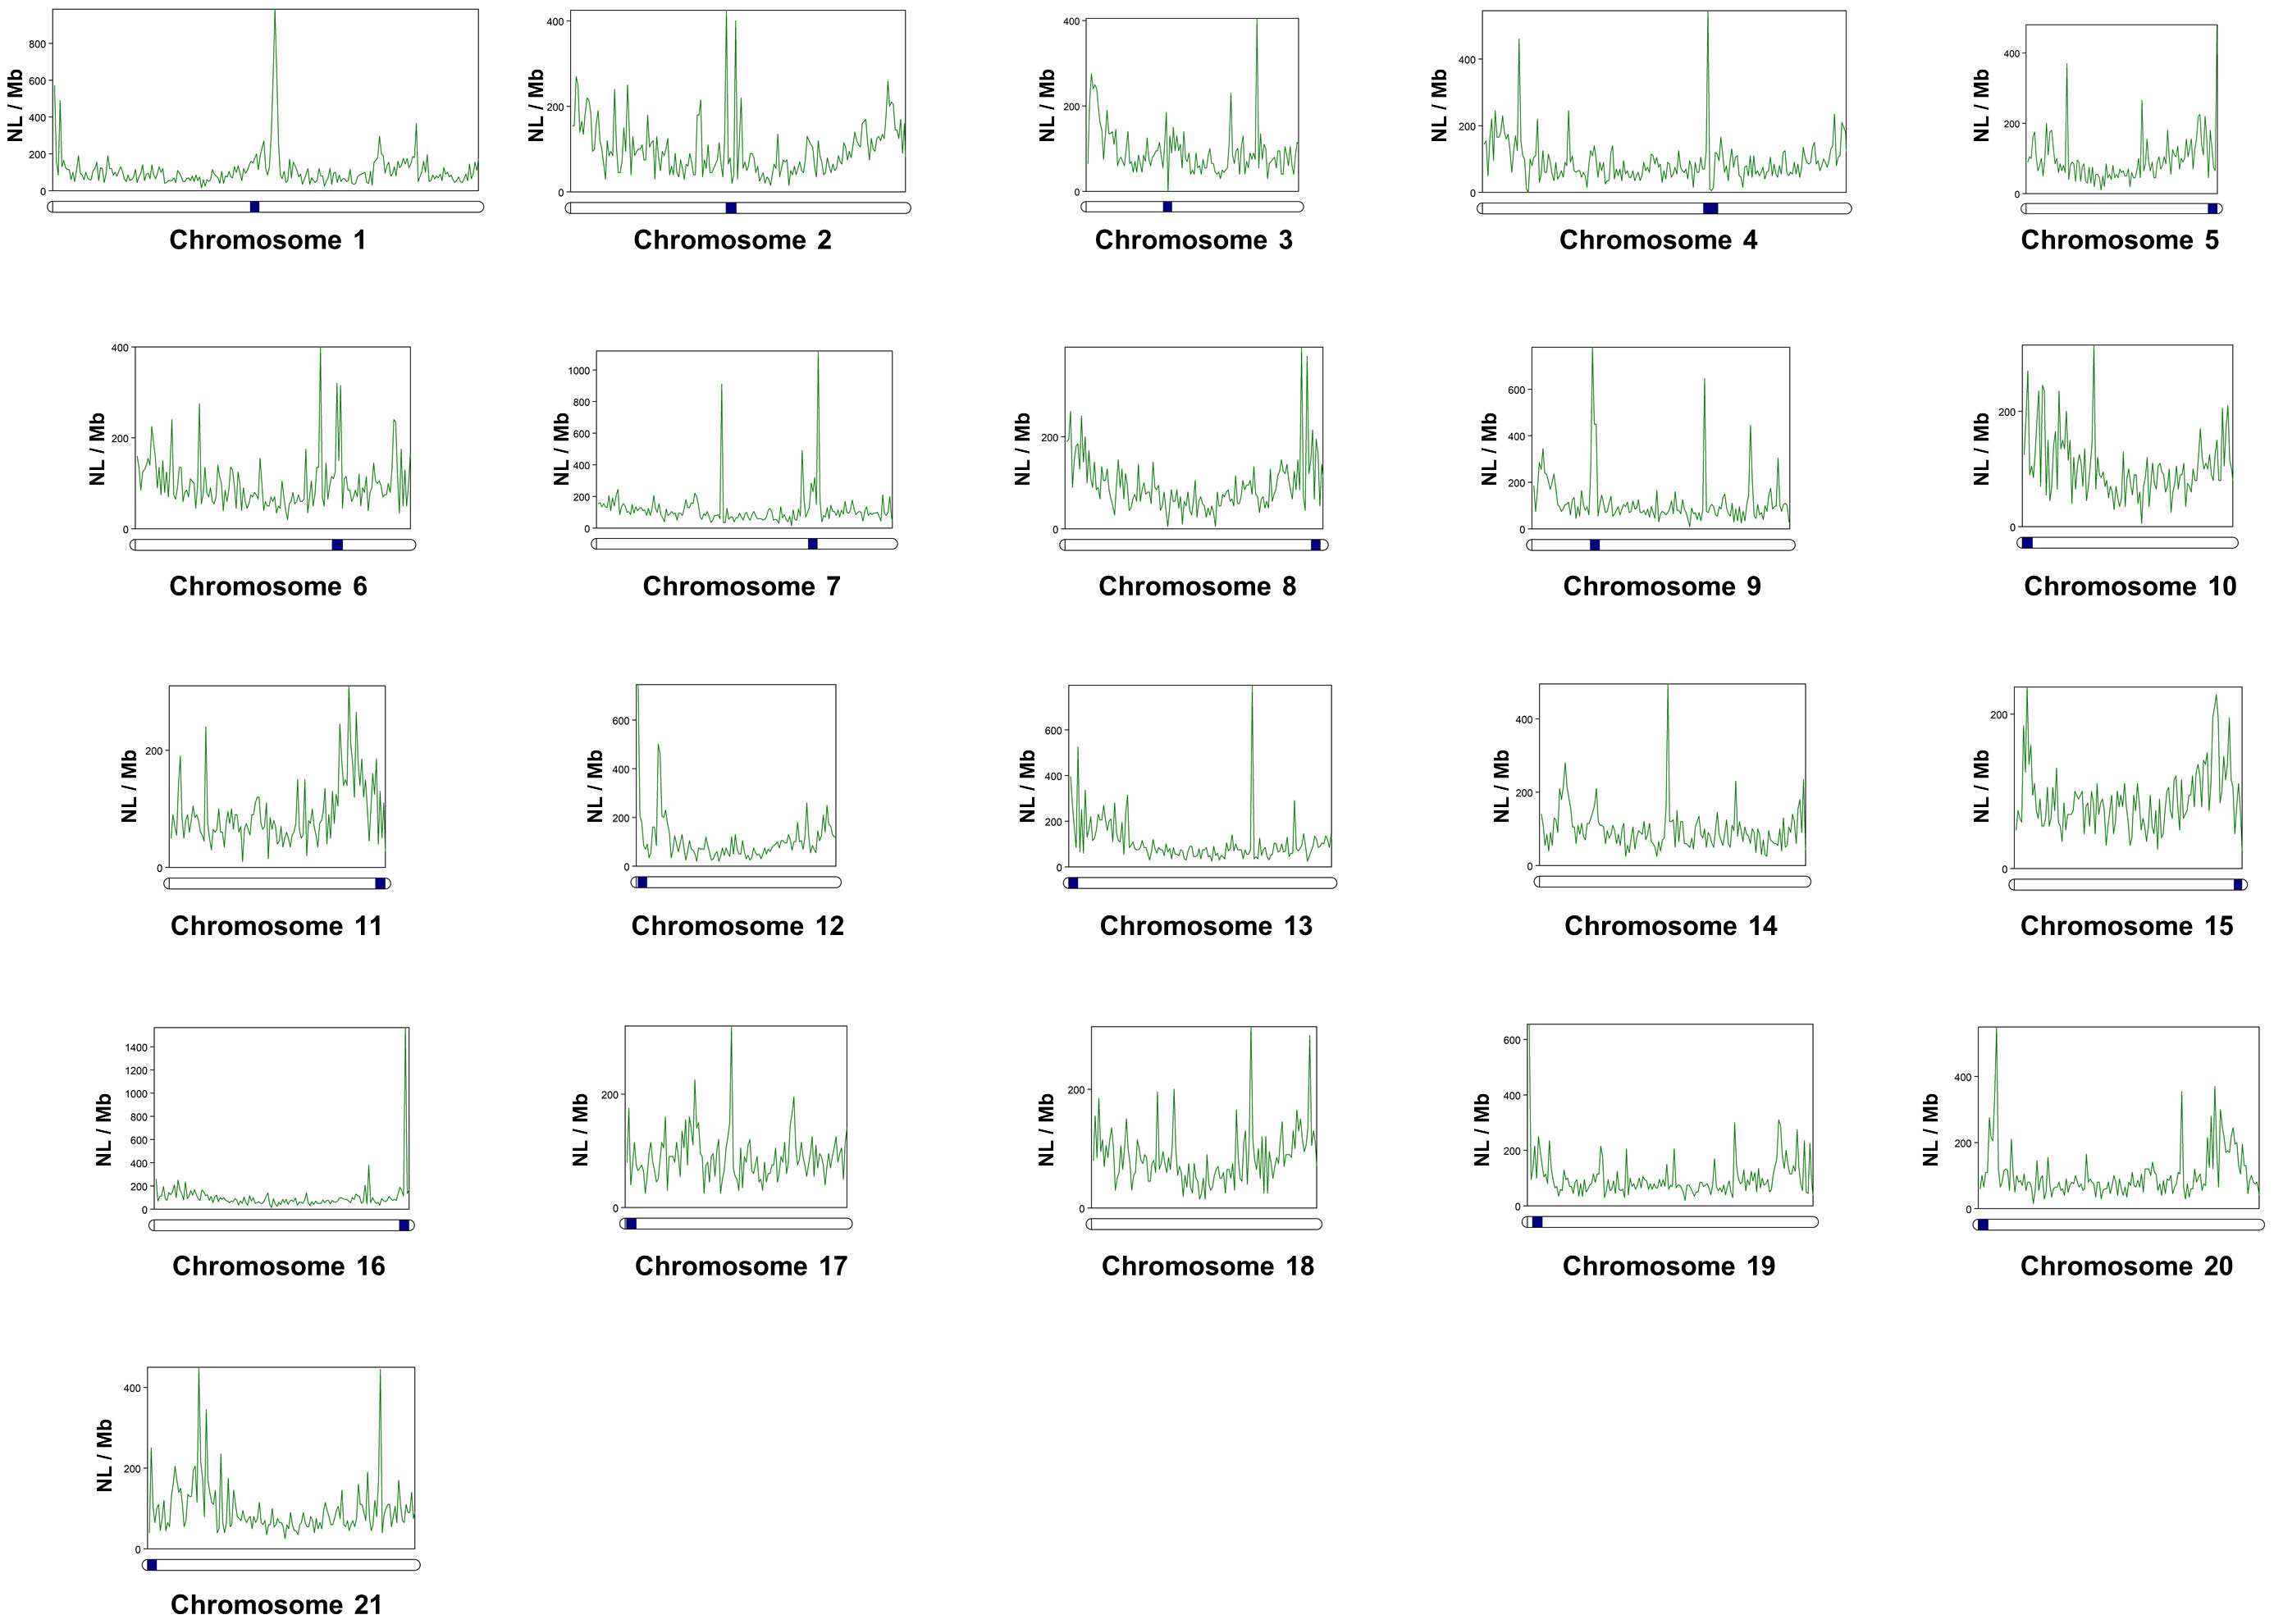
Figure 4 Distribution and abundance of Helitrons along the twenty-one chromosomes of the Senegalese sole, measured as Number of loci per megabase (NL/Mb). Centromeres are indicated as dark-blue squares on the chromosomes (horizontal bars). Centromeres coordinates are indicated in Supplementary Table 8.
We also analyzed the distribution of TE familied relative to genes. The gene distribution does not follow a patttern across the chromosomes. The analysis of correlation between gene and TE distribution, by means of Spearman’s rank correlations of number of loci density, showed no correlations among major TEs and genes (Figure 3B).
Then, using the specific TE library of S. senegalensis obtained de-novo in this work, we analyzed the distribution of different Helitron families across the chromosomes (Supplementary Figure 4). It could be observed how different families were located in the centromeres of different chromosomes, as in the two largest S. senegalensis chromosomes 1 and 2. For example, in the chromosome 1, several families were present across the chromosome (rnd-1_family-6, rnd-1_fam-7 and rnd-1_family-8) but absent in th chromosome 2. On the contrary, the family rnd-5_family-98 was present in the pericentromeric position of chromosome 2 but absent in the chromosome 1 (Supplementary Figure 4).
To determine how Helitron copies are distributed in the centromeres of chromosomes 1 and 2, the most abundant Helitron families from de novo library of S. senegalensis, were located using BLAST searches and subsequent mapping of results. On chromosome 1, hundreds of tandem copies, with different orientations, of the rnd-1_family-7 family were observed, occupying a region of 600 kb (Figure 5A). Two tandem series regions can be seen, separated by approximately 160 kb, with inverted orientation. On chromosome 2, the most abundant centromeric family (rnd-5_family-98) showed 20 copies located in tandem in the same orientation, covering a length of approx. 32 kb (Figure 5B). Self-alignment (blast) studies of the two families revealed that they both have internal repeated regions (Supplementary Figure 5).
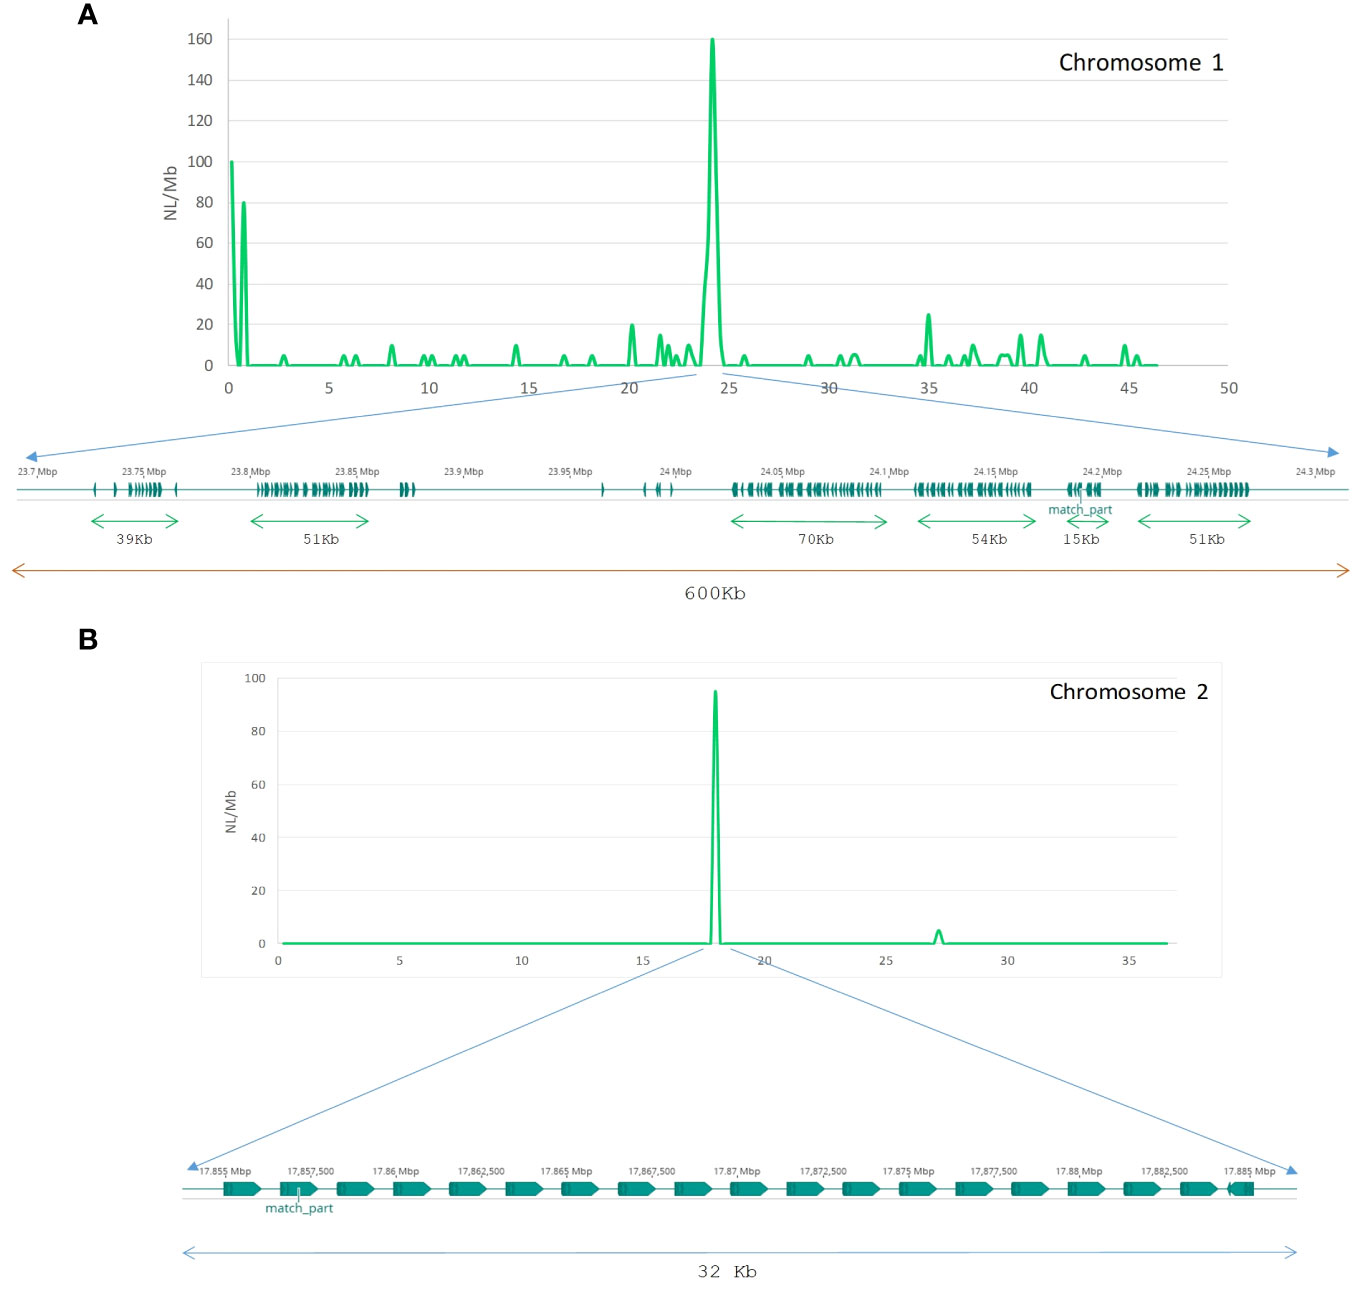
Figure 5 Tandem array structure of Helitron families on chromosomes 1 and 2 of S. senegalensis. Distribution of Helitrons rnd-1_family-7 and rnd-5_family-98 from the new S. senegalensis TE database along chromosome 1 (A) and 2 (B) respectively by non-overlapping sliding window analysis (0,5 Mb size). The abundance is measured as NL/Mb.
3.3 TEs Divergence
We estimated mean divergence from consensus sequences as a measure of TEs age (Figure 6). The divergence values of LINEs, DNA transposons and Helitrons are all higher than those of LTR and SINEs. The number of copies per family remains relatively constant across different types of TEs, with some families of DNA transposons, LINEs, and Helitrons exhibiting extremely low or exceptionally high values, particularly in the case of LINEs and DNA transposons. The difference in the number of insertions of these two elements was significant (Wilkoxon rank-sum tests: P = 1.4x10⁻⁹) (Figure 6). The presence of multiple families with nearly identical insertions throughout the genome (divergence values close to 0) suggests that all major classes of TEs contain very recently, or even currently, active families. Most families exhibit a low but significant positive correlation (Spearman’s rho = 0.188**) between the number of copies in the genome and their age. When the analysis is performed for the major classes of TEs, only DNA transposons and LTRs show significant positive correlations (0.259 and 0.254, respectively) (Figure 6). In general, there are few families with a low number of copies that are old: only 10 families have less than 50 copies and divergence greater than 20%. On the other hand, 6 young families of LINEs and DNA transposons (<5% divergence) have a high number of copies (>1000), although the youngest family with the highest number of copies is an LTR family (Figure 6). These findings may indicate the presence of transcriptionally active families in the genome of S. senegalensis.
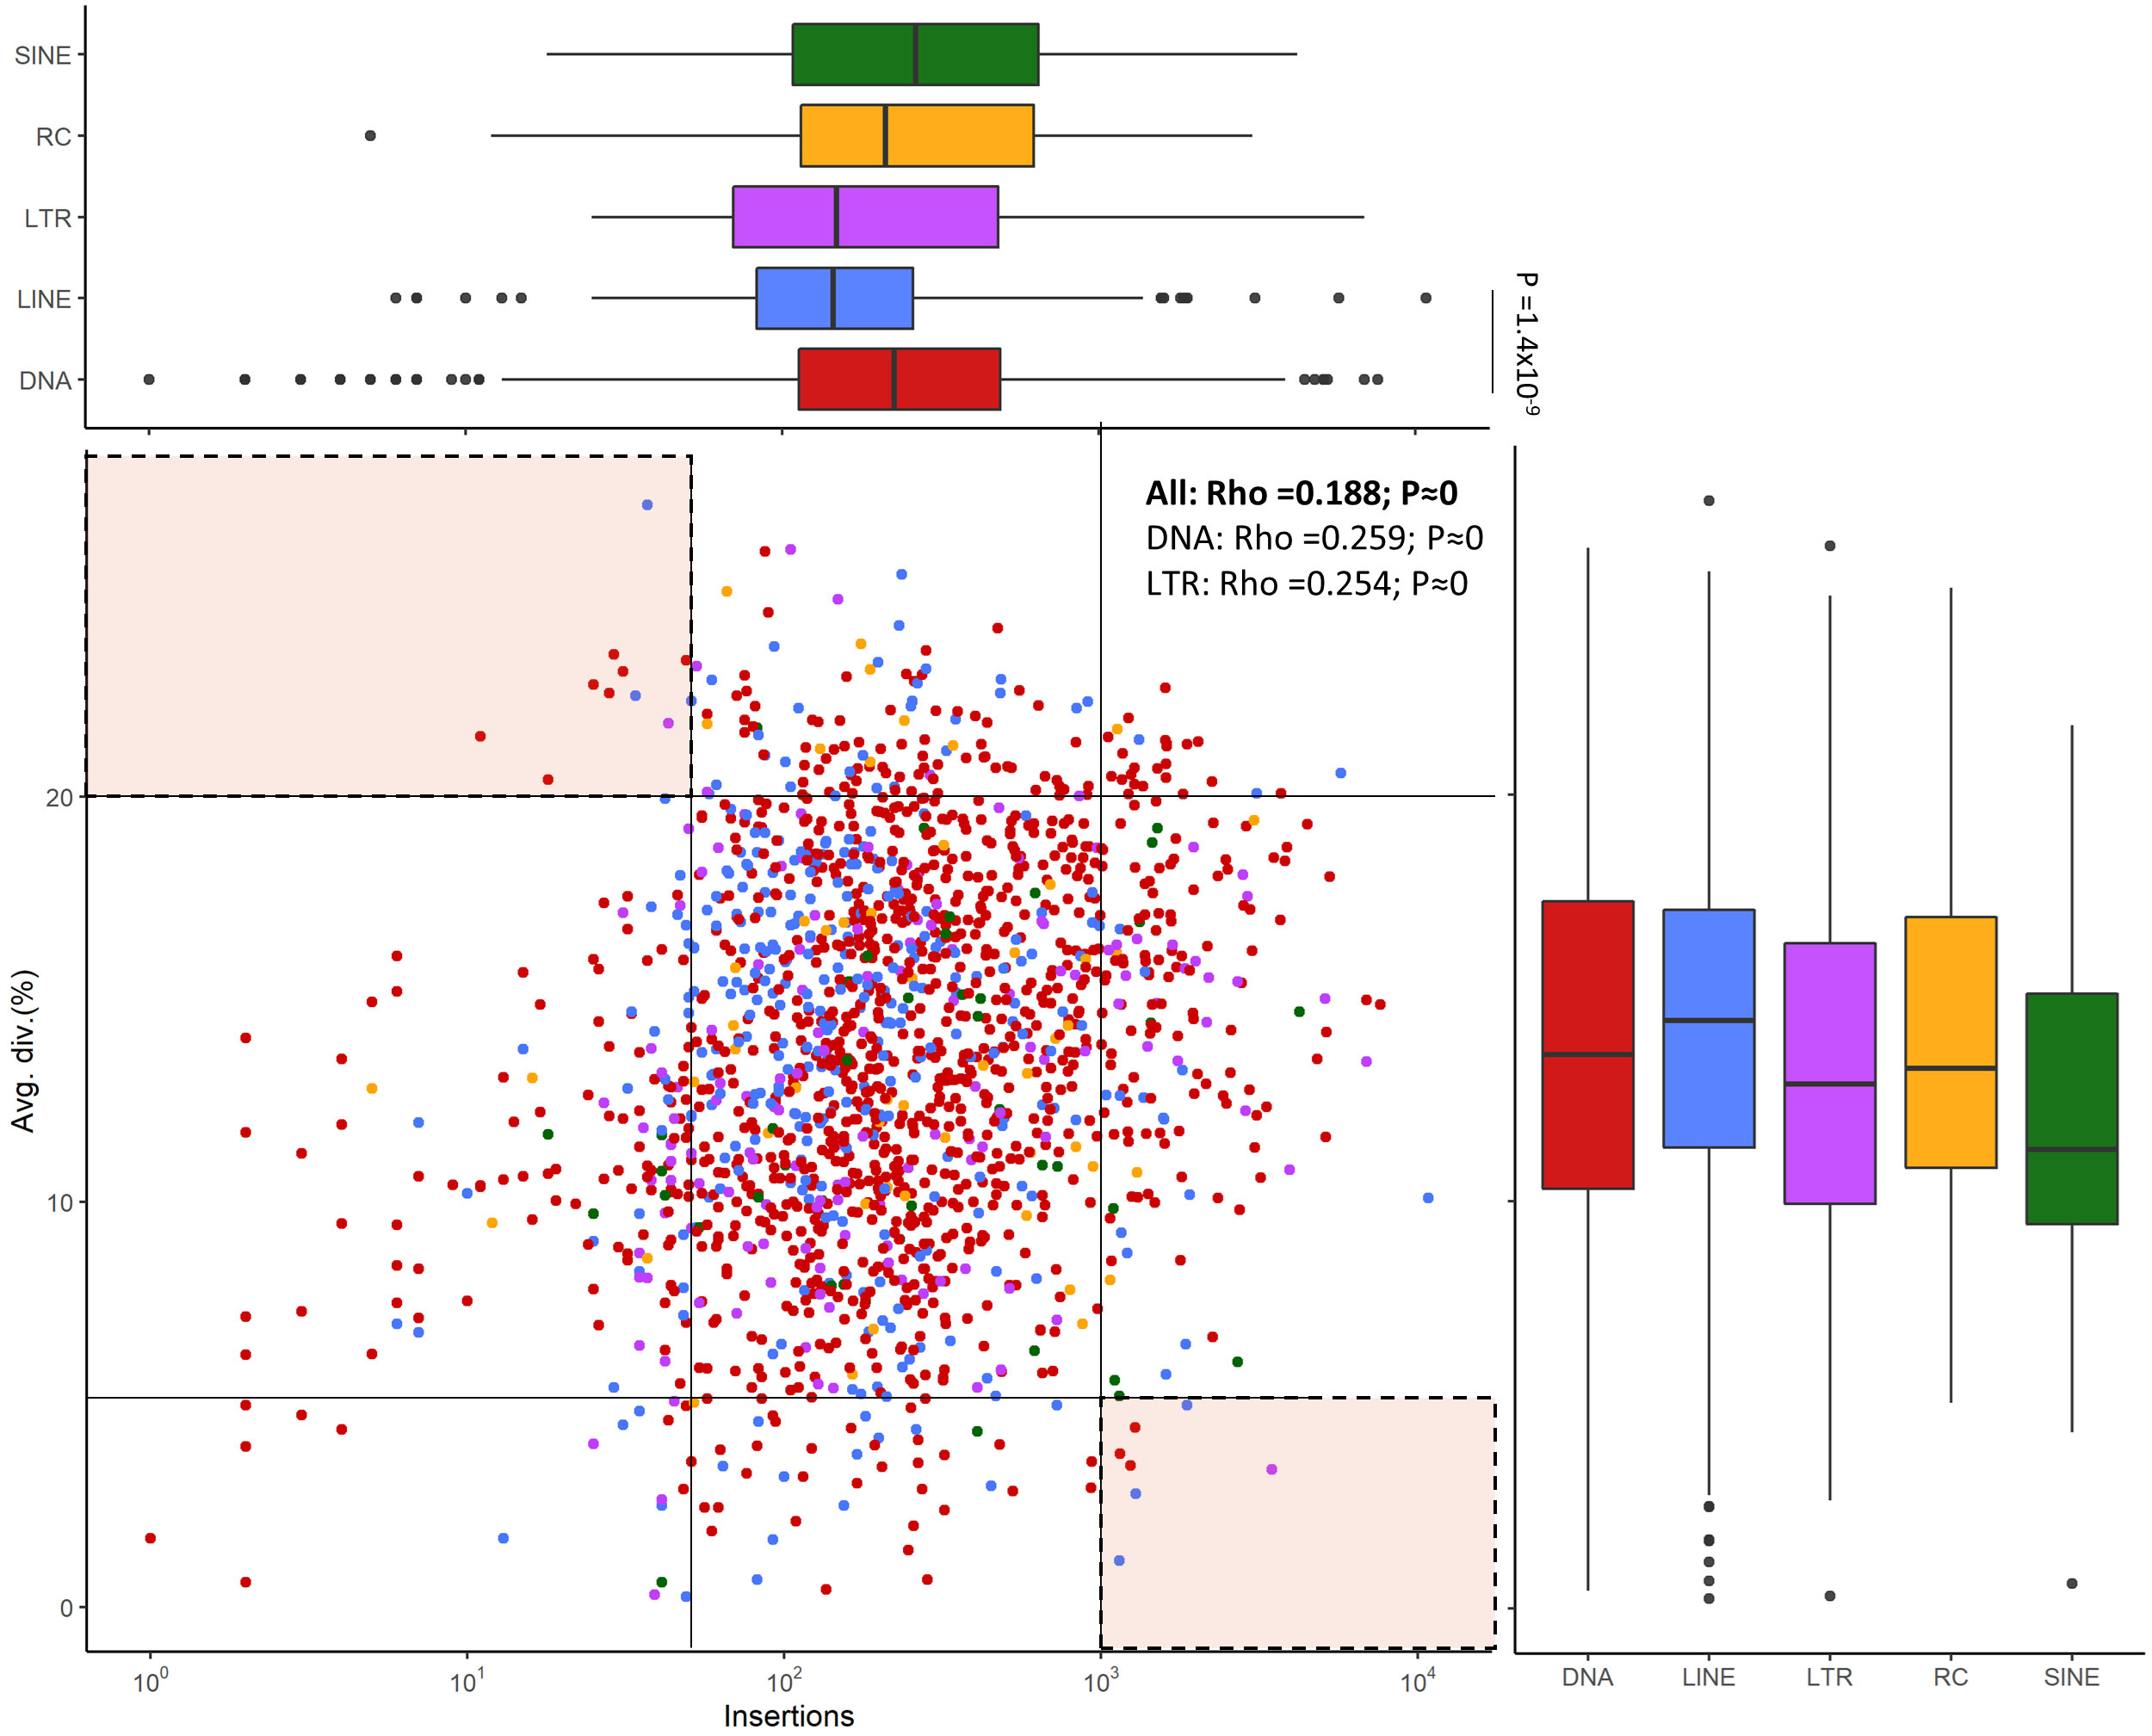
Figure 6 Correlation between the copy number of TE families and this average age in the S. senegalensis genome. Insertions refer to number of copies in the genome. Average divergence is measured as Kimura distance-based copy divergence percentage. Values for rho are calculated with Spearman’s rank correlation test. Comparations between each TE class, both copy number and average age measures, were calculated using Wilcoxon rank-sum tests, using a Bonferroni correction for determining significance. Families with extreme values (high divergence and low copy number, and low divergence with high copy number) are indicated in the marked areas in the upper left and lower right of the figure. The following TE superfamilies have been analyzed: DNA transposons (DNA in figure legend), LINEs, LTRs, Helitrons (Rolling Circles, RC in figure legends) and SINEs.
Comparative analysis of TE lengths has shown significant differences between several of the elements studied (Supplementary Figure 6A). It can be observed that SINEs are the elements with the shortest lengths, followed by Helitrons, with significant differences of both elements with LTRs and additionally with LINEs in the case of SINEs (Figure 6A). The elements with the longest lengths are the LTRs followed by LINEs, with the former showing significant differences with the rest of the elements with the exception of LINEs. It is known that longer elements provide larger targets for ectopic recombination, which is the main driver of selection against TEs (Blass et al., 2012). To see if this selection has acted on SINEs and Helitrons, a correlation analysis was performed between the length of consensus sequences and their divergence, observing that there is no such correlation in either of the two elements. Only a weak positive but significant correlation is observed in LINEs, which is the family with the least insertions in the genome, possibly indicating that they are old, full-length copies that have escaped the purifying process of ectopic recombination (Blass et al., 2012; Chang et al., 2022).
3.4 Landscape analysis
A Kimura distance-based copy divergence was done using the specific S. senegalensis TE database. The study revealed that the most frequent TEs sequence divergence relative to the TE consensus sequence in S. senegalensis was 12%-14% across all repeat classes (Figure 7). However, an asymmetrical bell-shaped distribution was observed. Abnormally high coverage values were observed at Kimura low divergence values, ranging from 2% to 7%. To determine if a specific TE family was responsible for this distribution, we plotted the values separately for the different major TE families. The results revealed that only the DNA transposon families exhibited a symmetrical bell-shaped distribution, while the remaining families displayed intriguingly asymmetrical values. Among them, the Helitrons showed the most notable Kimura divergence distribution, exhibiting two distinct peaks at low values (5-6%) and medium values (12-14%) (Figure 7). LINEs elements demonstrated higher coverage at low divergence values (2-5%), similar to the pattern observed in LTRs. However, in the case of LTRs, the coverage at the low divergence peak (1-2%) was higher than that at the intermediate values. Lastly, SINEs displayed a bimodal curve, with maximum divergence values at 4-5% and 14-16%. Thus, the asymmetric distribution of transposable elements divergence in S. senegalensis is primarily attributed to the abundance peaks of LINES, Helitrons, and LTRs in families with divergence ranges of 2-7%.
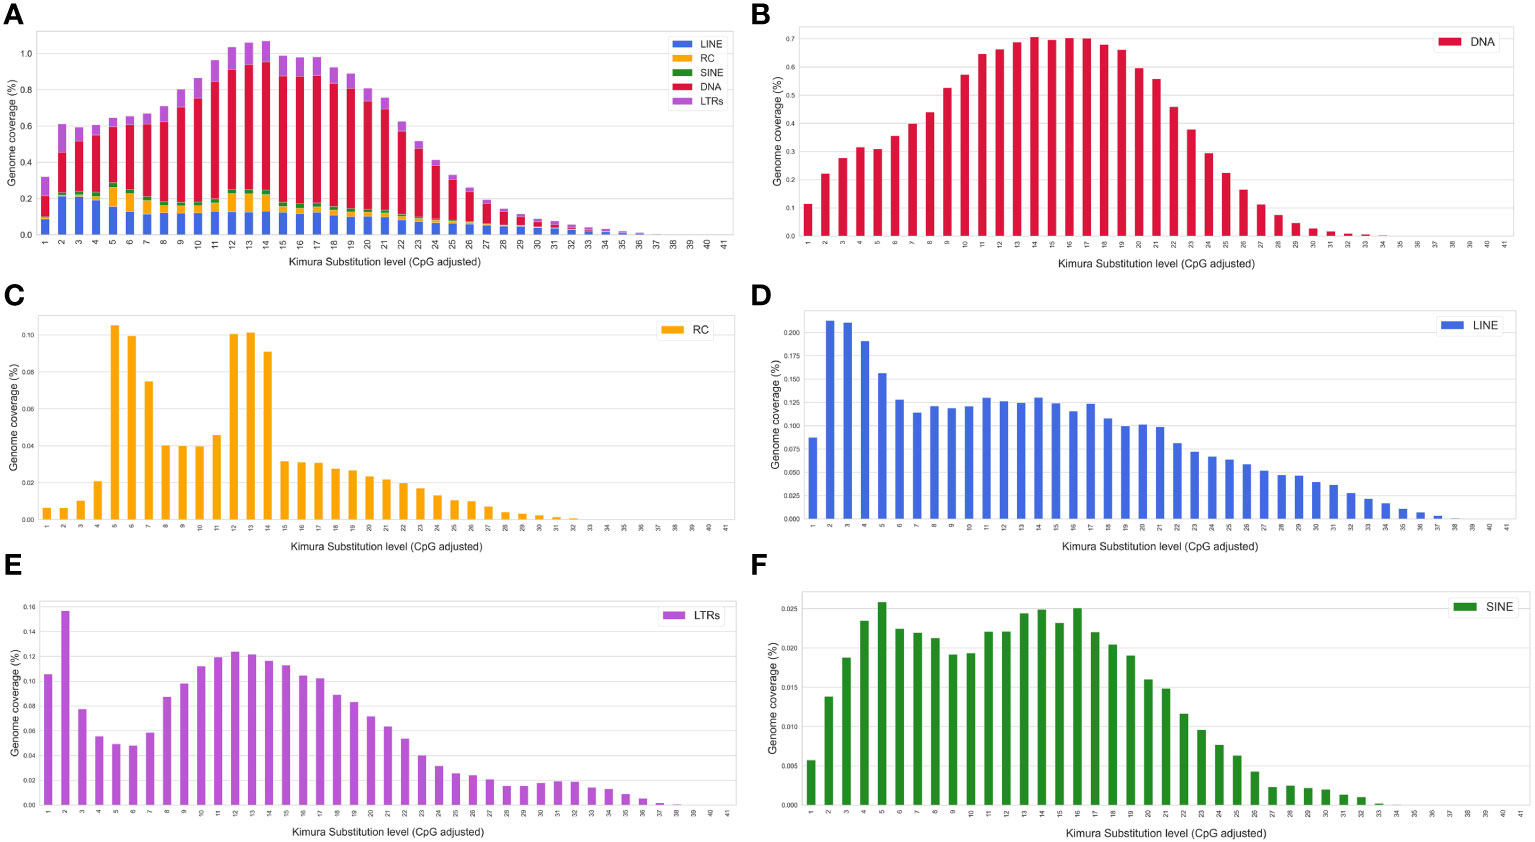
Figure 7 Kimura distance-based copy divergence analyses of transposable elements in S. senegalensis. The graph represents genome coverage for each TE superfamily in the S. senegalensis genome clustered according to Kimura distances to their corresponding consensus sequence (x axis). Clusters of copies on the left side of the graph exhibit minimal divergence from the consensus sequence of the element, suggesting that they likely represent recent copies. Conversely, sequences on the right may correspond to ancient or degenerated copies. The following TE superfamilies have been analyzed: DNA transposons (DNA in figure legend), LINEs, LTRs, Helitrons (Rolling Circles, RC in figure legends) and SINEs. Subplot (A) represents the coverage of all analysed elements as stacked bars and figures (B–F) the different TEs individually.
Furthermore, to assess inter-chromosomal divergences, the analysis was conducted per chromosome for every family (Supplementary Figure 7). The DNA transposons exhibited stable and symmetrical divergence distribution across all chromosomes, consistently peaking at 14-18% divergence (Figure 7B). In contrast, the analysis of Helitrons demonstrated in most chromosomes the bimodal distribution, characterized by low and medium divergence values accompanied by high coverage, with the exception of chromosome 15, with a bell-shaped distribution and a coverage peak in 13-16% (Figure 7C and Supplementary Figure 7B. LINEs showed a similar distribution pattern across all chromosomes, with high coverage at low divergence values (Figure 7D), although some exceptions were observed on chromosomes 3, 4, 6, 9, 15, and 16, where peaks at higher divergence values (16-20%) were evident (Supplementary Figure 7C). On each chromosome, the LTRs showed a high coverage of sequences with very low divergence (1-2%) (Figure 7E). Notably, on chromosomes 13 and 15-20, abnormally high peaks appeared at positions of maximum divergence (30-32%) (Supplementary Figure 7D). In the case of SINEs, the presence of high coverage peaks for very low divergences (1-2%) on chromosomes 11, 19 and 21 (Figure 7F and Supplementary Figure 7E) is noteworthy. The rest of the chromosomes showed, with slight differences between them, the bimodal distribution observed in the global genomic divergence analysis.
Based on these divergence results, we proceeded to the phylogenetic analysis of the 52 Helitron families present in the S. senegalensis genome (Figure 8). The tree showed two separated clusters. One cluster contains 16 families, including those mapped mainly at the centromere of chromosome 1. The other cluster contains 4 large branches, which include the rest of the families including the family mapped on chromosome 2.
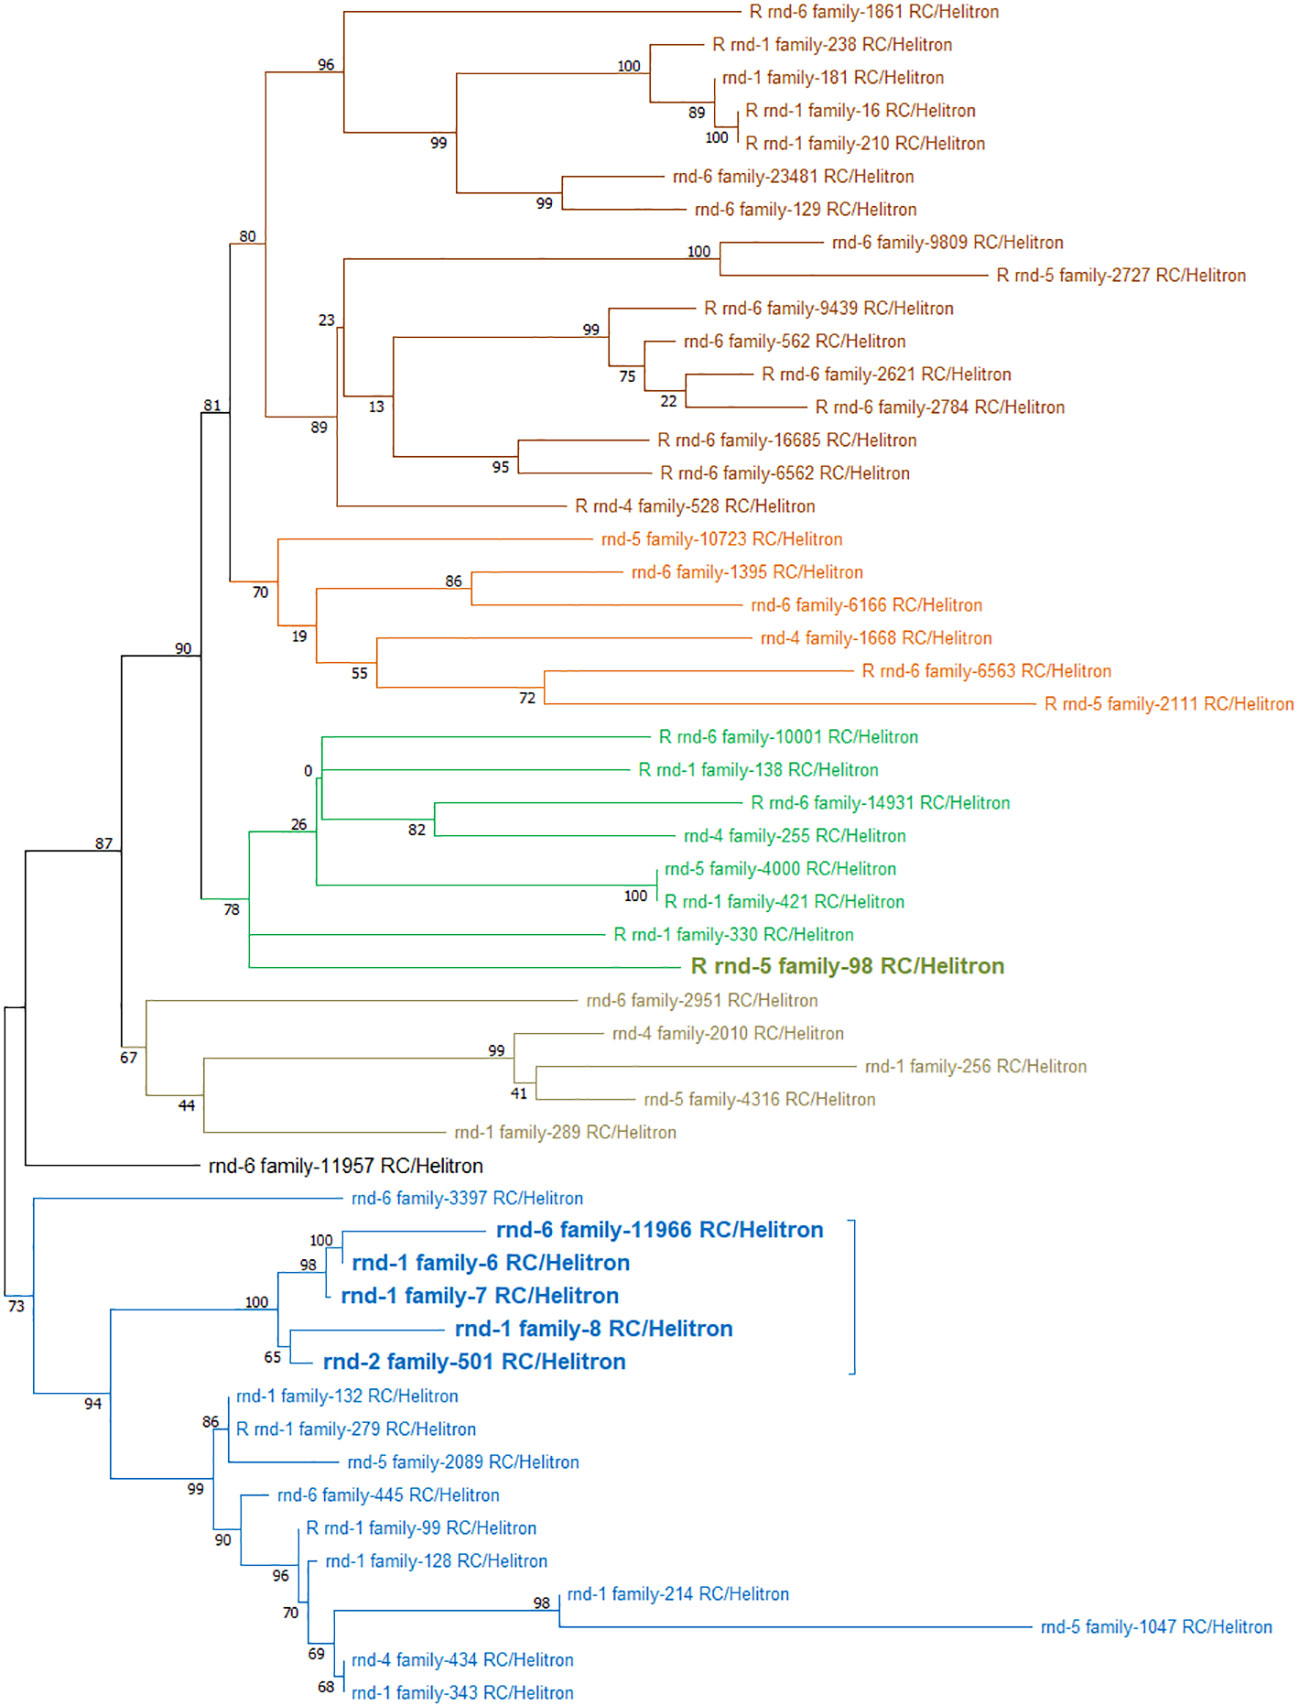
Figure 8 Phylogenetic tree of 52 Helitron families present in the S. senegalensis genome obtained from de novo TEs database. The tree shows two separated clusters: In one cluster, there are 16 families (represented by blue branches), mapped to the centromere of chromosome 1 (highlighted in bold); the other cluster comprises 4 large branches (colored in dark brown, orange, green, and light brown), encompassing the remaining families, including the centromeric Helitron family rnd-5_family-98 (highlighted in bold).
To analyze the evolution of Helitron copies, we extracted 2560 insertions from the S. senegalensis genome, using the RepeatModeler alignments and then constructed a phylogenetic tree with branches (copies) coloured by chromosomes (Figure 9). The results revealed the presence of four distinct clusters of sequences corresponding to different chromosomes. The overall radial tree (Figure 9) and the individual chromosome trees (Figure 9, Supplementary Figure 8) demonstrated that certain branches of the tree did not exhibit sequences on specific chromosomes. In contrast to chromosome 1, which displayed a uniform distribution of sequences across all branches, some phylogenetically related sequence groups were absent on certain chromosomes, such as chromosomes 2, 3, and 4, among others (Figure 9). This trend was also observed in other chromosomes (Supplementary Figure 8).
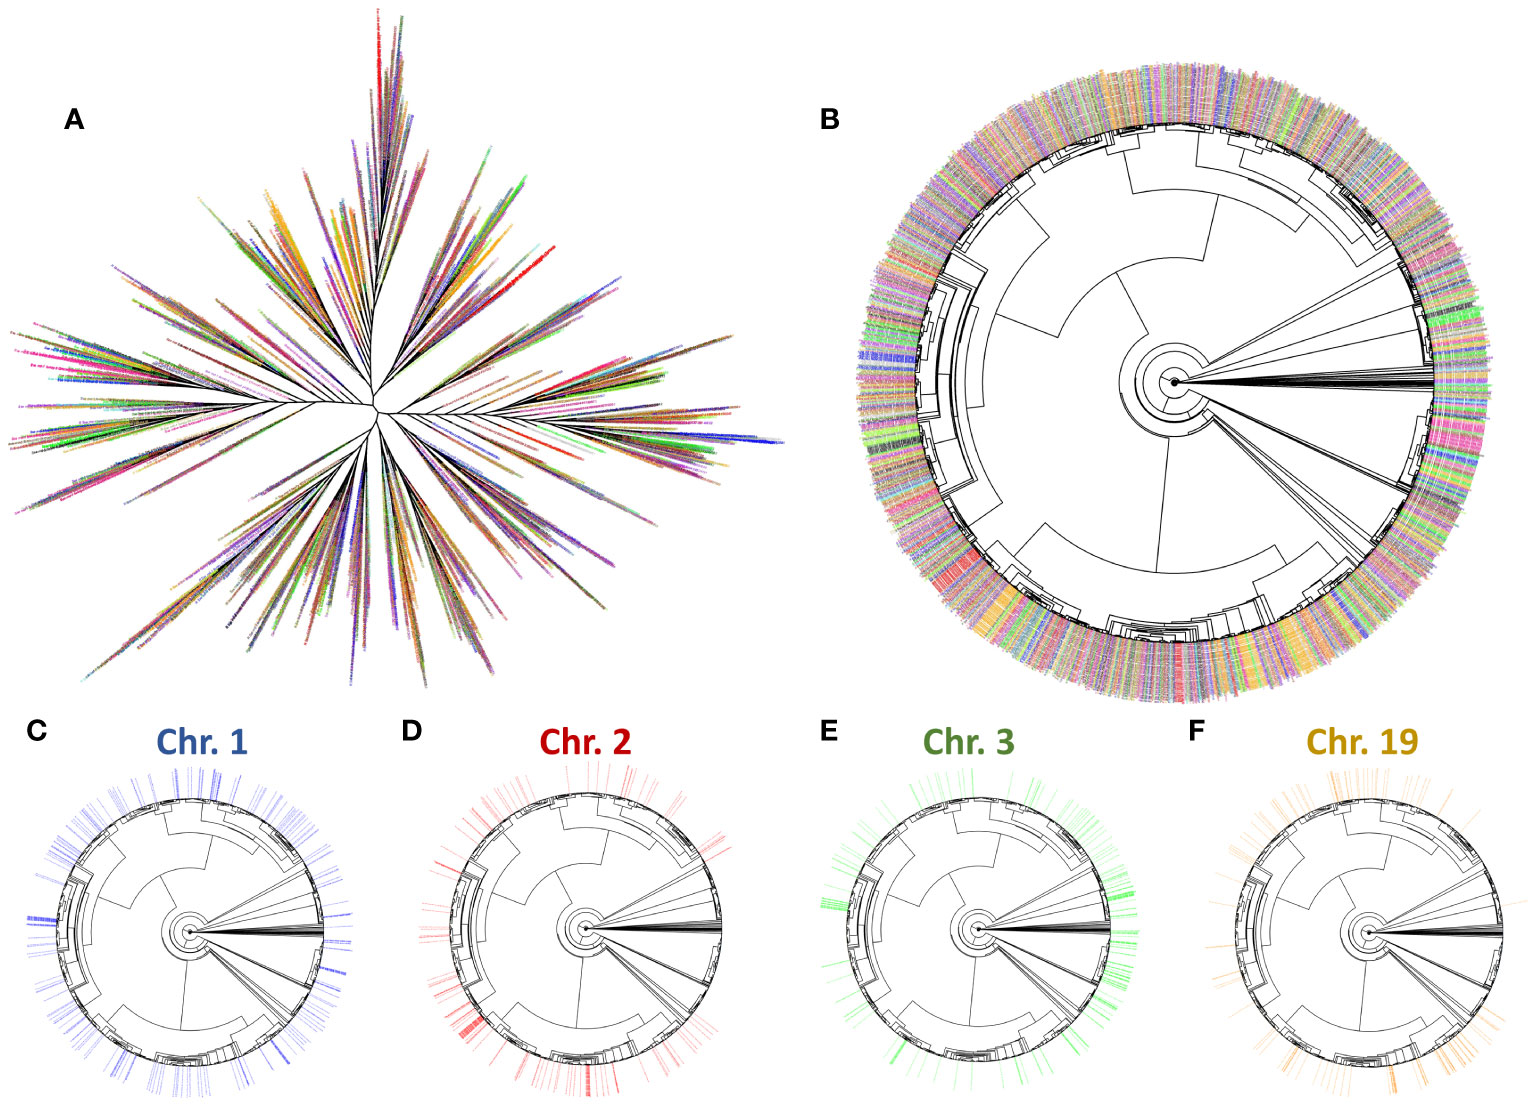
Figure 9 Phylogenomic tree of Helitron insertions in the S. senegalensis genome. The branch labels (insertions) have been coloured by the chromosome from which each insert was extracted. The colours are (chromosome 1-21 respectively): blue, red, green, purple, darkgoldenrod, brown, orange, pink4, grey, black, turquoise, goldenrod, chartreuse, firebrick, hotpink, darkgreen, violetred, steelblue, darkorange, olivedrab, deeppink. Radial and circular phylogenomic trees are showed in subplots (A, B) respectively. Trees showing Helitron insertions in chromosomes 1, 2, 3 and 19 (C–F respectively) are also displayed.
To investigate the evolutionary patterns of Helitrons in representative fish species, a phylogenomic tree was constructed. A total of 8615 sequences were extracted from the genomes of five different flatfish families analyzed in this study (S. senegalensis, C. semilaevis, P. olivaceus, S. maximus, H. hippoglossus) and two external species (S. aureovittata and S. aurata). The sequences were color-coded by species and displayed in different formats to facilitate analysis (Figure 10). Based on this phylogeny, the sequences were classified into seven distinct clusters. Cluster 1 consisted of a main branch with high divergence, primarily comprising H. hippoglossus sequences, originating from a branch containing S. aurata sequences. Cluster 2 encompassed sequences from all species, exhibiting homogeneous and similar evolutionary patterns, although branches with higher divergence were observed in P. olivaceus sequences. Cluster 3 predominantly consisted of well-differentiated H. hippoglossus and S. senegalensis sequences, with one branch of H. hippoglossus sequences showing greater divergence than the others. Cluster 4 contained a main group of S. aurata sequences, with higher divergence than the other branches. Cluster 5 predominantly contained H. hippoglossus sequences, with a higher level of divergence within the cluster compared to the smaller number of S. senegalensis sequences. Notably, a few copies from S. maximus were located on the main branch of H. hippoglossus. Cluster 6 was composed of two major branches, comprising S. aurata elements with a high level of divergence within the cluster, and a distinct group of S. maximus elements with lower divergence, suggesting a potential expansion event of specific families in the S. maximus genome. Additionally, copies of S. aurata and S. senegalensis Helitrons were observed in smaller, well-clustered branches. Finally, cluster 7 consisted of a large main branch comprising S. senegalensis elements with relatively low divergence, possibly indicating a rapid expansion of some specific families within its genome.
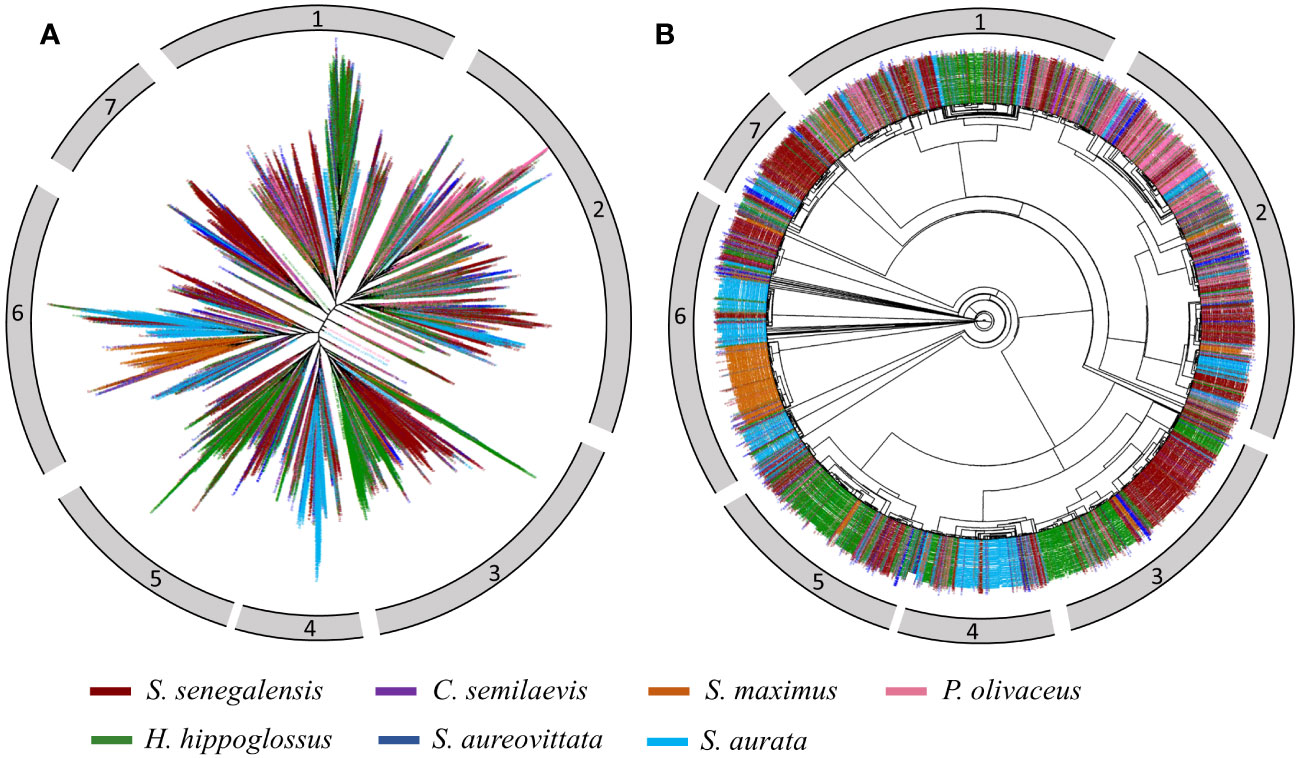
Figure 10 Phylogenomic trees of Helitron insertions in five flatfishes (S. senegalensis: dark-red, C. semilaevis: purple, S. maximus: dark-orange, P. olivaceus:hot-pink, H. hippoglossus: green), one Carangidae (S. aureovittata:blue) and one Sparidae (S. aurata: deep-sky blue) species. Subplots (A, B) show a radial tree and a circular tree respectively.
4 Discussion
In the present study, a general analysis of repetitive element abundance in the genome of eight flatfish species was carried out. The comparative analysis showed differences in the abundance of this fraction of the genome among pleuronectiform species, as well as between these species and the other species analyzed from Carangiformes and Spariformes orders. The species analyzed in the present study clearly show the common situation of teleosts, with DNA transposons predominating (Chalopin et al., 2015a; Sotero-Caio et al., 2017). In recent genome sequencing and annotation studies of flatfish, general data on the abundance of DNA transposons, LINEs, SINEs, and LTRs in 10 flatfish species showed that in four of the analyzed species, belonging to the Achiridae, Paralichthydae, Cynoglossidae, and Soleidae families, the overall coverage sum of the analyzed retrotransposon categories (LTRs, LINEs, and SINEs) exceeded that of DNA transposons (Lü et al., 2021), although the absence of other more precisely covered data such as Helitrons or another families included in the general categories, prevents a deeper analysis of the observed differences in these species.
In S. senegalensis, there are two references to the composition of repetitive elements based on whole-genome data. In 2021, in the first version of the species’ genome (Guerrero-Cózar et al., 2021), during the genome annotation process, a brief reference is made to the global content of repetitive sequences, giving a value of 23.41% for a female linkage map and 23.55% for the male one, without any additional contribution or evaluation in relation to these sequences and their classes, types, superfamilies, or families. Subsequently, in a new, more complete and improved version of the genome (de la Herrán et al., 2023), more up-to-date general data on repetitive elements were obtained. To do this, the authors created a library of repetitive elements directly from non-assambled sequencing reads (Illumina), using an experimental design based on the de novo analysis performed by the RepeatExplorer platform (Novák et al., 2020). This tool is suitable for obtaining libraries of new repetitive sequences, which are highly represented in genomic reads, such as those from repetitive regions. Some of these reads can be eliminated in assembly processes and therefore is an advantage of the technique. However, the information is never exhaustive, the annotation of the contigs obtained from the program is deficient, because it uses libraries that are not specific, at least for fish, and the quantification that RepeatMasker performs using these RepeatExplorer libraries significantly underestimates the quantification of these repetitive elements. The data obtained in that work showed that, using the library obtained with RepeatExplorer, repetitive sequences made up 8.2% of the genome of S. senegalensis, a percentage much lower than that obtained by Guerrero-Cózar et al. (2021), and much lower than that obtained using the de novo library constructed in the present work (28.68%) or the results also obtained by combining libraries of repetitive elements from teleosts and de novo library (39.54%). The contents of repetitive sequences obtained from different studies are highly dependent on the methodology used. In general, different combinations of annotation of repetitive elements are used, such as homology analyses combined with de novo analyses, as has been done in this work, to obtain a more complete view of the content of repeated sequences in genomes. It is also important to point out that due to this, it is appropriate to study the group of genomes that are being analyzed with the same methodology, as is the case of the study that has been carried out in flatfish in this work. In this way, with this approach, the comparison allows for more robust conclusions to be drawn in relation to the relative differences between the species analyzed. Additionally, the use of RepeatMasker on a common teleost database for all species analyzed avoids biases with respect to the use of species-specific databases, where the different quality of these libraries could produce distortions in the results.
On the other hand, the superfamily analysis carried out in this work in flatfish species has shown them to be poor in SINEs. This is consistent with previous work, where it seems that this absence of SINEs is a common feature in most fish studied (Sotero-Caio et al., 2017; Shao et al., 2019). In flatfish, this same situation has been described in other species belonging to families Achiridae, Bothidae, Rhombosoleidae, or Toxotidae, among others, where the values were close to 0% coverage (Lü et al., 2021). The analysis of other superfamilies has also shown, in this work, a high value of the hobo-Activator DNA transposon, followed by retroelements, LINEs, L2/CR1/rex, LTR elements, and Gypsy/DIRS1 (Figure 1, Supplementary Figure 1). In most fish genomes studied to date, it has also been seen that hAT, L1, L2, and Gypsy are the most widely distributed and are the most predominant (Shao et al., 2019). In flatfish, however, despite recent sequencing and annotation of new genomes (Lü et al., 2021), the absence of detailed analysis of TE families and superfamilies prevents comparisons between species of this group. On the other hand, in studies carried out with other TE families in other fish species, their abundance has been shown to be more specific to species. For other families, however, abundance may be more specific to species. This is the case of the CR1 superfamily, which in fish species that have diverged more recently, has very low values. Among these species are those that have not undergone the specific genome duplication event of teleosts (Chalopin et al., 2015a; Sotero-Caio et al., 2017). In addition, in other fish species, the levels of each TE superfamily seem to be very specific and dependent on the species itself. This occurs for example for the L2 and RTE elements in Nothobranchius furzeri, for Gypsy elements in Boleophthalmus pectinirostris, or Tc/mariner in Astyoanax mexicanus (Shao et al., 2019). It has also been described that in opah fish approximately 50% of their genome is composed of repetitive sequences (Wang et al., 2022a). The data presented for the first time in this study in flatfish species, show high values of abundance of Class I and Class II TE elements in the species S. senegalensis in relation to the rest of the species analyzed, showing even more similarity of abundance with a species as evolutionarily distant as S. aurata (family Sparidae) than with the rest of the species of Pleuronectiformes or Carangiformes. On the other hand, the low abundance of Helitrons in C. semilaevis compared to the rest of the species is also notable. However, the sequencing technology used to assemble this species (short reads), may in part influence the detection of its low abundance, although future genome reassemblies with new hybrid assemblies (long and short reads) pipelines will improve the analysis of the C. semilaevis genome. It has been described that in general, TEs in fish are regularly distributed and that the relationships between species with similar TE distribution are consistent with phylogenetic relationships. However, the results observed in this study confirm that although there is similarity in abundance at the global level among the genomes of the eight flatfish species, this relationship is not met for all families analyzed. Since genome protection processes (e.g., Piwi-interacting small RNAs, DNA methylation) regulate TEs, the loss and gain of the same must be associated with the host genome itself (Levin and Moran, 2011). Harmful TEs that compete with the host genome are more likely to be eliminated, while more beneficial TEs are likely to be conserved in genomes. In this way, the most specific and abundant superfamilies in some fish species could play a key role in the evolution of their genomes and may even be related to the biological characteristics of the species themselves (Venner et al., 2009). Our results indicate that TE levels in species belonging to the same group can have large differences and be more specific to each species than to a phylogenetic group (Supplementary Figure 1). It is worth noting that there are currently no specific and comparative data on the abundance of repeated sequences in flatfish, so the results shown here provide a very important additional value for the study of the evolution of the genomes of fish in general and pleuronectiformes in particular.
In this work, we deepened the analysis of the distribution of mobile elements in S. senegalensis, since it is the species that has shown the greatest differences compared to the rest of the genomes of the families of Pleuronectiformes analyzed. The interaction of TEs with their host genomes has been compared to the interaction of species with ecosystems. Thus, TEs proliferate and use genome resources while interacting with other mobile elements (Leonardo and Nuzhdin, 2002). In that sense, we carried out the study of abundance by chromosomes, considering that they could have a seemingly more local behavior, like an ecosystem, and reflect their evolution. In previous studies, partial analyses of the distribution of repetitive elements in S. senegalensis have been carried out by analyzing the content of these elements in BAC clones located in cytogenetic maps (Rodríguez et al., 2019, Rodríguez et al., 2021; Ramírez et al., 2022). In these studies, clones (between 4 and 8) were analyzed, spaced out in some chromosomes. Despite the scarce amount of genome analyzed, limited by the small portion of each chromosome contained in these BACs and of genome studied, it was possible to observe certain differences in the abundance of elements in BACs belonging to different chromosomes and different intrachromosomal location (García et al., 2019; Rodríguez et al., 2019, Rodríguez et al., 2021; Ramírez et al., 2022). However, it was only after the publication of the recent complete whole-genome sequence of S. senegalensis (de la Herrán et al., 2023), we have been able to completely analyze the abundance of repetitive elements in each of the 21 pairs of chromosomes of the species. Although the content of the different types of elements in general seemed to show a similar behavior, with homogenized values in the chromosomes, the study by superfamilies did show differences in coverage between chromosomes, very notable in the case of satellites and Helitrons. These elements, although not the only ones, are the ones that show the greatest heterogeneity throughout the chromosomes, mainly the Helitrons, with peaks of abundance located in centromeric regions of some chromosomes, mainly in biarmed chromosomes, although also in acrocentric chromosomes (Figures 3–5). Karyotype of S. senegalensis (2n=42) is divided in three pairs of metacentric chromosomes, two submetacentric, four telocentric and twelve acrocentric ones (Vega et al., 2002). Previous analyses demonstrated that the centromeres of 19 out of 21 pairs of S. senegalensis were occupied by PvuII satellite DNA (Robles et al., 2017). Furthermore, our in silico mapping of centromeres is coherent with the morphology in all cases with four exceptions: (1, 2) chromosomes 14 and 18, for which no centromeric sequences were detected. Chromosomes 14 and 18 are telocentric. No telomeric motifs were found at neither of the distal regions. This might indicate that this portion, including the centromeric region, was not assembled, (3) chromosome 19 exhibited two signals of centromeric PvuII in distal regions of both arms and (4) chromosome 5, telocentric according to our characterization but submetacentric according to morphology. The p arm of chromosomal pair 5 bears the ribosomal 45S in this species (Cross et al., 2006). The genome assembly used in our analyses for mapping missed this 45S unit (de la Herrán et al., 2023), which was found to be massively present in unanchored scaffolds (unpublished data). This might be the reason of the discrepancy in morphology we found in our analyses on centromeric position of this chromosome pair. Thus, we were able to unambiguously characterize the centromeric region of 18 out of the 21 chromosome complement.
Furthermore, it is known that the chromosomal evolution in flatfish has presented Robertsonian fusion and intrachromosomal duplication processes (Merlo et al., 2021; Rodríguez et al., 2021; Ramírez et al., 2022). In S. senegalensis it has been described that centromeric or Robertsonian fusions have occurred in 3 of the 9 biarmed chromosomes of the species. These chromosomes were 1, 2 and 4 where, based on BAC clone synteny studies, other pericentric rearrangements (inversions), that have occurred during the evolution of these chromosomes were described (Rodríguez et al., 2019, Rodríguez et al., 2021; Ramírez et al., 2022). There is evidence to support that inversions, as well as other chromosomal rearrangements, are involved in the adaptation of species to the environment and that polymorphisms associated with these inversions are related to geographic distributions (Wellenreuther and Bernatchez, 2018; Amorim et al., 2021). TEs are considered key elements in this chromosomal rearrangement process (Feschotte and Pritham, 2007). TEs and associated machinery play an important role in the evolution of the structure of the centromeres and their function (Wong and Choo, 2004). Regardless of their origin, centromeric sequences in higher eukaryotes contain extensive and homogeneous tandem repeat sequences of satellites and TEs (Wong and Choo, 2004; Klein et al., 2018). Centromeres can be considered functionally defined regions in eukaryotic chromosomes that show strong evidence of recurrent evolutionary novelties facilitated by TE activity. The impact of TEs on centromeres includes both the structure of the centromeric ecosystem itself and the proteins involved in centromeric identity and function (Klein et al., 2018). Studies of human populations have revealed that active insertions of TEs into centromeres have occurred during the evolution of modern humans and can facilitate rare events of centromeric recombination (Contreras-Galindo et al., 2013; Zahn et al., 2015). In Arabidopsis, TEs make up approximately 11% of the genome and are enriched mainly in the pericentromeric heterochromatin regions (Kapitonov and Jurka, 2001; Wong and Choo, 2004). Numerous evidences have shown the implication of TEs and transposases in the evolution of centromeric DNA, among which the presence of TEs (retrotransposons) specific to centromeres of different plants such as maize and grass (Langdon et al., 2000; Nagaki et al., 2003; Jin et al., 2004). In certain maize species and humans, a process of displacement of TEs towards pericentric regions has been observed, with a reduction of TEs within the centromeres themselves. This extraction process provides a mechanism for protection against the potential harmful effects of any newly emerging TE in the developing or established centromeric chromatin. This process offers an explanation for the accumulation and high prevalence of TEs found in the pericentromeric domains of many centromeres (Mroczek and Dawe, 2003). In S. senegalensis, tandem repeats of Helitrons are not localized exactly in the centromeric sequences of the satellite PvuII family previously described (Robles et al., 2017) and used to map the centromeres of this species, but in pericentromeric positions, as described previously in humans and plants.
Interestingly, the potential capacity of TEs to contribute to the formation of satellite arrays in centromeres of genomes has been demonstrated through the production of tandem internal repeats via their folding mechanism (Dias et al., 2014). It has also been described that the insertion of TEs in centromeres is due to the fact that they probably represent safe insertion zones, both for the host and for the TEs (Birchler and Presting, 2012; Sultana et al., 2017). Thus, TEs localized in centromeres could not cause insertional mutagenesis in centromeres since the surrounding repeated sequences could act as a “buffer” and the suppression of crossing-over events in centromeres. This location could, therefore, protect recently inserted TEs from the type of recombination events that cause mutations and usually result in the loss of mobility of these TEs (Gent et al., 2017; Klein et al., 2018).
One of the most relevant findings of the present study is the discovery of multiple insertions of Helitron transposons, through tandem arrays, in centromeric-pericentromeric regions of many of the chromosomes of S. senegalensis (Figure 5). To our knowledge, this has only been previously described in mammals, such as primates or bats, and in plants (Xiong et al., 2016; Klein et al., 2018; Wang et al., 2022b). As has been mentioned, Helitrons are a class of eukaryotic transposon with an important role in the shaping of current genomes (Schnable et al., 2009; Yang and Bennetzen, 2009a, Yang and Bennetzen, 2009b). Helitrons are widely distributed in plants and invertebrates, often contributing to a high percentage of the genome (Putnam et al., 2007; Yang and Bennetzen, 2009b; Han et al., 2013; Peñaloza et al., 2021) and more recently in bats (Pritham and Feschotte, 2007; Thomas et al., 2014; Grabundzija et al., 2016; Kosek et al., 2021). Helitrons have also been described in other species but in lower abundance (Poulter et al., 2003). As previously discussed, Helitrons are replicated by a rolling circle mechanism (RCR) (Khan, 2005; Ruiz-Masó et al., 2015). In a large study conducted in 27 plant genomes (Xiong et al., 2016) it was described that Helitrons were found in tandem repeat arrays in all analyzed species, a configuration predicted by the RCR transposition model. This has also been observed again recently in the wheat genome (Wang et al., 2022b). The number of Helitrons in a tandem array varied in these genomes from a few to hundreds of copies in the case of rice genomes. In particular, it has been observed that this tandem array arrangement occurred mainly in the centromeric regions, intercalated between retrotransposons and satellite repeats (Zattera and Bruschi, 2022). This tandem repeat configuration of Helitrons in centromeric positions, described in plants, is exactly what was discovered in the present study in the flatfish S. senegalensis. This suggests that this distribution is favorable in the evolution of centromeres in eukaryotes. The maximum number of repeats observed in plants, within each array, was described in rice, with more than 150 copies (Xiong et al., 2016) and in wheat (Wang et al., 2022b). In the case of the centromere of chromosome 1 of S. senegalensis, this number is much higher. Oddly, this arrangement of long tandem Helitron arrays does not seem to occur in other plants, like maize, even when more than 80% of the maize genome is composed of transposons (Schnable et al., 2009). In addition, unlike what is observed in plants, the Helitrons of S. senegalensis that are found within the same array are not always in the same direction, as has been observed in the centromeric region of chromosome 1. This could indicate that the different arrays observed in chromosome 1 come from insertions produced at different times in the evolution of the centromeric region of this chromosome.
Interestingly, the Helitrons analyzed in plants presented internal repeats, both isolated Helitrons and tandem repeats (Xiong et al., 2016). In fact, of 1616 Helitrons observed in maize, rice, and Arabidopsis, 81.8% of them present internal repeats (Xiong et al., 2014). This characteristic has also been observed in the main families of Helitrons that form part of the long tandem arrays of chromosomes 1 and 2 of S. senegalensis.
In Actinopterygian fishes, different divergence profiles have been observed (Chalopin et al., 2015a; Sotero-Caio et al., 2017; Shao et al., 2019). In general, transposition explosions occur at least once or twice, if not more, throughout the evolutionary history of a fish. In this process, there is a continuous increase in the number of active transposons, before the explosion event, after which there is a decrease in the number of these active transposons. In most fish genomes, the rate at which the number of active transposons increases is lower than the rate at which it declines, so most fish have fewer ancient copies (K-values > 25) than recent copies (K-values < 25) (Chalopin et al., 2015a; Shao et al., 2019). Recent studies have shown different situations depending on the species in flatfish (Lü et al., 2021). Thus, in most of them, the divergence profiles have mainly shown ancient activity periods in almost all the analyzed species, except in Pseudorhombus dupliocellatus, Platichthys stellatus where additional recent transposon activity peaks were observed. In Trinectes maculatus, only recent explosion processes are observed (Lü et al., 2021). In S. senegalensis, the main peak of divergence is between 12-14%, taking into account all TEs, although there are significant differences between different superfamilies studied. Important differences in their TE profile have been described between evolutionarily close species. Thus, in Japanese and European eels, there are many differences in the evolutionary history and explosions in R2 and Helitrons transposons, respectively (Shao et al., 2019). Among African cichlid species, which generally have two events of explosions of all their superfamilies, a recent explosion has been observed in the species Maylandia zebra (Shao et al., 2019).
The life cycle of a TE goes through periods of activity and inactivity. The process begins with the invasion of a TE into a new genome (through horizontal transfer events) or by the evolution through mutation of a new lineage from an existing one (Shao et al., 2019). The insertion of TEs into genomes generates a series of host responses to prevent their expansion through the genome. However, if the insertion favors the host in some way, the TE will be conserved and a process of coevolution of the element with the host will occur (Kidwell and Lisch, 2001; Hua-Van et al., 2005). One of the most relevant characteristics of the ray-finned fish mobilome is the presence of more recent TE copies than those observed in other vertebrates, in particular fugu, cod, and stickleback present very recent copies. Between closely related species such as medaka and platyfish, differences in TE activity have been identified (Carducci et al., 2020). In S. senegalensis, two points of recent activity are also observed (K-value < 25), although a much more recent explosion of TEs is observed, not very abundant, with values close to 5% divergence. This has been observed in species such as spotted gar, Tetraodon, or Tilapia (Chalopin et al., 2015a), as well as in Haplochromis burtoni, Neolamprologus brichardi, Oreochromis niloticus, or Pundamilia nyererei (Shao et al., 2019). However, in other fish species, different patterns are observed, with a higher abundance of recent TEs (K-value <10) in species such as zebrafish, cod, stickleback, medaka, or Fugu (Chalopin et al., 2015a). Especially important is the recent TE activity event experienced by Maylandia zebra, with a peak of explosion with K-values of 1-2% (Shao et al., 2019). On the other hand, it has also been observed in fish the absence of recent activity as in platyfish, European eel, Latimeria chalumnae, or Callorhinchus milli (Chalopin et al., 2015a; Shao et al., 2019).
In the study of divergence by TE types, we have described in the present work important differences between them in the genome of S. senegalensis. DNA transposons, present greater divergence than the rest of the elements, with no recent activity signals. However, the rest of the TEs show different recent explosion activities, being the majority in the case of LINEs and LTRs, and similar abundance of ancient and recent elements both in Helitrons and in SINEs (Figure 7). However, in previous studies of TE abundance and divergence in other flatfish species, no differences in divergence profile were observed between the studied TE categories. Therefore, with the general coverage and divergence data of TEs in both S. senegalensis described in the present work and other flatfish species described previously (Lü et al., 2021), it can be affirmed that repetitive sequences constitute a considerable portion of the genomes of this group of fish, and that the variety of genome sizes among flatfish can possibly be attributed to the expansion of these repetitive sequences in the genomes after the divergence of these species (Lü et al., 2021). Regarding other fish groups, with the exception of gar fish, most teleosts have modeled their genomes with DNA transposons. This occurs especially in the zebrafish, which shows the highest amplification of DNA-transposons among vertebrates. LINEs have contributed significantly to the genome of species such as fugu, tilapia, and medaka, while a middle-aged explosion of LTR elements has been detected in Tetraodon. In pufferfish, zebrafish, stickleback, and tilapia, a high number of recent copies have been described. In lamprey, many recent copies of DNA transposons can be identified (Chalopin et al., 2015a). In the case of Anguilla japonica and Anguilla anguilla, important differences in the activity of the Helitrons have been observed, with much greater divergence and abundance of these elements in A. anguilla (Shao et al., 2019). DNA transposons in species such as H. burtoni, N. brichardi, O. niloticus, or P. nyererei, present recent activity events, but not ancient copies, as in the rest of the TEs of these species, so it seems that there is a purging process of these elements in these genomes (Shao et al., 2019).
The analysis of the landscape in S. senegalensis by chromosomes showed that there are two important moments of transposon activity in the genome of some types of TEs, where insertions of different ages have been observed in many chromosomes but not in all. This occurs again, mainly in Helitrons (Supplementary Figure 7). Of the two TEs explosion events, one of them has occurred recently from an evolutionary point of view, because the divergence values are around 5-7% (Kimura distance). The study of TE activity by chromosomes has not been carried out to date in any species, so there is no data to be able to make a comparison. However, it can be deduced that TEs burst events generally affect the entire genome, and in the case of Helitrons, in certain positions such as centromeres, the replication of the insertions and the maintenance of them are preferred because they are evolutionarily favored (Birchler and Presting, 2012; Sultana et al., 2017). It is worth noting that in chromosomes such as the 15, there are no recent copies, so they only contain ancestral copies with a higher degree of divergence, from ancient explosion events.
The analysis of Helitron families carried out reflects two large groups of well-differentiated families (Figure 8). One of these clusters contains very few families, all of which have a small genetic distance. In this cluster, two subgroups can be observed, each with very little differentiation between them. One of these groups includes the family located as long tandem series in the centromeric region of chromosome 1. This cluster could be related to those Helitron families that contain more tandem copies, where the divergence is small because it could be part of a recent burst event of this transposon. The presence of another cluster with families with greater divergence between them could be reflecting isolated copies throughout the genome, or with few rounds of tandem replication. These copies have had more time to evolve, and therefore reflect longer branches, or, on the other hand, not have a selective pressure because they are not so involved in the function of the centromere. When the analysis of chromosomal insertions has been carried out, labeling the copies by color according to their origin, it can be observed that different chromosomes actually present several families with different numbers of insertions, but that not all families are in all chromosomes. This is well seen in chromosomes such as 2, 3, and 9 (Figure 9), among others, where there are clearly copies belonging to certain clusters that are not present in them. Again, this indicates that there is a clear divergence between Helitron copies in the genome of S. senegalensis, and that their distribution is not random. The phylogenetic study of Helitrons also addressed the evolution of their insertions in different genomes. The analyses presented interesting results that reflect the existence of clusters of Helitron copies that are evolutionarily close (short branches in the same cluster) belonging to species as distant as S. aurata (Sparidae) and S. maximus (flatfish) (Figure 10). There are also observed events of burst of these Helitrons in S. senegalensis, shared with sequences of Helitrons from S. aurata or S. arureovittata, or clusters with sequences that are almost exclusive to S. senegalensis (Family Soleidae) and H. hippoglossus (Family Hippoglossidae). These data could be explaining two possible evolutionary processes. One of them is the selection of certain families and their copies throughout the evolution not only of flatfish, but also of intermediate species to this order, such as S. aureovittata, or as far away as S. aurata. However, there are no studies on the distribution of these elements along their chromosomes. If these copies with little divergence between species so distant were located in the centromeric regions, as occurs in S. senegalensis, it is probable that these sequences would be maintained by evolution, within the protection that these genomes would be carrying out on these centromeric Helitrons. Another explanation that is not to be ruled out is the existence of horizontal transfer (HT) events between the families of Helitrons that present high homology between these distant species. Although there are various ways to study possible transposition events, the most general one predicts that in TE families where HT events occur, there should be major inconsistencies between the TE family phylogeny and that of its hosts (Hartl et al., 1997; Schaack et al., 2010). Although we have not performed their specific analysis in the present study, these inconsistencies are clearly observable from the genomic study carried out.
In contrast to the knowledge that exists around horizontal HT in the evolution of prokaryotes, the evolutionary importance of HT remains more obscure (Frost et al., 2005; Schaack et al., 2010; Merlo et al., 2012). These differences can be attributed in part to the disproportionate attention that has been given to the transfer of genes, as opposed to non-coding DNA. TEs are not only the most abundant elements in eukaryotic genomes, but they are also one of their most dynamic components. Today, HT of transposable elements (HTT) is considered a relevant mechanism in the modeling of eukaryotic genomes. Both DNA transposons and retrotransposons can be horizontally transferred, and HTT can involve a wide variety of eukaryotic lineages that can transfer TEs between closely or distantly related lineages (Dotto et al., 2015). Additionally, a significant number of TEs are known to have induced important phenotypic changes to their host that have been acquired through HT, thus establishing HTT as a source of variation that feeds adaptive changes (Gilbert and Feschotte, 2018).
Recently, the study of more than 300 vertebrate genomes has shown a minimum of 975 independent events of HTT between lineages that diverge more than 120 million years (Zhang et al., 2020). Of these events, more than 90% (93.7%) have occurred in ray-finned fishes, and less than 3% in mammals and birds. These HTT events occur not only between fish but also between fish and amphibians or birds. The majority of the events recorded in ray-finned fishes involve DNA transposons, specifically the Tc1/Mariner superfamily (Zhang et al., 2020), although other superfamilies belonging to the retrotransposons such as BovB and L1, have also shown significant HTT events in marine eukaryotes (Ivancevic et al., 2018). On the other hand, the Pacific oyster (Crassostrea gigas), the cactus worm (Prriapulus catus) and the marine worm (Saccoclossus kowalevskii) have been described as potential vector species in HTT cross-Phylum events involving marine eukaryotes (Ivancevic et al., 2018). In the case of Helitrons, it has been shown that this transposon has been frequently transferred horizontally in insect genomes (Thomas et al., 2010). However, additional cases of HTT of Helitrons have been identified in vertebrates such as lizards, jellyfish, or jawless fish (Thomas et al., 2010). It has been suggested that ray-finned fishes could be part of an environment that includes both organisms and environments that are particularly susceptible to exchanging TEs, such as viruses and other parasites (Loreto et al., 2008; Gilbert and Cordaux, 2017). Interestingly, the species S. aurata, in which we have described in the present work high similarity between its copies of Helitrons and those of S. maximus, had already shown a possible HT event of the 5S rDNA gene with the toadfish Halobatrachus didactylus (Merlo et al., 2012). This would support the fact that HT processes between marine organisms, in this case between fish, are more frequent than previously studied and described.
5 Conclusion
The current work introduces novel genetic resources that have broadened our understanding of the abundance, distribution, and evolutionary patterns of repetitive sequences in flatfish species. We have discerned variations in the content of distinct subclasses of transposable elements across eight flatfish species. Specifically, we have deepended into the study of repetitive elements in the S. senegalensis sole genome and their evolution, by examining the divergence of the predominant types of TEs, identifying two burst events of the majority of these elements. We have unveiled an intriguing new discovery of a genomic structure involving tandem repeat insertion arrangement of Helitron families in the pericentromeric regions of the S. senegalensis genome. This discovery, previously identified solely in mammals and plants, significantly augments our knowledge of genome architecture and transposon-mediated evolutionary processes in flatfish. Furthermore, our phylogenomic analysis of Helitron insertions in flatfish and other external species has yielded intriguing results, reflecting the existence of evolutionarily proximate Helitron copy clusters belonging to species as distant as S. maximus (flatfish) and S. aurata (Sparidae). All the findings bear significant implications for our understanding of the chromosomal evolution in S. senegalensis and other studied flatfish species. This taxonomic group holds paramount importance due to its global economic relevance and its remarkable adaptation to benthic life. Of particular interest is the role that transposable elements (TEs) have played in shaping the current chromosomal architecture within this group of fishes.
Data availability statement
The original contributions presented in the study are included in the article/Supplementary Material. Additional TEs annotation dataset is deposited in the Figshare repository and available in https://figshare.com/search?q=10.6084%2Fm9.figshare.25239952. Further inquiries can be directed to the corresponding author.
Ethics statement
Ethical approval was not required for the study involving animals in accordance with the local legislation and institutional requirements because This is bioinformatic work from public data bases.
Author contributions
IC: Conceptualization, Writing – original draft, Resources, Investigation, Methodology. MR: Investigation, Resources, Writing – review & editing. SP-B: Investigation, Writing – review & editing. MM: Investigation, Writing – review & editing. AG-S: Investigation, Writing – review & editing. RN-P: Writing – review & editing, Methodology, Resources, Supervision, Writing – original draft. LR: Conceptualization, Funding acquisition, Project administration, Resources, Supervision, Writing – review & editing.
Funding
The author(s) declare financial support was received for the research, authorship, and/or publication of this article. This research was funded by Regional Government of Andalusia—FEDER: Grants: P20-00938 and PCM-00014. The open access fee was co-funded by the QUALIFICA Project (QUAL21-0019, Junta de Andalucía).
Acknowledgments
The computational work was performed on the Cai3 Supercomputing Cluster (https://supercomputacion.uca.es/) at the University of Cadiz, Spain.
Conflict of interest
The authors declare that the research was conducted in the absence of any commercial or financial relationships that could be construed as a potential conflict of interest.
Publisher’s note
All claims expressed in this article are solely those of the authors and do not necessarily represent those of their affiliated organizations, or those of the publisher, the editors and the reviewers. Any product that may be evaluated in this article, or claim that may be made by its manufacturer, is not guaranteed or endorsed by the publisher.
Supplementary material
The Supplementary Material for this article can be found online at: https://www.frontiersin.org/articles/10.3389/fmars.2024.1359531/full#supplementary-material
References
Altschul S. F., Gish W., Miller W., Myers E. W., Lipman D. J. (1990). Basic local alignment search tool. J. Mol. Biol. 215, 403–410. doi: 10.1016/S0022-2836(05)80360-2
Amorim K. D. J., Félix Da Costa G. W. W., Cioffi M. D. B., Tanomtong A., Carlos Bertollo L. A., Molina W. F. (2021). A new view on the scenario of karyotypic stasis in Epinephelidae fish: Cytogenetic, historical, and biogeographic approaches. Genet. Mol. Biol. 44 (4), e20210122. doi: 10.1590/1678-4685-GMB-2021-0122
Auvinet J., Graça P., Belkadi L., Petit L., Bonnivard E., Dettaï A., et al. (2018). Mobilization of retrotransposons as a cause of chromosomal diversification and rapid speciation: The case for the Antarctic teleost genus Trematomus. BMC Genomics 19, 339. doi: 10.1186/S12864-018-4714-X
Bao Z., Eddy S. R. (2002). Automated de novo identification of repeat sequence families in sequenced genomes. Genome Res. 12, 1269–1276. doi: 10.1101/GR.88502
Belyayev A. (2014). Bursts of transposable elements as an evolutionary driving force. J. Evol. Biol. 27, 2573–2584. doi: 10.1111/JEB.12513
Benson G. (1999). Tandem repeats finder: a program to analyze DNA sequences. Nucleic Acids Res. 27, 573. doi: 10.1093/NAR/27.2.573
Biémont C. (2010). Anecdotal, historical and critical commentaries on genetics: A brief history of the status of transposable elements: from junk DNA to major players in evolution. Genetics 186, 1085. doi: 10.1534/GENETICS.110.124180
Birchler J. A., Presting G. G. (2012). Retrotransposon insertion targeting: a mechanism for homogenization of centromere sequences on nonhomologous chromosomes. Genes Dev. 26, 638–640. doi: 10.1101/GAD.191049.112
Blass E., Bell M., Boissinot S. (2012). Accumulation and rapid decay of non-LTR retrotransposons in the genome of the three-spine stickleback. Genome Biol. Evol. 4, 687–702. doi: 10.1093/GBE/EVS044
Bourque G., Burns K. H., Gehring M., Gorbunova V., Seluanov A., Hammell M., et al. (2018). Ten things you should know about transposable elements 06 Biological Sciences 0604 Genetics. Genome Biol. 19, 1–12. doi: 10.1186/s13059-018-1577-z
Carducci F., Barucca M., Canapa A., Carotti E., Biscotti M. A. (2020). Mobile elements in ray-finned fish genomes. Life 10, 221. doi: 10.3390/LIFE10100221
Carotti E., Carducci F., Canapa A., Barucca M., Greco S., Gerdol M., et al. (2021). Transposable elements and teleost migratory behaviour. Int. J. Mol. Sci. 22, 602. doi: 10.3390/IJMS22020602
Chalopin D., Naville M., Plard F., Galiana D., Volff J. N. (2015a). Comparative analysis of transposable elements highlights mobilome diversity and evolution in vertebrates. Genome Biol. Evol. 7, 567–580. doi: 10.1093/gbe/evv005
Chalopin D., Volff J. N. (2017). Analysis of the spotted gar genome suggests absence of causative link between ancestral genome duplication and transposable element diversification in teleost fish. J. Exp. Zool. B. Mol. Dev. Evol. 328, 629–637. doi: 10.1002/JEZ.B.22761
Chalopin D., Volff J. N., Galiana D., Anderson J. L., Schartl M. (2015b). Transposable elements and early evolution of sex chromosomes in fish. Chromosom. Res. 23, 545–560. doi: 10.1007/s10577-015-9490-8
Chang N. C., Rovira Q., Wells J., Feschotte C., Vaquerizas J. M. (2022). Zebrafish transposable elements show extensive diversification in age, genomic distribution, and developmental expression. Genome Res. 32, 1408–1423. doi: 10.1101/gr.275655.121
Chen S., Zhang G., Shao C., Huang Q., Liu G., Zhang P., et al. (2014). Whole-genome sequence of a flatfish provides insights into ZW sex chromosome evolution and adaptation to a benthic lifestyle. Nat. Genet. 46, 253–260. doi: 10.1038/ng.2890
Chuong E. B., Elde N. C., Feschotte C. (2017). Regulatory activities of transposable elements: from conflicts to benefits. Nat. Rev. Genet. 18, 71. doi: 10.1038/NRG.2016.139
Contreras-Galindo R., Kaplan M. H., He S., Contreras-Galindo A. C., Gonzalez-Hernandez M. J., Kappes F., et al. (2013). HIV infection reveals widespread expansion of novel centromeric human endogenous retroviruses. Genome Res. 23, 1505–1513. doi: 10.1101/GR.144303.112
Cross I., Merlo A., Manchado M., Infante C., Cañavate J. P., Rebordinos L. (2006). Cytogenetic characterization of the sole Solea senegalensis (Teleostei: Pleuronectiformes: Soleidae): Ag-NOR, (GATA)n, (TTAGGG)n and ribosomal genes by one-color and two-color FISH. Genetica 183, 253–259. doi: 10.1007/s10709-005-5928-9
Cross I., Garcia E., Rodriguez M. E., Arias-Perez A., Portela-Bens S., Merlo M. A., et al. (2020). The genomic structure of the highlyconserved dmrt1 gene in Solea Senegalensis (Kaup 1868) shows an unexpected intragenic duplication. PloS One 15 (15), e0241518. doi: 10.1371/journal.pone.0241518
de la Herrán R., Hermida M., Rubiolo J. A., Gómez-Garrido J., Cruz F., Robles F., et al. (2023). A chromosome-level genome assembly enables the identification of the follicule stimulating hormone receptor as the master sex-determining gene in the flatfish Solea Senegalensis. Mol. Ecol. Resour 23, 886–904. doi: 10.1111/1755-0998.13750
Dias G. B., Svartman M., Delprat A., Ruiz A., Kuhn G. C. S. (2014). Tetris is a foldback transposon that provided the building blocks for an emerging satellite DNA of Drosophila virilis. Genome Biol. Evol. 6, 1302–1313. doi: 10.1093/GBE/EVU108
Díaz-Ferguson E., Cross I., Barrios M., Pino A., Castro J., Bouza C., et al. (2012). Caracterización genética mediante microsatélites de Solea Senegalensis (Soleidae, Pleuronectiformes) en poblaciones naturales de la costa atlántica del suroeste de la península ibérica. Cienc. Mar. 38, 129–142. doi: 10.7773/cm.v38i1A.1824
Díaz-Ferguson E., Cross I., Barrios M. D. M., Rebordenos L., Diaz-Ferguson E., Cross I., et al. (2007). Genetic Relationships among Populations of the Senegalese Sole Solea Senegalensis in the Southwestern Iberian Peninsula Detected by Mitochondrial DNA–Restriction Fragment Length Polymorphisms. Trans. Am. Fish. Soc 136, 484–491. doi: 10.1577/T06-030.1
Dotto B. R., Carvalho E. L., Silva A. F., Duarte Silva L. F., Pinto P. M., Ortiz M. F., et al. (2015). HTT-DB: Horizontally transferred transposable elements database. Bioinformatics 31, 2915–2917. doi: 10.1093/BIOINFORMATICS/BTV281
Feschotte C., Pritham E. J. (2007). DNA transposons and the evolution of eukaryotic genomes. Annual Rev. Genet 41, 331–368. doi: 10.1146/ANNUREV.GENET.40.110405.090448
Flynn J. M., Hubley R., Goubert C., Rosen J., Clark A. G., Feschotte C., et al. (2020). RepeatModeler2 for automated genomic discovery of transposable element families. Proc. Natl. Acad. Sci. U. S. A. 117, 9451–9457. doi: 10.1073/pnas.1921046117
Frost L. S., Leplae R., Summers A. O., Toussaint A. (2005). Mobile genetic elements: the agents of open source evolution. Nat. Rev. Microbiol. 3, 722–732. doi: 10.1038/nrmicro1235
Gao B., Shen D., Xue S., Chen C., Cui H., Song C. (2016). The contribution of transposable elements to size variations between four teleost genomes. Mob. DNA 7, 4. doi: 10.1186/s13100-016-0059-7
García E., Cross I., Portela-Bens S., Rodríguez M. E., García-Angulo A., Molina B., et al. (2019). Integrative genetic map of repetitive DNA in the sole Solea Senegalensis genome shows a Rex transposon located in a proto-sex chromosome. Sci. Rep. 9, 17146. doi: 10.1038/s41598-019-53673-6
García-Angulo A., Merlo M. A., Portela-Bens S., Rodríguez M. E., García E., Al-Rikabi A., et al. (2018). Evidence for a Robertsonian fusion in Solea Senegalensis (Kaup 1858) revealed by zoo-FISH and comparative genome analysis. BMC Genomics 19, 818. doi: 10.1186/s12864-018-5216-6
Gel B., Serra E. (2017). karyoploteR: an R/Bioconductor package to plot customizable genomes displaying arbitrary data. Bioinformatics 33, 3088. doi: 10.1093/BIOINFORMATICS/BTX346
Gent J. I., Wang N., Dawe R. K. (2017). Stable centromere positioning in diverse sequence contexts of complex and satellite centromeres of maize and wild relatives. Genome Biol. 18, 121. doi: 10.1186/S13059-017-1249-4
Gilbert C., Cordaux R. (2017). Viruses as vectors of horizontal transfer of genetic material in eukaryotes. Curr. Opin. Virol. 25, 16–22. doi: 10.1016/J.COVIRO.2017.06.005
Gilbert C., Feschotte C. (2018). Horizontal acquisition of transposable elements and viral sequences: patterns and consequences. Curr. Opin. Genet. Dev. 49, 15. doi: 10.1016/J.GDE.2018.02.007
Goerner-Potvin P., Bourque G. (2018). Computational tools to unmask transposable elements. Nat. Rev. Genet. 19, 688–704. doi: 10.1038/s41576-018-0050-x
Goujon M., McWilliam H., Li W., Valentin F., Squizzato S., Paern J., et al. (2010). A new bioinformatics analysis tools framework at EMBL–EBI. Nucleic Acids Res. 38, W695–W699. doi: 10.1093/NAR/GKQ313
Grabundzija I., Messing S. A., Thomas J., Cosby R. L., Bilic I., Miskey C., et al. (2016). A Helitron transposon reconstructed from bats reveals a novel mechanism of genome shuffling in eukaryotes. Nat. Commun. 7, 10716. doi: 10.1038/ncomms10716
Guerrero-Cózar I., Gomez-Garrido J., Berbel C., Martinez-Blanch J. F., Alioto T., Claros M. G., et al. (2021). Chromosome anchoring in Senegalese sole (Solea Senegalensis) reveals sex-associated markers and genome rearrangements in flatfish. Sci. Rep. 11, 13460. doi: 10.1038/S41598-021-92601-5
Han M. J., Shen Y. H., Xu M. S., Liang H. Y., Zhang H. H., Zhang Z. (2013). Identification and evolution of the silkworm helitrons and their contribution to transcripts. DNA Res. Int. J. Rapid Publ. Rep. Genes Genomes 20, 471. doi: 10.1093/DNARES/DST024
Hartl D. L., Lohe A. R., Lozovskaya E. R. (1997). MODERN THOUGHTS ON AN ANCYENT MARINERE: function, evolution, regulation. Annu. Rev. Genet. 31, 337–358. doi: 10.1146/annurev.genet.31.1.337
Hua-Van A., Le Rouzic A., Maisonhaute C., Capy P. (2005). Abundance, distribution and dynamics of retrotransposable elements and transposons: similarities and differences. Cytogenet. Genome Res. 110, 426–440. doi: 10.1159/000084975
Imsland A. K., Foss A., Conceição L. E. C., Dinis M. T., Delbare D., Schram E., et al. (2004). A review of the culture potential of Solea solea and S. Senegalensis. Rev. Fish Biol. Fish. 13, 379–407. doi: 10.1007/S11160-004-1632-6/METRICS
Ivancevic A. M., Kortschak R. D., Bertozzi T., Adelson D. L. (2018). Horizontal transfer of BovB and L1 retrotransposons in eukaryotes. Genome Biol. 19, 1–13. doi: 10.1186/s13059-018-1456-7
Jachowicz J. W., Bing X., Pontabry J., Bošković A., Rando O. J., Torres-Padilla M. E. (2017). LINE-1 activation after fertilization regulates global chromatin accessibility in the early mouse embryo. Nat. Genet. 49, 1502–1510. doi: 10.1038/ng.3945
Jin W., Melo J. R., Nagaki K., Talbert P. B., Henikoff S., Dawe R. K., et al. (2004). Maize centromeres: Organization and functional adaptation in the genetic background of oat. Plant Cell 16, 571–581. doi: 10.1105/TPC.018937
Kapitonov V. V., Jurka J. (2001). Rolling-circle transposons in eukaryotes. Proc. Natl. Acad. Sci. U. S. A. 98, 8714–8719. doi: 10.1073/pnas.151269298
Kapusta A., Suh A., Feschotte C. (2017). Dynamics of genome size evolution in birds and mammals. Proc. Natl. Acad. Sci. U. S. A. 114, E1460–E1469. doi: 10.1073/PNAS.1616702114/SUPPL_FILE/PNAS.1616702114.SD05.XLSX
Kasinathan S., Henikoff S. (2018). Non-B-form DNA is enriched at centromeres. Mol. Biol. Evol. 35, 949–962. doi: 10.1093/MOLBEV/MSY010
Katoh K., Rozewicki J., Yamada K. D. (2019). MAFFT online service: multiple sequence alignment, interactive sequence choice and visualization. Brief. Bioinform. 20, 1160–1166. doi: 10.1093/BIB/BBX108
Khan S. A. (2005). Plasmid rolling-circle replication: highlights of two decades of research. Plasmid 53, 126–136. doi: 10.1016/J.PLASMID.2004.12.008
Kidwell M. G., Lisch D. R. (2001). Perspective: transposable elements, parasitic DNA, and genome evolution. Evolution 55, 1–24. doi: 10.1111/J.0014-3820.2001.TB01268.X
Kimura M. (1980). A simple method for estimating evolutionary rates of base substitutions through comparative studies of nucleotide sequences. J. Mol. Evol. 16, 111–120. doi: 10.1007/BF01731581
Klein S. J., O’neill R. J., Klein S. J., O’neill R. J. (2018). Transposable elements: genome innovation, chromosome diversity, and centromere conflict. Chromosom. Res. 26, 5–23. doi: 10.1007/S10577-017-9569-5
Kosek D., Grabundzija I., Lei H., Bilic I., Wang H., Jin Y., et al. (2021). The large bat Helitron DNA transposase forms a compact monomeric assembly that buries and protects its covalently bound 5′-transposon end. Mol. Cell 81, 4271. doi: 10.1016/J.MOLCEL.2021.07.028
Kretschmer R., Goes C. A. G., Bertollo L. A. C., Ezaz T., Porto-Foresti F., Toma G. A., et al. (2022). Satellitome analysis illuminates the evolution of ZW sex chromosomes of Triportheidae fishes (Teleostei: Characiformes). Chromosoma 131, 29–45. doi: 10.1007/s00412-022-00768-1
Krumsiek J., Arnold R., Rattei T. (2007). Gepard: a rapid and sensitive tool for creating dotplots on genome scale. Bioinformatics 23, 1026–1028. doi: 10.1093/BIOINFORMATICS/BTM039
Krzywinski M., Schein J., Birol I., Connors J., Gascoyne R., Horsman D., et al. (2009). Circos: An information aesthetic for comparative genomics. Genome Res. 19, 1639–1645. doi: 10.1101/GR.092759.109
Kumar S., Stecher G., Li M., Knyaz C., Tamura K. (2018). MEGA X: molecular evolutionary genetics analysis across computing platforms. Mol. Biol. Evol. 35, 1547–1549. doi: 10.1093/MOLBEV/MSY096
Kvikstad E. M., Makova K. D. (2010). The (r)evolution of SINE versus LINE distributions in primate genomes: Sex chromosomes are important. Genome Res. 20, 600–613. doi: 10.1101/GR.099044.109
Lai J., Li Y., Messing J., Dooner H. K. (2005). Gene movement by Helitron transposons contributes to the haplotype variability of maize. Proc. Natl. Acad. Sci. U. S. A. 102, 9068–9073. doi: 10.1073/PNAS.0502923102
Langdon T., Seago C., Mende M., Leggett M., Thomas H., Forster J. W., et al. (2000). Retrotransposon evolution in diverse plant genomes. Genetics 156, 313–325. doi: 10.1093/GENETICS/156.1.313
Leonardo T. E., Nuzhdin S. V. (2002). Intracellular battlegrounds: conflict and cooperation between transposable elements. Genet. Res. 80, 155–161. doi: 10.1017/S0016672302009710
Levin H. L., Moran J. V. (2011). Dynamic interactions between transposable elements and their hosts. Nat. Rev. Genet. 12, 615–627. doi: 10.1038/nrg3030
Long M., Betrán E., Thornton K., Wang W. (2003). The origin of new genes: Glimpses from the young and old. Nat. Rev. Genet. 4, 865–875. doi: 10.1038/NRG1204
Lorenz R., Bernhart S. H., Höner zu Siederdissen C., Tafer H., Flamm C., Stadler P. F., et al. (2011). ViennaRNA package 2.0. Algorithms Mol. Biol. 6, 26. doi: 10.1186/1748-7188-6-26
Loreto E. L. S., Carareto C. M. A., Capy P. (2008). Revisiting horizontal transfer of transposable elements in Drosophila. Hered. 100, 545–554. doi: 10.1038/sj.hdy.6801094
Lowe T. M., Eddy S. R. (1997). tRNAscan-SE: a program for improved detection of transfer RNA genes in genomic sequence. Nucleic Acids Res. 25, 955. doi: 10.1093/NAR/25.5.955
Lü Z., Gong L., Ren Y., Chen Y., Wang Z., Liu L., et al. (2021). Large-scale sequencing of flatfish genomes provides insights into the polyphyletic origin of their specialized body plan. Nat. Genet. 53, 742–751. doi: 10.1038/s41588-021-00836-9
Makalowski W. (2000). Genomic scrap yard: how genomes utilize all that junk. Gene 259, 61–67. doi: 10.1016/S0378-1119(00)00436-4
Mendizábal-Castillero M., Merlo M. A., Cross I., Rodríguez M. E., Rebordinos L. (2022). Genomic Characterization of hox Genes in Senegalese Sole (Solea Senegalensis, Kaup 1858): Clues to Evolutionary Path in Pleuronectiformes. Animals 12, 3586. doi: 10.3390/ANI12243586/S1
Merlo M. A., Cross I., Palazón J. L., Úbeda-Manzanaro M., Sarasquete C., Rebordinos L. (2012). Evidence for 5S rDNA Horizontal Transfer in the toadfish Halobatrachus didactylus (Schneider 1801) based on the analysis of three multigene families. BMC Evol. Biol. 12, 201. doi: 10.1186/1471-2148-12-201
Merlo M. A., Portela-Bens S., Rodriguez M. E., Garda-Angulo A., Cross I., Arias-Perez A., et al. (2021). A comprehensive integrated genetic map of the complete karyotype of Solea Senegalensis (Kaup 1858). Genes (Basel). 12, 1–12. doi: 10.3390/genes12010049
Mroczek R. J., Dawe R. K. (2003). Distribution of retroelements in centromeres and neocentromeres of maize. Genetics 165, 809. doi: 10.1093/GENETICS/165.2.809
Nagaki K., Song J., Stupar R. M., Parokonny A. S., Yuan Q., Ouyang S., et al. (2003). Molecular and cytological analyses of large tracks of centromeric DNA reveal the structure and evolutionary dynamics of maize centromeres. Genetics 163, 759–770. doi: 10.1093/GENETICS/163.2.759
Novak P., Neumann P., Macas J. (2010). Graph-based clustering and characterization of repetitive sequences in next-generation sequencing data. BMC Bioinf. 11, 378. doi: 10.1186/1471-2105-11-378
Novák P., Neumann P., Macas J. (2020). Global analysis of repetitive DNA from unassembled sequence reads using RepeatExplorer2. Nat. Protoc. 15, 3745–3776. doi: 10.1038/S41596-020-0400-Y
Paradis E., Schliep K. (2019). ape 5.0: an environment for modern phylogenetics and evolutionary analyses in R. Bioinformatics 35, 526–528. doi: 10.1093/BIOINFORMATICS/BTY633
Peñaloza C., Gutierrez A. P., Eöry L., Wang S., Guo X., Archibald A. L., et al. (2021). A chromosome-level genome assembly for the Pacific oyster Crassostrea gigas. Gigascience 10, 1–9. doi: 10.1093/GIGASCIENCE/GIAB020
Platt R. N., Vandewege M. W., Ray D. A. (2018). Mammalian transposable elements and their impacts on genome evolution. Chromosom. Res. 26, 25–43. doi: 10.1007/S10577-017-9570-Z
Poulter R. T. M., Goodwin T. J. D., Butler M. I. (2003). Vertebrate helentrons and other novel Helitrons. Gene 313, 201–212. doi: 10.1016/S0378-1119(03)00679-6
Price M. N., Dehal P. S., Arkin A. P. (2010). FastTree 2 – approximately maximum-likelihood trees for large alignments. PloS One 5, e9490. doi: 10.1371/JOURNAL.PONE.0009490
Price A. L., Jones N. C., Pevzner P. A. (2005). De novo identification of repeat families in large genomes. Bioinformatics 21, i351–i358. doi: 10.1093/BIOINFORMATICS/BTI1018
Pritham E. J., Feschotte C. (2007). Massive amplification of rolling-circle transposons in the lineage of the bat Myotis lucifugus. Proc. Natl. Acad. Sci. U. S. A. 104, 1895–1900. doi: 10.1073/PNAS.0609601104
Putnam N. H., Srivastava M., Hellsten U., Dirks B., Chapman J., Salamov A., et al. (2007). Sea anemone genome reveals ancestral eumetazoan gene repertoire and genomic organization. Science 317, 86–94. doi: 10.1126/SCIENCE.1139158
Ramírez D., Rodríguez M. E., Cross I., Arias-Pérez A., Merlo M. A., Anaya M., et al. (2022). Integration of maps enables a cytogenomics analysis of the complete karyotype in solea Senegalensis. Int. J. Mol. Sci. 23 (10), 5353. doi: 10.3390/ijms23105353
Raskina O., Barber J. C., Nevo E., Belyayev A. (2008). Repetitive DNA and chromosomal rearrangements: speciation-related events in plant genomes. Cytogenet. Genome Res. 120, 351–357. doi: 10.1159/000121084
Robledo D., Hermida M., Rubiolo J. A., Fernandez C., Blanco A., Bouza C., et al. (2017). Integrating genomic resources of flatfish (Pleuronectiformes) to boost aquaculture production. Comp. Biochem. Physiol. Part D. Genomics Proteomics 21, 41–55. doi: 10.1016/j.cbd.2016.12.001
Robles F., de la Herrán R., Navajas-Pérez R., Cano-Roldán B., Sola-Campoy P. J., García-Zea J. A., et al. (2017). Centromeric satellite DNA in flatfish (Order Pleuronectiformes) and its relation to speciation processes. J. Hered. 108, 217–222. doi: 10.1093/jhered/esw076
Rodríguez M. E., Cross I., Arias-Pérez A., Portela-Bens S., Merlo M. A., Liehr T., et al. (2021). Cytogenomics unveil possible transposable elements driving rearrangements in chromosomes 2 and 4 of Solea Senegalensis. Int. J. Mol. Sci. 22, 1–17. doi: 10.3390/ijms22041614
Rodríguez M. E., Molina B., Merlo M. A., Arias-Pérez A., Portela-Bens S., García-Angulo A., et al. (2019). Evolution of the proto sex-chromosome in Solea Senegalensis. Int. J. Mol. Sci. 20 (20), 5111. doi: 10.3390/ijms20205111
Ruiz-Masó J. A., MachóN C., Bordanaba-Ruiseco L., Espinosa M., Coll M., Del Solar G. (2015). Plasmid rolling-circle replication. Microbiol. Spectr. 3, PLAS-0035-2014. doi: 10.1128/MICROBIOLSPEC.PLAS-0035-2014
Ruiz-Ruano F. J., López-León M. D., Cabrero J., Camacho J. P. M. (2016). High-throughput analysis of the satellitome illuminates satellite DNA evolution. Sci. Rep. 6, 28333. doi: 10.1038/srep28333
Schaack S., Gilbert C., Feschotte C. (2010). Promiscuous DNA: Horizontal transfer of transposable elements and why it matters for eukaryotic evolution. Trends Ecol. Evol. 25, 537–546. doi: 10.1016/j.tree.2010.06.001
Schnable P. S., Ware D., Fulton R. S., Stein J. C., Wei F., Pasternak S., et al. (2009). The B73 maize genome: Complexity, diversity, and dynamics. Sci. (80-. ). 326, 1112–1115. doi: 10.1126/SCIENCE.1178534/SUPPL_FILE/SCHNABLE.SOM.PDF
Shao F., Han M., Peng Z. (2019). Evolution and diversity of transposable elements in fish genomes. Sci. Rep. 9, 1–8. doi: 10.1038/s41598-019-51888-1
Small C. M., Healey H. M., Currey M. C., Beck E. A., Catchen J., Lin A. S. P., et al. (2022). Leafy and weedy seadragon genomes connect genic and repetitive DNA features to the extravagant biology of syngnathid fishes. Proc. Natl. Acad. Sci. U. S. A. 119, e2119602119. doi: 10.1073/PNAS.2119602119/SUPPL_FILE/PNAS.2119602119.SD05.XLSX
Smit A., Hubley R. (2015) RepeatModeler open-1.0. Available online at: www.repeatmasker.org.
Smit A. F. A., Hubley R., Green P. (2015) RepeatMasker open-4.0. Available online at: http://www.repeatmasker.org.
Sotero-Caio C. G., Platt R. N., Suh A., Ray D. A. (2017). Evolution and diversity of transposable elements in vertebrate genomes. Genome Biol. Evol. 9, 161–177. doi: 10.1093/gbe/evw264
Storer J., Hubley R., Rosen J., Wheeler T. J., Smit A. F. (2021). The Dfam community resource of transposable element families, sequence models, and genome annotations. Mob. DNA 12, 1–14. doi: 10.1186/S13100-020-00230-Y/FIGURES/8
Sultana T., Zamborlini A., Cristofari G., Lesage P. (2017). Integration site selection by retroviruses and transposable elements in eukaryotes. Nat. Rev. Genet. 18, 292–308. doi: 10.1038/nrg.2017.7
Thomas J., Phillips C. D., Baker R. J., Pritham E. J. (2014). Rolling-circle transposons catalyze genomic innovation in a mammalian lineage. Genome Biol. Evol. 6, 2595–2610. doi: 10.1093/GBE/EVU204
Thomas J., Pritham E. J. (2015). In Mobile DNA III (eds Craig N. L., Chandler M., Gellert M., Lambowitz A. M., Rice P. A., Sandmeyer S. B., 40, 891–924. doi: 10.1128/9781555819217.ch40
Thomas J., Schaack S., Pritham E. J. (2010). Pervasive horizontal transfer of rolling-circle transposons among animals. Genome Biol. Evol. 2, 656–664. doi: 10.1093/gbe/evq050
Vega L., Díaz E., Cross I., Rebordinos L. (2002). Caracterizaciones citogenética e isoenzimática del lenguado Solea senegalensis Kaup, 1858. Bol. Inst. Esp. Oceanogr. 18, 245–250.
Venner S., Feschotte C., Biémont C. (2009). In Mobile DNA III “(Eds Craig N.L., Chandler M., Gellert M., Lambowitz A.M., Rice P.A., Sandmeyer S.B., et al)”, Chapter 40, 891–924. doi: 10.1016/J.TIG.2009.05.003
Voorrips R. E. (2002). MapChart: software for the graphical presentation of linkage maps and QTLs. J. Hered. 93, 77–78. doi: 10.1093/JHERED/93.1.77
Wang X., Qu M., Liu Y., Schneider R. F., Song Y., Chen Z., et al. (2022a). Genomic basis of evolutionary adaptation in a warm-blooded fish. Innov. 3, 100185. doi: 10.1016/J.XINN.2021.100185
Wang Z., Zhao G., Yang Q., Gao L., Liu C., Ru Z., et al. (2022b). Helitron and CACTA DNA transposons actively reshape the common wheat - AK58 genome. Genomics 114, 110288. doi: 10.1016/J.YGENO.2022.110288
Wei J., Zhang J., Lu Q., Ren P., Guo X., Wang J., et al. (2020). Genomic basis of environmental adaptation in the leathery sea squirt (Styela clava). Mol. Ecol. Resour. 20, 1414–1431. doi: 10.1111/1755-0998.13209
Wellenreuther M., Bernatchez L. (2018). Eco-evolutionary genomics of chromosomal inversions. Trends Ecol. Evol. 33, 427–440. doi: 10.1016/J.TREE.2018.04.002
Wells J. N., Chang N. C., McCormick J., Coleman C., Ramos N., Jin B., et al. (2023). Transposable elements drive the evolution of metazoan zinc finger genes. Genome Res. 33, 1325–1339. doi: 10.1101/GR.277966.123
Wells J. N., Feschotte C. (2020). A field guide to eukaryotic transposable elements. Annu. Rev. Genet. 54, 539. doi: 10.1146/ANNUREV-GENET-040620-022145
Wheeler T. J., Clements J., Eddy S. R., Hubley R., Jones T. A., Jurka J., et al. (2013). Dfam: a database of repetitive DNA based on profile hidden Markov models. Nucleic Acids Res. 41, D70. doi: 10.1093/NAR/GKS1265
Wicker T., Sabot F., Hua-Van A., Bennetzen J. L., Capy P., Chalhoub B., et al. (2007). A unified classification system for eukaryotic transposable elements. Nat. Rev. Genet. 8, 973–982. doi: 10.1038/NRG2165
Wong L. H., Choo K. H. A. (2004). Evolutionary dynamics of transposable elements at the centromere. Trends Genet. 20, 611–616. doi: 10.1016/J.TIG.2004.09.011
Xiong W., Dooner H. K., Du C. (2016). Rolling-circle amplification of centromeric Helitrons in plant genomes. Plant J. 88, 1038–1045. doi: 10.1111/TPJ.13314
Xiong W., He L., Lai J., Dooner H. K., Du C. (2014). HelitronScanner uncovers a large overlooked cache of Helitron transposons in many plant genomes. Proc. Natl. Acad. Sci. U. S. A. 111, 10263–10268. doi: 10.1073/PNAS.1410068111
Yang L., Bennetzen J. L. (2009a). Distribution, diversity, evolution, and survival of Helitrons in the maize genome. Proc. Natl. Acad. Sci. U. S. A. 106, 19922. doi: 10.1073/PNAS.0908008106
Yang L., Bennetzen J. L. (2009b). Structure-based discovery and description of plant and animal Helitrons. Proc. Natl. Acad. Sci. U. S. A. 106, 12832. doi: 10.1073/PNAS.0905563106
Yuan Z., Liu S., Zhou T., Tian C., Bao L., Dunham R., et al. (2018). Comparative genome analysis of 52 fish species suggests differential associations of repetitive elements with their living aquatic environments. BMC Genomics 19, 141. doi: 10.1186/S12864-018-4516-1
Zahn J., Kaplan M. H., Fischer S., Dai M., Meng F., Saha A. K., et al. (2015). Expansion of a novel endogenous retrovirus throughout the pericentromeres of modern humans. Genome Biol. 16, 1–24. doi: 10.1186/S13059-015-0641-1/TABLES/1
Zattera M. L., Bruschi D. P. (2022). Transposable elements as a source of novel repetitive DNA in the eukaryote genome. Cells 11 (21), 3373. doi: 10.3390/CELLS11213373
Zhang H. H., Peccoud J., Xu M. R. X., Zhang X. G., Gilbert C. (2020). Horizontal transfer and evolution of transposable elements in vertebrates. Nat. Commun. 11, 1–10. doi: 10.1038/s41467-020-15149-4
Keywords: Solea senegalensis, transposable elements, DNA satellite, repetitive sequences, evolution, centromeres, Pleuronectiformes, chromosomes
Citation: Cross I, Rodríguez ME, Portela-Bens S, Merlo MA, Gálvez-Salido A, Navajas-Pérez R and Rebordinos L (2024) The genomic study of repetitive elements in Solea senegalensis reveals multiple impacts of transposable elements in the evolution and architecture of Pleuronectiformes chromosomes. Front. Mar. Sci. 11:1359531. doi: 10.3389/fmars.2024.1359531
Received: 21 December 2023; Accepted: 08 February 2024;
Published: 28 February 2024.
Edited by:
Jin Sun, Ocean University of China, ChinaReviewed by:
Dianhang Jiang, Southern Marine Science and Engineering Guangdong Laboratory, ChinaYitian Bai, Ocean University of China, China
Copyright © 2024 Cross, Rodríguez, Portela-Bens, Merlo, Gálvez-Salido, Navajas-Pérez and Rebordinos. This is an open-access article distributed under the terms of the Creative Commons Attribution License (CC BY). The use, distribution or reproduction in other forums is permitted, provided the original author(s) and the copyright owner(s) are credited and that the original publication in this journal is cited, in accordance with accepted academic practice. No use, distribution or reproduction is permitted which does not comply with these terms.
*Correspondence: Laureana Rebordinos, bGF1cmVhbmEucmVib3JkaW5vc0B1Y2EuZXM=