- Nanjing University of Information Science and Technology, Nanjing, China
In the summer of 2022, like in many other regions of the world, an unprecedented period of continuous high-temperature weather occurred in eastern China. The degree and duration of this event far exceeded normal standards. Between 2020 and 2022, the tropical Pacific experienced the most significant three-year consecutive La Nina event recorded in recent decades. We investigate linkages between these events: the high-temperature response in eastern China and Asia under the background of such La Nina events. Development of summer La Nina events contributed to a high-temperature heat wave during the summer of 2022. Rapid development of these events in the third year exacerbated negative Indian Ocean Dipole phases because of energy accumulation from abnormal easterly winds. The combined effects of the negative Indian Ocean Dipole phase and La Nina provided background field support that strengthened the West Pacific Subtropical High (WPSH) and the Iranian High, leading to high terrestrial temperature anomalies. An empirical orthogonal function (EOF) analysis of the vertical velocity in the middle and low latitudes of the tropical Indian Ocean and the Asian continent reveals the first two empirical orthogonal function modes to be conducive to the strengthening of Walker circulation in 2022. These two main modes jointly reflect the rising movement of the equatorial East Indian Ocean and South China Sea in 2022, and the sinking movement to the west of the Tibet Plateau and eastern China, which was conducive to generating high temperatures in eastern China. Finally, the South Asian High was affected by the La Nina event that lasted for three years, showing a strong trend towards the north, thus making an important contribution to this high temperature.
1 Introduction
La Nina is a climate phenomenon that affects the Pacific and other global oceans. The evolution of La Nina events often exerts a significant impact on global weather and climate change, especially in regions surrounding the Pacific and Indian oceans. La Nina events usually last for two years, but they can persist for three, during which time their impact on global weather can increase. Consequently, understanding how La Nina cycles, especially longer-duration ones, affect temperature and weather throughout the Asia–Pacific region will improve climate predictions, and in doing so, by increasing preparedness, minimize any potential adverse effect of extreme climate events on affected humans.
Many studies have investigated El Niño–Southern Oscillation (ENSO) changes and high-temperature heatwaves. Combining theoretical analysis and buoy observation, McPhaden et al. (Hasan et al., 2022; McPhaden et al., 2023a; McPhaden et al., 2023b) reported potential processes of consecutive years of La Nina events, and reported a delayed effect of a preceding El Niño and anomalous warmth in the tropical Indian and Atlantic oceans to energize the La Niña, leading to a three-year event. Iwakiri (2020) reported data for three consecutive years of La Nina events in Japan, the first year of high temperatures, mainly in the southwest of the country from August to October, was because of abnormal southwest winds caused by lower precipitation in the equatorial Pacific; in the second year, temperatures during this time were higher mainly in northeastern parts of the country, this time caused by barotropic higher pressure caused by lower precipitation in the equatorial Pacific. Huang et al. (Timmermann et al., 2018; Huang et al., 2019; Xu et al., 2023) studied the impact of ENSO on the Western Pacific Subtropical High (WPSH) and reported changes to be mainly controlled by ENSO, with a cycle of 4 to 5 years. However, in recent years, El Nino and La Nina phenomena in the central Pacific have increased, leading to a significant dipole distribution in the Pacific and Indian oceans, creating uncertainty in change in WPSH, sea surface temperature (SST), and precipitation anomalies. A significant negative correlation was detected between Indian Ocean Dipole Mode index (DMI), Nino index, SST, and precipitation in the Indo-Pacific Warm Pool. Fan et al. (2022) investigated interactions between ENSO and meridional circulation and proposed that ENSO has a strong association with the Pacific meridional mode. When ENSO causes changes in thermal convection and SST distribution in the tropical Pacific, the meridional mode also changes via wind–evaporation–SST feedback. Hari et al. (2022) found that when precipitation and SST in the eastern Pacific were low, the strong east wind anomaly that was triggered caused the tropical Indian Ocean to generate a west wind anomaly towards the western Pacific that influenced the distribution of Hadley circulation and induced high temperatures in India. Mondal et al. (Sharma et al., 2022; Mondal et al., 2023) reported eastern China, the northwestern United States, and Australia to be new centers of higher temperature and drought, attributed to changes in ENSO events, closely related to meridional circulation and geopotential height field, which produced stronger subtropical high pressure triggering high summer temperatures, droughts, and fires. Kim and Lee (2022) investigated conditions that led to high temperatures in the Far East region of northeast Asia, Russia during La Nina events. These authors found that when a blocking high occurs in the upstream mid-high latitude circulation, and when the geopotential height field is enhanced, the probability of extreme high temperature weather was greater. He et al. (2023) reported that a summer high temperature anomaly on the eastern side of Qinghai-Tibet Plateau in 2022 may be related to a strong easterly jet over the plateau, which produced abnormal updraft on its western side and downdraft on its eastern side. Zhang et al. (2022), in an investigation of SST and precipitation anomalies in the equatorial eastern Pacific Ocean in response to El Nino events, found that when the El Nino decayed, areas with more precipitation appeared in the low-latitude eastern Pacific Ocean north of the equator, producing abnormal atmospheric circulation. The low latitude temperature on the west coast of North America falls, while the high latitude temperature increases. This phenomenon more-often occurs in the eastern than central type of El Nino. Li et al. (2022) predicted the distribution of typhoons, floods, and temperatures in the Indo-Pacific over three weeks based on ENSO-based predictions of MJO activities. McKinnon and Simpson (2022) investigated the intensity of heatwaves in the northwest Pacific under the 2021 La Nina background using statistical methods such as kurtosis and skewness. Meng and Gong (2022) investigated the impact of North Atlantic SST on high temperature and drought events in Eurasia for the following spring and summer. Tuel et al. (2022) investigated a heatwave in eastern Europe and flooding in western Europe during the summer of 2021 under the background of La Nina, and reported such events to be related to the blocking high pressure caused by abnormal circulation patterns and Rossby waves. Xue et al. (2022) investigated the impact of La Nina on regional climate including high temperature and precipitation by analyzing CMIP6 data; this strategy achieved good predictive results.
The Indian Ocean Dipole mode (IOD) of SST is an important variable influenced by La Nina activity. Xie et al. (2009) found that warming of the equatorial Indian Ocean may be related to a lag effect of El Nino and Kelvin waves. Many studies have investigated IOD and high-temperature heatwaves under the background of ENSO circulation. For example, after comparing the negative phase of IOD with and without a La Nina influence using climate models, Jeong et al. (Qiu et al., 2014; Bian et al., 2022; Toreti and Cammalleri, 2022; Jeong et al., 2023) reported the negative precipitation anomaly in southern China disappeared without the influence of La Nina. This indicates that high temperature and drought in China in 2022 were caused by the combined influence of La Nina and IOD negative phases, and that the non-stationary drought in eastern China caused by this external circulation will enhance high temperatures. Conversely, when a positive IOD event occurs, cyclones and southwest wind anomalies appear in the troposphere of southern China on and downstream of the Qinghai-Tibet Plateau, causing excessive precipitation in the eastern region of this plateau. Wei et al. (Sun et al., 2022; Wei et al., 2023) found that heatwave events in China experienced a transitional period from 1993 to 2000, followed by a sudden increase in intensity. When considering the southern region of the Yangtze River in China, the negative phase of IOD and a La Nina event are conducive to the occurrence of heatwave events. IOD and ENSO explain 62.35%–70.01% of this increase in heatwaves.
Over the past 20 years, the impact of La Nina events on heatwaves in the southern region of the Yangtze River has become increasingly severe, particularly during the early onset of IOD. Li et al. (2021) reported the negative phase of IOD to strengthen the southwest monsoon, thereby strengthening the upwelling near Sri Lanka and affecting temperature in southeastern India. Abhik et al. (Cai et al., 2012; Magee and Kiem, 2020; Abhik et al., 2023) studied the impact of positive IOD events on drought and heatwaves in Australia, and reported that an increase in positive IOD increased heatwave and drought events, but changes in negative IOD had little impact on heatwave events; they also summarized patterns of tropical cyclones, floods, drought and heatwave events affecting Australia through statistical analysis of IOD and ENSO data. Behera et al. (2006) explored relationships between IOD and ENSO, and found that without an ENSO influence, the IOD period typically lasted 2 years. However, ENSO activities can affect the IOD period and the intensity of Walker circulation related to IOD; 42% of changes in Walker circulation intensity caused by IOD are related to ENSO. These findings indicate that the complexity of IOD mainly stems from its regulation by ENSO; however, the IOD can also influence circulation via specific mechanisms. As one of the dominant sea-air coupling modes in the tropical Pacific and Indian oceans, exploring the connections between IOD and ENSO has practical significance for improving predictions of heatwaves in East Asia.
Although many studies have investigated the impact of La Niña and IOD on heatwaves in East Asia, many challenges related to exploring the mechanisms of their impact remain, especially in terms of exploring and predicting the mechanisms responsible for their joint impact on heatwaves in Asia. During the summer of 2022, many regions in East Asia and the Middle East experienced an unprecedented and prolonged abnormal heatwave (Figure 1). Previous climate predictions failed in 2022, this was a period in which La Niña events occurred for three consecutive years, many institutions failed to predict that East Asia would be so during the summer of 2022. Significant changes in La Nina and IOD events have occurred in recent years. However, these phenomena have not been successfully linked to Asian heatwaves. We use various statistical methods, and EOF decomposition and synthesis analysis to investigate how La Nina and IOD affected circulation and Asian heatwave events in 2022, and potentially, for predicting into the future.
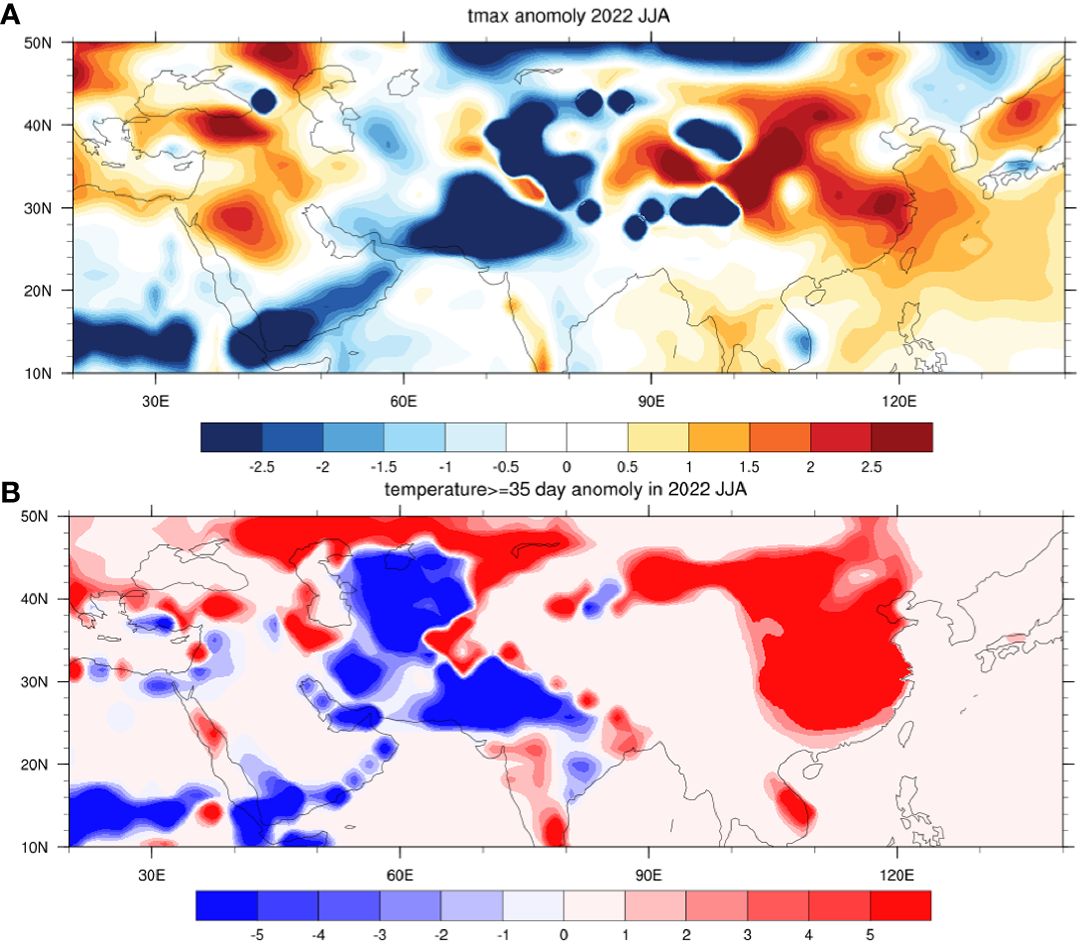
Figure 1 Asian high temperatures from June–August 2022: (A) the anomalous distribution of the highest temperature from June–August, and (B) the abnormal distribution of days when temperature was ≥ 35°C between June and August.
We aim to understand the distribution and formation mechanism of variable fields (e.g., meridional and vertical wind fields, altitude field) in La Niña years, especially when La Niña events occur for three consecutive years. We then clarify the response of negative phase IOD to La Niña, and the distribution and formation mechanism of its circulation field in the Indian Ocean region. We also explore the mechanism of negative IOD and La Niña on East Asian high temperatures, their relationship with Walker circulation, Iranian high pressure (a high pressure system with subtropical properties in the Middle East), and West Pacific subtropical high by EOF decomposition, synthesis and other analysis methods, and combine various mechanisms to identify that mechanism of East Asian high temperature weather in 2022 and similar circulation situations.
During the summer of 2022, many areas in Asia were hit by heatwaves (Figure 1). When comparing the extreme highest temperatures from June–August to the mean annual extreme highest temperature, the eastern China, and many regions in central and western Asia were significantly warmer (in some areas by more than 5°C). There was also a significant increase in the number of days when the temperature was ≥ 35°C in eastern China and Xinjiang, China, as well as many regions in central and western Asia, with many areas exceeding 5 days in duration.
There were three consecutive years of La Nina events between 2020 and 2022. Using China as an example, we investigate the impact of the interaction of various systems for three consecutive years of La Nina events on the abnormally high temperatures during the summer of 2022.
2 Data and methods
2.1 Data
By performing experimental comparisons, we found that the re-analysis of data better reflected the effects on both precise and long-term scales. This indicates that the National Centers for Environmental Prediction (NCEP) was best suited for historical reality. Therefore, we selected NCEP data relating to 2 m temperature from June–August 2022, long-term 2 m temperature, SST, 500 hPa height field, and meridional wind (v) and zonal wind (u), and vertical velocity (Omega) data since 1970, simulated by NCEP with a spatial resolution of approximately 1° × 1°, which we divided into 19 vertical layers. Additionally, data on 2 m temperature from June–August 2022 with a time resolution of 1 h, and other climatic data since 1970 with the time resolution of 1 month (Meng and Gong, 2022), were used to verify and analyze La Nina and IOD data to identify potential relationships with the 2022 heatwave in East Asia. NCEP data were acquired from https://psl.noaa.gov/data/gridded/data.ncep.reanalysis.html. Oceanic Niño Index (ONI) data was obtained from NOAA CPC (Rasmusson and Carpenter, 1982), origin.cpc.ncep.noaa.gov/products/analysis_monitoring/ensostuff/ONI_v5.php, and it is calculated by taking the three-month moving average of SST in the Nino3.4 area.
2.2 Research region
When we focus on a specific tropical region, we use a method that averages 5°S/5°N to reflect the spatial distribution of physical fields on the equator.
2.3 Methods
Based on the Oceanic Niño Index (ONI), we identified the consecutive years of La Nina events (1973–1975, 1983–1985, 1998–2000, and 2020–2022) and ordinary La Nina events (1970–1971, 1988–1989, 1995–1996, 2005–2006, 2007–2008, 2010–2011 and 2017–2018). We then calculated the development characteristics of SST and zonal wind fields in the Pacific and Indian oceans during La Niña events, and vertical wind fields in the Indian Ocean during La Nina events, using synthetic and EOF analysis. The West Pacific Subtropical High (WPSH)–Iranian High joint index (h) was defined and calculated and compared with the DMI index and heatwaves that occurred in relevant regions of East Asia. The circulation for three consecutive years of La Nina was regressed, followed by an analysis and summary of the causes of summer heatwaves in East Asia under the La Nina event in 2022, and then across three consecutive La Nina years.
Our research is based on EOF, synthetic, and correlation analyses, to examine the response of atmospheric circulation in the tropical and subtropical region of Asia to La Niña events, especially the combined effects of continuous La Niña events for more than three years, and for negative IOD phases. The main scope and occurrence of the Iranian High, WPSH, and the downdraft area in the subtropical region were determined by analyzing the distribution range and main formation mechanisms of East Asia summer heatwaves; this strategy was associated with high levels of practical significance.
We define DMI as the difference in average SST anomalies between the tropical Western Indian Ocean (50–70°E, 10°S to 10°N) and the equatorial Southeast Indian Ocean (90–110°E, 10°S to 0°).
We calculate h as follows:
In this formula, represents the 500 hPa height anomaly from May–August from 40–60°E, 25–35°N, while represents the 500 hPa height anomaly from May–August at 110–130°E, 25–35°N.
3 Results
3.1 The impact of three years of continuous La Nina events on tropical ocean wind fields and sea surface temperature
We analyzed wind fields over the Pacific Ocean (Figures 2A–D) during the three consecutive years of La Nina events (1973–1975, 1983–1985, 1998–2000, 2020–2022) and anomalies in oceanic continental wind fields (Figure 2E). With the exception of 1983–1985, we found that the east wind anomaly over the tropical Pacific gradually increased over time, and was strongest during the third year of La Nina events. This strong east wind anomaly may have carried the energy needed to transmit the abnormal signal to the East Indies Ocean via the oceanic continent, thus increasing the temperature of the warm water in the equatorial East Indian Ocean; this would be conducive to generation of a negative IOD phase. The abnormality in the 1983-1985 period is because for there were several months when the ONI index did not reach −0.5, reducing impact, despite the ONI index being negative throughout the period. In the summer of the third year, the center of the east wind anomaly in the western Pacific can also be seen, and it was closer to the three consecutive years of La Nina events compared to ordinary La Nina events.
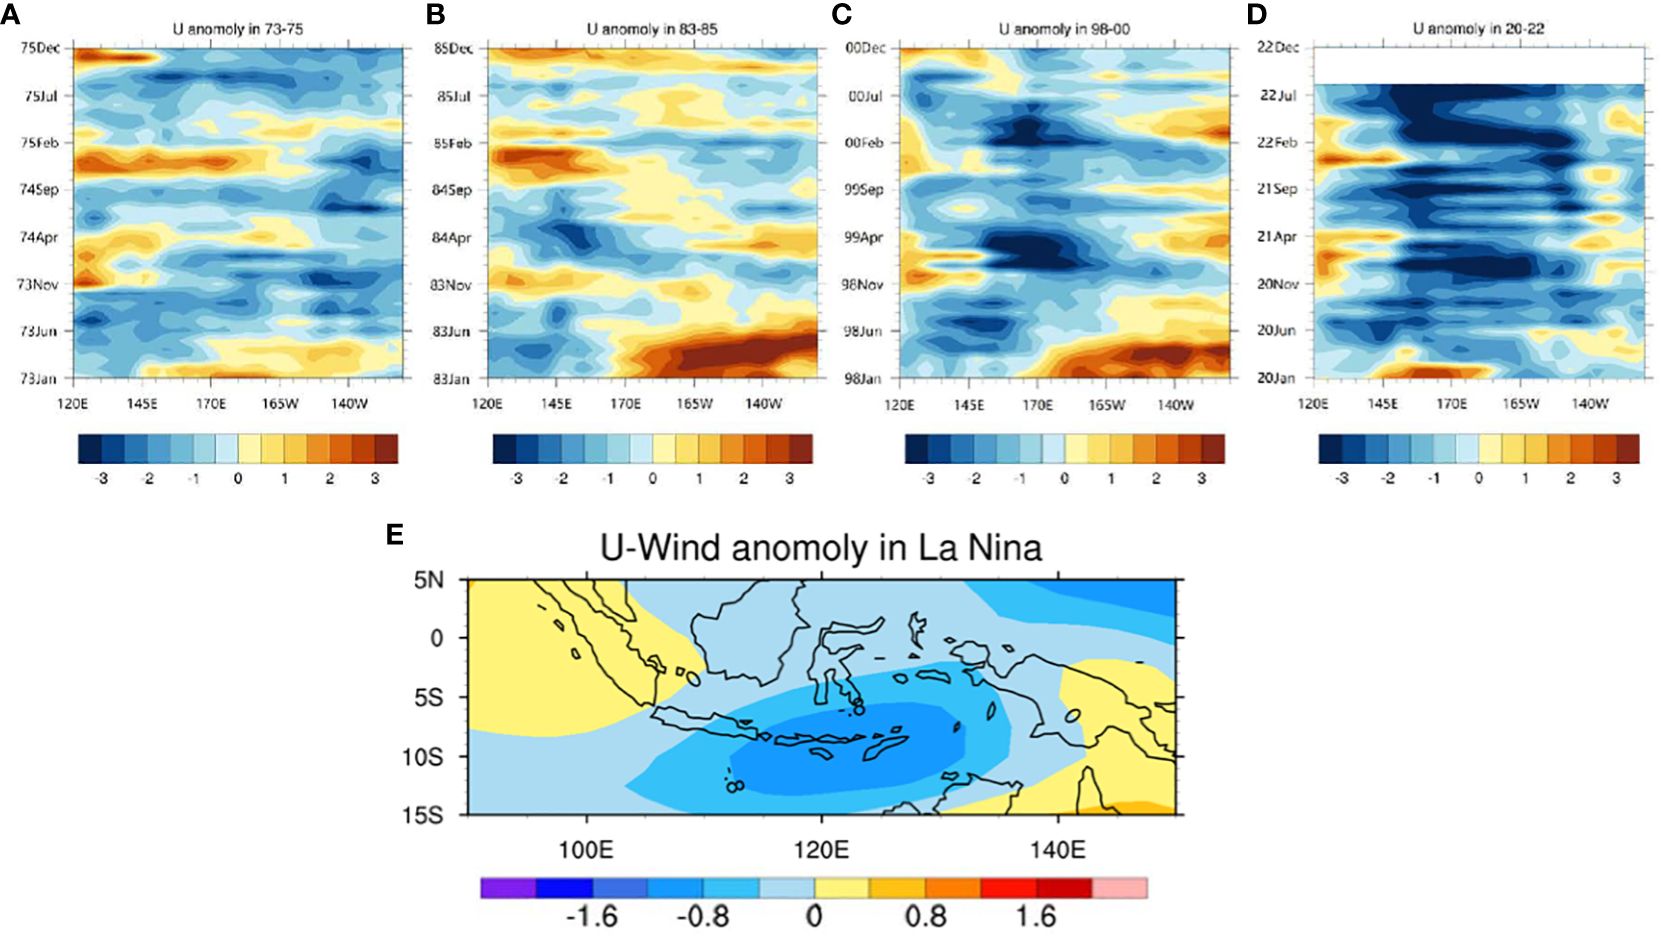
Figure 2 Three consecutive years of U-wind anomalies in the tropical Pacific and oceanic continents under La Nina events: (A) longitudinal-time plot of U-wind anomalies in the Pacific from 1973–1975; (B–D) U-wind anomalies from 1983–1985, 1998–2000, and 2020–2022, along with composite analysis of U-wind in oceanic continents under La Nina (E) events. All U-wind anomalies in (A-D) represent average variation in the 5°N to 5°S U-wind.
Because the impact caused by La Nina and IOD propagates from one region to a larger area through teleconnection, this requires a more detailed analysis of the distribution of variables in space.
In the tropical Pacific, ordinary La Nina years were generally associated with a significantly lower SST in the eastern Pacific and a significantly higher SST in the western Pacific (Figure 3). However, in 2022, the lower SST in the eastern Pacific did not differ significantly from other years, while the lower SST in the central Pacific did differ significantly. This indicates that the central Pacific type of La Nina may have a greater impact on energy transfer of east wind anomalies to the Indian Ocean and land temperatures. Over recent years, the probability of La Nina events with lower SST in the Central Pacific has increased (Wei and Ren, 2022), making the easterly anomalies triggered by continuous La Nina events more pronounced, leading to an increased probability of summer heatwaves in East Asia. The 2 m temperatures near 30°N in the control area of Iran High and the area of East China under the control of the West North Pacific Subtropical High (WNPSH) were slightly higher under the average state of La Nina, while under the influence of La Nina for three consecutive years in 2022, these temperatures were significantly higher (to more than 1°C).
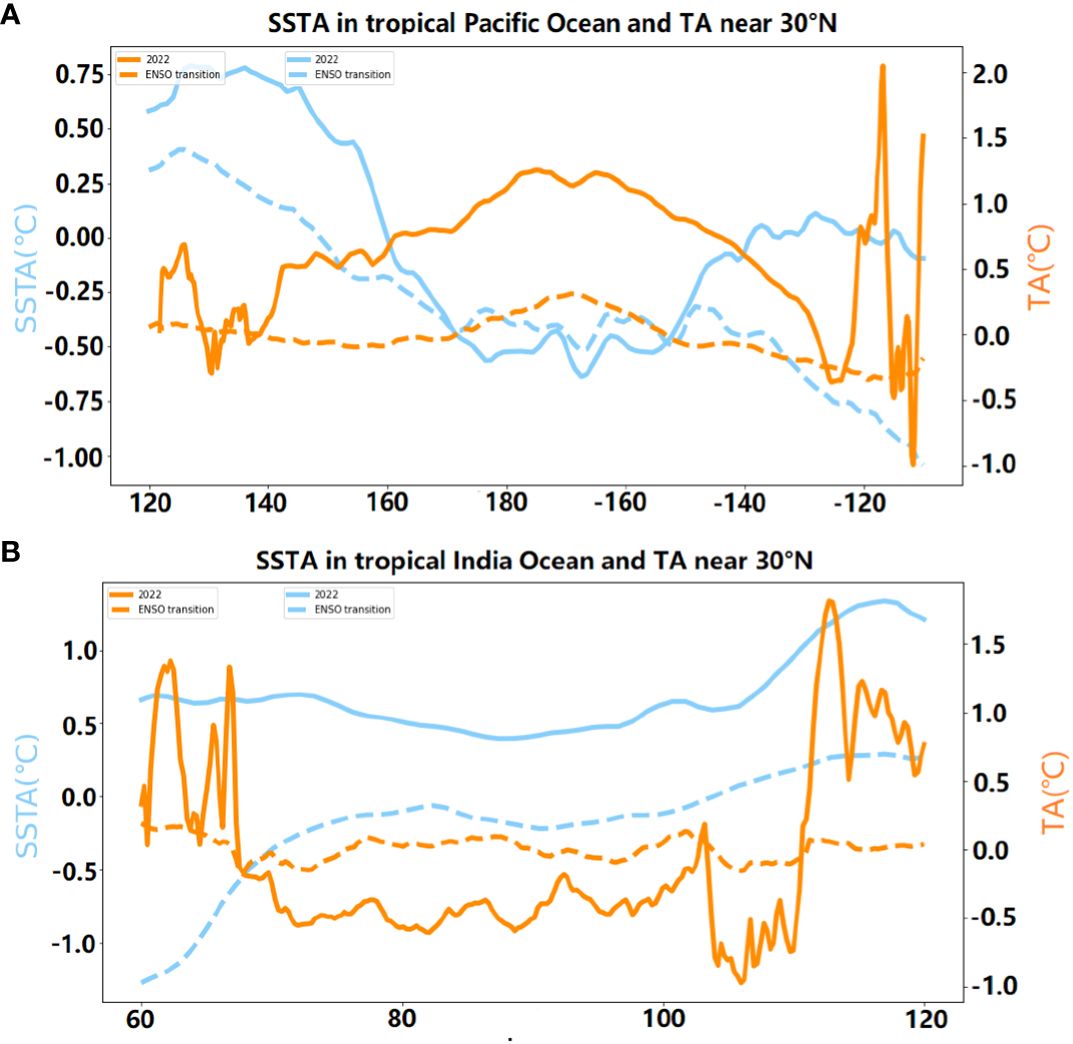
Figure 3 Temperature anomalies near 30°N and SST anomalies in the: (A) 120°E to 120°W region of the Pacific Ocean; and (B) 60–120°E region of the Indian Ocean during summer of ordinary La Nina years and summer of 2022. Lines: blue solid, SST anomaly in 2022; blue dashed, SST anomaly in ordinary La Nina years; orange solid, 2 m temperature anomaly near 30°N (25–35°N average) in 2022; orange dashed, 2 m temperature anomaly during ordinary La Nina years. All indices use June–August averages.
During La Nina events that persisted for three years, the U-wind over the tropical Pacific had a larger area and a longer duration in the summer of the third year, and the east wind anomaly was strongest in the third year. In the Nino3.4 area, from the winter of La Nina in the first year to the winter of La Nina in the third year, east wind anomalies changed in the same direction as the Nino3.4 area. At that time, there was a significant sustained east wind anomaly and a negative SST anomaly in the Nino3.4 area (Figure 4).
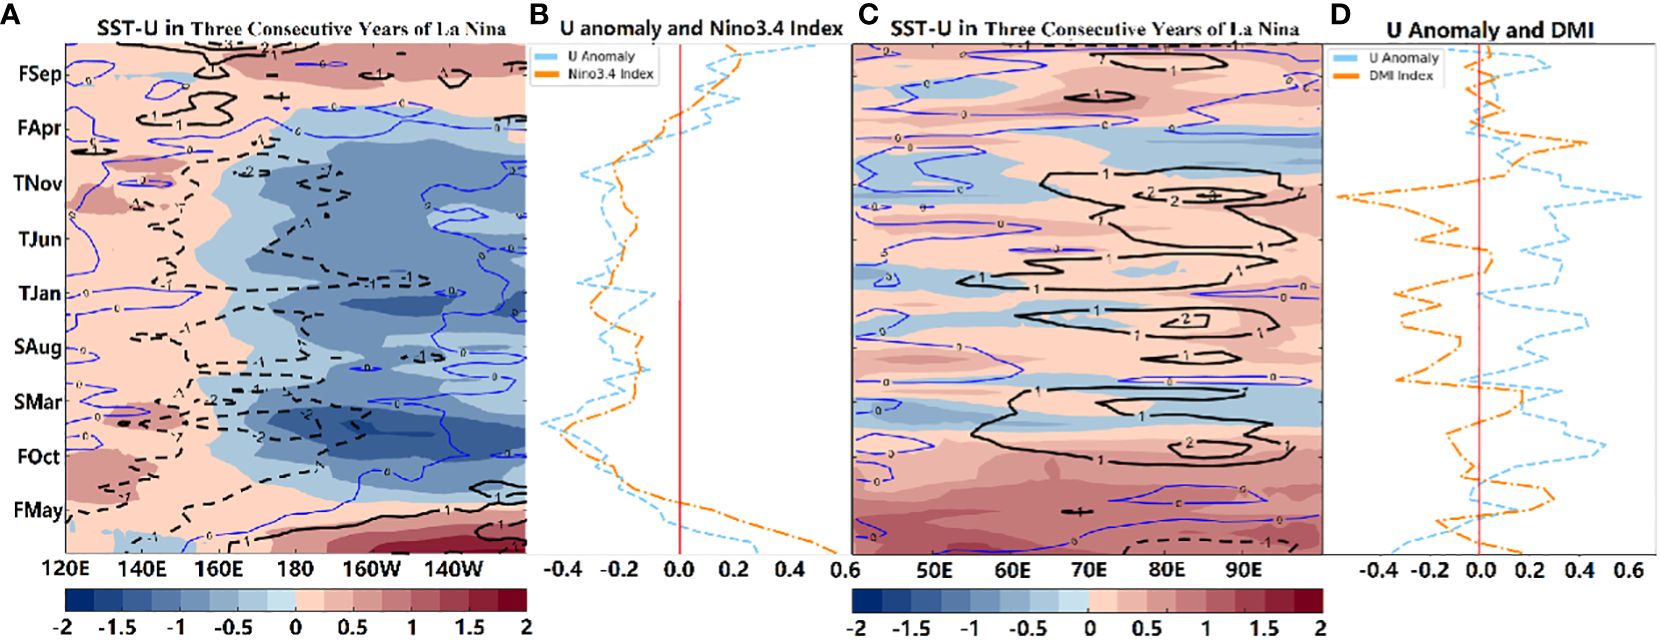
Figure 4 Average variation of the 5°N to 5°S U-wind (solid lines, positive values; dashed lines, negative values) and SST anomaly (contour) over time in the (A) Pacific Ocean and (C) Indian Ocean over 3-year consecutive La Nina events. (B) Comparison of the variation in mean U-wind in the Nino3.4 area and Nino3.4 index. (D) Comparison of 5°N to 5°S and 80–90°E mean U-Wind in the Indian Ocean, with DMI index over 3-year consecutive La Nina events.
3.2 Contribution of Indian Ocean dipole mode index, height field anomalies, and circulation fields to heatwave over three consecutive years of La Nina
In the tropical Indian Ocean, west wind anomaly effects peaked from summer to winter during the third year of La Nina; the corresponding DMI index was lowest at this time, showing a significant negative phase of IOD. These data indicate that the third year of La Nina events had a significant corresponding relationship with the negative phase of IOD. Furthermore, the continuous La Nina events maintained a high SST in the tropical East Indian Ocean via the propagation of the tropical Pacific and Oceanic Continental east wind anomaly and accumulation of energy. Furthermore, the IOD negative phase was consistent, producing pressure differences and west wind anomalies, which strengthened the convergence and upward movement of the tropical East Indian Ocean, enhancing Walker circulation and the Iran high. We used the West Pacific Subtropical High-Iran High Joint Index (referred to as the h Index; unit: gpm) to represent the synergistic enhancement of the Iran High and WNPSH caused by enhanced Walker circulation (Figures 5, 6).
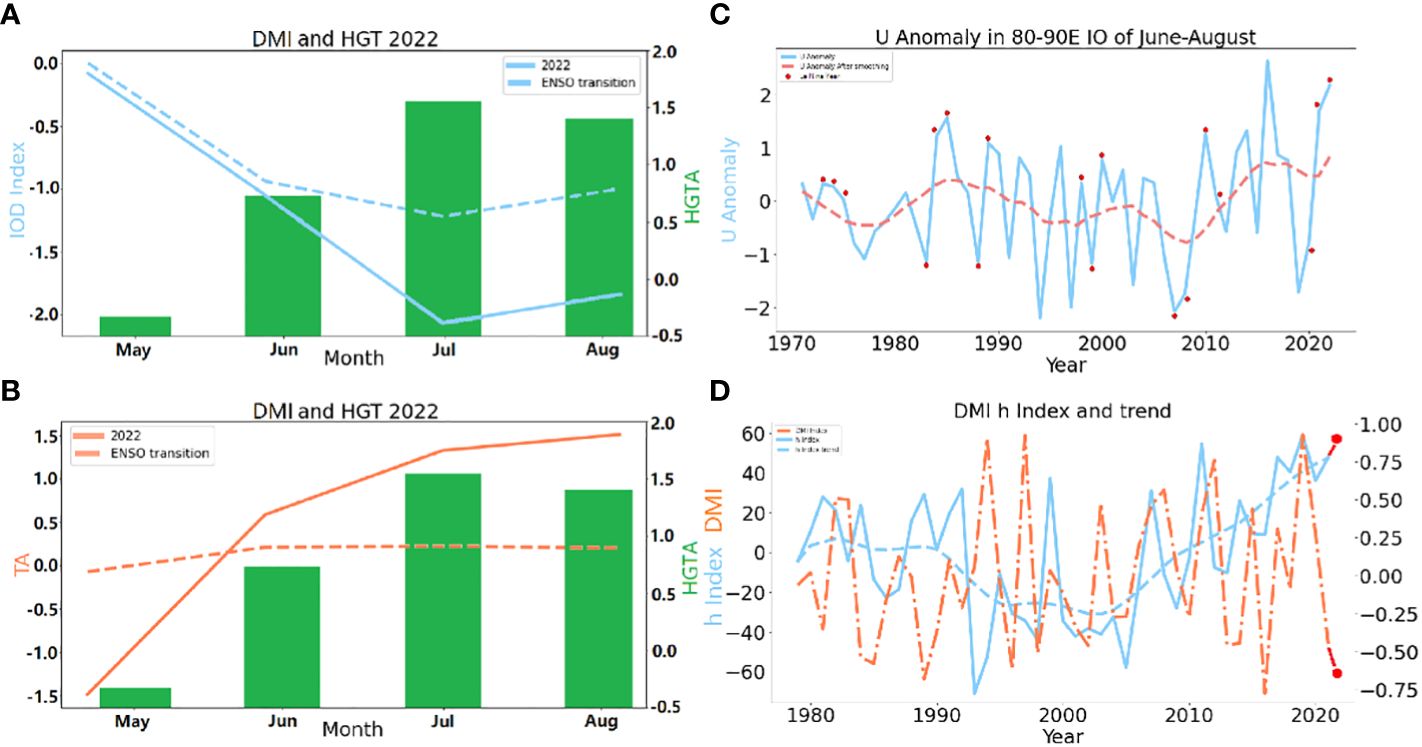
Figure 5 (A) Changes in the Indian Ocean Dipole Mode index (DMI) during ordinary La Nina decay years (dashed blue line) and May–August 2022 (solid blue line), and regional average potential height anomalies (per 10 gpm) of the Iranian High and Subtropical High from May–August 2022 (green bar); (B) changes in average temperature anomalies in eastern China during ordinary La Nina decay years (dashed orange line) and May–August 2022 (solid orange line), and regional average geopotential height anomalies (per 10 gpm) of the Iranian High and Subtropical High from May–August 2022 (green bar); (C) U-wind anomaly (solid blue line) and trend (dashed pink line) 80–90°E of the equatorial Indian Ocean, with years marked by red dots representing moderate or above intensity La Nina events; and (D) h index (solid blue line) and trend (dashed blue line), and change in DMI (dashed orange line).
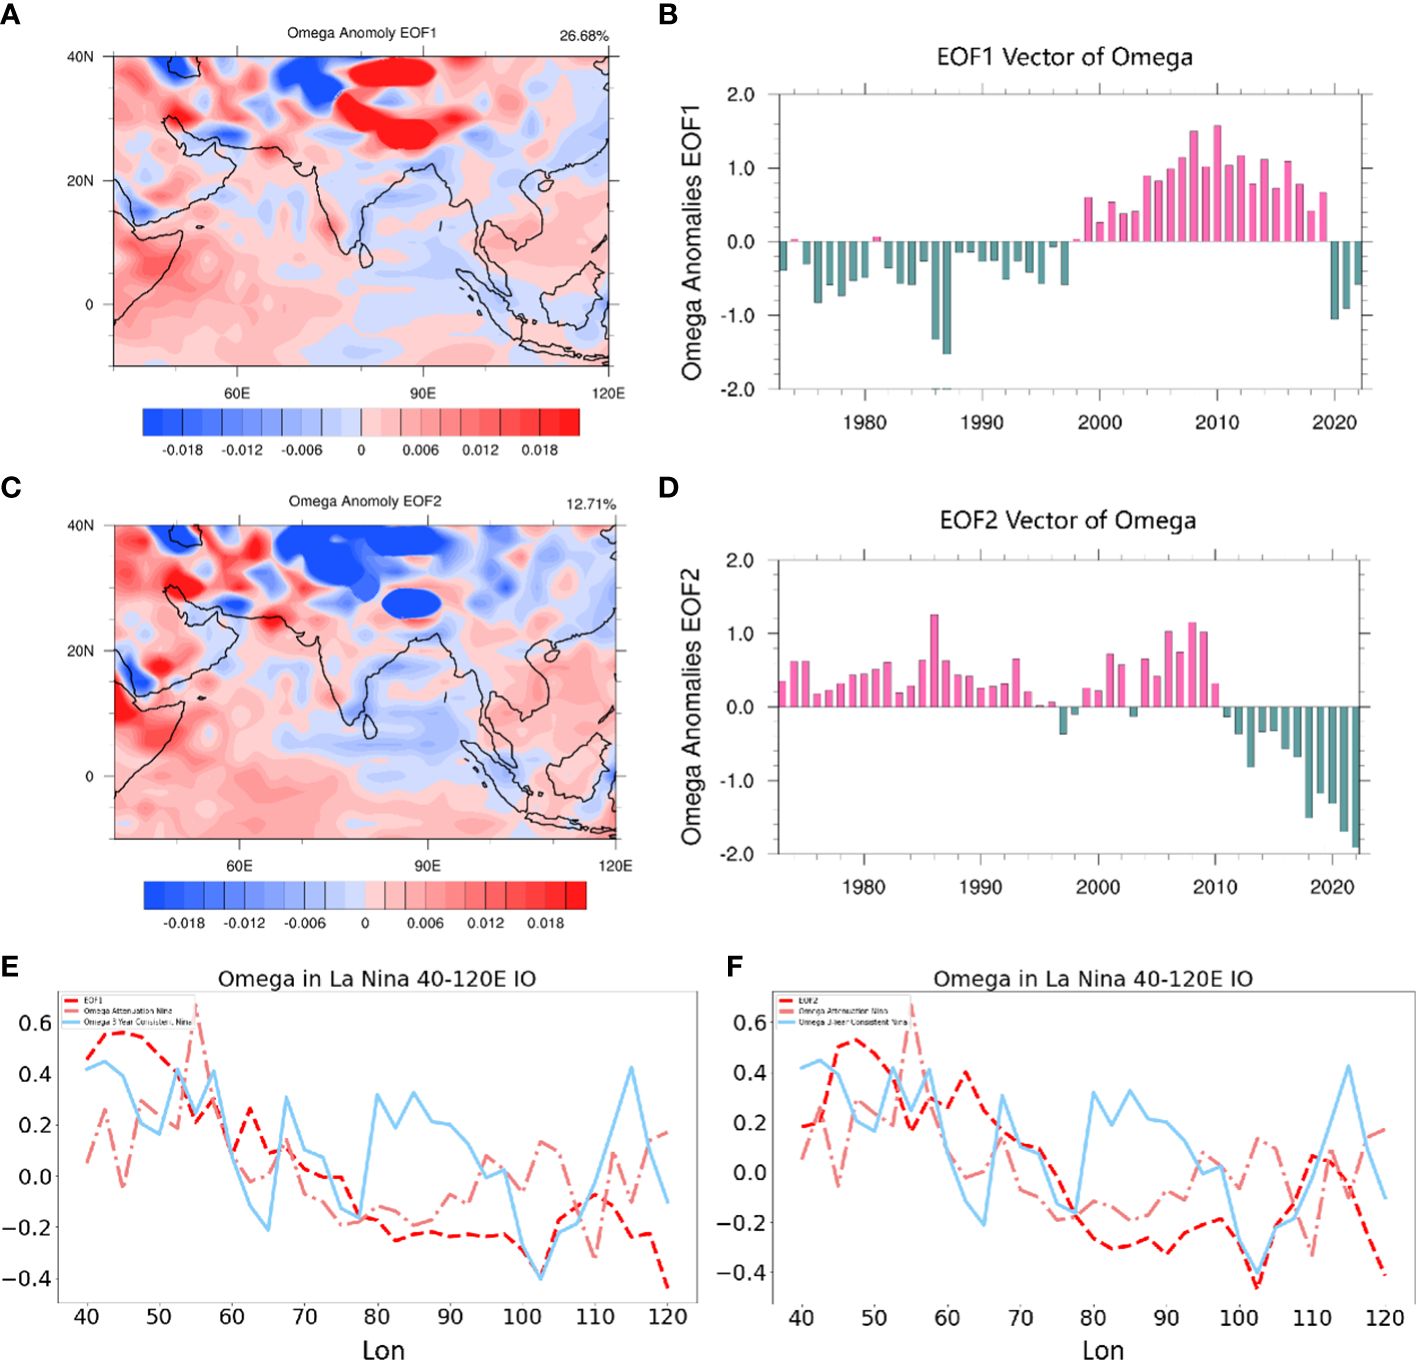
Figure 6 EOF analysis of vertical velocity (Omega) anomalies in the tropical Indian Ocean and surrounding areas: (A) the first mode; (B) corresponding eigen vectors; (C) the second mode; and (D) corresponding eigen vectors. Zonal distributions of (E) the first mode of EOF Omega anomaly in the equatorial Indian Ocean from 40–120°E (dotted red line), Omega anomalies in this area on the equator under ordinary La Nina events (dotted orange line), and over three consecutive years of La Nina Events (solid blue line), (F) as well as (E), but showing the EOF second mode as the red dotted line. Near-surface of vertical velocity is used.
In 2022, the DMI was significantly lower than the regular La Nina year in July and August; however, at the Iranian high pressure near 30°N, the 500 hPa height field was significantly higher and continued throughout the 2022 summer (Figure 5). When a La Nina event of medium intensity or above occurred, westerlies of 80–90°E in the equatorial Indian Ocean often developed in the second and especially third years. This indicates that the east wind anomaly caused by the continuous La Nina event transported warm water to the equatorial East Indian Ocean, increasing temperature and pressure differences between the eastern and western Indian Oceans of the equator, leading to westerly wind anomalies, enhanced warm water and ascending flow in the atmosphere of East Indian Ocean, and strengthened Walker circulation. Analysis of the V–W wind at 60°E and 90°E (data not shown) reveals that in years 2 and 3 of continuous La Nina events, there was a stronger descending flow near 30°N, 60°E, conducive to enhancement of the Iranian High. Even in the Qinghai-Tibet Plateau region, which usually does not have descending anomalies at 90°E, there were obvious descending anomalies in the third year of the La Nina event, conducive to the connection between the Iranian High and WNPSH, enhancing the Iranian high pressure and WNPSH, and increasing h index. Therefore, there was a significant negative correlation between the h index and DMI (to −0.366). When DMI was negative and the IOD negative phase occurred, the Iranian high pressure tended to strengthen, increasing h index.
Although the EOF decomposed and reduced vertical velocity during the summer in Asia, the contribution of the first EOF mode was 26.68%, and the second 12.71% (Figure 6). The first and especially second mode vectors were mainly negative over the three years. Negative vectors gradually increased from 2020–2022. For vertical velocity in the tropical Indian Ocean, the ascending part of the tropical East Indian Ocean was more intense over three consecutive years of La Nina events; this strengthened Walker circulation and the Iran high. For EOF1, the equatorial East Indian Ocean was negative, the western Indian Ocean was positive, and the Qinghai-Tibet Plateau, southwestern China, and Persian Gulf Coast were positive. Since 2000, this modal vector has been mainly positive, although it was negative under the background of the La Nina year for three consecutive years between 2020 and 2022. In the EOF2, the equatorial East Indian Ocean was mainly positive to the south of the equator, negative in areas north of the equator, and positive in the equatorial West Indian Ocean; the Tibetan Plateau was negative, the Persian Gulf, to the west, was positive, as were coastal areas of South China and the South China Sea. Since 2010, this modal vector has been mainly negative. The configuration of these modes was conducive to the strengthening of the Iran high and Walker circulation in 2022. Collectively, the two main modes reflected the rising movement of the equatorial East Indian Ocean and the South China Sea, and the sinking movement to the west of the Tibetan Plateau and eastern China; these events generated high temperatures in eastern China. This configuration of modes also explains that over recent years, when the DMI index was negative, there was no significant negative SST anomaly in the western Indian Ocean.
Circulation during the summers of 1998, 2010, and 2016–2022 with h > 40 were selected for synthetic analysis. During these years, Asia’s 500 hPa height field was divided into an eastern center, most obvious on the Chinese mainland and Bay of Bengal, and a western center, mainly on the Arabian Peninsula. Additionally, anticyclone circulation anomalies occurred around these two centers. The western center had a positive anomalous connection in the geopotential height field, conducive to connection between WPSH and the Iranian high pressure, enhancing heatwaves. The 100 hPa height field also had eastern and western centers. The eastern center was represented by the South Asian High Pressure located in the north, and the positive center of the geopotential height anomaly was located in northern China. The entire region of East Asia experienced a positive anomaly which resulted in increased outflow and latent heat from the northern side of the Yangtze River Basin. Combined with the 500 hPa height field anomaly, this led to an exceptionally deep and powerful warm high pressure system along the Yangtze River, and more pronounced high temperatures. Additionally, there was a negative anomaly of geopotential height in the Ural Mountains–Barkhash Lake area, and a significant positive anomaly of geopotential height in the Black Sea and northern regions. This height field distribution was also conducive to occurrence of common heatwaves in southern and northern East Asia (Kim et al., 2022).
Analysis of the 100 hPa geopotential height and anomaly fields reveals the South Asia High at 100 hPa firmly occupied the Qinghai-Tibet Plateau and surrounding areas, but in the eastern part of Eurasia, the 100 hPa geopotential height field in the northern area was significantly higher, by up to 400 gpm, thus strengthening the upwards movement of the northern side of the high-temperature area, providing energy for a high-temperature area on its southern side by releasing latent heat. This strengthened the WNPSH on its southern side (Le Fèvre and Tideman, 1931). Analysis of the 500 hPa geopotential height field and anomaly field revealed a high pressure belt near the Tibetan Plateau that connected the WNPSH with the Iranian High, further increasing temperature in East Asia.
4 Discussion and conclusions
We examine heatwave events in subtropical regions of East Asia for the summer of 2022, and investigate reasons for the joint impact of La Niña and IOD events on heatwaves in this region over three consecutive years of La Niña events.
Development of La Nina events contributes to high temperature heatwave events during the summer of 2022. Rapid development of La Nina events during the third year also exacerbated the occurrence of negative IOD phases because of accumulation of energy in easterly anomalies. In recent years, the probability of La Nina events with lower SST occurring in the central Pacific has increased, making easterly anomalies triggered by continuous La Nina events more pronounced. This may have increased the probability of summer heatwaves in East Asia during 2022, and this phenomenon may become increasingly frequent. Therefore, regardless of human influence, East Asian heatwaves may also become increasingly frequent.
The east wind anomaly caused by La Nina events in the equatorial East Indian Ocean was conducive to replenishment of warm water, facilitating occurrence of a negative IOD phase, which would strengthen the ascending vertical velocity of the equatorial East Indian Ocean, consequently Walker circulation, and enhance the Iranian high pressure in the Asian subtropical region (Figure 7). This in turn would enhance the overall strength of the Asian subtropical high pressure system and induce the occurrence of high-temperature and drought events. The combined effect of the negative phase of IOD and La Nina events provides background field support for the strengthening of the WPSH and Iranian high, corresponding to high temperature anomalies on land. From EOF analysis of vertical velocity in the tropical Indian Ocean and Asian continent at low and middle latitudes, the first two EOF modes favored the strengthening of Walker circulation in 2022. These two main modes jointly reflect the ascending vertical velocity of the equatorial eastern Indian Ocean and South China Sea in 2022, and the enhanced sinking vertical velocity west of the Qinghai-Tibet Plateau and in eastern China. These events were conducive to the generation of high temperatures in eastern China.
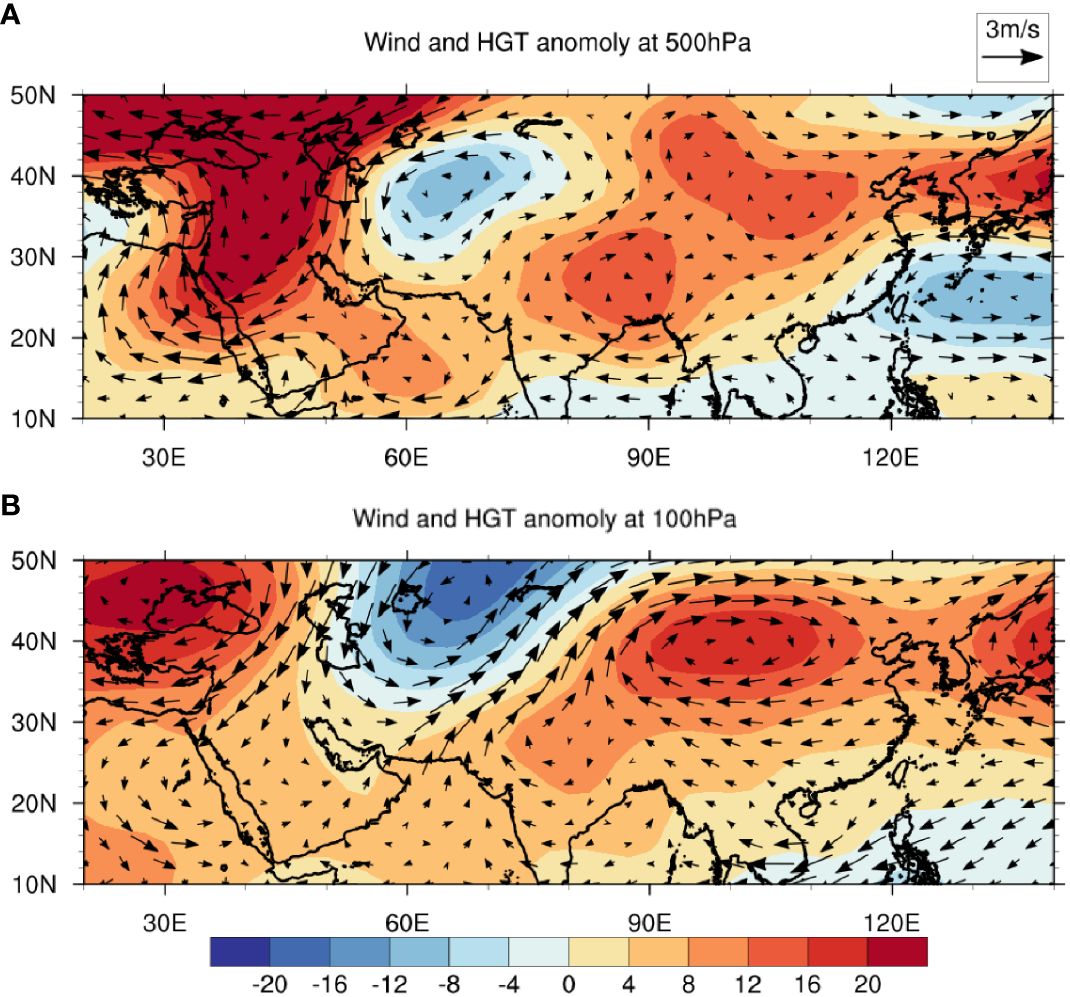
Figure 7 Composite analysis of 500 hPa (A) and 100 hPa (B) wind and potential height anomalies in Asia with a large h (h ≥ 40 gpm).
High pressure in South Asia was affected by the La Nina events that lasted for three years, with a strong trend towards the north. These events also contributed to high temperatures in 2022; the 100 hPa geopotential height field in the northern area was significantly higher (to 400 gpm). Additionally, the positive center of the geopotential height anomaly was located in northern China. The whole of East Asia was a positive anomaly, resulting in increased outflow and latent heat from the northern side of the Yangtze River Basin. Combined with the 500 hPa height field anomaly (Figure 8), this created an exceptionally deep and powerful warm high pressure system along the Yangtze River, increasing high temperatures in this region.
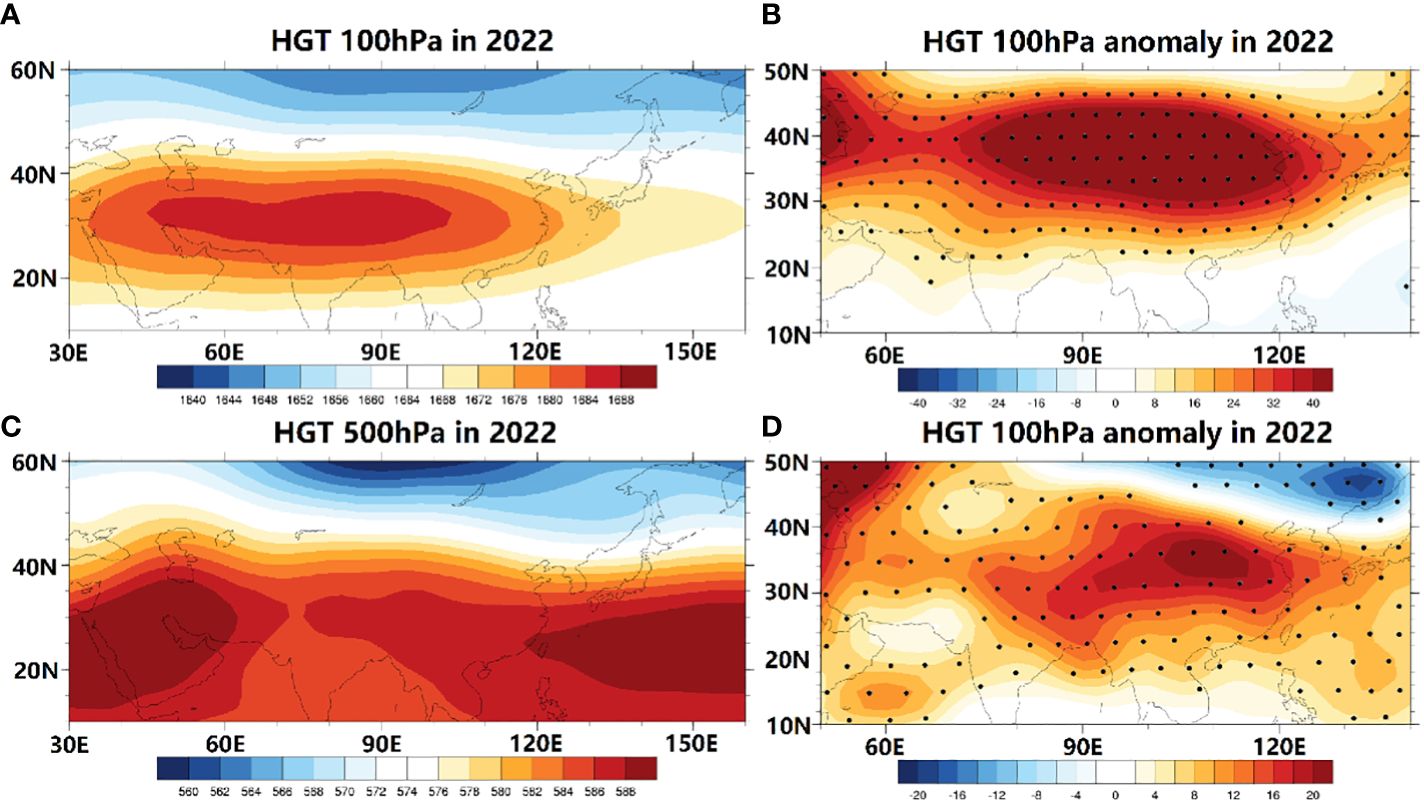
Figure 8 From June–August 2022: (A) 100 hPa geopotential height field, (B) 100 hPa geopotential height anomaly field, (C) the 500 hPa geopotential height field, and (D) 500 hPa geopotential height anomaly field (dotted area passing the 90% significance test).
Data availability statement
Publicly available datasets were analyzed in this study. This data can be found here: https://psl.noaa.gov/data/gridded/data.ncep.reanalysis.html.
Author contributions
CB: Conceptualization, Data curation, Formal analysis, Funding acquisition, Investigation, Resources, Software, Writing – original draft.
Funding
The author(s) declare financial support was received for the research, authorship, and/or publication of this article. Graduate Research and Innovation Projects of Jiangsu Province (KYCX23_1295).
Conflict of interest
The author declares that the research was conducted in the absence of any commercial or financial relationships that could be construed as a potential conflict of interest.
Publisher’s note
All claims expressed in this article are solely those of the authors and do not necessarily represent those of their affiliated organizations, or those of the publisher, the editors and the reviewers. Any product that may be evaluated in this article, or claim that may be made by its manufacturer, is not guaranteed or endorsed by the publisher.
References
Abhik S., Lim E., Hope P., Jones D. A. (2023). Multiweek prediction and attribution of the Black Saturday heatwave event in Southeast Australia. J. Climate 36, 6763–6775. doi: 10.1175/JCLI-D-22-0833.1
Behera S. K., Luo J. J., Masson S., Rao S. A., Sakuma H., Yamagata T. (2006). A CGCM study on the interaction between IOD and ENSO. J. Climate 19, 1688–1705. doi: 10.1175/JCLI3797.1
Bian Y., Sun P., Zhang Q., Luo M., Liu R. (2022). Amplification of non-stationary drought to heatwave duration and intensity in eastern China: Spatiotemporal pattern and causes. J. Hydrol. 612, 128154. doi: 10.1016/j.jhydrol.2022.128154
Cai W., van Rensch P., Cowan T., Hendon H. H. (2012). An asymmetry in the IOD and ENSO teleconnection pathway and its impact on Australian climate. J. Climate 25, 6318–6329. doi: 10.1175/JCLI-D-11-00501.1
Fan H., Yang S., Wang C., Wu Y., Zhang G. (2022). Strengthening amplitude and impact of the pacific meridional mode on ENSO in the warming climate depicted by CMIP6 models. J. Climate 35, 5195–5213. doi: 10.1175/JCLI-D-21-0683.1
Hari V., Ghosh S., Zhang W., Kumar R. (2022). Strong influence of north Pacific Ocean variability on Indian summer heatwaves. Nat. Commun. 13, 5349. doi: 10.1038/s41467-022-32942-5
Hasan N. A., Chikamoto Y., McPhaden M. J. (2022). The influence of tropical basin interactions on the 2020–2022 double-dip La Niña. Front. Clim. 4, 1001174. doi: 10.3389/fclim.2022.1001174
He C., Zhou T., Zhang L., Chen X., Zhang W. (2023). Extremely hot East Asia and flooding western South Asia in the summer of 2022 tied to reversed flow over Tibetan Plateau. Clim. Dyn. 61, 2103–2119. doi: 10.1007/s00382-023-06669-y
Huang Z., Zhang W., Geng X., Jin F-F. (2019). Recent Shift in State of the Western Pacific Subtropical High due to ENSO change. J. Climate 33 (1). doi: 10.1175/JCLI-D-18-0873.1
Iwakiri T. W. M. (2020). Multiyear La Nina impact on summer temperature over Japan. J. Meteorol. Soc. Japan 98 (6), 1245–1260. doi: 10.2151/jmsj.2020-064
Jeong H., Park H., Chowdary J. S., Xie S. (2023). Triple-dip La Niña contributes to Pakistan flooding and Southern China drought in summer 2022. Bull. Amer. Meteor. Soc 104, E1570–E1586. doi: 10.1175/BAMS-D-23-0002.1
Kim D. W., Lee S. (2022). Dynamical mechanism of the summer circulation trend pattern and surface high temperature anomalies over the Russian far east. J. Climate 35, 6381–6393. doi: 10.1175/JCLI-D-22-0244.1
Kim J. H., Kim S. J., Kim J. H., Hayashi M., Kim M. K. (2022). East Asian heatwaves driven by Arctic-Siberian warming. Sci. Rep. 12, 18025. doi: 10.1038/s41598-022-22628-9
Le Fèvre R., Tideman C. (1931). Calculation of the latent heat of fusion of camphor from vapour pressure–temperature data. Nature 127, 972–973.
Li Y., Qiu Y., Hu J., Aung C., Lin X., Jing C., et al. (2021). The strong upwelling event off the southern coast of Sri Lanka in 2013 and its relationship with Indian ocean dipole events. J. Climate 34, 3555–3569. doi: 10.1175/JCLI-D-20-0620.1
Li H., Richter J. H., Lee C.-Y., Kim H. (2022). Subseasonal tropical cyclone prediction and modulations by MJO and ENSO in CESM2. J. Geophys. Res.: Atmos. 127.
Magee A. D., Kiem A. S. (2020). Using indicators of ENSO, IOD, and SAM to improve lead time and accuracy of tropical cyclone outlooks for Australia. J. Appl. Meteor. Climatol. 59, 1901–1917. doi: 10.1175/JAMC-D-20-0131.1
McKinnon K. A., Simpson I. R. (2022). How unexpected was the 2021 Pacific Northwest heatwave? Geophys. Res. Lett. 49. doi: 10.1029/2022GL100380
McPhaden M. J., Connell K. J., Foltz G. R., Perez R. C., Grissom K. (2023a). Tropical ocean observations for weather and climate: A decadal overview of the Global Tropical Moored Buoy Array. Oceanography 36, 32–43. doi: 10.5670/oceanog
McPhaden M. J., Hasan N., Chikamoto Y. (2023b). Causes and consequences of the prolonged 2020–2023 La Niña[C]. EGU general assembly 2023, Vienna, Austria, 24–28 Apr 2023, EGU23-10801. Vienna, Austria: EGUsphere.
Meng M., Gong D. (2022). Winter North Atlantic SST as a precursor of spring Eurasian wildfire. Geophys. Res. Lett. 49, 18. doi: 10.1029/2022GL099920
Mondal S., Mishra A. K., Leung R., Cook B. (2023). Global droughts connected by linkages between drought hubs. Nat. Commun. 14, 144. doi: 10.1038/s41467-022-35531-8
Qiu Y., Cai W., Guo X., Ng B. (2014). The asymmetric influence of the positive and negative IOD events on China’s rainfall. Sci. Rep. 4, 4943. doi: 10.1038/srep04943
Rasmusson E. M., Carpenter T. H. (1982). Variations in tropical sea surface temperature and surface wind fields associated with the southern oscillation/El Niño. Mon. Wea. Rev. 110, 354–384. doi: 10.1175/1520-0493(1982)110<0354:VITSST>2.0.CO;2
Sharma A. R., Jain P., Abatzoglou J. T., Flannigan M. (2022). Persistent positive anomalies in geopotential heights promote wildfires in Western North America. J. Climate 35, 6469–6486. doi: 10.1175/JCLI-D-21-0926.1
Sun S., Fang Y., Zu Y., Liu L., Li K. (2022). Increased occurrences of early Indian Ocean Dipole under global warming. Sci. Adv. 8, eadd6025. doi: 10.1126/sciadv.add6025
Timmermann A., An S. I., Kug J. S., Jin F, Cai F. W., Capotondi A., et al. (2018). El niño–southern oscillation complexity. Nature 559, 535–545. doi: 10.1038/s41586-018-0252-6
Tuel A., Steinfeld D., Ali S. M., Sprenger M., Martius O. (2022). Large-scale drivers of persistent extreme weather during early summer 2021 in Europe. Geophys. Res. Lett. 49, 18. doi: 10.1029/2022GL099624
Wei J., Han W., Wang W., Zhang L., Rajagopalan B. (2023). Intensification of heatwaves in China in recent decades: Roles of climate modes. NPJ Clim. Atmos. Sci. 6, 98. doi: 10.1038/s41612-023-00428-w
Wei Y., Ren H.-L. (2022). Distinct MJOs under the two types of La Niña. J. Geophys. Res.: Atmos. 127. doi: 10.1029/2022JD037646
Xie S., Hu K., Hafner J., Tokinaga H., Du Y., Huang G., et al. (2009). Indian Ocean Capacitor Effect on Indo–Western Pacific Climate during the Summer following El Niño. J. Climate 22, 730–747. doi: 10.1175/2008JCLI2544.1
Xu C., Wang S. Y. S., Borhara K., Bockley B., Tan N., Zhao Y., et al. (2023). Asian-Australian summer monsoons linkage to ENSO strengthened by global warming. NPJ Climate Atmos. Sci. 6, 98. doi: 10.1038/s41612-023-00341-2
Xue J., Yang H., Luo J.-J., Yuan C., Wang B., Yamagata T. (2022). Ningaloo Niño/Niña in CMIP6 models: Characteristics, mechanisms, and climate impacts. Geophys. Res. Lett. 49. doi: 10.1029/2022GL099781
Keywords: La Nina, IOD, heatwave, zonal wind, vertical wind
Citation: Boyu C (2024) The impact of interactions between various systems caused by three consecutive years of La Nina events on the abnormal summer high temperatures in China in 2022. Front. Mar. Sci. 11:1361782. doi: 10.3389/fmars.2024.1361782
Received: 26 December 2023; Accepted: 19 March 2024;
Published: 04 April 2024.
Edited by:
Toru Miyama, Japan Agency for Marine-Earth Science and Technology, JapanReviewed by:
Bicheng Huang, Yangzhou University, ChinaA. K. M. Nahid Hasan, Utah State University, United States
Copyright © 2024 Boyu. This is an open-access article distributed under the terms of the Creative Commons Attribution License (CC BY). The use, distribution or reproduction in other forums is permitted, provided the original author(s) and the copyright owner(s) are credited and that the original publication in this journal is cited, in accordance with accepted academic practice. No use, distribution or reproduction is permitted which does not comply with these terms.
*Correspondence: Chai Boyu, NDEzMTcwNDU5QHFxLmNvbQ==
 Chai Boyu