 Baodong Dai
 Jifeng Cao
 Gonghang Chen
- School of Business, Qingdao University, Qingdao, China
This article focuses on 11 coastal provinces in China and selects relevant data from 2008 to 2021. The improved entropy method is used to calculate the level of informationization development in each province. The Malmquist index is used to calculate the marine ecological efficiency of each province. The panel vector autoregression (PVAR) model is established to study the dynamic relationship between informationization and marine ecological efficiency. The results show that: (1) There is a long-term equilibrium relationship between informationization and marine ecological efficiency, and informationization is a Granger cause of marine ecological efficiency at the 5% significance level. (2) Overall, informationization has a promoting effect on marine ecological efficiency, but with a certain lag; the improvement of marine ecological efficiency also benefits the development of informationization. (3) There is a bidirectional relationship between informationization and marine ecological efficiency, and informationization has become the main influencing factor of marine ecological efficiency.
1 Introduction
In the 21st century, the ocean’s “territorialization” trend is on the rise, with rapid advancements in marine science and technology and intensifying competition for resources [Zeyu et al. (2016); Zeyu et al. (2017)]. The development of the marine economy plays a pivotal role in grasping more resources and space, occupying a strategic position in the growth of the national economy. China’s gross marine product exceeded 9 trillion yuan in 2021, marking a significant milestone with a total of 9038.5 billion yuan [Ministry of Natural Resources (2022)]. This represents an 8.3% increase compared to 2020, contributing 8.0% to national economic growth, and accounting for 15.0% of coastal GDP. However, China’s early crude approach to marine economic development has resulted in substantial consumption of marine resources. Simultaneously, the excessive discharge of waste has caused a deterioration in the marine environment, further impeding the sustainable development of the marine economy [Lin et al. (2016)].
Following the era of reform and opening up, China has placed a renewed emphasis on the sustainable utilization of marine resources and the protection of the marine ecological environment. As part of this effort, the country has embraced the “Ocean Power” strategy [Yanqun and Peng (2017)] and the concept of “Expanding Blue Economic Space”, with a focus on integrating land and sea resources, promoting the coordinated development of economy, society, and the ecological environment, and establishing a marine ecological civilization [Aimin (2016)]. Amidst the dual pressures of human activities and climate change, the task of ecological protection is both complex and arduous. In recent years, with the rapid advancement of big data, cloud computing, and the Internet, informatization has played a pivotal role in the process of ecological civilization construction, providing key technical support for all facets of the construction effort. For example, China has implemented a series of ocean construction programs to develop intelligent application services for ocean information using advanced technologies such as real-time information transmission over the Internet, big data, and cloud computing. The Daya Bay Station, in particular, has always adhered to the purpose of long-term ecological monitoring, research, demonstration, and service, providing important theoretical and technical support for China’s offshore ecological protection and sustainable development of biological resources. The Jiaozhou Bay Marine Ecological Protection Information Platform provides a key service for the comprehensive remediation and restoration of Jiaozhou Bay [Qingyun et al. (2020)]. In conclusion, informatization holds the potential to contribute significantly to the establishment of an ecological civilization.
Most of the current research on informatization and eco-efficiency has been conducted from the perspective of theory and policy recommendations, and there is a lack of research on the impact mechanisms between the two, as well as no empirical research on the impact of informatization on more specific marine eco-efficiency. Therefore, this study focuses on the relationship between marine eco-efficiency in China and its main influencing factor, informatization. The improved entropy method and Malmquist index were used to measure and analyze the level of informatization and marine eco-efficiency in China, and then the PVAR model was proposed to study the dynamic impact of informatization on marine eco-efficiency from an empirical perspective [Ji and Li (2021)], and finally policy-oriented recommendations were proposed based on the research findings.
The concept of eco-efficiency was initially introduced in the context of sustainable development. In line with China’s commitment to the core principle of sustainable development, which emphasizes the harmonious integration of economy, resources, and the environment, there has been a shift from sole focus on economic efficiency to a greater emphasis on eco-efficiency [Xiaodi (2015)]. Eco-efficiency takes into account the complex interplay between economic, environmental, resource, and ecological interests, providing a comprehensive measure of resource and environmental utilization, as well as its coordination with economic efficiency and environmental impact [Yufei et al. (2017)]. Therefore, it is of significant practical importance to investigate marine eco-efficiency and its influencing factors in China. Such research can facilitate the promotion of marine ecological civilization and expedite the construction of a robust marine state [Mei and Yarong (2019)].
Due to the past focus on the economy at the expense of the environment, the problem of pollution has gradually become a major problem that hinders social development. Therefore, the assessment of the eco-efficiency of the corresponding areas and the adoption of measures according to the specific situation have become the main tasks of the new period [Chen et al. (2021)]. After a series of studies, it was found that the eco-efficiency of different regions varies to some extent even in the neighboring regions, which makes it difficult for national-level policies to solve the ecological problems at the regional level sometimes or the effects are not obvious, which demands the study of the spatial and temporal dynamic characteristics of eco-efficiency [Wang et al. (2018)]. In order to investigate the impact of environmental regulation on eco-efficiency, Qin quantified the environmental regulation policies and found that mandatory policies can significantly reduce negative environmental effects, and then proposed policy recommendations such as strengthening policy control and enacting environmental laws and regulations according to local conditions [Qin et al. (2021)].
As research on eco-efficiency has progressed, both the research methods and models as well as the research objects have become increasingly specific and diverse. The development of the concept of ecoeconomic output efficiency [Defeng et al. (2018)], the use of the non-desired output SBM model [Biao and Yeteng (2016)] that can exclude more confounding factors to make the results more accurate, the proposal of new methods to assess eco-efficiency scores based on multi-intelligence simulations instead of relying on field survey data [Ma et al. (2021); Qin and Sun (2021); Xiao et al. (2021)], and even the shift from regional to specific government and sector, agriculture [Defeng et al. (2018)], tourism [Liu et al. (2017)], and coal mining [Liu et al. (2019)] perspectives on eco-efficiency, and Matheus even applied eco-efficiency to the field of apparel design to assess environmental impacts and costs at the early design stage, providing informed advice to designers, manufacturers, and policy makers [Belucio et al. (2021)]. Research on eco-efficiency in marine aspects has mostly focused on the eco-efficiency of mariculture and its influencing factors [Carauta et al. (2022)], eco-efficiency evaluation of marine pastures [Xu et al. (2022)], and efficiency calculation of complex marine systems [Sun et al. (2017)], providing theoretical basis and suggestions for the development of specific marine industries.
The integration of information technology such as the Internet of Things, digital technology [He et al. (2022)], industrial big data [Qiao et al. (2021)], and the “5G+Industrial Internet” [Taleb et al. (2019)] has significantly contributed to the sustainable development of social economy and culture, offering a new model for the global economic landscape. Examining the role of information and communication technologies and other technological tools [Aldakhil et al. (2019); Ahmed et al. (2021); Ma et al. (2022)], it becomes evident that the advancement of informatization provides a wealth of resources and opportunities for the development of diverse industries, particularly in enhancing tourism. It is more conducive to industry transformation and upgrading; however, the level of development between the two may not always be congruous [Yuanyuan (2016)]. Therefore, several scholars have lately endeavored to examine the development of informatization in the context of its integration with various other factors. Niu delved into the synergistic evolution mechanism between top management support, employees’ technical abilities, and informatization performance in the course of “informatization and industrialization integration” in manufacturing enterprises [Niu et al. (2021)]. Wu and Zhu [Wu and Zhu (2020)], on the other hand, unraveled the dynamic process of integration between manufacturing technology and informatization, informatization and industrialization, and employed technical efficiency as a metric for gauging the extent of integration between informatization and industrialization [Zhu et al. (2020)]. The utilization of informatization in the oceanic realm is primarily visible in its role in propelling the ocean economy’s informatization and amassing data and information through informatization, which is subsequently applied to coastal management [Xiaozhong and Qingjun (2016); Zeyu and Ganggang (2019); Ma et al. (2023)]. By combining the aforementioned literature studies, we can infer that the correlation between informatization and marine eco-efficiency has not been previously investigated solely in terms of eco-efficiency and informatization itself or the correlation between the two and other factors.
The main contributions of this study to the literature are as follows: firstly, the necessity of informatization for the construction of marine ecological civilization is clarified from the perspective of policy and text, and the construction of informatization can promote the improvement of marine eco-efficiency; secondly, the study was conducted from the perspective of empirical proof. A system of indicators was established to measure and comprehensively evaluate China’s informatization and marine eco-efficiency, and it was found that the level of informatization and marine eco-efficiency showed a fluctuating upward trend, and the change curves of both were roughly the same. The dynamic relationship between informatization and marine eco-efficiency is examined, demonstrating that informatization can significantly improve marine eco-efficiency, and enriching the literature with corresponding development suggestions based on the main findings.
2 Informatization level measurement and evaluation
2.1 Study area, data sources and processing
The study area of this study is the 11 coastal provinces of Tianjin, Hebei, Liaoning, Shanghai, Jiangsu, Zhejiang, Fujian, Shandong, Guangdong, Guangxi and Hainan. The indicator data of this study are obtained from China Statistical Yearbook, China Tertiary Industry Statistical Yearbook, China Regional Economic Statistical Yearbook, China Social Statistical Yearbook, China Science and Technology Statistical Yearbook, China Marine Statistical Yearbook, China Marine Yearbook and the official website of the National Bureau of Statistics (www.stats.gov.cn) [National Bureau of Statistics of China (2021b); National Bureau of Statistics of China (2021c); National Bureau of Statistics of China (2021d); National Bureau of Statistics of China (2021e); National Bureau of Statistics of China (2021f); National Bureau of Statistics of China (2021g); China Ocean Yearbook Editorial Committee (2021)]. Some years with missing data were filled in by linear interpolation.
2.2 Measurement method
In this study, the improved entropy method is used to calculate the information level indicators [Zeyu and Ganggang (2019)]. The entropy method is an objective weighting method. Compared with the subjective weighting method, the weight value of the index obtained has higher credibility and accuracy, and is widely applicable and has the advantages of dealing with multi-indicator problems. The weighted summation of various indicators in the supply chain resilience index system can achieve the purpose of reducing the number of indicators and more accurate empirical results [Guo (1998)]. We choose n objects and m indicators to form the initial matrix, and xijis the value of the jth indicator of object i, where (i = 1,2,…,n;j = 1,2,…,m). The specific steps are as follows.
• Data standardization Positive indicators:
Where min(xj) denotes the minimum value of the jth index of object i and max(xj) denotes the maximum value of the jth index of object i. Since this step of the calculation process will produce zero normalized value, which is meaningless when using logarithm to find the entropy value, this study takes ϵ as 0.0001 in the calculation process to avoid this problem without affecting the calculation results. The normalized value of the jth indicator of object i can be defined as: .
• Second, the entropy value e and the coefficient of variation d of the jth indicator are calculated.
• Calculate the weight of the jth indicator.
• Finally, the comprehensive evaluation index of object i is calculated.
2.3 Evaluation index of informatization level
In this study, the selection of indicators was carried out in a scientific and reasonable manner, adhering to the four principles of scientificity, practicality, operability, and representativeness.
Based on the connotation of informatization and the interaction mechanism between marine eco-efficiency and informatization, this study selects four primary indicators of informatization infrastructure level, social application level, scientific research environment level, and industry operation level and further subdivides them into eight secondary indicators to comprehensively and objectively evaluate the informatization development level of 11 coastal provinces in China from 2006 to 2018 [Wang et al. (2014)]. The indicator system is shown in the Table 1.
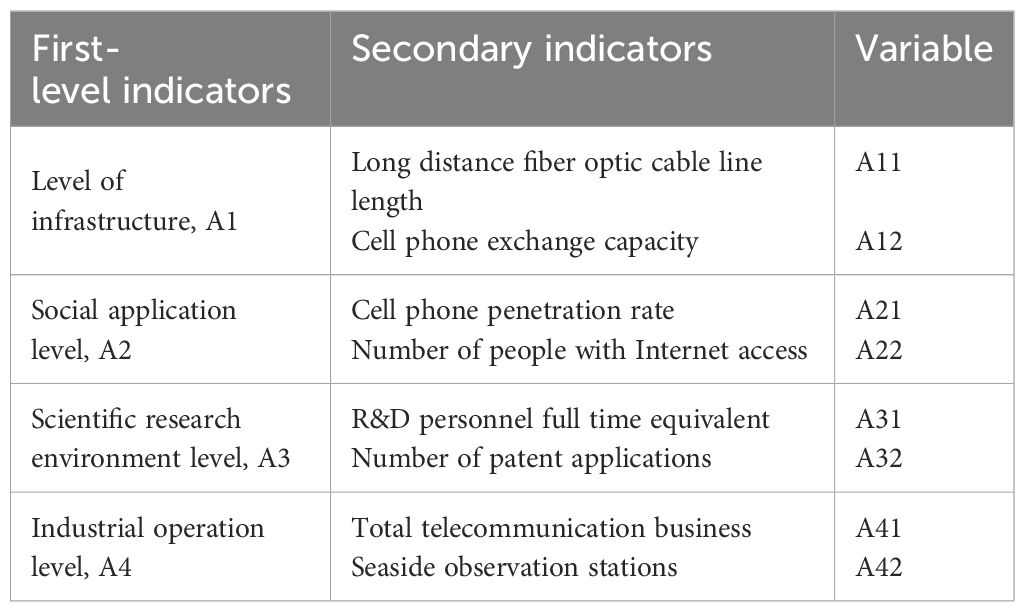
Table 1 Informatization level evaluation index system.
2.4 Evaluation of informatization level
The weights of each index were calculated by the improved entropy method, and the results were averaged as shown in the Table 2.

Table 2 Entropy weight of each evaluation index.
In terms of indicators, the weights of informatization infrastructure level, social application level, scientific research environment level, and industrial operation level are 0.2304, 0.2100, 0.3130, and 0.2466. This indicates that the scientific research environment level is the primary factor influencing informatization and providing more effective support for informatization development, and the informatization infrastructure implementation level, social application level, and industry operation level have equal importance in relative terms.
The average informatization level of the 11 coastal provinces each year is presented in the form of a line graph as shown in the figure to observe the change trend more clearly. The average level of informatization in each province is shown in the Figure 1.
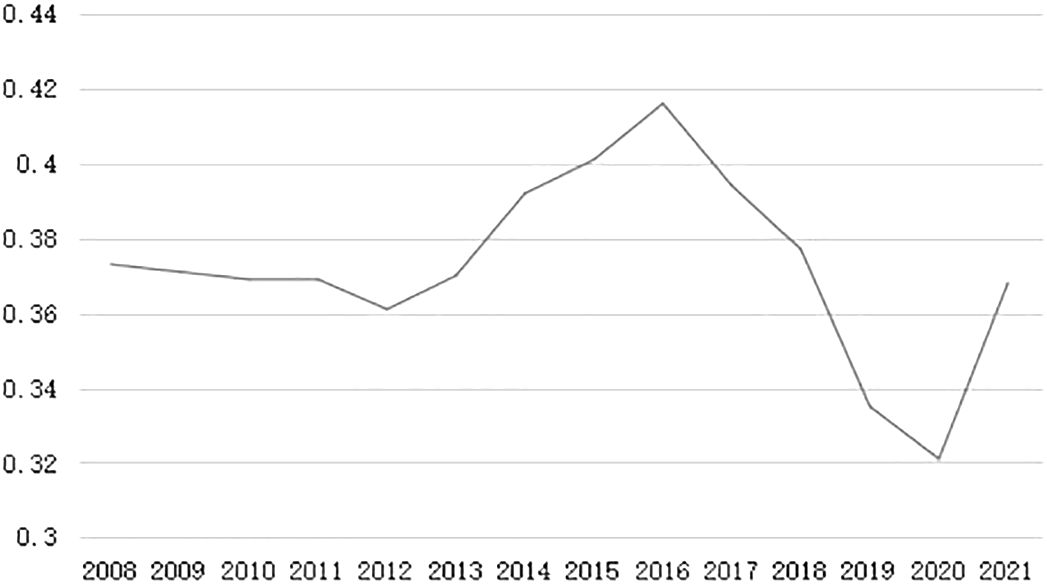
Figure 1 2008-2021 informatization level average.
From 2008 to 2016, the level of informatization in China’s coastal provinces showed a significant upward trend, with an increase of 0.0520% compared to 2008. Due to the transformation of China’s economic growth mode in 2017 and the pressure brought by the money market, as well as the outbreak of the COVID-19 in 2019, all walks of life were affected, and the level of informatization also declined. However, from 2020, the level of informatization began to rise. Overall, the level of informatization development is constantly improving.
The level of informatization in each province and the average and ranking of the four primary indicators during 2008-2021 are shown in the Table 3.
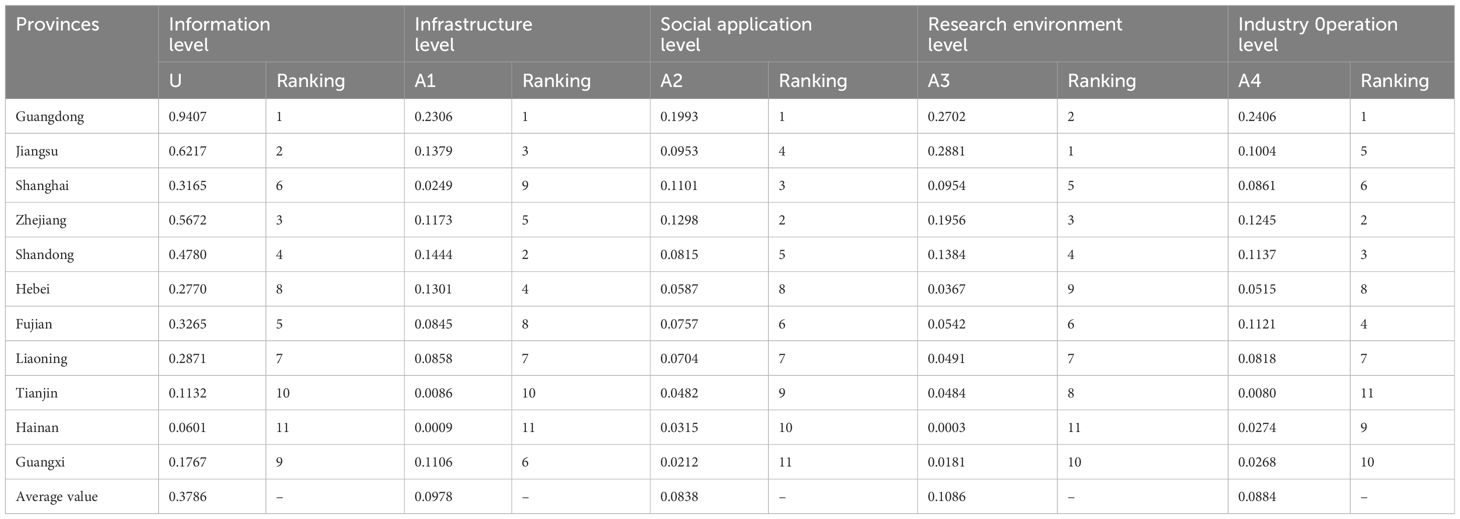
Table 3 Informative evaluation results.
The informatization level of Guangdong is 0.9407 and that of Hainan is only 0.0601, indicating significant provincial disparities. The overall average level of informatization stands is 0.3786, and only four provinces, namely Guangdong, Jiangsu, Zhejiang and Shandong, are above the average level. This indicates that the overall level of informatization in China’s coastal provinces is not high.
In terms of infrastructure level, the average level is 0.0978, Guangdong is 0.2306, which is much higher than the average, ranking the first, Hainan is 0.0009, ranking the last; In terms of social application level, the average level is 0.0838, Guangdong, Jiangsu and other provinces are higher than the national average level, and other provinces are lower than the national average level; In terms of the level of scientific research environment, Jiangsu, Guangdong and Zhejiang ranked at the top, while Hainan lagged behind. In terms of industrial operation level, the average level is 0.0884, with Guangdong, Zhejiang and Shandong ranking top, and Tianjin ranking last. It can be seen that the development of information technology in China’s coastal provinces is not balanced, and there are still big gaps in the level of economic development, policy support, talent reserve and innovation ability of the coastal provinces.
3 Measurement and analysis of marine eco-efficiency level
3.1 Data source and processing
The indicator data in this study were obtained from the China Statistical Yearbook and the official website of the National Bureau of Statistics [Dataset National Bureau of Statistics of China, 2021; National Bureau of Statistics of China (2021a); National Bureau of Statistics of China (2021g)]. Some years with missing data were completed by linear interpolation method.
3.2 Measurement method
In this study, by using the software DEAP2.1. Calculate marine eco-efficiency indicators using the Malmquist index. The Malmquist index is proposed based on Data Envelopment Analysis (DEA) and is suitable for evaluating the production efficiency and technological progress of organizational units in different periods or regions. It can reflect the dynamic changes in eco-efficiency of each province during the current period and one lagging period, and make up for the shortcomings of DEA models in studying dynamic data.
3.3 Marine eco-efficiency input-output index system
In this study, in order to accurately assess the actual situation of marine eco-efficiency in 11 coastal provinces, a scientific and reasonable marine eco-efficiency evaluation index system is constructed in terms of both inputs and outputs in the selection of indicators [Qingfeng and Zhuchang (2014)], as shown in the Table 4.
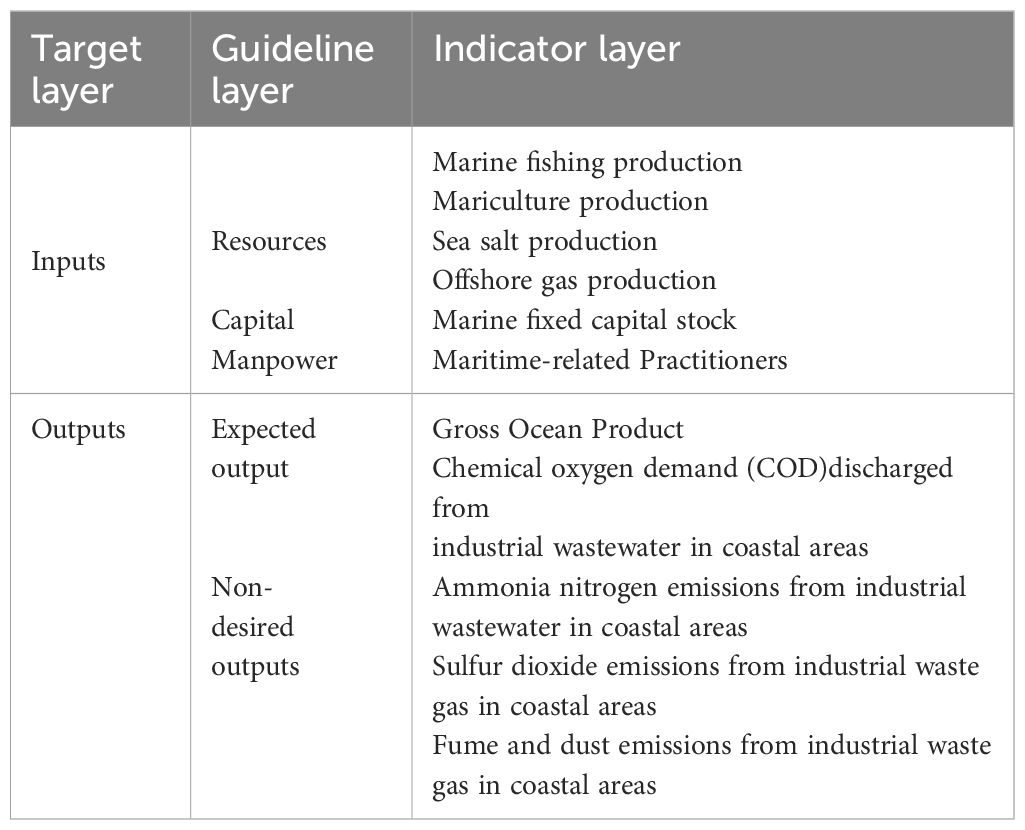
Table 4 Marine eco-efficiency input-output indicator system.
According to the characteristics of the production and operation of the marine economy, the statistical indicators of resource consumption related to economic activities such as marine fisheries, marine salt industry and marine oil and gas industry are selected as resource inputs; because marine economic production activities do not depend directly on current investments, but more on the fixed capital stock of the region, marine fixed capital stock is used as a capital input; use of marine-related practitioners as human input; using the gross marine product of the 11 coastal provinces as the desired output; with the increase of marine economic activities on land, but a large part of the resulting wastewater and waste gas pollution treatment costs are still transferred to the marine economy, so chemical oxygen demand and ammonia nitrogen emissions from industrial wastewater discharge in coastal areas and sulfur dioxide and soot emissions from industrial waste gas discharge in coastal areas are selected as non-desired outputs.
In order to minimize the number of input-output indicators, we use an improved entropy method to synthesize various marine resource inputs and industrial emissions from coastal areas into resource indicators and non-desired output indicators, respectively. Marine fixed capital stock is calculated using the equal capital production ratio method Zhang et al. (2004): is the sum of capital stock of 11 coastal provinces, and YN is the sum of gross marine product of 11 coastal provinces. Capital stock is calculated using the perpetual inventory method Kit= (1−δ)Kit−1 +Iit, Kit is the capital stock in year t in region i, δ is the depreciation rate (9.6%) Zhang et al. (2004), and Iit denotes the total capital formation in year t in region i (deflated by the fixed asset investment price index using 2006 as the base period). The initial capital stock is obtained by dividing the total fixed capital formation in the base year by 10%, using Young’s estimation method [Young (2003)]. The calculation of marine GDP is deflated by the GDP deflator of each province and region using 2006 as the base period.
3.4 Marine eco-efficiency analysis
Through calculation, the marine eco-efficiency of each province during 2008-2021 was obtained in this study as shown in the Table 5.
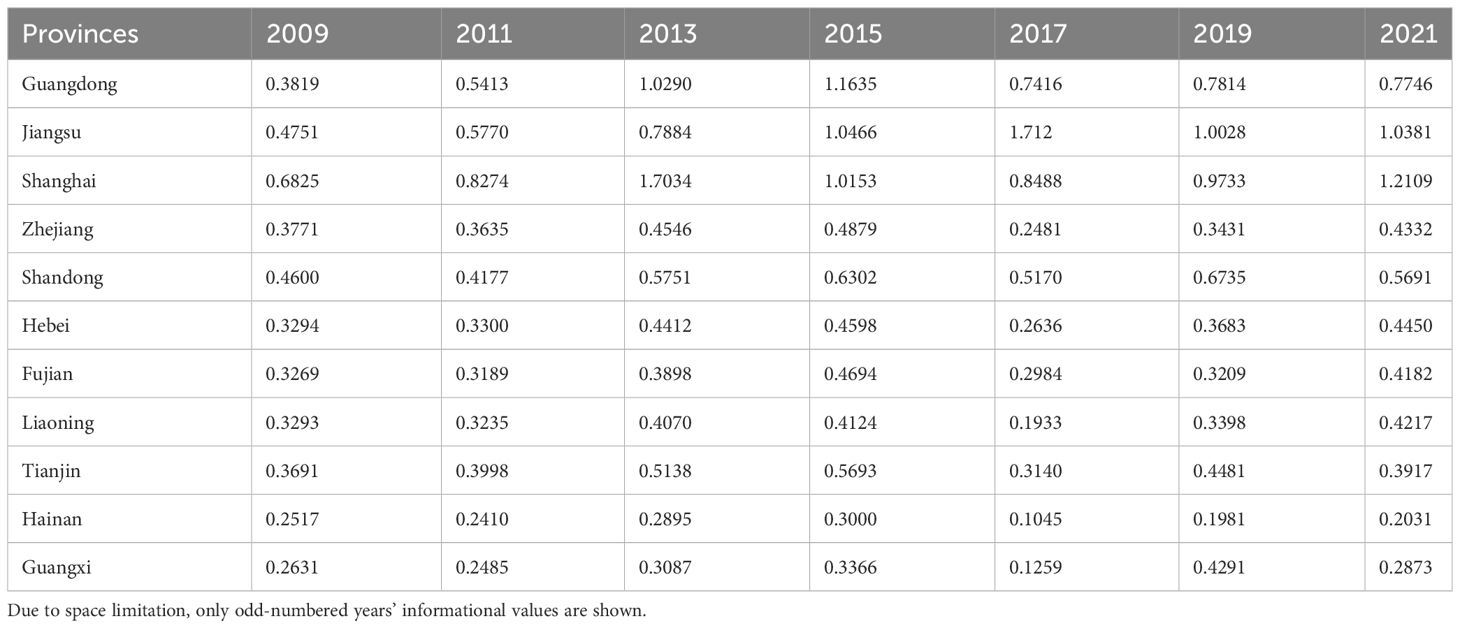
Table 5 Marine eco-efficiency values in 11 coastal provinces from 2008-2021.
The results show that the marine eco-efficiency of Guangdong, Jiangsu, Shanghai, and Shandong provinces is higher than the average level, with Shanghai having the highest marine eco-efficiency. China’s marine ecological environment policies consist of four categories of policies: marine pollution prevention and control, marine ecological protection, marine resource development, and land source planning related to the sea. Due to the shift of policy focus to deepening the construction of the rule of law in the ocean in 2016, and the large-scale adjustment of China’s administrative structure in 2018, there were many discontinuous phenomena in the number and distribution of policy subjects. As for the various links of the marine ecological environment policy chain, the number and functional allocation of policy subjects in their distribution showed discontinuity. Therefore, the marine eco-efficiency of various coastal provinces decreased after 2015, After 2018, there has been a slight rebound. Overall, the marine eco-efficiency of 11 coastal provinces showed an upward trend.
4 The impact of informatization on marine eco-efficiency
4.1 Theoretical mechanism of informatization on marine ecological efficiency
Marine informatization is a means of enhancing marine resource management and protecting the marine ecological environment through modern information technology. It includes the collection, processing, and analysis of marine data, as well as the application of this data, in order to improve the efficiency of marine ecology. The following are some key theoretical mechanisms that illustrate how ocean informatization affects marine ecological efficiency:
Data collection and monitoring: Ocean informatization achieves continuous monitoring of the marine environment through technologies such as satellite remote sensing, underwater drones, and sensor networks. This comprehensive data collection helps scientists better understand the state of marine ecosystems and develop more effective protection measures [Han and Zhang (2015); Bai et al. (2020)]. Resource management optimization: By utilizing information technology tools, it is possible to more accurately assess the distribution and sustainability of marine resources. This helps to develop reasonable development plans, reduce damage to marine ecology, and improve the efficiency of resource utilization [Gilman et al. (2020); Schwing (2023)]. Early warning and disaster prevention and control: Marine information technology can predict natural disasters in advance, such as tsunamis, hurricanes, etc., issue timely warnings, and reduce the damage of disasters to marine ecosystems [Schwing (2023)]. Environmental protection and restoration: Information technology supports the implementation of environmental protection actions, such as precise positioning and management of polluted areas. At the same time, informatization can also monitor the effectiveness of ecological restoration work, ensuring the correct implementation and effectiveness of ecological restoration measures [Lange et al. (2023)]. Policy formulation and implementation monitoring: Marine informatization provides a real-time and dynamic decision support system, allowing policy makers to formulate or adjust policies based on the latest scientific data. At the same time, information tools can also monitor policy implementation to ensure the achievement of policy objectives [Zou (2012); Ma (2020)].
Through the above mechanisms, ocean informatization can not only improve the efficiency of marine resource development and utilization, but more importantly, effectively protect and improve the marine ecological environment. This is a key way to achieve sustainable development of the ocean.
4.2 Methods
PVAR model is a model method for empirical analysis of panel data developed on the basis of VAR model [Love and Zicchino (2006)]. It not only has the advantages of VAR model, but also allows the lag coefficient to change with time, and has less stringent requirements on the time stationarity of data than other models. Because there are certain deviations in the availability and accuracy of the display data, this also highlights the advantages of the PVAR model for the higher possibility of obtaining empirical results, and will not be unable to obtain results due to excessive data requirements.The endogeneity issues is effectively solved by introducing lag terms [Ye et al. (2023)]. The empirical analysis in this paper uses panel data, which contains more time dimensions and information. This also makes panel data increase the reliability of empirical results and reduce data generation errors when analyzing the dynamic relationship between variables because there are more observations. Therefore, this study used the PVAR model to analyze the data, and investigated the endogenous dynamic effects of informatization and Marine eco-efficiency. The model is constructed as follows:
where i denotes province and t denotes year; yi,t denotes two variables, informatization (fi) and marine eco-efficiency (mar), respectively; k represents the lag order; j represents a lag term; αj represents the parameter matrix of order j after; βi denotes individual fixed effects, reflecting differences across provinces; µt denotes the time effect, reflecting the characteristics of the variable in time; ϵi,t denotes the random perturbation term.
4.3 Analysis of the dynamic impact of informatization on marine eco-efficiency
Given the complexity of macroeconomic variables and the possible non-stationarity of the data, four-unit root tests: LLC, IPS, Fisher-ADF, and Fisher-PP, were chosen to test the stability of the panel data in order to ensure the validity of the model. To solve the heteroscedasticity problem, we took logarithmic treatment of the raw data, but it could not pass the smoothness test. After further first-order differencing of the data, as shown in the Table 6, the data results all reject the original hypothesis of the existence of a unit root at the 1% significance level, indicating that both informatization and marine eco-efficiency are stable series.

Table 6 Panel unit root test.
Since the data are single integer of the same order at 1% level of significance, in order to avoid the phenomenon of pseudo-regression, three methods of kao test, Pedroni test, and Westerlund test are used in this study to test the cointegration of variables. The original hypothesis of the three tests is that there is no cointegration relationship between the variables. As shown in the Table 7, the results reject the original hypothesis at the 1% significance level, so there is a cointegration relationship in the panel data, indicating that there is a long-term equilibrium relationship between informatization and marine eco-efficiency, which can be estimated by regression on the panel data.
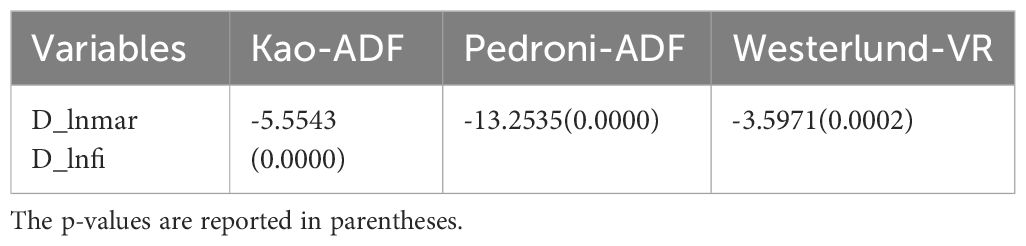
Table 7 Panel cointegration test.
The optimal lag order of the model must first be determined to estimate the PVAR model. The optimal lag order of the panel vector autoregressive model for 11 provinces is shown in the Table 8, and the PVAR model is estimated by selecting lag 5 according to the AIC, BIC, and HQIC criteria.

Table 8 Lag order test of informatization - marine eco-efficiency.
To ensure the accuracy of subsequent model estimation, impulse response, and variance decomposition, it is imperative to assess the robustness of the model by determining whether the eigenvalues of the dynamic matrix are less than 1 (confined within the unit circle). Figure 2 illustrates that the PVAR model employed in this research is trustworthy and appropriate for estimation, impulse response, and variance decomposition.
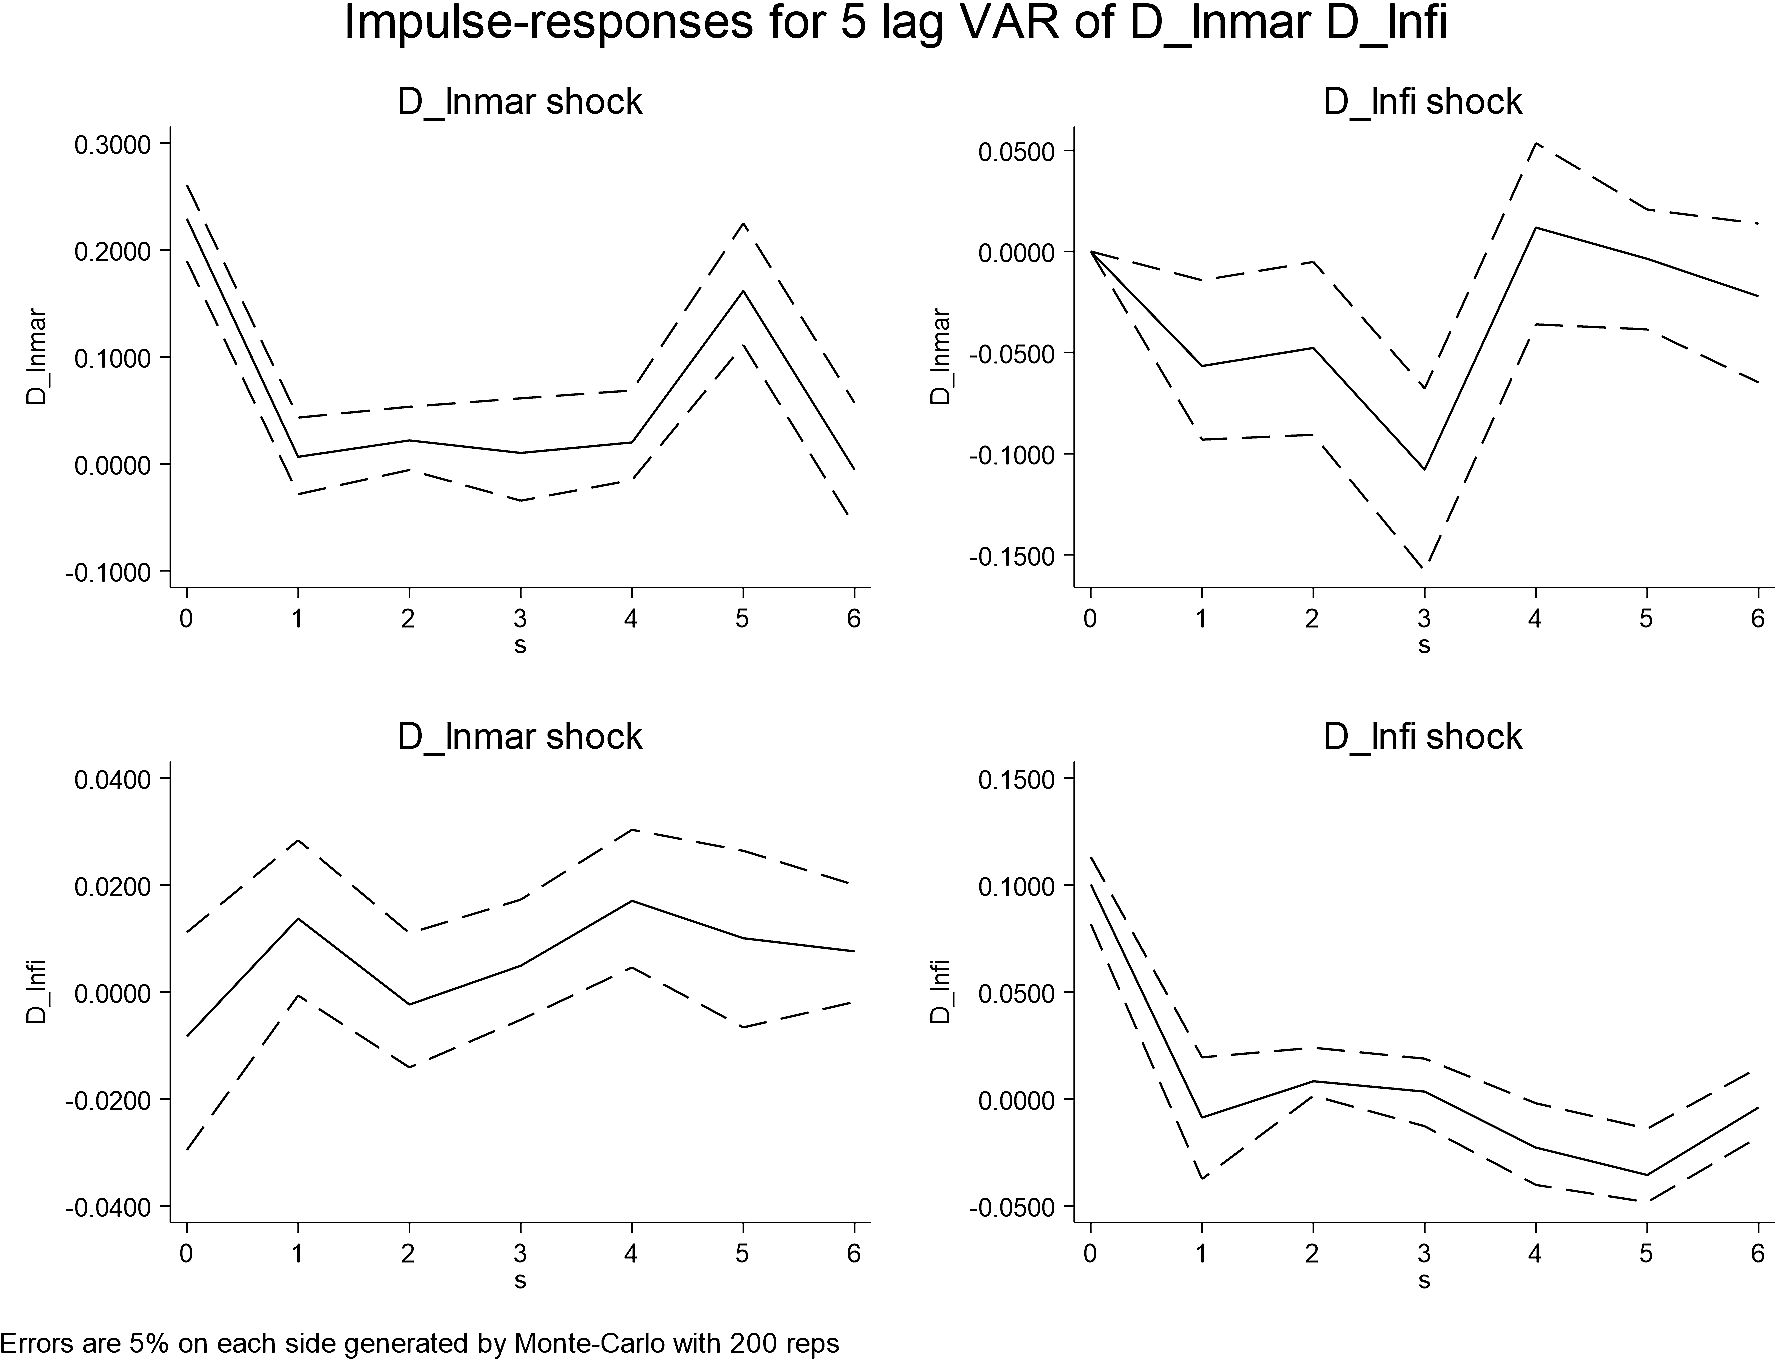
Figure 2 Robustness test.
After determining the optimal lag order, granger causality tests were done on the panel data to analyze the relationship between informatization and marine eco-efficiency. As shown in the Table 9, informatization is the Granger cause of marine eco-efficiency at 5% significance level, while marine eco-efficiency is not the Granger cause of informatization, and the two are univariate causality.
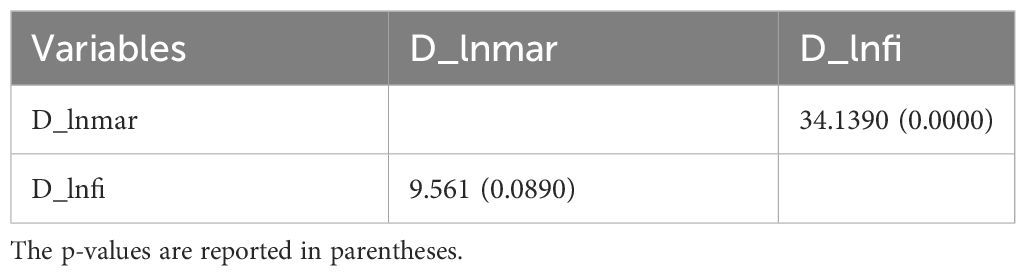
Table 9 Panel Granger causality test.
Further GMM estimation of the model was performed. The variables h_D_lnmar and variable h_D_lnfi were obtained after performing the helmert transformation to eliminate individual fixed effects, and the following results (Table 10) were obtained by GMM estimation.
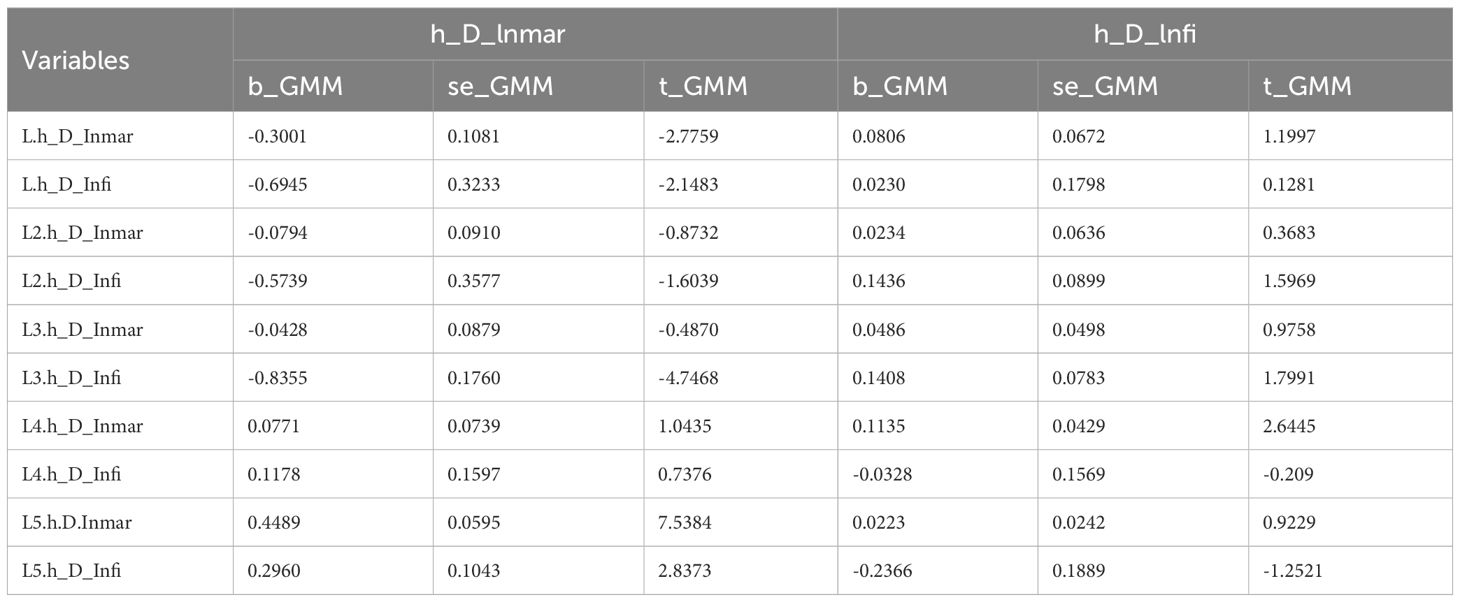
Table 10 Estimated results of PVAR.
When h_D_lnmar is the explanatory variable, L5. h_D_lnmar and L5. h_D_lnfi at a 1% level of significance has a significant positive impact on h_D_lnmar. The impact of five lagging periods of informatization on the current marine eco-efficiency is 0.2960, indicating that informatization can significantly promote the improvement of marine eco-efficiency. When h_D_lnfi is the explanatory variable, at the 1% significance level, L4. h_D_lnmar has a significant positive impact on h_D_lnfi. The impact of four periods of lagging marine eco-efficiency on current informatization is 0.1135, indicating that marine eco-efficiency has a promoting effect on the development of informatization.
The impulse response function describes the impact and effect of one endogenous variable in the model on the other endogenous variables in the model in the current and future periods after being subjected to a standard deviation of orthogonalized impulses. The interaction between the variables can be analyzed with the help of impulse response functions. Impulse response analysis was performed separately for the variables in the model, and in order to observe the long-term trend of the impulse response, the observation period was set to six periods, and a separate positive pulse of one unit was performed for the variables in the base period, respectively, and the impulse response plots with 95% confidence intervals were obtained after 200 random simulations of the Monte Carlo model (Figure 3).

Figure 3 Impulse response function of informatization and ocean eco-efficiency.
The Figure 3 shows that the impact of informatization on itself reaches its maximum in the current period, and then shows a rapid downward trend with gradually weakening fluctuations; the impact of marine eco-efficiency on itself reaches its maximum in the current period, followed by a rapid downward trend, and then produces a positive fluctuation; the pulse shock of informatization has a negative effect on marine eco-efficiency in the current period and lasts until the third period, and produces positive fluctuations in the fourth period, which indicates that informatization has some inhibitory effect on marine eco-efficiency in the short term, but the overall effect of informatization on marine eco-efficiency is promoted; the pulse shock of marine eco-efficiency has a significant positive effect on informatization, indicating that the improvement of marine eco-efficiency is beneficial to the development of informatization.
The variance decomposition is utilized to further evaluate the significance of different structural shocks by analyzing the contribution of each structural shock to the changes in endogenous variables. The variance decomposition analysis based on the impulse response function yields the following results (Table 11).
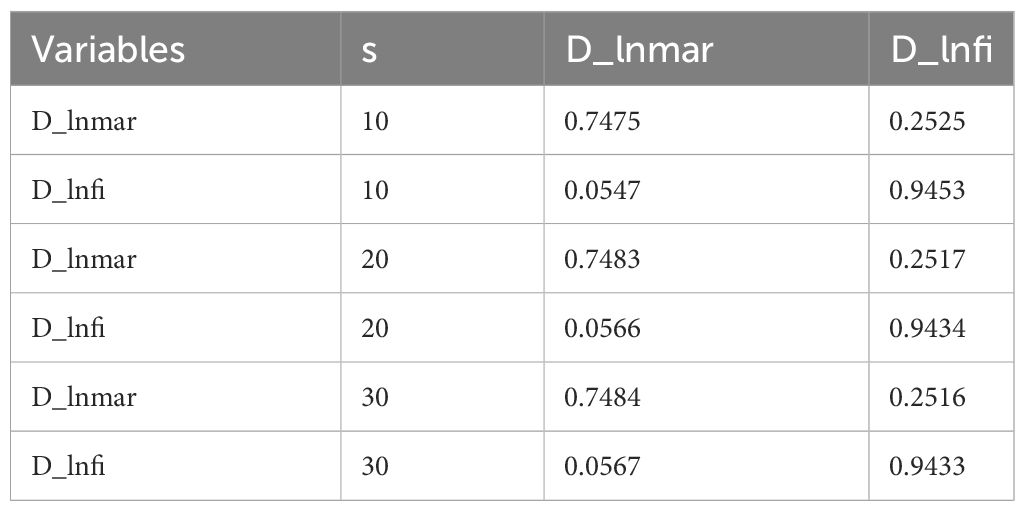
Table 11 Variance decomposition results for PVAR.
The variance decomposition shows the predicted results for the 10th, 20th, and 30th periods. The results show that the contribution rate of informatization to marine eco-efficiency is stable at 5%, while the contribution rate of marine eco-efficiency to informatization is stable at 25%, indicating a two-way relationship between the two. Therefore, the improvement of informatization will promote the improvement of marine eco-efficiency, while the improvement of marine eco-efficiency is also conducive to the development of informatization.
5 Conclusions, policy implications, limitations
5.1 Conclusions
This study examines the dynamic relationship between informatization and marine eco-efficiency. Based on the panel data of 11 Chinese coastal provinces from 2008 to 2021, the level of informatization was measured and evaluated using the improved entropy method, the level of marine eco-efficiency was measured and evaluated using the Malmquist index, and finally, the dynamic relationship between informatization and marine eco-efficiency was empirically analyzed using the PVAR model, and the following main conclusions were drawn. The overall level of informatization in China’s coastal provinces shows a significant upward trend of fluctuations. Based on the weight, the impact of the four primary indicators on informatization is sequentially as follows: research environment level, industrial operation level, infrastructure level, and social application level. The results indicate that only Guangdong, Jiangsu, Zhejiang, and Shandong provinces are above the average level, reflecting that the overall level of informatization in China’s coastal provinces is not high. The trend of changes in marine eco-efficiency in 11 coastal provinces of China is roughly the same as the trend of changes in informatization level. There are significant differences in marine eco-efficiency among different provinces, with Guangdong, Shanghai, and Jiangsu having the highest level of development, while Liaoning, Hainan, and Guangxi have lower levels of marine ecological development. This suggests that the level of marine ecological development in China’s coastal provinces is uneven, with each province placing varying degrees of importance on the construction of ecological civilization. There is a long-term equilibrium relationship between informatization and marine eco-efficiency, and informatization is the Granger reason for marine eco-efficiency at a significant level of 5%. The GMM results indicate that informatization significantly drives marine eco-efficiency at a level of 1%. Additionally, marine eco-efficiency has a positive impact on informatization construction. Through pulse response analysis, it was found that informatization exhibits a certain inhibitory effect on marine eco-efficiency in the short term, but ultimately presents a promoting effect. The results of variance decomposition further reveal a bidirectional positive relationship between informatization and marine eco-efficiency.
5.2 Policy implications
To effectively promote the development of informatization, facilitate the construction of marine ecological civilization, reduce regional disparities, and achieve balanced development among provinces, we propose the following policy recommendations.
Firstly, the government should provide support for the construction of information infrastructure, enhance the application level of information infrastructure, promote the use of network thinking among individuals, establish a platform for public communication, and mobilize public participation. At the same time, it is important to consider strengthening the participation and contribution of enterprises to marine ecological civilization.
Secondly, it is necessary to adjust measures to local conditions and promote balanced development among regions. Through a comprehensive analysis of the regional economic level and development advantages, different marine ecological protection strategies will be formulated based on the characteristics of each province. Scientific supporting policies will be formulated, resources in each province will be reasonably allocated, technological innovation investment will be increased, and existing information silos will be eliminated through the establishment of big data ecological centers. This approach will enable the full process management of relevant business data in various fields of ecological civilization, from collection, processing, aggregation, release to exchange and sharing.
Finally, we strongly believe that it is crucial to increase research investments and accelerate the development of emerging marine industries, as well as the exploration and utilization of marine renewable resources. To this end, we will intensify our research and development efforts in domestic scientific and technological equipment, achieve key breakthroughs in core technologies, fill gaps in the domestic scientific and technological field, obtain a series of original technologies and invention patents. By utilizing universities as platforms, we will strengthen our exchanges with countries around the world, attract high-level talents from countries around the world, and strive to create distinctive ocean majors.
5.3 Limitations
Our study did not address the spatial and temporal evolution and spatial layout of informatization and marine eco-efficiency. In the next work, we can further investigate the influence between informatization and marine eco-efficiency through the spatial Durbin model while more comprehensive analysis and evaluation.
Data availability statement
The original contributions presented in the study are included in the article/supplementary material. Further inquiries can be directed to the corresponding author.
Author contributions
BD: Conceptualization, Data curation, Methodology, Writing – original draft, Writing – review & editing, Software. JC: Conceptualization, Data curation, Methodology, Resources, Supervision, Writing – original draft, Writing – review & editing, Software, Validation. GC: Data curation, Software, Writing – review & editing. CM: Funding acquisition, Resources, Writing – review & editing.
Funding
The author(s) declare financial support was received for the research, authorship, and/or publication of this article. This study was supported by The Natural Science Foundation of Shandong Province (No. ZR2020MA024).
Conflict of interest
The authors declare that the research was conducted in the absence of any commercial or financial relationships that could be construed as a potential conflict of interest.
Publisher’s note
All claims expressed in this article are solely those of the authors and do not necessarily represent those of their affiliated organizations, or those of the publisher, the editors and the reviewers. Any product that may be evaluated in this article, or claim that may be made by its manufacturer, is not guaranteed or endorsed by the publisher.
References
Ahmed Z., Nathaniel S. P., Shahbaz M. (2021). The criticality of information and communication technology and human capital in environmental sustainability: evidence from latin american and caribbean countries. J. Cleaner Production 286, 125529. doi: 10.1016/j.jclepro.2020.125529
Aimin W. (2016). Research on the coordination and interaction mechanism between marine technology and marine economy. China Soft Sci. 8, 40–49. doi: 10.3969/j.issn.1002-9753.2016.08.004
Aldakhil A. M., Zaheer A., Younas S., Nassani A. A., Abro M. M. Q., Zaman K. (2019). Efficiently managing green information and communication technologies, high-technology exports, and research and development expenditures: A case study. J. Cleaner Production 240, 118164. doi: 10.1016/j.jclepro.2019.118164
Bai L., Han R., Liu J., Choi J., Zhang W. (2020). Random access and detection performance of internet of things for smart ocean. IEEE Internet Things J. 7, 9858–9869. doi: 10.1109/JIoT.6488907
Belucio M., Rodrigues C., Antunes C. H., Freire F., Dias L. C. (2021). Eco-efficiency in early design decisions: A multimethodology approach. J. Cleaner Production 283, 124630. doi: 10.1016/j.jclepro.2020.124630
Biao H., Yeteng F. (2016). Measurement of ecological efficiency in China and empirical analysis of spatial differences based on sbm model and spatial autocorrelation. J. arid land Resour. Environ. 30, 6–12. doi: 10.13448/j.cnki.jalre.2016.173
Carauta M., Grovermann C., Heidenreich A., Berger T. (2022). How eco-efficient are crop farms in the southern amazon region? insights from combining agent-based simulations with robust order-m eco-efficiency estimation. Sci. Total Environ. 819, 153072. doi: 10.1016/j.scitotenv.2022.153072
Chen P., Xie R., Lu M., Huang Z. (2021). The impact of the spatio-temporal neighborhood effect on urban eco-efficiency in China. J. cleaner production 285, 124860. doi: 10.1016/j.jclepro.2020.124860
China Ocean Yearbook Editorial Committee (2021). China ocean Yearbook. No.57 Yuetan Nanjie, Sanlihe, Beijing 100826, P. R. China: China Statistics Press.
Dataset National Bureau of Statistics of China (2021). National Bureau of Statistics of CHINA. No.57 Yuetan Nanjie, Sanlihe, Beijing 100826, P. R. China: China Statistics Press.
Defeng Z., Shuai H., Caizhi S., Leting L. (2018). Spatial-temporal evolution analysis and trend prediction of ecological efficiency in chinese mainland. Geographical Res. 37, 1034–1046. doi: 10.11821/dlyj201805014
Gilman E., Castejón V. D. R., Loganimoce E., Chaloupka M. (2020). Capability of a pilot fisheries electronic monitoring system to meet scientific and compliance monitoring objectives. Mar. Policy 113, 103792. doi: 10.1016/j.marpol.2019.103792
Guo X. (1998). Application of improved entropy method in evaluation of economic result. Syst. Engineering-Theory Pract. 18, 98–102. doi: 10.1088/0256-307X/16/9/020
Han H., Zhang L. (2015). Analysis of threshold effect of agricultural informatization on agricultural total factor productivity growth. Chin. Rural Economy 8, 23. doi: CNKI:SUN:ZNJJ.0.2015-08-005
He X., Ping Q., Hu W. (2022). Does digital technology promote the sustainable development of the marine equipment manufacturing industry in China? Mar. Policy 136, 104868. doi: 10.1016/j.marpol.2021.104868
Ji J., Li Y. (2021). The development of China’s fishery informatization and its impact on fishery economic efficiency. Mar. Policy 133, 104711. doi: 10.1016/j.marpol.2021.104711
Lange M., Cabana D., Ebeling A., Ebinghaus R., Joerss H., Rölfer L., et al. (2023). Climatesmart socially innovative tools and approaches for marine pollution science in support of sustainable development. Cambridge Prisms: Coast. Futures 1, e23. doi: 10.1017/cft.2023.11
Lin Z., Yushuo Z., Di W., Yongming W., Dianting W. (2016). Measurement and spatiotemporal characteristics of inter provincial marine economic efficiency in China considering unexpected outputs. Geographic Sci. 36, 671–680. doi: 10.13249/j.cnki.sgs.2016.05.004
Liu X., Guo P., Guo S. (2019). Assessing the eco-efficiency of a circular economy system in China’s coal mining areas: Emergy and data envelopment analysis. J. Cleaner Production 206, 1101–1109. doi: 10.1016/j.jclepro.2018.09.218
Liu J., Zhang J., Fu Z. (2017). Tourism eco-efficiency of chinese coastal cities–analysis based on the dea-tobit model. Ocean Coast. Manage. 148, 164–170. doi: 10.1016/j.ocecoaman.2017.08.003
Love I., Zicchino L. (2006). Financial development and dynamic investment behavior: Evidence from panel var. Q. Rev. Economics Finance 46, 190–210. doi: 10.1016/j.qref.2005.11.007
Ma J. (2020). Research on marine ecological civilization policies in shandong province based on content analysis. Open J. Ecol. 10, 264–288. doi: 10.4236/oje.2020.105017
Ma C., Dai Y., Li Z. (2022). Financing format selection for electronic business platforms with a capital-constrained e-tailer. Transportation Res. Part E: Logistics Transportation Rev. 162, 102720. doi: 10.1016/j.tre.2022.102720
Ma C., Sun Q., Xu M., Dai Y., Zhang M. (2023). Strategic selling agreement and information management under leakage in an e-commerce supply chain. Electronic Commerce Res. Appl. 61, 101288. doi: 10.1016/j.elerap.2023.101288
Ma C., Yang H., Zhang W., Huang S. (2021). Low-carbon consumption with government subsidy under asymmetric carbon emission information. J. Cleaner Production 318, 128423. doi: 10.1016/j.jclepro.2021.128423
Mei G., Yarong Z. (2019). Analysis of spatial pattern evolution and influencing factors of marine ecological efficiency in coastal provinces and regions of China. Geographic Sci. 39, 616–625. doi: 10.13249/j.cnki.sgs.2019.04.011
Ministry of Natural Resources (2022). 2021 CHINA Marine Economic Statistics Bulletin. The state council the people’s republic of China: Tech. rep.
National Bureau of Statistics of China (2021a). China environmental statistical yearbook. No.57 Yuetan Nanjie, Sanlihe, Beijing 100826, P. R. China: China Statistics Press.
National Bureau of Statistics of China (2021b). China Statistical Yearbook. No.57 Yuetan Nanjie, Sanlihe, Beijing 100826, P. R. China: China Statistics Press.
National Bureau of Statistics of China (2021c). China Statistical Yearbook for Ocean. No.57 Yuetan Nanjie, Sanlihe, Beijing 100826, P. R. China: China Statistics Press.
National Bureau of Statistics of China (2021d). China Statistical Yearbook for Regional Economy. No.57 Yuetan Nanjie, Sanlihe, Beijing 100826, P. R. China: China Statistics Press.
National Bureau of Statistics of China (2021e). China Statistical Yearbook for Society. No.57 Yuetan Nanjie, Sanlihe, Beijing 100826, P. R. China: China Statistics Press.
National Bureau of Statistics of China (2021f). China Statistical Yearbook for Technology. No.57 Yuetan Nanjie, Sanlihe, Beijing 100826, P. R. China: China Statistics Press.
National Bureau of Statistics of China (2021g). Statistical Yearbook of CHINA’s Third Industry. No.57 Yuetan Nanjie, Sanlihe, Beijing 100826, P. R. China: China Statistics Press.
Niu P., Zhu J., Sun Y. (2021). Dynamic modeling and chaos control of informatization development in manufacturing enterprises. Entropy 23, 681. doi: 10.3390/e23060681
Qiao F., Liu J., Ma Y. (2021). Industrial big-data-driven and cps-based adaptive production scheduling for smart manufacturing. Int. J. Production Res. 59, 7139–7159. doi: 10.1080/00207543.2020.1836417
Qin M., Sun M. (2021). Effects of marine ranching policies on the ecological efficiency of marine ranching—based on 25 marine ranching in shandong province. Mar. Policy 134, 104788. doi: 10.1016/j.marpol.2021.104788
Qin M., Sun M., Li J. (2021). Impact of environmental regulation policy on ecological efficiency in four major urban agglomerations in eastern China. Ecol. Indic. 130, 108002. doi: 10.1016/j.ecolind.2021.108002
Qingfeng W., Zhuchang T. (2014). Two new methods for estimating capital stock k under the absence of investment information. Quantitative Tech. economics 31, 150–160. doi: CNKI:SUN:SLJY.0.2014-09-010
Qingyun Y., Xixi H., Xiren J., Wenpeng S., Liang Q., Xiaosong M. (2020). Design of jiaozhou bay marine ecological protection information platform. Mar. Dev. Manage. 37, 33–37. doi: 10.20016/j.cnki.hykfygl.2020.08.006
Schwing F. B. (2023). Modern technologies and integrated observing systems are “instrumental“ to fisheries oceanography: A brief history of ocean data collection. Fisheries Oceanography 32, 28–69. doi: 10.1111/fog.12619
Sun C., Wang S., Zou W., Wang Z. (2017). Estimating the efficiency of complex marine systems in China’s coastal regions using a network data envelope analysis model. Ocean Coast. Manage. 139, 77–91. doi: 10.1016/j.ocecoaman.2017.02.005
Taleb T., Afolabi I., Bagaa M. (2019). Orchestrating 5g network slices to support industrial internet and to shape next-generation smart factories. IEEE Network 33, 146–154. doi: 10.1109/MNET.65
Wang Z., Feng C., Zhang B. (2014). An empirical analysis of China’s energy efficiency from both static and dynamic perspectives. Energy 74, 322–330. doi: 10.1016/j.energy.2014.06.082
Wang G., Li S., Ma Q. (2018). Spatial-temporal evolution of chinese eco-efficiency from the perspective of human well-being. Sci. Geogr. Sin. 38, 1597–1605. doi: 10.13249/j.cnki.sgs.2018.10.003
Wu D., Zhu J. (2020). Technical efficiency evolution model of the integration of information technology and manufacturing technology. Math. Problems Eng. 2020, 1–24. doi: 10.1155/2020/4905195
Xiao H., Wang D., Qi Y., Shao S., Zhou Y., Shan Y. (2021). The governance-production nexus of eco-efficiency in chinese resource-based cities: A two-stage network dea approach. Energy Economics 101, 105408. doi: 10.1016/j.eneco.2021.105408
Xiaodi Z. (2015). Industry and factor driven changes in ecological efficiency: based on input-output and system optimization models. J. Natural Resour. 30, 748–760. doi: 10.11849/zrzyxb.2015.05.004
Xiaozhong L., Qingjun L. (2016). Research on the coupling and coordinated development of informatization and industrial transformation and upgrading in China. Resource Dev. Market 32, 971–977. doi: 10.3969/j.issn.1005-8141.2016.08.015
Xu J., Han L., Yin W. (2022). Research on the ecologicalization efficiency of mariculture industry in China and its influencing factors. Mar. Policy 137, 104935. doi: 10.1016/j.marpol.2021.104935
Yanqun L., Peng Y. (2017). Spatial econometric analysis of industrial ecological efficiency and influencing factors in chinese provinces. Resource Sci. 39, 1326–1337. doi: 10.18402/resci.2017.07.10
Ye M., Cai J., Wang K., Wang X. (2023). Green finance, economic growth, and carbon emissions: a pvar analysis. Environ. Sci. pollut. Res. 30, 119419–119433. doi: 10.1007/s11356-023-30719-x
Young A. (2003). Gold into base metals: Productivity growth in the people’s republic of China during the reform period. J. political economy 111, 1220–1261. doi: 10.1086/378532
Yuanyuan S. (2016). Empirical analysis of the impact of informatization on China’s tourism market. Tourism Sci. 30, 1–12+27. doi: 10.16323/j.cnki.lykx.2016.03.001
Yufei R., Chuanglin F. (2017). Ecological efficiency evaluation and spatial pattern analysis at the county level in the beijing tianjin hebei urban agglomeration. Prog. Geographic Sci. 36, 87–98. doi: 10.18306/dlkxjz.2017.01.009
Zeyu W., Ganggang J. (2019). Research on the coordinated response relationship between marine economy and informatization in coastal provinces and regions of China. Resource Dev. Market 35, 347–352. doi: 10.3969/j.issn.1005-8141.2019.03.009
Zeyu W., Xuefeng L., Caizhi S., Zenglin H., Xiaofei D. (2017). The evolution and influencing factors of the center of gravity of China’s marine economy. Economic Geogr. 37, 12–19. doi: 10.15957/j.cnki.jjdl.2017.05.002
Zeyu W., Zhen Z., Zenglin H., Caizhi S., Yingrui L. (2016). Response measures of the marine economy to regional economic development. Resour. Sci. 38, 1832–1845. doi: 10.18402/resci.2016.10.02
Zhang J., Wu G., Zhang J. (2004). Interprovincial physical capital stock estimation in China: 1952–2000. Econ. Res. 10, 35–44. doi: CNKI:SUN:JJYJ.0.2004-10-004
Zhu J., Liu W., Li Y., Sun Y. (2020). Exploring robustness management for dynamic technology fusion. Nonlinear Dynamics 102, 2969–3011. doi: 10.1007/s11071-020-05978-9
Keywords: informatization, marine eco-efficiency, Malmquist index, panel vector autoregressive model, entropy method
Citation: Dai B, Cao J, Chen G and Ma C (2024) Study on the relationship between informatization and marine eco-efficiency in China–taking 11 coastal provinces as examples. Front. Mar. Sci. 11:1362554. doi: 10.3389/fmars.2024.1362554
Received: 08 January 2024; Accepted: 17 April 2024;
Published: 02 May 2024.
Edited by:
Wen-Hong Liu, National Kaohsiung University of Science and Technology, TaiwanReviewed by:
Yi-Che Shih, National Cheng Kung University, TaiwanWei Xing, China University of Petroleum (East China), China
Copyright © 2024 Dai, Cao, Chen and Ma. This is an open-access article distributed under the terms of the Creative Commons Attribution License (CC BY). The use, distribution or reproduction in other forums is permitted, provided the original author(s) and the copyright owner(s) are credited and that the original publication in this journal is cited, in accordance with accepted academic practice. No use, distribution or reproduction is permitted which does not comply with these terms.
*Correspondence: Jifeng Cao, MTMzMDUzMjExMzJAMTYzLmNvbQ==