 Fengli Ge1,2
 Juan Li
- 1College of Mechanical and Electrical Engineering, Qingdao Agricultural University, Qingdao, China
- 2College of Management, Qingdao Agricultural University, Qingdao, China
- 3College of Marine Science and Engineering, Qingdao Agricultural University, Qingdao, China
- 4Fisheries Research Institute of Fujian, Key Laboratory of Cultivation and High-Value Utilization of Marine Organisms in Fujian Province, Xiamen, China
Skin ulceration syndrome of sea cucumbers is one of the most serious diseases in intensive aquaculture, and it is the most effective way of preventing the spread of this disease to detect the abnormal behavior of sea cucumbers in time and take corresponding measures. However, the detection and tracking of multi-object is a hard problem in sea cucumber behavior analysis. To solve this problem, this paper first proposes a novel one-stage algorithm SUS-YOLOv5 for multi-object detection and tracking of sea cucumbers. The proposed SUS-YOLOv5 optimizes the maximum suppression algorithm in the overlapping region of the object detection box. Next, the SE-BiFPN feature fusion structure is proposed to enhance the transmission efficiency of feature information between deep and shallow layers of the network. Then, a MO-Tracking algorithm is proposed integrated with DeepSORT to achieve real-time multi-object tracking. Experimental results show that the mAP@0.5 and mAP@0.5:0.95 of the proposed object detector reach 95.40% and 83.80%, respectively, which are 3.30% and 4.10% higher than the original YOLOv5s. Compared with the traditional SSD, YOLOv3, and YOLOv4, the mAP of SUS-YOLOv5 is improved by 5.49%, 1.57%, and 3.76%, respectively. This research can realize the multi-object detection and tracking, which lays the foundation for the prediction of skin ulceration syndrome in sea cucumbers and has a certain practical application value for improving the intelligence level of aquaculture.
1 Introduction
Sea cucumbers have high edibility and medicinal value and are the precious seafood (Zhu et al., 2020; Li et al., 2021). According to the Food and Agriculture Organization of the United Nations, the production of sea cucumbers in the world reached 40,000 tons in 2020 (FAO, 2022). In recent years, as the improvement of living standards of people, the demand has been increasing for sea cucumbers, which makes the farming area of sea cucumbers have been increasing. Whereas, there are some problems in intensive aquaculture, such as the slow growth speed and high incidence of disease (Wang et al., 2021). Among the diseases of sea cucumbers, skin ulceration syndrome (SUS) is one of the most serious diseases, which is caused by the infection of Vibrio alginolyticus. Vibrio alginolyticus is characterized by rapid and widespread infection (Lv et al., 2019), which will cause significant economic losses if farmers cannot detect SUS in time and take corresponding measures. Therefore, the prevention of SUS is of great significance in the cultivation process of sea cucumbers.
Recently, various fields have widely applied deep learning technology (Li et al., 2023), including tea buds detection (Xu et al., 2022), crop yield estimation (Hu et al., 2021; Gao et al., 2022), underwater image enhancement (Guo et al., 2020), industrial control (Zhao et al., 2017; Liu et al., 2021), human behavior detection (Yu and Lee, 2015) and new energy (Ma et al., 2022) and so on. In particular, with the development of intelligent aquaculture, some scholars have started to use artificial intelligence technology to diagnose diseases in aquaculture (Li and Du, 2022). For example, a diagnosis system for fish disease is developed based on image processing technology (Park et al., 2007), which extracted the pathogenic areas from microscopic images of infected fish tissues and matches them quickly in a database. A 3D computer vision system is established to monitor the movement of fish and control the dissolved oxygen in aquaculture based on breeding experience (Bao et al., 2018). Deep learning technology is used to detect fish in an abnormal environment with high levels of ammonia nitrogen and a 3D behavioral trajectory of the fish is plotted, providing a new approach for animal behavior analysis (Xu et al., 2020). Li et al. (2020) propose a framework of deep learning based on Faster R-CNN for detecting, localizing, and analyzing sea cucumbers behavior trajectories, providing important information for sea cucumbers cultivation, status monitoring, and early disease warning. The above researches and related researches indicate that timely detecting of abnormal behavior of underwater animals and taking corresponding preventive measures are of great significance for ensuring the healthy and sustainable development of aquaculture. However, the existing approaches of the object tracking focus on the single object for sea cucumbers, and we have not seen the object tracking and behavior analysis researches for multiple sea cucumbers.
As we all know, the key to object tracking and behavior analysis is object detection. Therefore, underwater object detection technology has become an important research direction based on deep learning, and some scholars have made some active explorations in this field. For example, Liu et al. (2020) propose a real-time method to monitor the invasion condition of marine organisms that combined image processing and deep learning, which achieves the calculation of marine organism density, detection, and measurement of marine organism species. This approach provides a warning reference for the invasion of biological in the coastal area. Xu et al. (2023) propose a multi-object behavioral tracking method based on automatic coordinate matching of frame. This method tracks multiple sea cucumbers and calculates their motions for quantitative and qualitative behavioral analysis. Zhang et al. (2020) propose a deep residual network with multiple forms and stochastic gradient descent (SGD) training algorithm for recognizing sea cucumbers on the seabed, which achieves an average accuracy of 97.90%, but the network is unable to achieve high accuracy in complex scenarios. To attain accurate quantitative detection for submarine benthic animals, Liu and Wang (2021) propose a quantitative detection algorithm for marine benthic animals based on Faster R-CNN, which improves the recognition accuracy of marine benthic animals from 93.25% to 96.32% and provides a new way to quantitatively detect small and dense objects in the seabed. Zeng et al. (2021) propose to add the adversarial occlusion network in the basic Faster R-CNN detection algorithm, which effectively prevents the detection network from over-fitting the generated fixed features and improves the mean average precision (mAP) of the object detection by 4.2% in complex underwater environments. Nevertheless, the above research on object recognition and detection doesn’t take into account the influence of noise, lighting, and other factors, which can affect the generalization ability of model. More importantly, the research on sea cucumbers with SUS using deep learning technology is still in the exploratory stage.
To solve the above problems, the behavior of sea cucumbers infected by Vibrio alginolyticus is studied in the laboratory environment. A new approach called SUS-YOLOv5 is proposed in this paper. The main contributions are fourfold: (1) to solve the problem that Non-Maximum Suppression (NMS) only considers the overlapping area of detection boxes to suppress errors, this paper proposes an improved YOLOv5s algorithm with Soft Non-Maximum Suppression (Soft-NMS), which gives different penalty degree for candidate boxes with different overlapping degrees; (2) to solve the loss problem which is caused by the different importance of feature maps from different channel during the convolution pooling process, a SUS-YOLOv5 approach is proposed to enhance the capability of feature information representation; (3) a SE-BiFPN feature fusion structure is proposed to enhance the transfer ability of feature information between the deep and shallow layers of the model, which avoids the loss of feature information and improves the detection accuracy of the object detection; and (4) the proposed SUS-YOLOv5 combined with the DeepSORT algorithm can achieve real-time multi-object tracking, compute and analyze the mean movement quantity under different infection conditions.
This research is structured as follows: a brief description of the experimental materials is provided and the proposed approach is outlined in section 2. In Section 3, the experimental platform is introduced and the evaluation criteria is brought in, offering a comprehensive analysis of the experimental results. Section 4 delves into the challenges encountered during the research and discusses avenues for future research. Finally, Section 5 concludes this study, summarizing the key findings and highlighting their significance.
2 Proposed method
In the series of YOLO (You Only Look Once), YOLOv1 lays the foundation for the entire series, and other versions of YOLO are improved based on the first version (Redmon et al., 2016). YOLOv1 innovatively uses the one-stage structure to accomplish the task of classification and object localization, but it has a smaller receptive field and the network losses are not specific (Ahmad et al., 2020). YOLOv2 introduces batch normalization while removing the fully-connected layer so as to further improve the model performance (Shi et al., 2021). YOLOv3 adds a detection box prediction function to YOLOv2 and uses the Darknet-53 to extract features (Tian et al., 2019). Based on the above object detection architecture, YOLOv4 incorporates many optimization algorithms in different aspects of data processing, backbone network training, activation functions, loss functions, and more (Guo et al., 2021). YOLOv5 has made some new improvements based on YOLOv4 so that its speed and accuracy have been greatly improved (Yuan et al., 2022).
YOLOv5 contains five network structures, i.e., YOLOv5n, YOLOv5s, YOLOv5m, YOLOv5l, and YOLOv5x, whose depth and width are progressively deepened and widened (Qu et al., 2022). Whereas, with the complexity upgrade of the YOLOv5 series, the detection accuracy improves, the detection speed decreases, and the requirements of hardware configuration become higher. Among the five kinds of YOLOv5, the YOLOv5s has a better real-time detection effect and saves the cost of training and deployment.
To improve the detection performance on sea cucumbers, the SUS-YOLOv5 is proposed based on YOLOv5s in this research, and the network structure of SUS-YOLOv5 is shown in Figure 1.
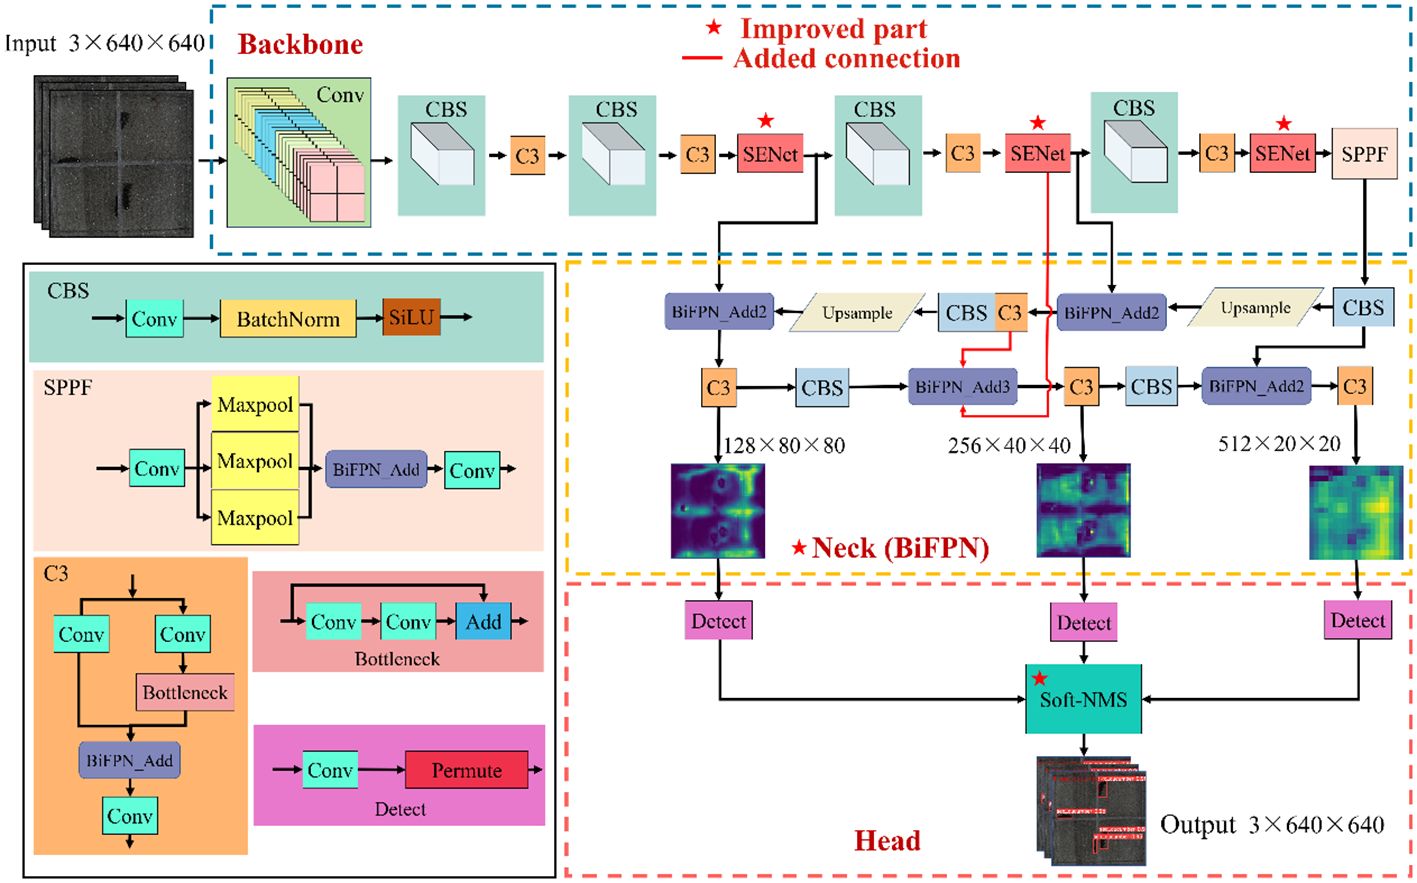
Figure 1 Structure of SUS-YOLOv5.
In Figure 1, the parts with an asterisk are the added or improved parts, and the sections with solid red lines are added links. The main improved parts of SUS-YOLOv5 are as follows.
2.1 Optimization of detection boxes
To select the best detection box from a set of overlapping boxes, the NMS used in YOLOv5s only considers the overlapping area of the detection frame, which often leads to false suppression and reduces the effect of object detection. To solve this above problem, the research proposes adding the Soft-NMS module to realize the NMS function, which accepts the intersection ratio of two object detection candidate boxes through the Gaussian function and makes different degrees of punishment. The Soft-NMS combines different penalties to modify the confidence of the object so that the best detection box is selected from a set of overlapping boxes.
NMS is mainly used for post-processing the output of the object detection model. In the prediction stage of object detection, many candidate anchor boxes will be output, among which some prediction detection boxes are overlapped around the same object. At this time, NMS can be used to merge similar detection boxes of the same object to remove redundant detection boxes and get correct detection results. The NMS processing method can be intuitively represented by the following score reset function,
In Equation 1, where i stands for the serial number of the remaining boxes with the highest score from high to low except for the box Λ. Λ represents the maximum score of the detection boxes. Δi is the score of detection boxes with the slightly lower score Λ. Nt stands for the threshold. s represents the confidence score.
However, the main drawback of NMS is that it only retains the highest confidence prediction box when objects are highly overlapped, which may lead to the deletion of similar but different objects. Therefore, the Soft-NMS is proposed to optimize the selection of detection boxes:
In Equation 2, one can see that the Soft-NMS does not directly delete the remaining detection boxes with the highest confidence ratio of the detection box, but it reduces the confidence of the remaining detection boxes and retains more prediction frames (Bodla et al., 2017). In this way, the situation of mistakenly deleting overlapping objects is avoided through great suppression. Equation 3 is then derived as follows:
where P is the final set of anchor frames, and ζ is the super parameter of Soft-NMS.
When the threshold of NMS is reached, a sudden penalty will be taken and the penalty function is continuous. The continuous penalty function will take a penalty when the anchor frame is highly overlapped, and it will not take a penalty when there is no overlap (Bodla et al., 2017). In addition, when the overlap is low, the penalty will gradually increase. An example of detecting overlapping boxes is shown in Figure 2.
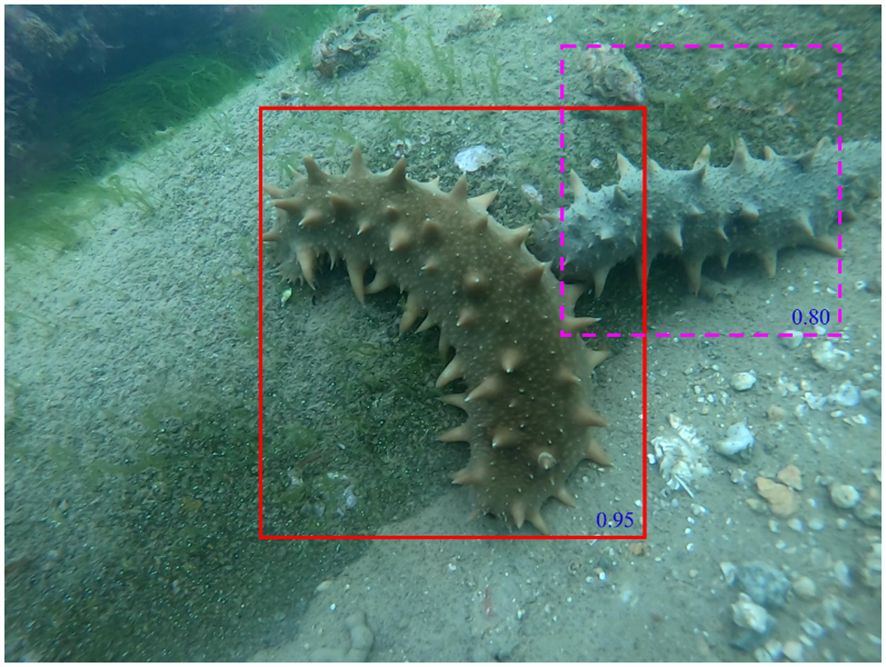
Figure 2 An example of detection overlapping box.
As shown in Figure 2, there are two detection boxes in this image, highlighted in red and purple, with respective scores of 0.95 and 0.80. Notably, the purple detection box exhibits substantial overlap with the red one. When using NMS, the choice of a threshold is critical. The threshold determines which bounding boxes are retained and which are suppressed. If the threshold is too low, too many frames may be retained, increasing false detections; if the threshold is too high, correct detections may be suppressed, leading to missed detections. Therefore, experimentally determining the optimal threshold is the key to balancing false detections and missed detections. Soft-NMS is an improvement of NMS, which does not suppress overlapping frames completely but rather reduces their scores, thus avoiding the problem of hard threshold setting.
2.2 Extraction of the effective feature of SUS-YOLOv5
In the traditional convolution pooling process, equal importance is typically assigned to each channel of the feature map. However, various channels have varying degrees of importance, and specific problems should be analyzed specifically in practice. To solve the loss problem stemming from the varying importance of feature map for different channels during convolution pooling, SUS-YOLOv5 incorporates SENet. This addition enhances the model’s capability to capture correlations of features and improves the representation of feature information.
The SENet introduces attention to the different dimensions of channels through key operations known as Squeeze and Excitation (Huang et al., 2022). Through automatic learning, the SENet makes the neural network focus on some feature channels. SENet can improve the channels of the feature map that are helpful for the current task, and it can suppress the unuseful feature channels for the current task. The SENet can bring a significant improvement in model performance with a slight increase in computing cost (Hu et al., 2018a, b).
Figure 3 shows the schematic diagram for the SENet module. Before the feature map from the backbone network is input into the SENet attention module. Before adding SENet attention, all channels in the feature map are treated equally despite of importance. However, after adding the SENet, the importance of individual feature channels becomes different. Different colors stands for different weights, which makes the neural network focus on some channels which have large weight values.
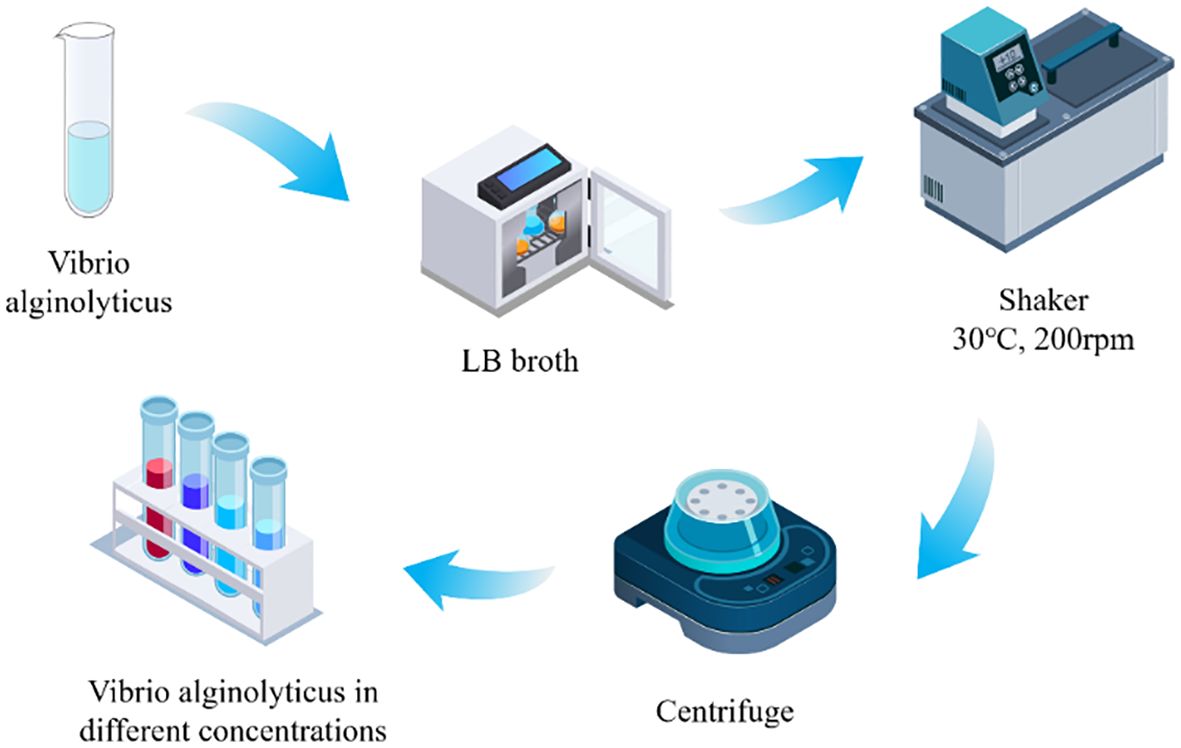
Figure 3 Schematic diagram of the bacterial liquid preparation process.
In Figure 4, X is the input feature map, and Fex represents the transformation of the feature map. U stands for C feature maps with H × W, and represents the feature map scaled by the activation function. Fsq represents the Squeeze operation, that is, as shown in Equation 4:
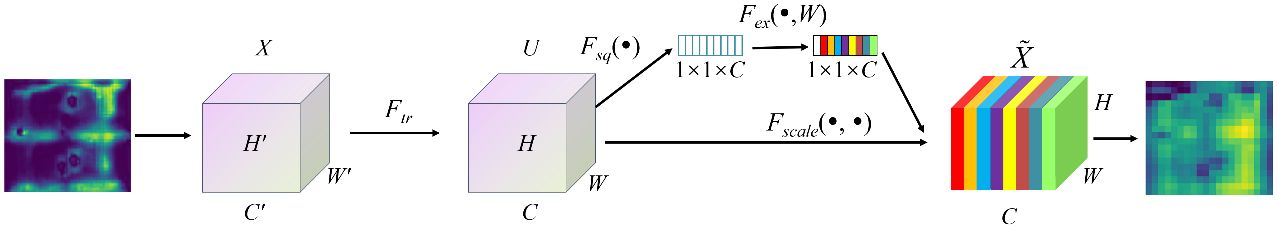
Figure 4 Schematic diagram of the SENet module.
where zc represents the output operated by Fsq, the subscript c represents the channel. uc stands for the cth two-dimensional matrix of U. Fex in Figure 4 is the Excitation operation that corresponds to the two fully connected operations, namely, as shown in Equation 5:
where s is the output operated by Fex. δ and σ represent the activation function of ReLU and Sigmoid, respectively.
After obtaining s, SENet operates Fscale, that is, by the channel product of sc and uc the output feature can be obtained, as shown in Equation 6:
2.3 Optimal feature fusion of SUS-YOLOv5
As the depth of network layers becomes deeper, the feature information will be lost to some extent. Therefore, multi-scale feature fusion is widely used in detection networks to improve the detection performance of networks. At present, the main feature fusion structures commonly include Feature Pyramid Networks (FPN) (Lin et al., 2017), Path Aggregation Network (Liu et al., 2018), and Bidirectional Feature Pyramid Network (Tan et al., 2020). FPN is a top-down feature pyramid structure, which is limited by unidirectional feature information transmission although it combines deep and shallow layers of features as well as multi-scale features. The Path Aggregation Network adds a bottom-up secondary fusion path based on FPN (Tan et al., 2020). BiFPN is a weighted bi-directional feature pyramid network, which realizes the simple and fast multi-scale feature fusion. To reduce the loss of feature information and improve the detection accuracy of objects, this research proposes a SE-BiFPN network structure, which combines the SENet and BiFPN structures, whose diagrammatic sketch is shown in Figure 5.
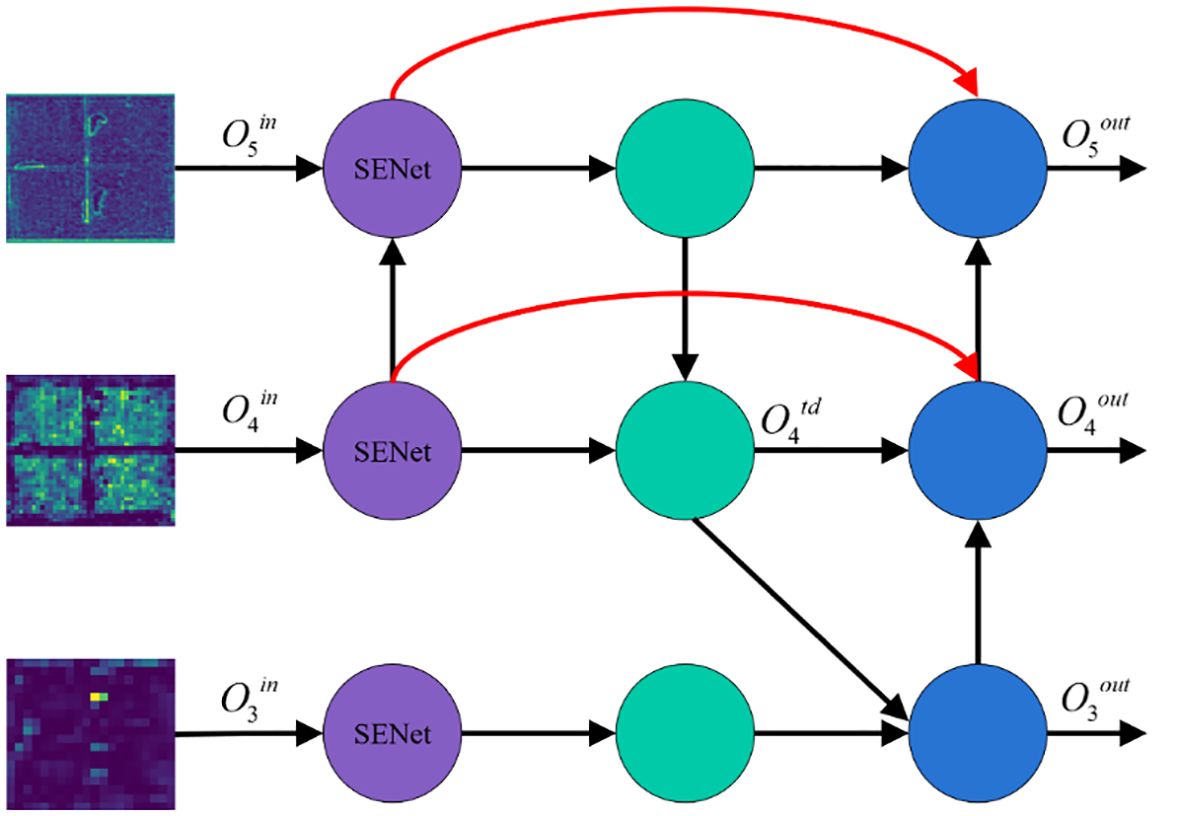
Figure 5 Schematic diagram of SE-BiFPN.
Firstly, multiscale feature maps are derived from the SENet layer of the backbone network. Secondly, the first feature fusion is achieved with the lower sampling layer through a transverse connection, and the second feature fusion is achieved with the lower sampling layer and the upper sampling layer of the same scale of feature maps through a skip connection. Then, the feature map is obtained after these multi-scale fusions. Take the example of the fourth channel, the intermediate feature map and the final feature map are output as follows.
In Equations 7 and 8, denotes the convolution operation on g. R(g) stands for an up-sampling or down-sampling operation on g. represents the intermediate feature map between and . ω and ε respectively represent the learnable weight and a preset small positive value to avoid numerical instability, which usually are set to 0.0001. The weights ω are dynamically adjusted by the optimization algorithm during the training process, and their initial values are usually randomly generated and updated by back-propagation of the loss function. The purpose of presetting a small positive value ε is to prevent numerical instability caused by manipulating 0 or infinity during numerical calculations. We choose 0.0001 as the value of ε, which is an empirical value widely used in numerous experiments and is sufficient to cope with the need for numerical stability in most cases, without significantly affecting the performance of the model.
The SE-BiFPN network enhances the fusion ability of image shallow feature information and deep feature information. Each new feature layer of information is processed by SENet, so the SE-BiFPN can play a core role in the fusion of global and local information between the deep layers and shallow layers. In conclusion, the SE-BiFPN network structure enhances the expression ability of the feature pyramid and enables the model to achieve optimal feature fusion. After the SENet processing, the feature map in the backbone network of SUS-YOLOv5 is input into the SE-BiFPN structure multiple times to realize bidirectional multi-scale feature fusion, which improves the learning ability of the model on the whole feature and reduces the missing rate.
2.4 Object tracking algorithm
The SUS-YOLOv5 integrates the DeepSORT algorithm to achieve multi-object behavior tracking of sea cucumbers, and the schematic diagram of MO-Tracking is shown in Figure 6.
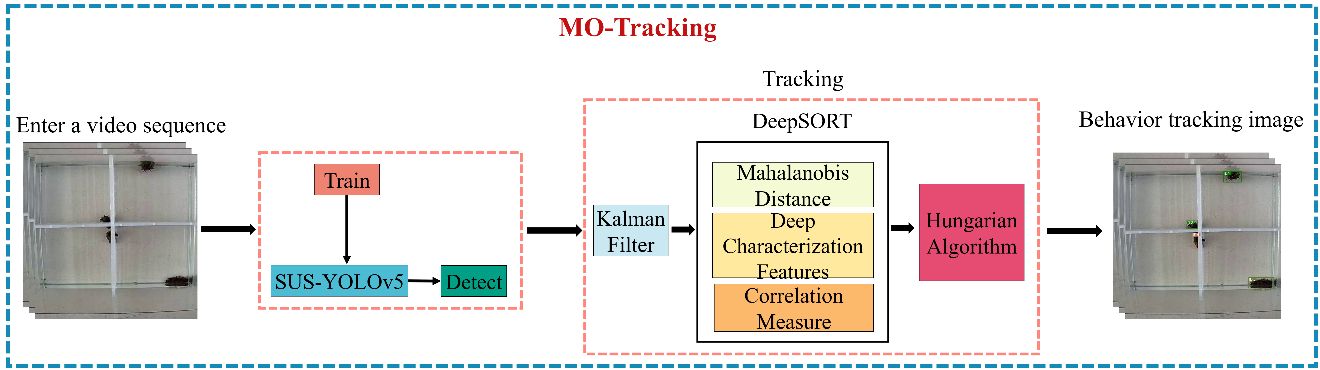
Figure 6 Schematic diagram of the multi-object tracking process.
In Figure 7, the DeepSORT algorithm is on the basis of the SORT algorithm (Bewley et al., 2016) and introduces a re-identification model, which reduces the frequency of identity document (ID) switching by the appearance information and the movement information. In addition, DeepSORT combines the Kalman filter for movement prediction and the Hungarian algorithm for data association to solve the multi-object tracking problems.
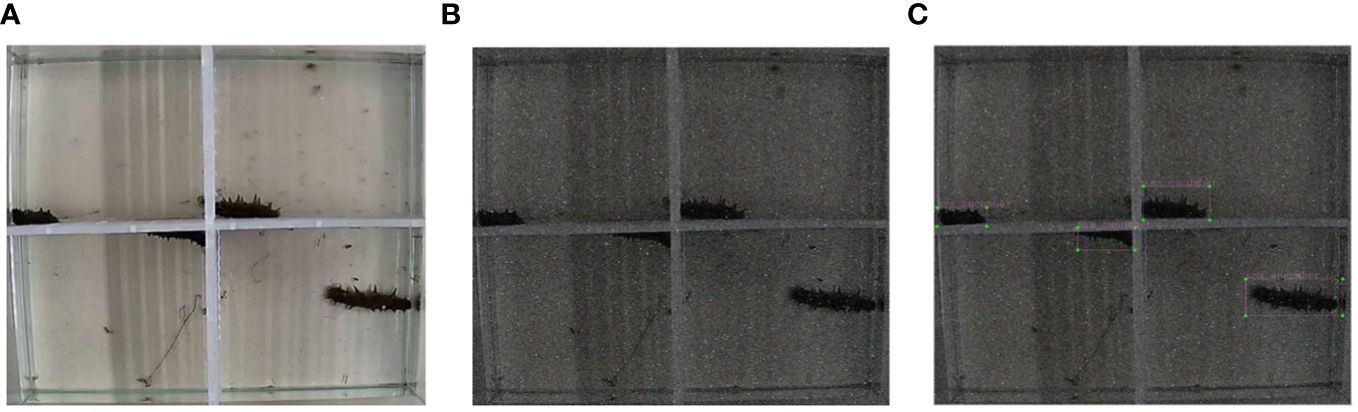
Figure 7 Image processing and annotation. (A) Original image (B) Image after processing. (C) Label fabrication.
The video of sea cucumbers is input into SUS-YOLOv5. After the object detector detects the sea cucumber objects, the DeepSORT algorithm can match the sea cucumber objects between the front and back frames based on the Kalman filter and the Hungarian algorithm, and it can also continuously track the object. When tracking the object, the movement model established by DeepSORT will calculate the Mahalanobis distance between the detection box and the filter prediction box, the distance is expressed as:
where dj stands for the distance of the jth detection box, yi is the predicted position of the i tracking object, and si stands for the covariance matrix between the detection position and the predicted position. d(1)(i,j) denotes the Mahalanobis distance between the Kalman prediction result and the detection result of the motion state of the existing moving object.
When the uncertainty of the object motion is very low, the Mahalanobis distance represented by Equation 9 is a suitable correlation measure method. However, when the camera is moving, the correlation method of the Mahalanobis distance will fail, which results in the phenomenon of ID switch. For solving this problem, we propose to use the following second kind of correlation method to identify a feature vector for each detection block dj, which is appointed by the DeepSORT.
where rj is an appearance descriptor with the restriction condition ||rj||=1. For each track frame k, the algorithm preserves the set of the last Lk=100 related to appearance descriptors, namely . d(2)(i,j) is the minimal cosine distance of the ith track and jth detection.
The above two kinds of metrics between motion features and appearance features can complement each other in matching problems. On one hand, the metric of the Mahalanobis distance to motion characteristics is helpful for short-term predictions. On the other hand, the cosine distance considering appearance features is a very useful metric for ID recovery after prolonged occlusion. To describe the correlation problem, the above two kinds of metrics from Equations 9 and 10 are weighted and summed as shown in Equation 11:
where ci,j stands for the weighted sum of the Mahalanobis distance and the cosine distance. λ is the hyperparameter that affects the association effect.
3 Experiment and result analysis
3.1 Experimental materials
3.1.1 Preparation of pathogenic bacteria
Vibrio alginolyticus is a marine bacterium that is widely present in the seawater environment and it can cause lesions in sea cucumbers. Higher concentrations of Vibrio alginolyticus may increase the chances of infection in sea cucumbers, especially in aquaculture environments where confined spaces and high-density culture conditions may accelerate the spread of the pathogen. As the concentration of Vibrio alginolyticus increases, its pathogenicity to sea cucumbers usually intensifies. In this research, we use Vibrio alginolyticus to infect sea cucumbers. Both the adult sea cucumbers and the Vibrio alginolyticus strain are obtained from the laboratory of the School of Marine Science and Engineering at Qingdao Agricultural University. To prepare the bacterial suspension, Vibrio alginolyticus is first inoculated into Luria Bertani broth and incubated until the logarithmic growth phase of Vibrio alginolyticus in a constant temperature shaker at 30 °C and 200 rpm. Two distinct bacterial suspension concentrations are prepared, with values of 1 × 10¹¹ CFU/mL and 1 ×10⁹ CFU/mL, respectively. These bacterial suspensions are respectively added to two fish tanks containing 10 L of water, then the final dilutions are obtained with 1 × 10⁶ CFU/mL and 1 × 10⁹ CFU/mL, respectively. The research is conducted in three experimental environments: normal environment, low concentration, and high concentration. Figure 3 shows the preparation process of the bacterial solution.
3.1.2 Sample collection
The water temperature for experimental sea cucumbers is kept at 18°C. The weight and size specifications of sea cucumbers are 14.40 ± 4.20 g/each and 6.65 ± 1.15 cm/each, respectively. In this research, twelve adult sea cucumber samples are collected. Table 1 shows the parameter specifications for each sea cucumber.
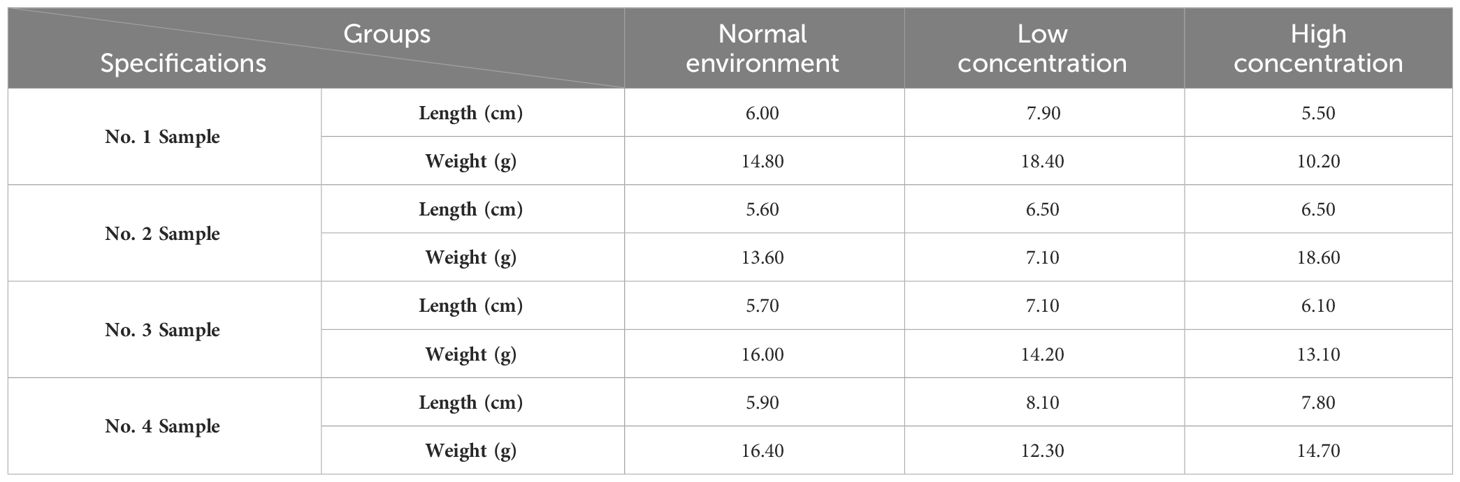
Table 1 Sample specifications of sea cucumbers.
3.1.3 Experimental platform construction
Sea cucumbers are infected by the immersion infection in this experiment. A total of three sets of experiments were set up in three cubic aquarium with all side lengths of 40 cm. Every cubic aquarium has four sea cucumbers. To realistically simulate the living environment of sea cucumbers without additional effects on their behavior, the experiments were conducted during daytime without light compensation. The camera platform is set to record the behaviors of sea cucumbers. The platform consisted of three cameras, a digital video recorder, a switch, a display, and three fish tanks. The actual experimental scenario is shown in Figure 8.
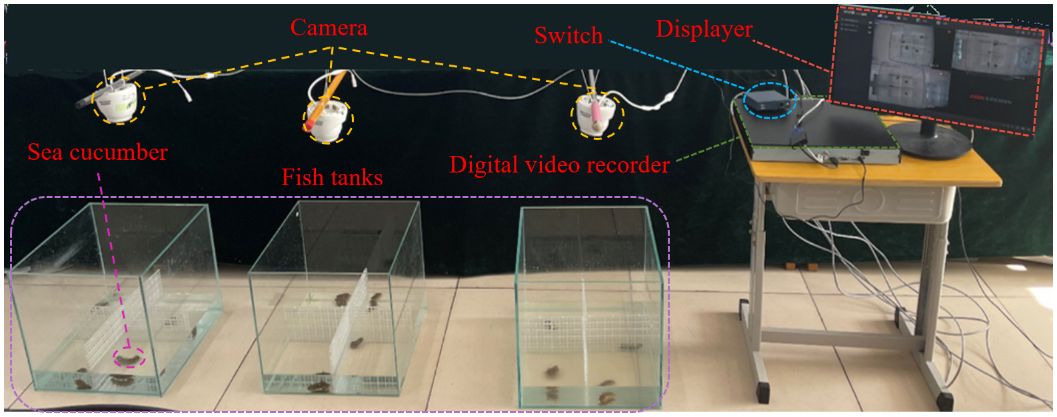
Figure 8 Actual experimental scenario.
3.1.4 Image data acquisition and annotation
In this study, the dataset used for object detection is obtained by taking frames from the video recorded in the experiment with an image resolution of 618 × 618 pixels. The experimental platform captured video data, but the model training requires image data. In addition, due to the slow movement of the sea cucumber, the original video was edited at 20 frames per second. After the manual screening, a total of 1,000 sea cucumber images are taken, where an example image is shown in Figure 7A. This study takes into account that light and noise variations in sea cucumber aquaculture environments can reduce the quality of image quality and decrease the detection of sea cucumber objects. Therefore, to simulate the real sea cucumber aquaculture environment to improve the robustness of sea cucumber detection models, some image processing methods are used to enhance the generalization ability, such as increasing noise, reducing brightness, and reducing contrast on the original image, and an example of the processing effect is shown in Figure 7B. This research uses the LabelImg annotation tool to annotate images. When labeling, the rectangle closest to the sea cucumber is used as the real box, and the coordinates of the center point are obtained. The effect of labeling is shown in Figure 7C. The input size of the model is set to 640 × 640 pixels which can be set in multiples of 32.
3.2 Experimental platform
The experiment is conducted on an experimental platform equipped with Intel (R) Core (TM) i7-6800K CPU @ 3.40GHz (64G RAM) and NVIDIA GeForce RTX 2080Ti 48G. We use CUDA 11.1.0, CUDNN 11.1, and Python 3.8.8 as the configuration environment of software. Table 2 shows the detail training parameters.
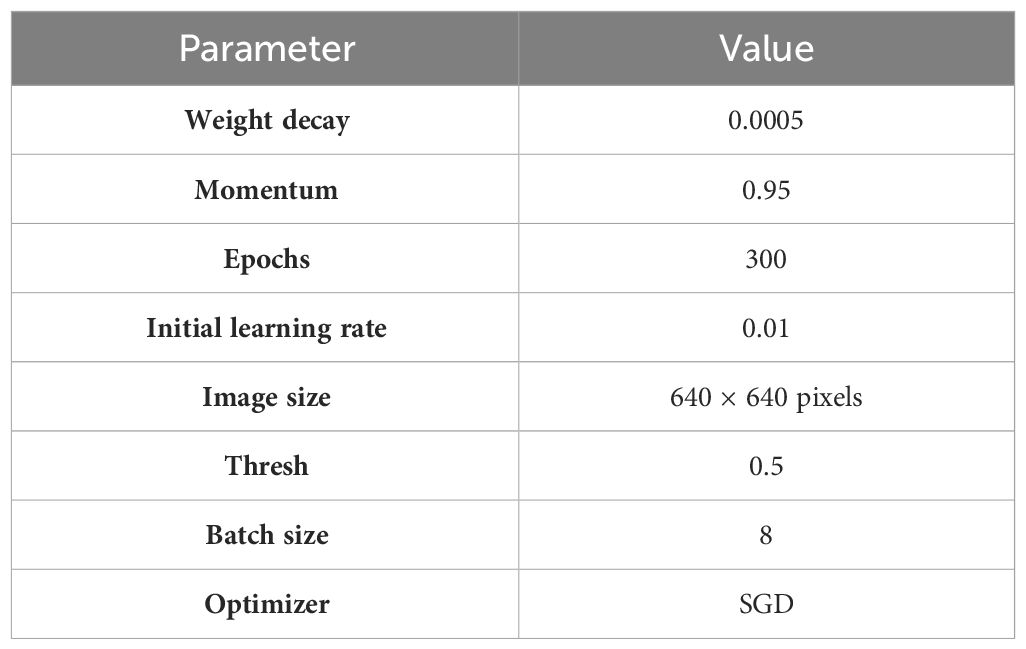
Table 2 Setting of training parameter.
3.3 Evaluation indexes of model performance
The loss function in YOLOv5s is employed to measure the discrepancy between the model’s predictions and the actual ground truth, and it comprises three losses: object loss, detection box loss and classification loss. To avoid overfitting and underfitting during the training process, the loss values are monitored for the training and validation sets and the best model is selected based on these values.
The Intersection over Union (IoU) metric is often employed to appraise the accuracy of the model’s prediction. IoU gives the overlap ratio between the predicted detection boxes and the ground truth detection boxes. Using this metric, the values of precision (P) and recall (R) can be computed based on the model’s predictions. The expressions for R, P, and loss are shown in Equations 12–14.
where lbbox, lobject and lclassification represent detection box loss, object loss, and classification loss, respectively. TP presents the number of positive samples correctly predicted as positive samples, FP is the number of negative samples incorrectly predicted as positive samples, and FN stands for the number of positive samples incorrectly predicted as negative samples.
The Average Precision (AP) serves as an evaluative metric for assessing the accuracy of an detection model for object. AP is determined by calculating the area under the Precision-Recall (P-R) curve, which is generated by plotting precision and recall values across various threshold levels of the model’s confidence scores. AP is the average value of precision at different recall levels, and it represents the ability of the model to correctly detect objects and avoid false positives. The mAP is the average of the AP values calculated for each category in the dataset. the mAP is a commonly used evaluation metric for object detection models, as it provides a single performance score that takes into account the detection accuracy for all object categories in the dataset. A higher mAP value indicates better performance of the model. In summary, AP and mAP are important evaluation metrics for object detection models, and they are computed based on the P-R curve. They are defined as shown in Equations 15 and 16:
where QR stands for the number of categories.
3.4 Experimental results of object detection
The training results of the model is shown in Figure 9, including the training loss curve, verification loss curve, mAP@0.5:0.95 curve and mAP@0.5 curve. From Figures 9A, B, one can see that the loss function value of training and verification of SUS-YOLOv5 gradually decreases with the increase of the number of iterations and finally stabilizes at a value close to 0. In this process, no obvious overfitting phenomenon occurs in the model. From Figures 9C, D, one can see that the mAP@0.5 and mAP@0.5:0.95 indicators of SUS-YOLOv5 have obvious advantages over other models, and the detection performance of object has been improved.
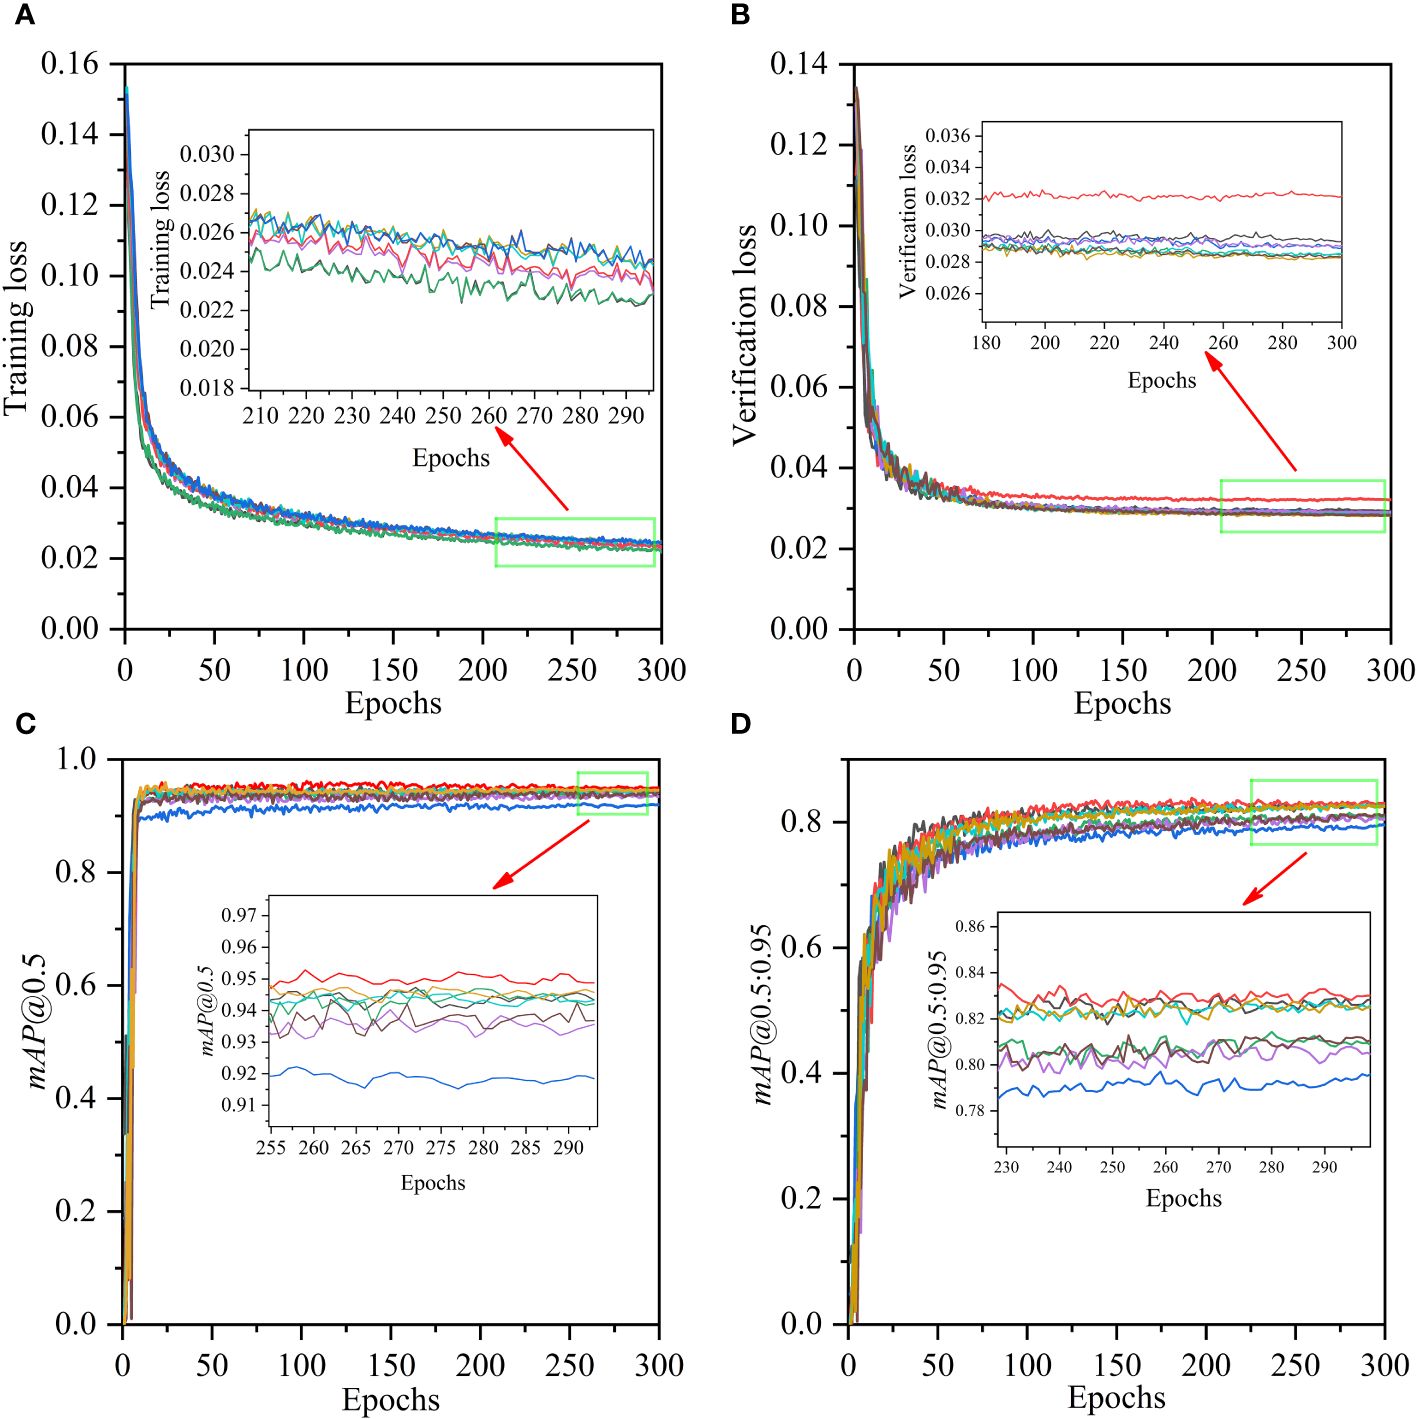
Figure 9 Training results of different models. (A) Training loss for the training set; (B) Verification loss for the validation set; (C) mAP@0.5; (D) mAP@0.5:0.95.
In the experimental process, several methods for improving detection performance are tested and their results are compared in Table 3.
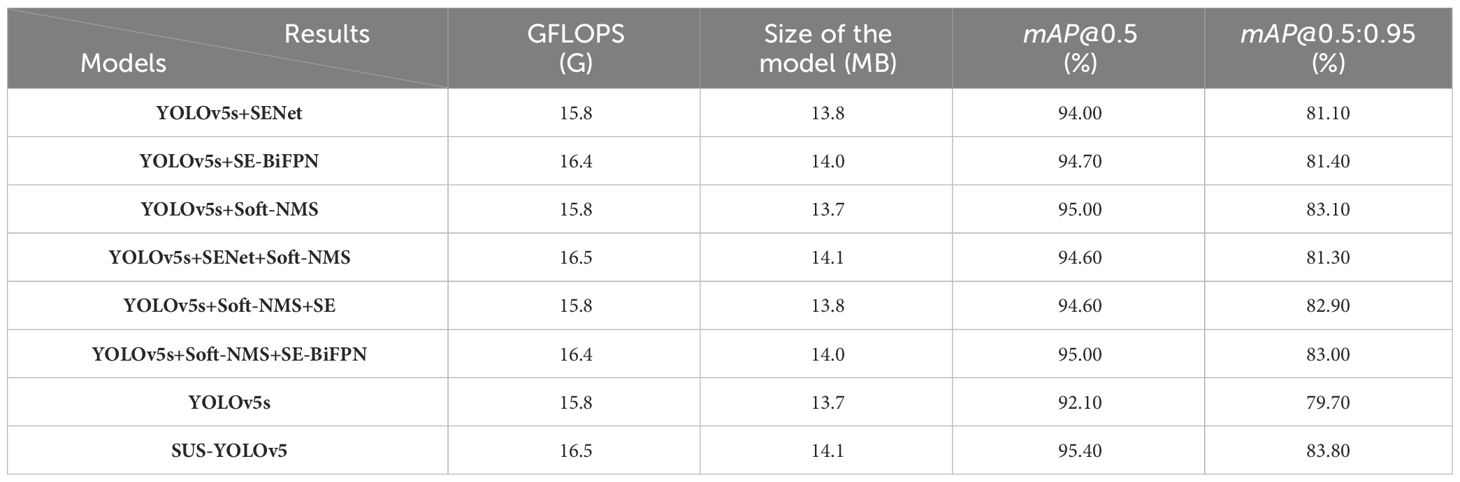
Table 3 Ablation experiments.
From Table 3, the proposed SUS-YOLOv5 has the highest accuracy whose mAP@0.5 is 0.954 and the mAP@0.5:0.95 is 0.838, which are 3.3% and 4.1% higher than the original YOLOv5s, respectively. Although the SUS-YOLOv5 model is more relatively complex than the original YOLOv5s, the size of the SUS-YOLOv5 model only increases by 0.4 MB compared with 14.1 MB of the YOLOv5s. The above results demonstrate that that SUS-YOLOv5 achieves a favorable balance between model size and detection accuracy.
The detection results are shown in Figure 10 by using YOLOv5s and SUS-YOLOv5 on the sea cucumber dataset, respectively. To facilitate an understanding of the detection performance of the models, this research visualizes the 80 × 80 detection layer of the models by using heatmaps. Heatmaps are usually used to highlight key areas with colors of different depths in object detection. Generally, the brighter the color of the heatmap, the more confident the model is in detecting the object.
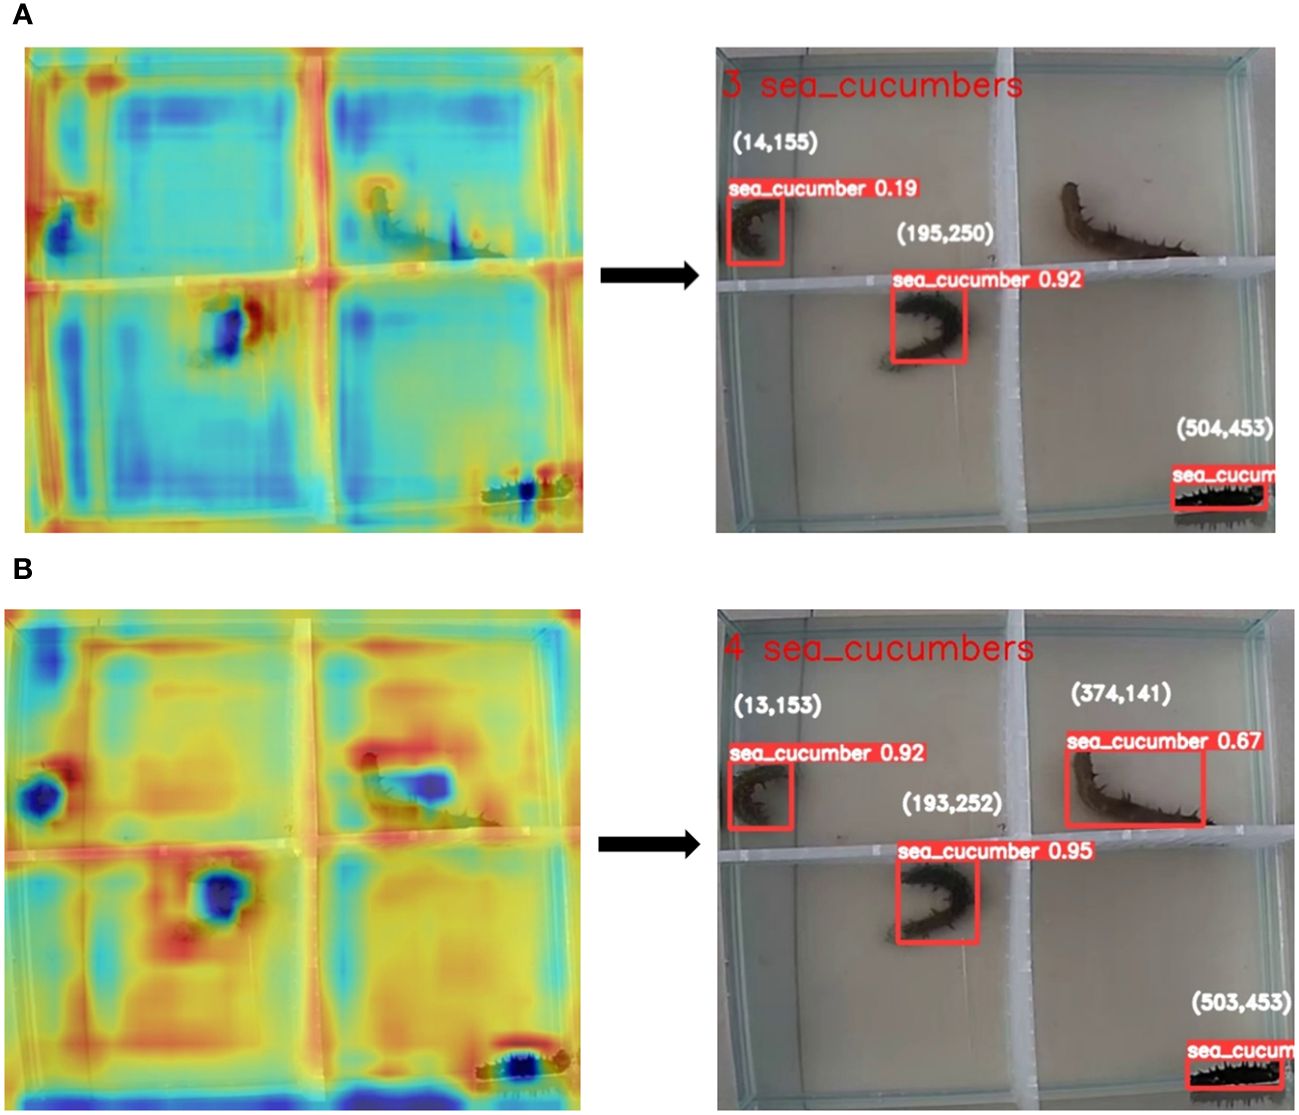
Figure 10 Comparison of the detection results. (A) Detection result of YOLOv5s; (B) Detection result of SUS-YOLOv5.
From Figure 10A, it can be seen that the YOLOv5s misses an object in the upper right corner, whose anchor box has a lower score. In contrast, from Figure 10B, it can be seen that SUS-YOLOv5 successfully detects all sea cucumber objects and obtains higher confidence scores. In addition, the SUS-YOLOv5 has higher brightness than YOLOv5s in the object area, which indicates that SUS-YOLOv5 has a higher focus on the object area.
To further compare the performances of YOLOv5s and SUS-YOLOv5, the P-R curves are given in the training process of the sea cucumber object detection, shown in Figure 11.
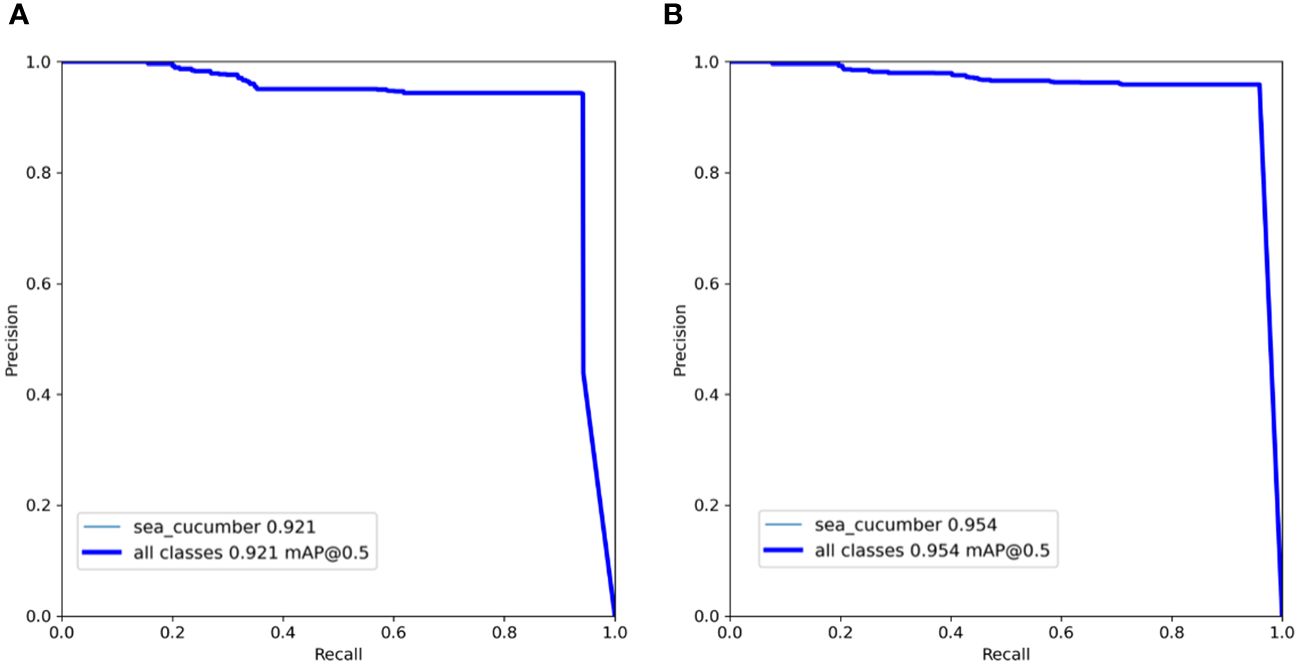
Figure 11 P-R curves of YOLOv5 and SUS-YOLOv5. (A) YOLOv5s; (B) SUS-YOLOv5.
From Figure 11, it can be observed that the SUS-YOLOv5 appears higher detection accuracy for sea cucumbers infected with Vibrio alginolyticus compared to YOLOv5s. Additionally, the improvements made on YOLOv5s are effective because the SENet attention mechanism, optimized Non-Maximum Suppression algorithm, and enhanced feature fusion capability improve the overall performance of the model.
3.5 Comparison with other object detection models
To access the performance of SUS-YOLOv5, this research compares it with traditional object detection models, including YOLOv3, YOLOv4, SSD, Faster-RCNN, EfficientDet, and YOLOv5s. The results of the comparison are shown in Table 4. From Table 4, one can see that the mAP@0.5 of SUS-YOLOv5 achieves 95.40% among the one-stage object detection algorithms, which is not only higher than other YOLO series algorithms but also 6.30% and 10.94% higher than mAP@0.5 of SSD and EfficientDet, respectively. The accuracy of SUS-YOLOv5 can meet the requirements of sea cucumber detection.
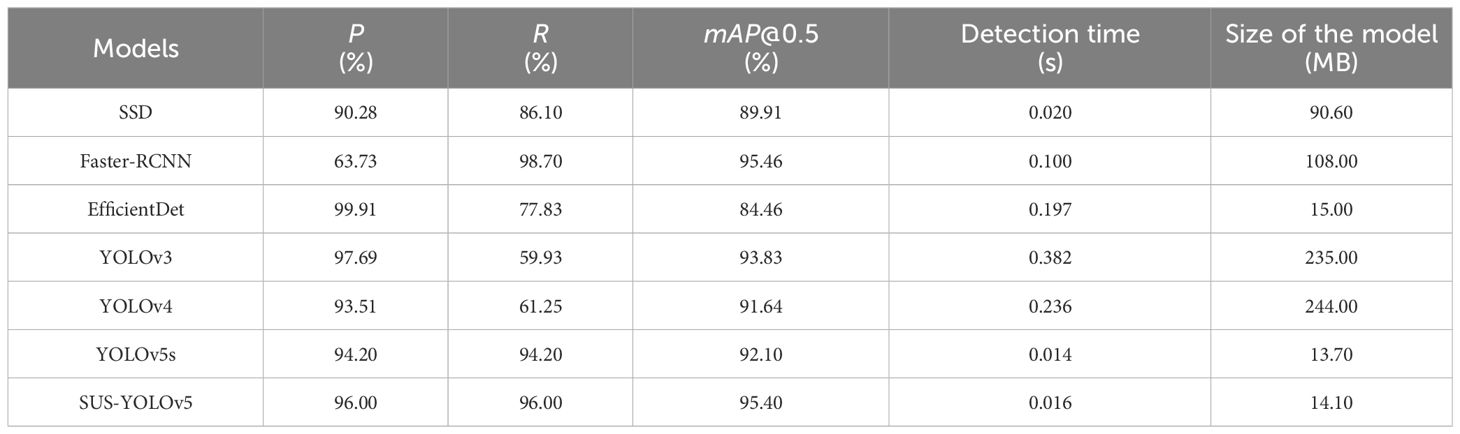
Table 4 Comparison of the performances of the seven models.
To make the performances of different detection algorithms more visual and clear, Figure 12 shows the comparison results of performance for different detection algorithms in the form of a histogram.
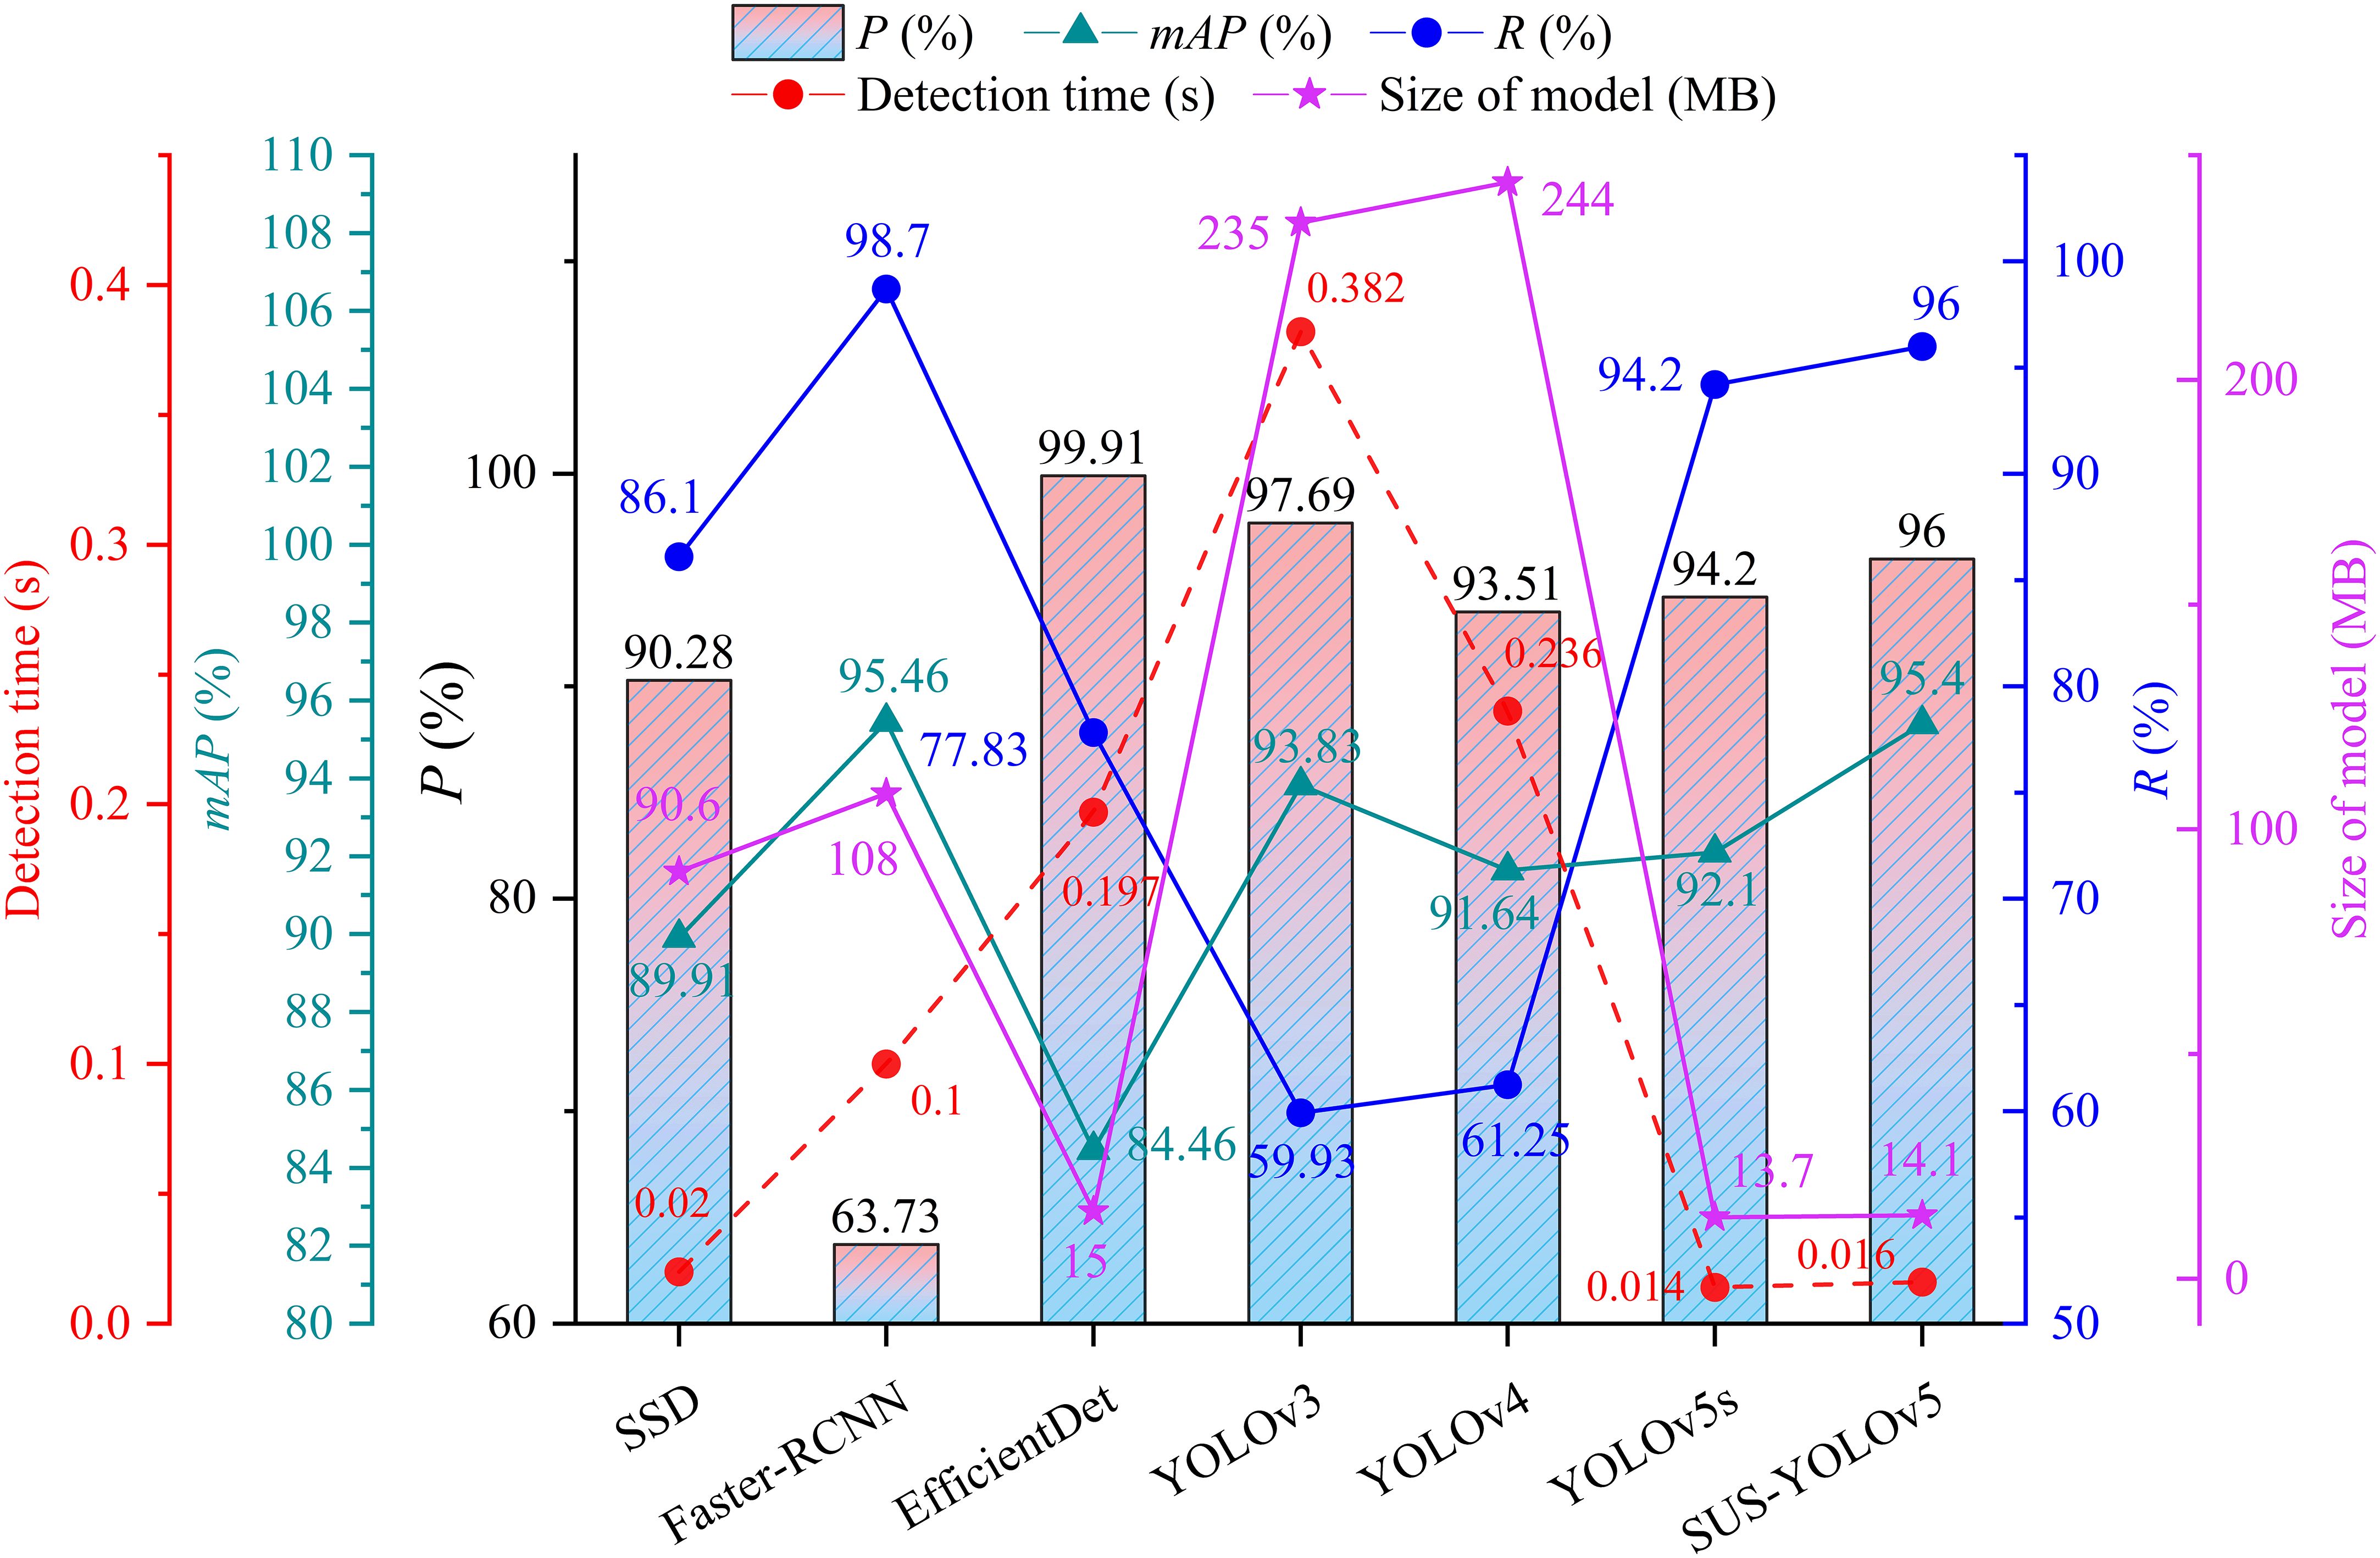
Figure 12 Comparative evaluation of various detection algorithms’ performance.
As seen in the above figure, the mAP@0.5 of Faster-RCNN is the highest in the seven models and it is 0.06% higher than that of SUS-YOLOv5, but the model size of SUS-YOLOv5 reduces 86.94% than that of Faster-RCNN. As we all know, the large size of the model makes it difficult to deploy the model in embedded devices. As shown in Figure 12, the processing time of SUS-YOLOv5 is only 0.016s for a single image, satisfying the real-time detection requirement for sea cucumber objects. On the other hand, the P and R of SUS-YOLOv5 both increase by 1.80% compared with those before the improvement. In summary, the SUS-YOLOv5 achieves a good balance among detection accuracy, detection speed, and model size, which can lay a good foundation for the following sea cucumber object tracking task.
3.6 Object tracking and behavior analysis
This research analyzes the behavioral changes of sea cucumbers in the early stage of suffering from SUS disease to observe their behavior within one hour after immersion by setting different experiment groups (normal environment, the low concentration of Vibrio alginolyticus, and the high concentration of Vibrio alginolyticus). In the sea cucumber object tracking experiment, the MO-Tracking algorithm combines the ideas of cascade matching and object re-identification to effectively avoid the object ID loss problem and the ID switching problem caused by object occlusion. The ID identification results of the MO-Tracking algorithm are shown in Figure 13.
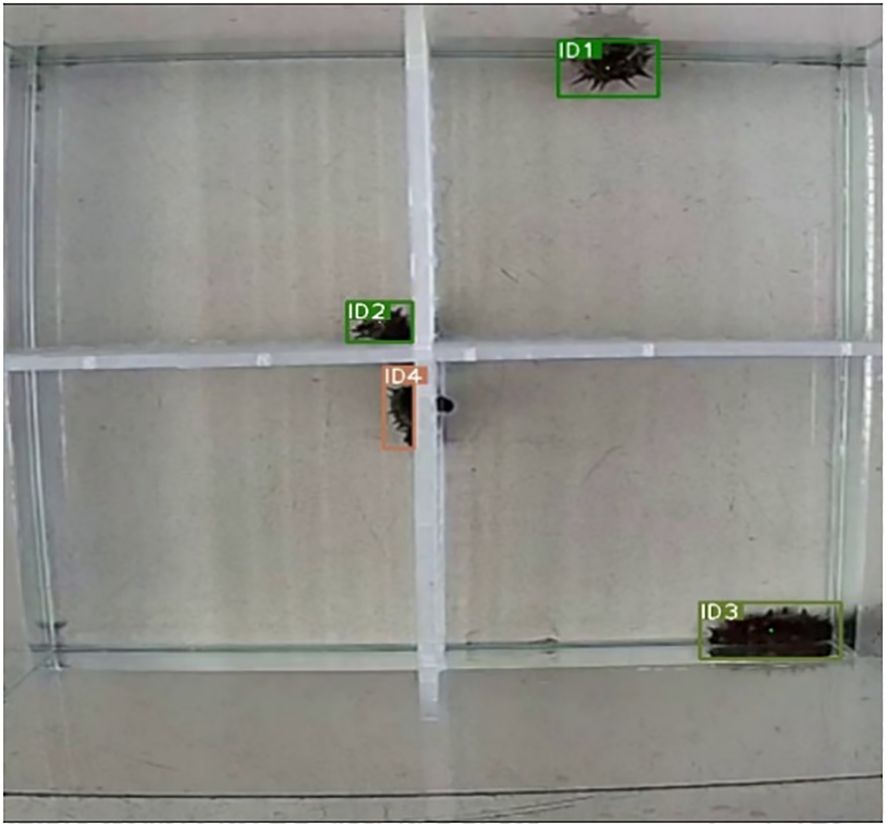
Figure 13 ID identification results of the MO-Tracking algorithm.
From Figure 13, one can see that the MO-Tracking algorithm assigns an ID to each sea cucumber and accurately locks the identity of each sea cucumber based on the object’s ID, while the corresponding coordinate information is continuously output.
After obtaining the coordinate information of sea cucumber objects by using the MO-Tracking algorithm, the pixel coordinates are transformed proportionally to obtain the actual coordinates of sea cucumbers in the 40 ×40 ×40 cm3 fish tank. Table 5 shows the detailed statistical results of sea cucumber movement quantity in the three experiments.
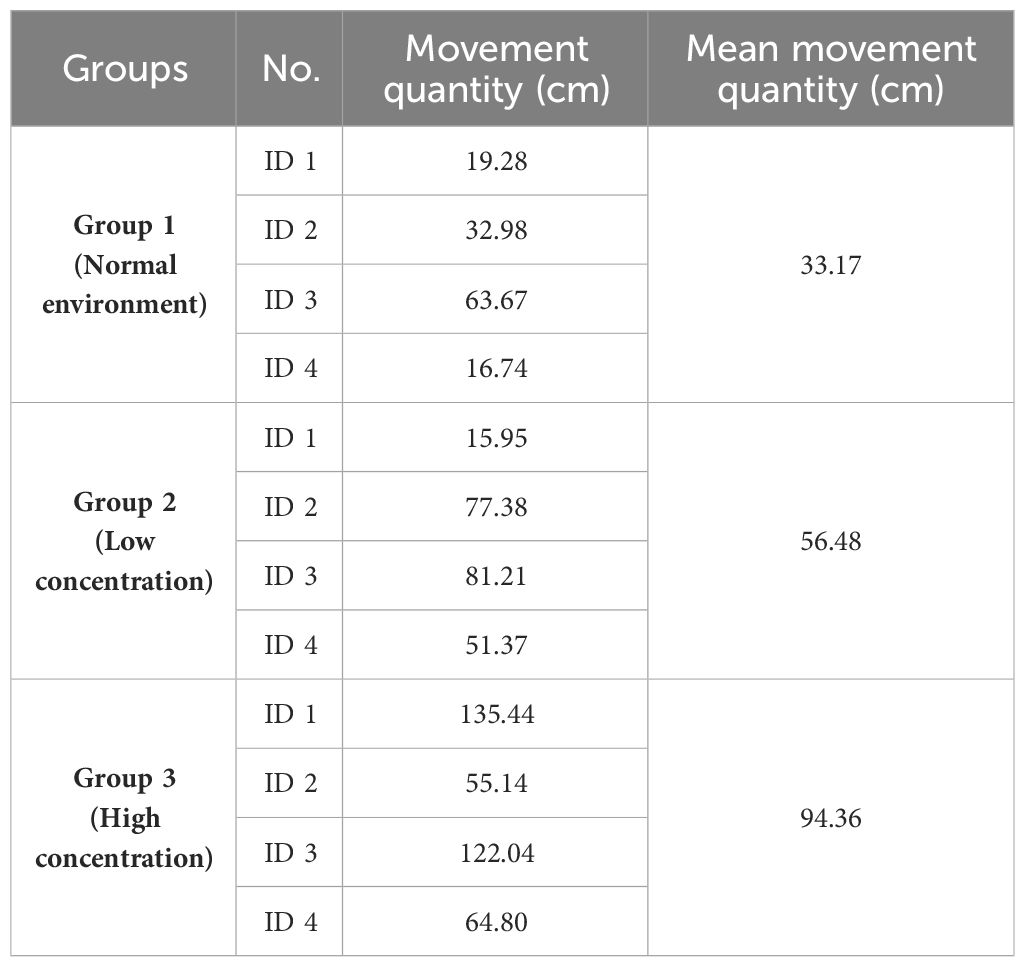
Table 5 Movement quantity statistics of sea cucumbers during the first hour.
To more intuitively reflect the movement status of sea cucumbers, the trajectories of movement for sea cucumbers are plotted based on the obtained coordinates of the objects in the three groups. Figure 14 shows the results.
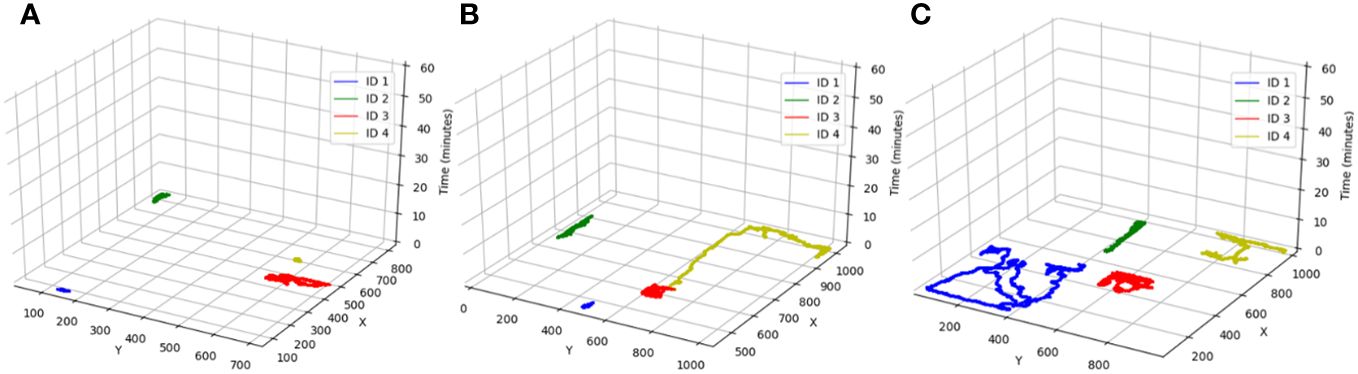
Figure 14 Movement trajectories of sea cucumbers. (A) Normal environment; (B) Low concentration of Vibrio alginolyticus; (C) High concentration of Vibrio alginolyticus.
Combining Table 5 and Figure 14, we can conduct a detailed analysis of the movement status of sea cucumbers within one hour after the experiment. Figure 14A shows the trajectories of the sea cucumbers in group 1 (normal environment). From Figure 14A, it can be seen that: besides ID 3 which shows obvious movement, the other three sea cucumbers stay stationary near their original locations in the normal environment. According to Table 6, the movement quantity of ID 3 is 63.67 cm, the mean movement quantity of the other three sea cucumbers is 22.99 cm, and the overall mean movement quantity is 33.17 cm. Figure 14B shows the trajectories of sea cucumbers in group 2 (low concentration of Vibrio alginolyticus). ID 3 and ID 2 are the ones with the stronger reaction, and the movement quantity reaches 81.21 cm and 77.38 cm, respectively, while ID 1 has the least strong reaction. The overall mean movement quantity is 56.48 cm in group 2, which has an increase of 23.31 cm compared to that in the normal environment. Figure 14C shows the behavior trajectories of sea cucumbers in group 3 (high concentration of Vibrio alginolyticus). It can be seen that the movement quantity of sea cucumbers increases significantly and the movement quantity of ID 1 is the largest which reaches 135.44 cm. The movement quantity of ID 3 increases by 40.83 cm and 58.37 cm compared with that in group 2 and group 1, respectively. The mean movement quantity of sea cucumbers reaches 94.36 cm in group 3, which is obviously higher than those of the other two groups.
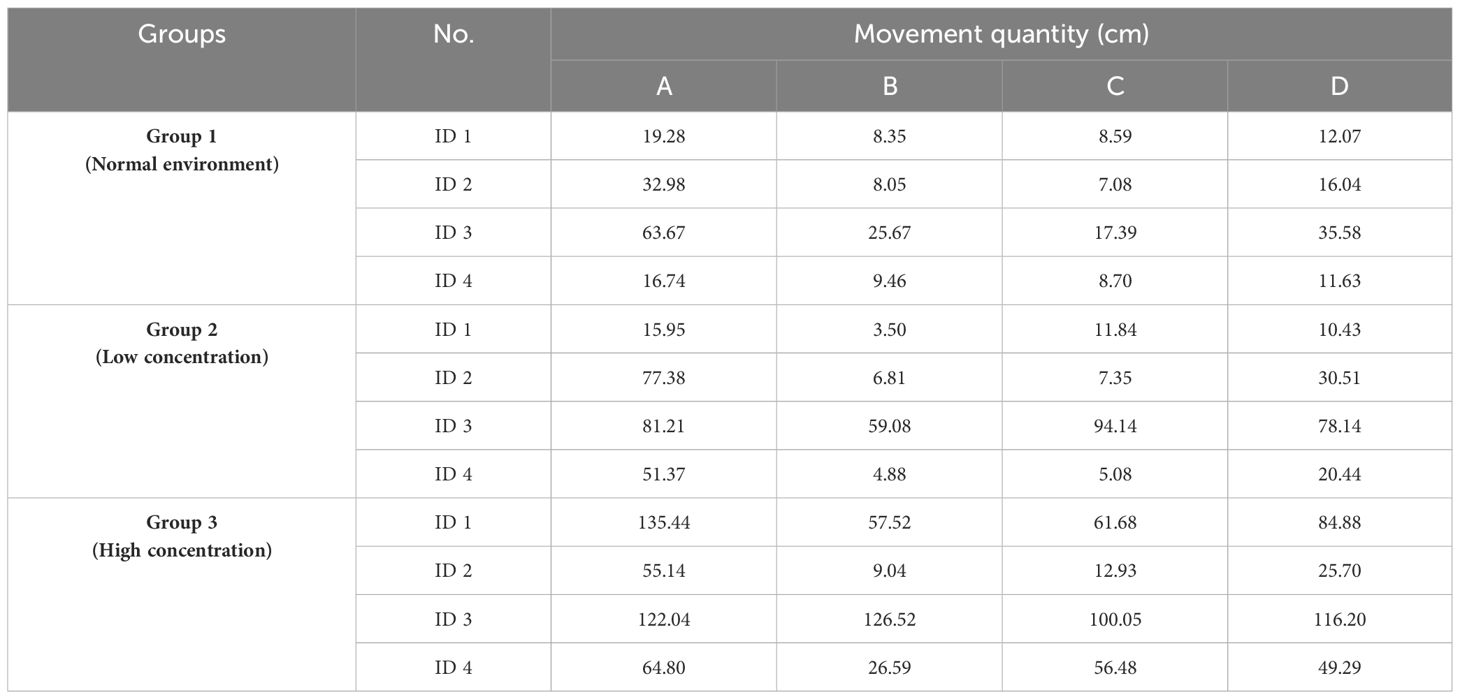
Table 6 Movement quantity statistics of sea cucumbers during the first three hours of experiments.
In the whole experiment, sea cucumbers do not appear a strong reaction or death in low concentrations of Vibrio alginolyticus, and they only appear with some symptoms such as shaking their heads and spitting out their guts. To further explore infection in the situation of sea cucumbers in different concentrations of Vibrio alginolyticus, the mean movement quantity of sea cucumbers is calculated in the first three hours of each experiment, as shown in Table 6.
In Table 6, A, B, and C represent the movement quantity in the first, second, and third hours, respectively, and D represents the mean movement quantity in the first three hours. From Table 6, it can be seen that ID 1 and ID 4 in group 2 do not appear significant differences in mean movement quantity compared to sea cucumbers in group 1. The occurrence of this phenomenon may be because of the concentration of Vibrio alginolyticus is low and the bacterial inoculation adopts the immersion infection method in the experiment, so that the sea cucumbers may be incompletely infected with Vibrio alginolyticus. When sea cucumbers are exposed to high concentrations of Vibrio alginolyticus, their reactions become more fidgety, and more symptoms occur, such as shaking their heads, blackening their tentacles, spitting out their guts, fully extending their trunk, and floating their heads. On the 5th day of these experiments, the high-concentration group of sea cucumbers begins to appear dead.
According to the analysis for the experimental results, sea cucumbers become irritable in the early stage of infection with Vibrio alginolyticus, and the movement quantity increases significantly compared with the normal environment. Therefore, in the early infection stages of sea cucumbers with Vibrio alginolyticus, the increase in the movement quantity of sea cucumbers can be used as one of the characteristics to determine whether the sea cucumber is diseased.
According to the experimental results of sea cucumbers infection with Vibrio alginolyticus, one can classify the infection level into three categories: low infection level (mean movement quantity ranging from 25 cm/h to 45 cm/h, but not including 45 cm/h), moderate infection level (mean movement quantity ranging from 45 cm/h to 85 cm/h, but not including 85 cm/h), and severe infection level (mean movement quantity greater than 85 cm/h). We can judge the infection level by the movement quantity of sea cucumber, then a alarm of the infection level can be provided to facilitate the appropriate measures to be taken.
4 Discussions and future work
Since the body of sea cucumbers is very flexible (Ru et al., 2021), even if sea cucumbers appear to be stationary from the trajectory perspective, they still have a certain movement quantity. From the perspective of the entire movement process, the movement quantity is almost negligible (Sun et al., 2018).
We also observe that sea cucumbers suffering from SUS appear ulceration on their body surfaces in the experiments. These affected areas often appear white or yellow and often emit a foul odor by SUS. If this problem is not solved promptly, the bacteria may continue to multiply and spread to the other parts of sea cucumbers, which will cause the condition to further worsen. Therefore, We will use the above phenomenon as a level of discrimination for infecting Vibrio alginolyticus and give a timely warning in future work.
During the sample collection process, sea cucumbers for experiments are in the same specifications as much as possible to eliminate interference factors. Whereas, the expansion and contraction of the sea cucumber’s body make it difficult to obtain accurate trunk length and mass information because the trunk of sea cucumbers can shrink or extend. To ensure the measurement accuracy of sea cucumbers, this research measured their length after they are kept stationary for a while. Additionally, the sea cucumber can absorb water, which causes its weight to fluctuate, but these fluctuations hardly affect the results of the experiments.
To deploy the model to embedded devices in the future, the next step is to further optimize the SUS-YOLOv5 model and implement compression of the model using lightweight techniques, such as pruning and knowledge distillation (Poyatos et al., 2022). Based on the detection objects, the genetic algorithm (Wang et al., 2022), Bayesian optimization algorithm (Lan et al., 2022), and particle swarm optimization algorithm (Liu et al., 2021) may be used to determine hyperparameters of SUS-YOLOv5.
On the other hand, generative adversarial networks (Zhao et al., 2021; Zheng et al., 2022) can be used to expand the dataset, increase sample diversity, and improve the generalization ability of model. Furthermore, the movement quantity of sea cucumbers in real-time can be monitored long-term as an early warning system for sea cucumber diseases. When the movement quantity of sea cucumbers is abnormal, a timely warning will be given.
In fact, the proposed SUS-YOLOv5 can directly detect the sea cucumber and the other some marine organisms in this paper. Whereas, our proposed algorithm cannot be directly applied to all image processing and object detection scenarios, such as synthetic aperture sonar (SAS) (Yang, 2023; Zhang, 2023) and radar (SAR) (Pinheiro et al., 2015). We believe that our algorithm can be indirectly applied to these fields or the further improved algorithms on the basis of our algorithm can be extended to apply to these fields.
5 Conclusions
This research proposes a two-stage algorithm MO-Tracking for sea cucumbers’ multi-object detection and tracking, which optimizes the NMS algorithm and designs a new feature fusion structure. These improvements enhance the non-maximum suppression and feature fusion abilities. According to the proposed SUS-YOLOv5 object detection algorithm, the mAP@0.5 and mAP@0.5:0.95 reach 95.40% and 83.8%, respectively. In addition, this research finds through object tracking experiments that the behavior of sea cucumbers shows obvious abnormalities after being infected with Vibrio alginolyticus, i.e., a significant increase in the mean movement quantity. The results obtained by the proposed method can be used as an important criterion for determining whether sea cucumbers suffer from disease. This research provides a method for health monitoring of intensively cultivated sea cucumbers, which has practical significance for promoting the development of smart fisheries.
Data availability statement
The original contributions presented in the study are included in the article/supplementary materials, further inquiries can be directed to the corresponding author/s.
Ethics statement
The manuscript presents research on animals that do not require ethical approval for their study.
Author contributions
FG: Investigation, Formal analysis, Writing – original draft. KX: Software, Formal Analysis, Validation, Data curation, Writing – original draft. PL: Writing – review & editing. JL: Methodology, Conceptualization, Supervision, Writing – review & editing. LJ: Data curation, Investigation, Writing – original draft. JW: Investigation, Writing – review & editing. QL: Conceptualization, Investigation, Writing – review & editing.
Funding
The author(s) declare that financial support was received for the research, authorship, and/or publication of this article. The research work is financially supported by the key project of Shandong Provincial Natural Science Foundation (ZR2020KC027), the project of National Natural Science Foundation of China (32073029), Shandong Province Modern Agricultural Technology System (SDAIT-22-19) and the Open Program of Key Laboratory of Cultivation and High-value Utilization of Marine Organisms in Fujian Province (2021fjscq08).
Conflict of interest
The authors declare that the research was conducted in the absence of any commercial or financial relationships that could be construed as a potential conflict of interest.
Publisher’s note
All claims expressed in this article are solely those of the authors and do not necessarily represent those of their affiliated organizations, or those of the publisher, the editors and the reviewers. Any product that may be evaluated in this article, or claim that may be made by its manufacturer, is not guaranteed or endorsed by the publisher.
References
Ahmad T., Ma Y., Yahya M., Ahmad B., Nazir S., Haq A. U. (2020). Object detection through modified YOLO neural network. Sci. Program. 2020, 8403262. doi: 10.1155/2020/8403262
Bao Y. J., Ji C. Y., Zhang B., Gu J. L. (2018). Representation of freshwater aquaculture fish behavior in low dissolved oxygen condition based on 3D computer vision32. Modern Physics Letters B. 32(34n36), 1840090. doi: 10.1142/s0217984918400900
Bewley A., Ge Z., Ott L., Ramos F., Upcroft B. (2016). “Simple online and realtime tracking,” in 2016 IEEE International Conference on Image Processing (ICIP). IEEE, 3464–3468. doi: 10.1109/ICIP.2016.7533003
Bodla N., Singh B., Chellappa R., Davis L. S. (2017). Soft-NMS — Improving object detection with one line of code. Proceedings of the IEEE international conference on computer vision., 5562–5570. doi: 10.48550/arXiv.1704.04503
Food and Agriculture Organization of the United Nations (2020). The State of World Fisheries and Aquaculture 2020. Available at: https://www.fao.org/documents/card/en?details=CC7493EN.
Gao F., Fang W., Sun X., Wu Z., Zhao G., Li G., et al. (2022). A novel apple fruit detection and counting methodology based on deep learning and trunk tracking in modern orchard. Comput. Electron. Agric. 197, 107000. doi: 10.1016/j.compag.2022.107000
Guo D., Liu H., Zhao H., Cheng Y., Song Q., Gu Z., et al. (2020). Spiral generative network for image extrapolation. Comput. Vision – ECCV 2020, 701–717. doi: 10.1007/978-3-030-58529-7_41
Guo F., Qian Y., Shi Y. (2021). Real-time railroad track components inspection based on the improved YOLOv4 framework. Automat Constr. 125, 103596. doi: 10.1016/j.autcon.2021.103596
Hu H., Gu J., Zhang Z., Dai J., Wei Y. (2018a). Relation networks for object detection. Proceedings of the IEEE conference on computer vision and pattern recognition., 3588–3597. doi: 10.1109/CVPR.2018.00378
Hu J., Shen L., Sun G. (2018b). “Squeeze-and-excitation networks,” in 2018 IEEE/CVF Conference on Computer Vision and Pattern Recognition. 7132–7141. doi: 10.1109/CVPR.2018.00745
Hu X., Liu Y., Zhao Z., Liu J., Yang X., Sun C., et al. (2021). Real-time detection of uneaten feed pellets in underwater images for aquaculture using an improved YOLO-V4 network. Comput. Electron. Agric. 185, 106135. doi: 10.1016/j.compag.2021.106135
Huang J., Ren L., Zhou X., Yan K. (2022). An improved neural network based on SENet for sleep stage classification. IEEE J. Biomed. Health Inf. 26, 4948–4956. doi: 10.1109/JBHI.2022.3157262
Lan G., Tomczak J. M., Roijers D. M., Eiben A. E. (2022). Time efficiency in optimization with a bayesian-Evolutionary algorithm. Swarm Evol. Comput. 69, 100970. doi: 10.1016/j.swevo.2021.100970
Li D., Du L. (2022). Recent advances of deep learning algorithms for aquacultural machine vision systems with emphasis on fish. Artif. Intell. Rev. 55, 4077–4116. doi: 10.1007/s10462-021-10102-3
Li M., Gao Y., Qi Y. X., Song Z. Y., Li Z. B., Lin Y. T., et al. (2021). Assessment of the nutritional value of cultured sea cucumber Apostichopus japonicus. J. Aquat. Food Prod. Technol. 30, 868–879. doi: 10.1080/10498850.2021.1949769
Li J., Xu W., Deng L., Xiao Y., Han Z., Zheng H. (2023). Deep learning for visual recognition and detection of aquatic animals: A review. Rev. Aquac. 15, 409–433. doi: 10.1111/raq.12726
Li J., Xu C., Jiang L. X., Xiao Y., Deng L. M., Han Z. Z. (2020). Detection and analysis of behavior trajectory for sea cucumbers based on deep learning. IEEE Access 8, 18832–18840. doi: 10.1109/Access.6287639
Lin T. Y., Dollár P., Girshick R., He K., Hariharan B., Belongie S. (2017). “Feature pyramid networks for object detection,” in 2017 IEEE Conference on Computer Vision and Pattern Recognition (CVPR). 936–944. doi: 10.1109/CVPR.2017.106
Liu Y., Meng W., Zong H. (2020). “Jellyfish recognition and density calculation based on image processing and deep learning,” in 2020 Chinese Control And Decision Conference (CCDC). 922–927. doi: 10.1109/CCDC49329.2020.9164388
Liu S., Qi L., Qin H., Shi J., Jia J. (2018). “Path aggregation network for instance segmentation,” in 2018 IEEE/CVF Conference on Computer Vision and Pattern Recognition. 8759–8768. doi: 10.1109/CVPR.2018.00913
Liu Y., Wang S. (2021). A quantitative detection algorithm based on improved faster R-CNN for marine benthos. Ecol. Inf. 61, 101228. doi: 10.1016/j.ecoinf.2021.101228
Liu W., Wang Z., Zeng N., Alsaadi F. E., Liu X. (2021). A PSO-based deep learning approach to classifying patients from emergency departments. Int. J. Mach. Learn. Cybern. 12, 1939–1948. doi: 10.1007/s13042-021-01285-w
Lv Z., Guo M., Li C., Shao Y., Zhao X., Zhang W. (2019). Divergent proteomics response of Apostichopus japonicus suffering from skin ulceration syndrome and pathogen infection. Comp. Biochem. Physiol. Part D: Genomics Proteomics 30, 196–205. doi: 10.1016/j.cbd.2019.03.003
Ma G., Xu S., Jiang B., Cheng C., Yang X., Shen Y., et al. (2022). Real-time personalized health status prediction of lithium-ion batteries using deep transfer learning. Energy Environ. Sci. 15, 4083–4094. doi: 10.1039/D2EE01676A
Park J. S., Oh M. J., Han S. (2007). “Fish disease diagnosis system based on image processing of pathogens’ Microscopic images,” in 2007 Frontiers in the Convergence of Bioscience and Information Technologies. IEEE, 878–883. doi: 10.1109/FBIT.2007.157
Pinheiro M., Rodriguez-Cassola M., Prats-Iraola P., Reigber A., Krieger G., Moreira A. (2015). “Reconstruction of coherent pairs of synthetic aperture radar data acquired in interrupted mode,” in IEEE Transactions on Geoscience and Remote Sensing, vol. 53 (4), 1876–1893. doi: 10.1109/TGRS.2014.2350255
Poyatos J., Molina D., Martinez A. D., Del Ser J., Herrera F. (2022). EvoPruneDeepTL: An evolutionary pruning model for transfer learning based deep neural networks. Neural Networks. 158, 59–82. doi: 10.1016/j.neunet.2022.10.011
Qu Z., Gao L.-Y., Wang S.-Y., Yin H.-N., Yi T.-M. (2022). An improved YOLOv5 method for large objects detection with multi-scale feature cross-layer fusion network. Image Vision Comput. 125, 104518. doi: 10.1016/j.imavis.2022.104518
Redmon J., Divvala S. K., Girshick R. B., Farhadi A. (2016). You only look once: unified, real-time object detection. Proceedings of the IEEE conference on computer vision and pattern recognition., 779–788. doi: 10.1109/CVPR.2016.91
Ru X., Zhang L., Liu S., Jiang Y., Li L. (2021). Physiological traits of income breeding strategy in the sea cucumber Apostichopus japonicus. Aquaculture 539, 736646. doi: 10.1016/j.aquaculture.2021.736646
Shi B., Li X., Nie T., Zhang K., Wang WJITC (2021). Multi-object recognition method based on improved YOLOv2 Model. Information Technology and Control 50(1), 13–27. doi: 10.5755/j01.itc.50.1.25094
Sun J., Zhang L., Pan Y., Lin C., Wang F., Yang H. (2018). Effect of water temperature on diel feeding, locomotion behaviour and digestive physiology in the sea cucumber Apostichopus japonicus. J. Exp. Biol. 221, jeb177451. doi: 10.1242/jeb.177451
Tan M., Pang R., Le Q. V. (2020). “EfficientDet: scalable and efficient object detection,” in 2020 IEEE/CVF Conference on Computer Vision and Pattern Recognition (CVPR). 10778–10787. doi: 10.1109/CVPR42600.2020.01079
Tian Y., Yang G., Wang Z., Wang H., Li E., Liang Z. (2019). Apple detection during different growth stages in orchards using the improved YOLO-V3 model. Comput. Electron. Agric. 157, 417–426. doi: 10.1016/j.compag.2019.01.012
Wang Z., Jin L., Wang S., Xu H. (2022). Apple stem/calyx real-time recognition using YOLO-v5 algorithm for fruit automatic loading system. Postharvest Biol. Technol. 185, 111808. doi: 10.1016/j.postharvbio.2021.111808
Wang L., Wei C., Chang Y., Ding J. (2021). Response of bacterial community in sea cucumber Apostichopus japonicus intestine, surrounding water and sediment subjected to high-temperature stress. Aquaculture 535, 736353. doi: 10.1016/j.aquaculture.2021.736353
Xu W., Wang P., Jiang L., Xuan K., Li D., Li J. (2023). Intelligent recognition and behavior tracking of sea cucumber infected with Vibrio alginolyticus based on machine vision. Aquacult. Eng. 103, 102368. doi: 10.1016/j.aquaeng.2023.102368
Xu W., Zhao L., Li J., Shang S., Ding X., Wang T. (2022). Detection and classification of tea buds based on deep learning. Comput. Electron. Agric. 192, 106547. doi: 10.1016/j.compag.2021.106547
Xu W., Zhu Z., Ge F., Han Z., Li J. (2020). Analysis of behavior trajectory based on deep learning in ammonia environment for fish. Sensors 20 (16), 4425. doi: 10.3390/s20164425
Yang P. (2023). An imaging algorithm for high-resolution imaging sonar system. Multimed Tools Appl., 1–17. doi: 10.1007/s11042-023-16757-0
Yu Z., Lee M. (2015). Human motion based intent recognition using a deep dynamic neural model. Robotics Autonomous Syst. 71, 134–149. doi: 10.1016/j.robot.2015.01.001
Yuan S., Wang Y., Liang T., Jiang W., Lin S., Zhao Z. (2022). Real-time recognition and warning of mask wearing based on improved YOLOv5 R6.1. Int. J. Intell. Syst. 37, 9309–9338. doi: 10.1002/int.22994
Zeng L., Sun B., Zhu D. (2021). Underwater target detection based on Faster R-CNN and adversarial occlusion network. Eng. Appl. Artif. Intell. 100, 104190. doi: 10.1016/j.engappai.2021.104190
Zhang X. (2023). An efficient method for the simulation of multireceiver SAS raw signal. Multimed Tools Appl., 1–18. doi: 10.1007/s11042-023-16992-5
Zhang H., Yu F., Sun J., Shen X., Li K. (2020). Deep learning for sea cucumber detection using stochastic gradient descent algorithm. Eur. J. Remote Sens. 53, 53–62. doi: 10.1080/22797254.2020.1715265
Zhao Q., Xin Z., Yu Z., Zheng B. (2021). Unpaired underwater image synthesis with a disentangled representation for underwater depth map prediction. Sensors 21, 3268. doi: 10.3390/s21093268
Zhao L., Yu J., Lin C., Ma Y. (2017). Adaptive neural consensus tracking for nonlinear multiagent systems using finite-time command filtered backstepping. IEEE Trans. Syst. Man Cybern.: Syst. 48, 2003–2012. doi: 10.1109/TSMC.2017.2743696
Zheng Z., Yang J., Yu Z., Wang Y., Sun Z., Zheng B. (2022). Not every sample is efficient: Analogical generative adversarial network for unpaired image-to-image translation. Neural Networks 148, 166–175. doi: 10.1016/j.neunet.2022.01.013
Zhu Q., Lin L., Zhao M. (2020). Sulfated fucan/fucosylated chondroitin sulfate-dominated polysaccharide fraction from low-edible-value sea cucumber ameliorates type 2 diabetes in rats: New prospects for sea cucumber polysaccharide based-hypoglycemic functional food. Int. J. Biol. Macromol. 159, 34–45. doi: 10.1016/j.ijbiomac.2020.05.043
Keywords: deep learning, sea cucumber, skin ulceration syndrome, YOLOv5S, object detection, behavior analysis, object tracking, artificial intelligence (AI)
Citation: Ge F, Xuan K, Lou P, Li J, Jiang L, Wang J and Lin Q (2024) Multi-object detection and behavior tracking of sea cucumbers with skin ulceration syndrome based on deep learning. Front. Mar. Sci. 11:1365155. doi: 10.3389/fmars.2024.1365155
Received: 03 January 2024; Accepted: 26 February 2024;
Published: 25 March 2024.
Edited by:
David Alberto Salas Salas De León, National Autonomous University of Mexico, MexicoCopyright © 2024 Ge, Xuan, Lou, Li, Jiang, Wang and Lin. This is an open-access article distributed under the terms of the Creative Commons Attribution License (CC BY). The use, distribution or reproduction in other forums is permitted, provided the original author(s) and the copyright owner(s) are credited and that the original publication in this journal is cited, in accordance with accepted academic practice. No use, distribution or reproduction is permitted which does not comply with these terms.
*Correspondence: Juan Li, bGlqdWFuMjkxQHNpbmEuY29t; Peng Lou, bG91cGVuZ0BxYXUuZWR1LmNu