 Quanxin Zheng
 Huiqun Wang1*
 Zhenyi Cao
- 1State Key Laboratory of Satellite Ocean Environment Dynamics, Second Institute of Oceanography, Ministry of Natural Resources, Hangzhou, China
- 2School of Oceanography, Shanghai Jiao Tong University, Shanghai, China
A high-precision three-dimensional hydrodynamic model based on the Semi-implicit Cross-scale Hydroscience Integrated System Model (SCHISM) was constructed to investigate the characteristics of residual currents in the Qiongzhou Strait during spring and summer. Results reveal an overall westward transport in the strait during spring and summer. However, the results also support the potential occurrence of transient eastward Eulerian residual currents, which should be evident predominantly at the surface in the central and eastern sections of the strait and mainly characterised by subtidal oscillations. The direction and intensity of these residual currents indicate a pronounced influence of pressure gradient forces on both sides of the strait. The eastward flow observed in spring may represent a compensatory mechanism resulting from the relaxation period of long-term easterly winds, whereas the generation of eastward residual currents in summer is influenced by wind stress curl differences in both the western and eastern areas of the strait. The direct impact of the summer monsoon on the flow field in the strait is relatively weak. Additionally, the direction and intensity of the residual currents in the strait exhibit potential interannual variations that are directly associated with interannual wind variations. This study provides valuable insights in relation to the ongoing discourse on the dynamics of residual currents in the Qiongzhou Strait.
1 Introduction
The Qiongzhou Strait (QS)—situated between Hainan Island and the Leizhou Peninsula—is a vital maritime passage linking Beibu Gulf (also known as the Gulf of Tonkin) with the continental shelf of the north-western South China Sea (SCS) (Figure 1A). Stretching approximately 80 km, the strait narrows to approximately 20 km at its midsection and widens to an expansive maximum of 40 km. The QS experiences robust tidal currents that are primarily influenced by two distinct tidal systems at its eastern and western entrances (Shi et al., 2002). Pronounced erosive forces have shaped the seabed topography into a jagged formation with uneven depths, with the maximum depth being almost 120 m in the central region. Erosion gives rise to tidal deltas at both entrances, with the western delta being the most prominent. A series of radiating sandbanks and channels extending toward Beibu Gulf is evident, illustrating the dynamic interplay between tidal and erosional forces in shaping the underwater landscape.
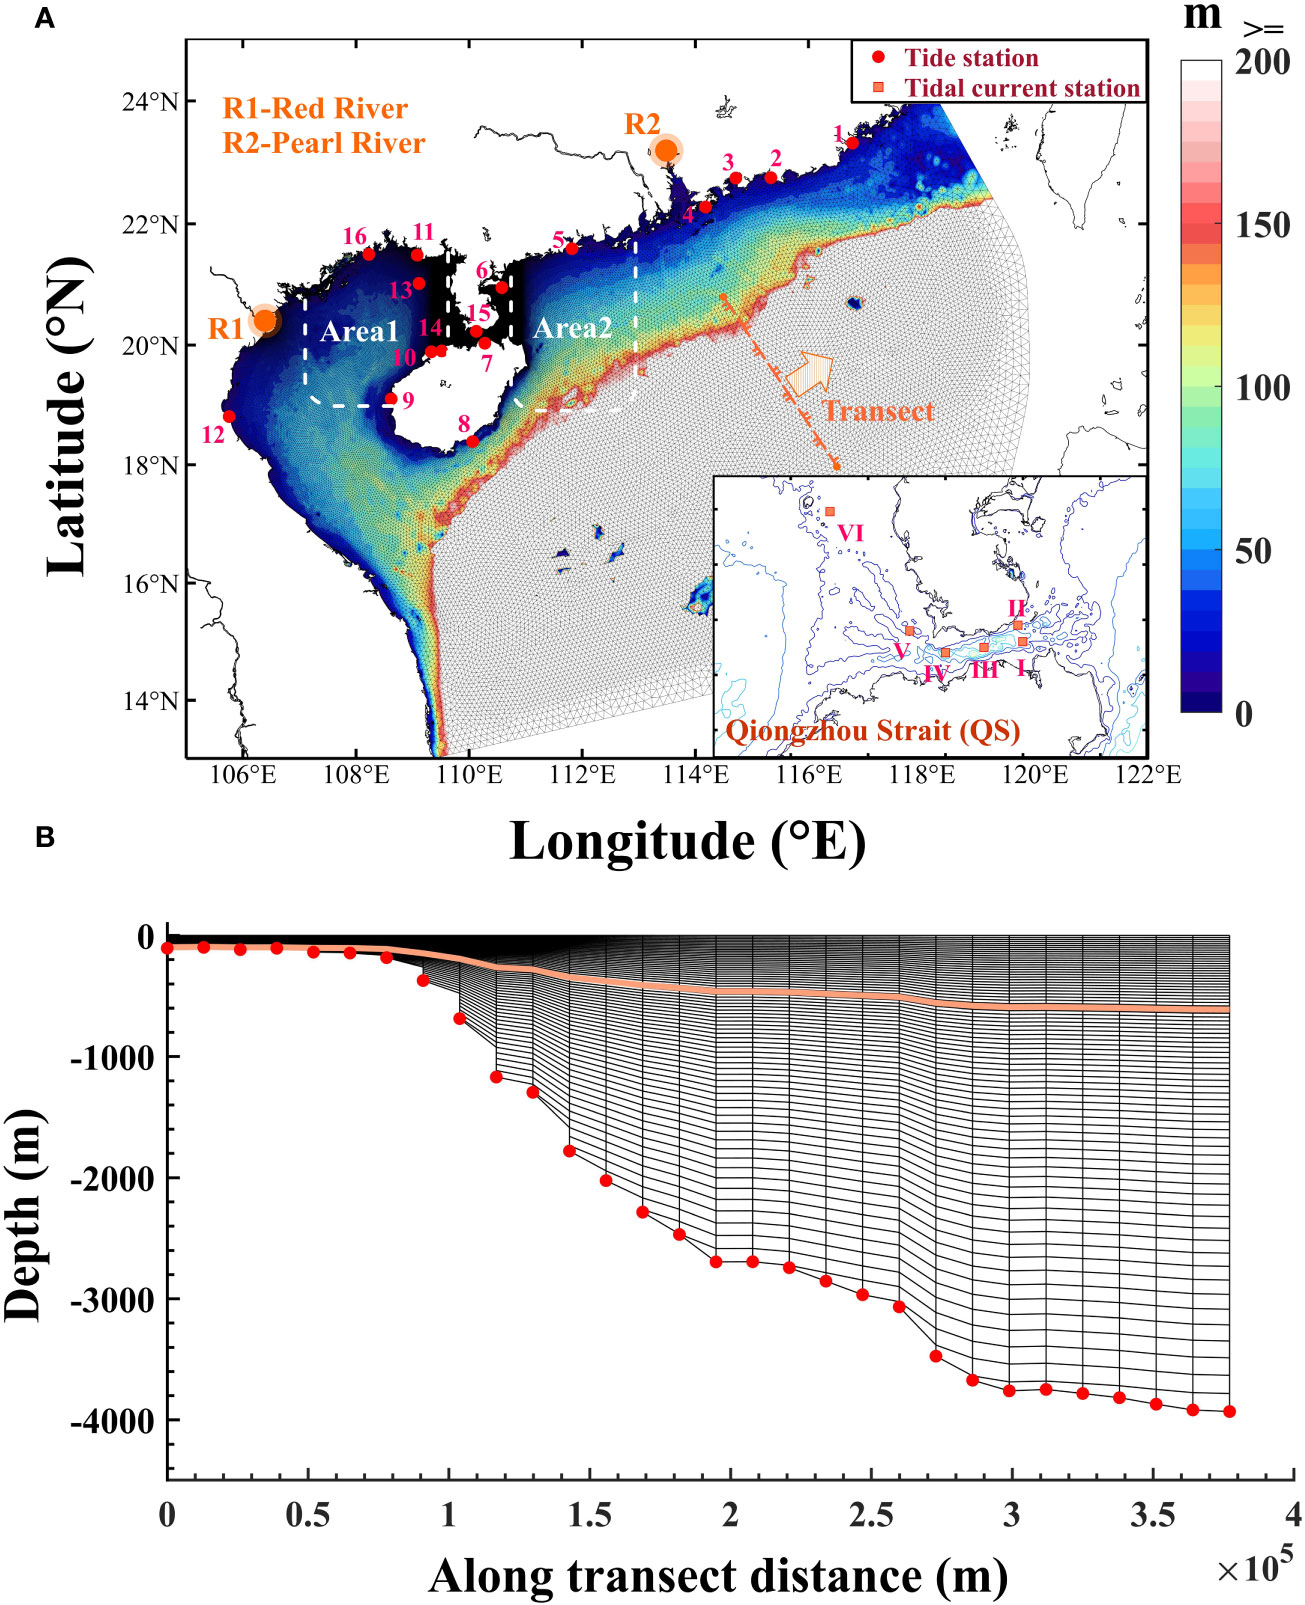
Figure 1 (A) Calculation domain and distribution of tide gauge/tidal current stations; Area1/Area2 are the range of average water level calculation (described in detail in Section 4). (B) Distribution of vertical grids along the transect in panel A; the orange line shows the bottom layer of the master grids.
Investigations of the hydrodynamics in the QS are important for understanding the circulation structure and biochemical processes in Beibu Gulf as well as the transport of materials in the north-western SCS (Yang et al., 2006; Yang et al., 2015), the distribution and sources of pollutants (such as heavy metals) in Beibu Gulf (Chen et al., 2016), the distribution of nutrients, and the prediction of algal blooms (Zheng, 2014). The contribution of water transport within the strait occurs mainly by the intricate tidal and residual currents, which are greatly influenced by the intricate topography and distinctive geographical positioning of the QS. Previous studies have proposed that the prevailing tidal components in the QS and its neighbouring coastal regions are M2 (principal lunar semidiurnal constituent), K1 (lunar–solar diurnal constituent), and O1 (principal lunar diurnal constituent), constituting collectively approximately 80–90% of the variations in coastal flow (Shi et al., 2002). Cotidal charts reveal the propagation of semidiurnal tides through the strait from Beibu Gulf, which is famous for its large diurnal tides caused by diurnal resonance (Pan et al., 2022, 2023), with diurnal tides being able to traverse the strait from both its eastern and western entrances. A comparative analysis of tidal energy spectra between Beibu Gulf and the strait reveals notable enhancements in shallow-water higher-harmonic constituents, such as MO3 and M4 (Shi et al., 2002; Ding et al., 2013; Li, 2022). Several studies have provided a preliminary understanding of the tidal flux distributions of diurnal and semidiurnal tides near the strait, suggesting that tidal energy ingress occurs on both sides of the strait (Tong et al., 2010; Jiang et al., 2018). Furthermore, the western side of the strait experiences pronounced bottom friction dissipation for both the M2 and K1/O1 constituents (Piton, 2019; Piton et al., 2020). However, research on specific tidal flux distribution characteristics remains limited. Future investigations in this direction could offer valuable insights into the nuanced dynamics of tidal interactions within the QS.
Contrary to the relatively consistent tidal current characteristics in the QS, divergent perspectives exist on the residual flow features within the strait, particularly with regard to the existence of an eastward flow. Shi et al. (2002) utilised long-term mooring data and a structured grid model and concluded that a westward flow prevails throughout the year. Their analysis of tidal experiments and momentum balance suggested that this significant westward flow is driven primarily by tidal forcing, with O1 and K1 being the main constituents. Accordingly, Zhu et al. (2014, 2015) and Chen et al. (2021) conducted Acoustic Doppler Current Profiler (ADCP) surveys in the central part of the strait during spring 2013, affirming the calculations of Shi et al. (2002) and indicating that numerical models maintain good explanatory capabilities within the strait. Other studies, based on density gradients and temperature–salinity data, suggested that water enters Beibu Gulf from the north-western SCS (Xia et al., 2001; Yang et al., 2006).
Conversely, some studies have argued that the eastward flow can persist in summer because of the influence of the summer monsoon (Gao et al., 2015; Bai et al., 2016; Gao et al., 2017; Zavala-Garay et al., 2022; Piton et al., 2021). A study using mooring current observations at the western entrance of the QS during spring and summer of 2006–2007 identified a significant eastward flow during summer, affecting water until approximately 15 m depth. This study also identified brief periods of reversal with daily oscillations during spring (Zhang et al., 2009). Wang et al. (2014) employed ADCP observations and revealed an eastward flow on the surface of the middle strait in August 2010. The complexity of these findings underscores the need for further research to elucidate the dynamics of residual flows in the QS and the factors that influence their variability.
Although numerous studies have been conducted to explore tides and residual currents in the QS, controversies persist, especially regarding the direction of residual currents—particularly during summer—with evidence from both models and field measurements contributing to this debate. Different studies may arrive to different conclusions depending on whether seasonal variations are considered. Previous studies have some limitations, including the use of smaller computational domains and the need for an overly smoothed topography in explicit structured grid models for numerical stability (Shi et al., 2002; Zheng, 2015; Cheng et al., 2017; Piton, 2019). This may compromise the preservation of details in the simulations and the impact of the rapidly changing terrain or coastline in certain parts of the strait. To address these issues, this study adopts the semi-implicit cross-scale hydroscience integrated system model (SCHISM). This model can incorporate various external forcing factors with high spatiotemporal resolutions while maintaining the original topography. Consequently, this approach enables a more comprehensive discussion on the water exchange characteristics and regulatory mechanisms in the QS. Details on the specific model and data used in this study are presented in Section 2. The results of the numerical experiments are presented in Section 3. By employing an advanced modelling approach that considers the intricate topography and various external factors, this study contributes valuable insights regarding the water dynamics in the QS.
2 Data and methods
2.1 Hydrodynamic model
SCHISM is a sophisticated three-dimensional finite-element model for simulating fluid and ecological dynamics within the realm of oceanography (Zhang et al., 2015, 2016). Operating on unstructured grids (UG), the model boasts several unique features: (1) Utilization of unstructured hybrid triangular/quadrilateral grids in the horizontal dimension and option between hybrid SZ coordinates (hybrid S and shaved z coordinates) or the innovative LSC2 layering scheme in the vertical dimension; (2) integration of a cutting-edge high-order implicit convection transport scheme (TVD2), ensuring both mass conservation and monotonicity; (3) high-order transport capabilities in the horizontal dimension, employing third-order weighted essentially non-oscillatory (WENO) formalism (Ye et al., 2019), alongside a novel momentum equation convection scheme that includes optional high-order Kriging and explicit local adaptive dissipation filters; (4) incorporation of new horizontal viscosity schemes, including biharmonic viscosity, adept at effectively filtering out spurious inertial modes without inducing excessive dissipation; (5) commendable tolerance for grid quality in non-tidal areas, eliminating the necessity for depth smoothing. In essence, this model represents a fusion of efficient and accurate semi-implicit finite-element and finite-volume methods. The model also incorporates the generic length scale (GLS) proposed by Umlauf and Burchard (2003) to evaluate the eddy coefficient. The advantage of the GLS is that it includes most terms from the closure schemes of two-equation models. Augmented by the Euler–Lagrange algorithm, SCHISM addresses the hydrostatic form of the Navier–Stokes equations. This comprehensive approach enables the model to simulate a wide spectrum of physical and biochemical processes within water bodies, making it a versatile tool for advancing oceanographic research.
2.2 Numerical configuration and dynamics implication
The model domain coverage is shown in Figure 1A, where the grids in the west encompass the entire Beibu Gulf and extend south to the basin of the northern South China Sea (NSCS). The eastern boundary extends to the Taiwan and Luzon Straits and encompasses the Pearl River Estuary. The horizontal grid comprises 161,277 nodes and 316,763 triangular elements. The coastline data utilised in the model are derived from the global self-consistent, hierarchical, high-resolution geography database (GSHHG, https://www.ngdc.noaa.gov/mgg/shorelines/shorelines.html), with specific modifications introduced using electronic nautical charts for the NSCS. Regarding bathymetry data, ETOPO 2022 is employed with a resolution of 15 arcsec (approximately 460 m, https://www.ncei.noaa.gov/products/etopo-global-relief-model). The maximum water depth is approximately 4,800 m, in the south-eastern part of the computational domain. The grid resolution increases from the south-east boundary towards Beibu Gulf, maintaining a resolution of approximately 18-km in the open sea. Local refinement is implemented with a resolution of approximately 8 km to address significant depth variations on the north-western slope of the SCS. Within Beibu Gulf, the resolution narrows to 2–4 km and further increases to 500 m near the QS. In the vertical direction, this study adopts a flexible vertical layering approach (local coordinates) previously utilised by Zhang et al. (2015) and Yu et al. (2017). The main vertical grid is configured with an average of 47 layers (Figure 1B), including 30 layers of master grids in regions shallower than 100 m and a maximum of 77 layers, providing a comprehensive representation of the vertical structure of the water column.
The tidal current and elevation forcing at the open boundary are generated using FES2014 (https://www.aviso.altimetry.fr/en/data/products/auxiliary-products/global-tide-fes.html), encompassing 14 tidal components (M2, K1, O1, S2, Q1, P1, N2, K2, M4, M6, MS4, SSA, MM, and MF) driven by harmonic constants. The model produces hourly wide-area water level results, and harmonic analysis using the T_Tide software package (Pawlowicz et al., 2002) extracts the cotidal charts for diurnal tides, represented by K1, and semi-diurnal tides, represented by M2. The amplitude and phase distributions of these tidal constituents are shown in Figure 2. The tidal constituents in FES2014—a numerical outcome derived from a global ocean tidal finite element model that exhibited significantly enhanced accuracy compared with its predecessors, namely FES2004 and FES2012—are used as reference for this analysis. The amplitude and phase distributions of both the diurnal and semidiurnal tides in the model are consistent with those of FES2014 and align with the findings of previous studies (Xu et al., 2010; Minh et al., 2014; Ding et al., 2017). Specifically, the M2 tide reveals a degenerate counterclockwise amphidromic point in the north-west of Beibu Gulf, with an amplitude of approximately 40 cm, and the amplitude increases towards the Leizhou Peninsula in the eastern part of the QS. The K1 tide features an amphidromic point near Hue (Vietnam) and achieves an amplitude of 90 cm.
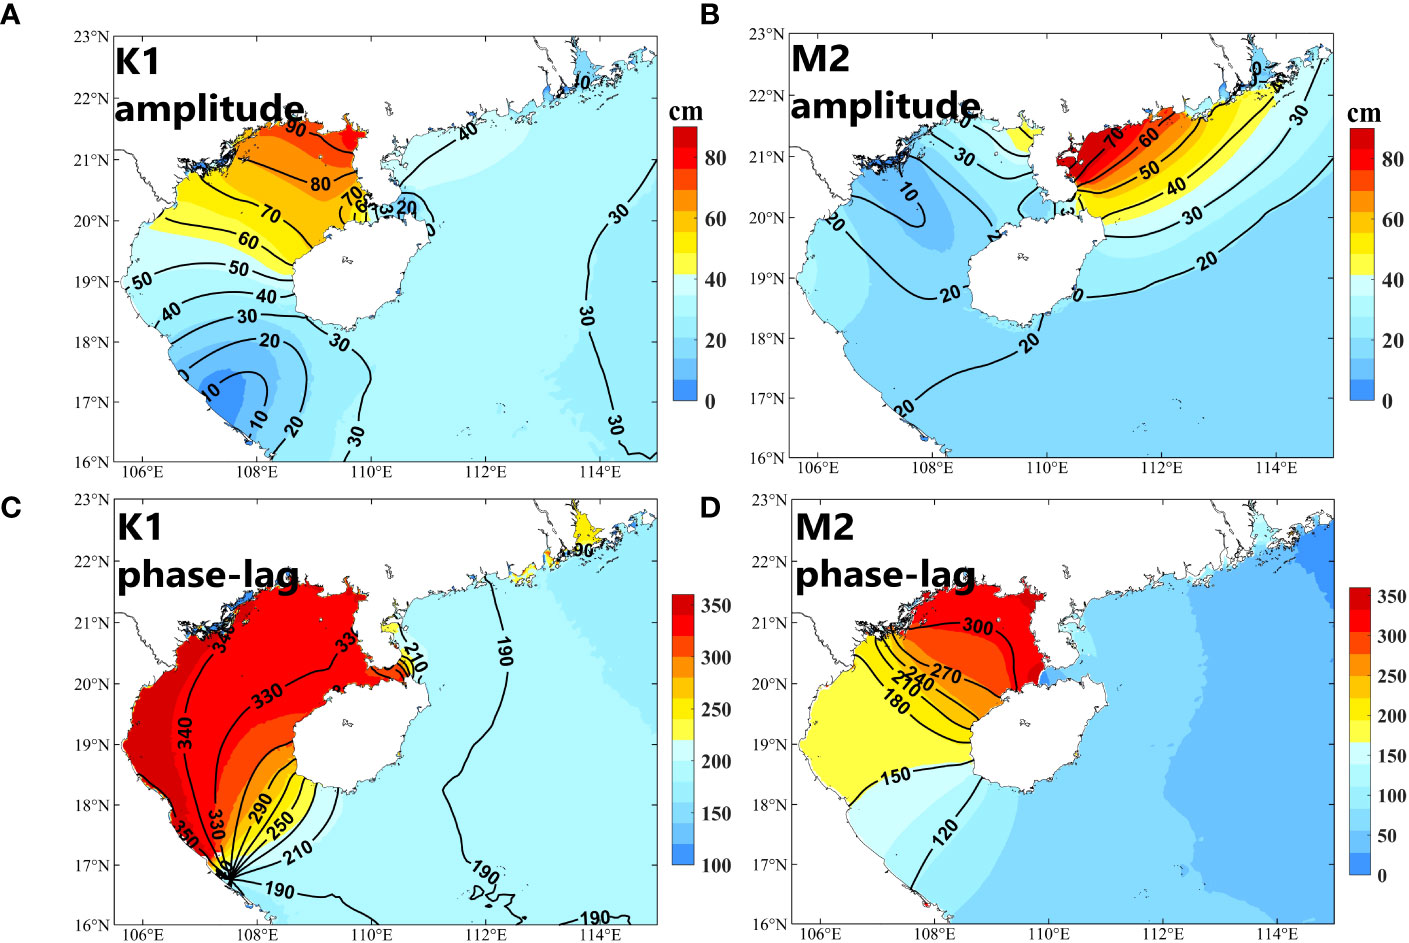
Figure 2 Cotidal charts of (A, B) tidal amplitude (cm) and (C, D) phase lag (degree) for the (A, C) K1 and (B, D) M2 constituents from the model simulation (coloured area) and FES2014 (black contours).
The residual current and water level at the open boundary are generated using the HYCOM + NCODA global analysis data (https://www.hycom.org/). These data not only establish the initial conditions for the model but also establish a ‘hot start’, incorporating sea surface height, temperature, salinity, and flow velocity data. Atmospheric forcing at the sea surface is based on ERA5 reanalysis data (https://cds.climate.copernicus.eu/cdsapp#!/dataset/reanalysis-era5-single-levels?tab=form) from the European Centre for Medium-Range Weather Forecasts (ECMWF). Specific details on the HYCOM and ERA5 data are presented in Table 1, which provides a comprehensive overview of the atmospheric and oceanic input parameters used to drive and initialise SCHISM for accurate simulations in the QS.
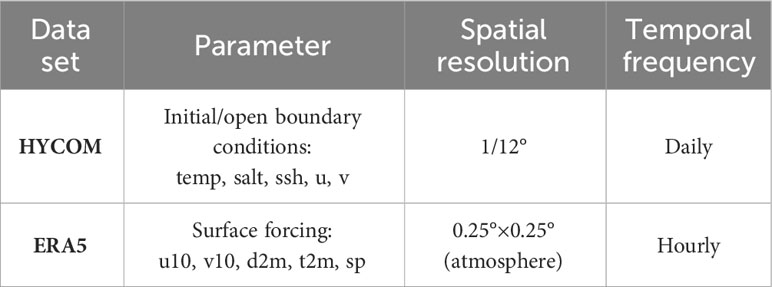
Table 1 HYCOM/ERA5 inputs.
3 Results
3.1 Model validation and tidal waves in the QS
Surface elevations of 16 tidal gauge stations are selected for analysis (Figure 1A) using data from the Global Tidal Data Platform (http://global-tide.nmdis.org.cn/). The validation period spans from January to March 2021, and the results, as illustrated in Figure 3, reveal robust fitting outcomes at all 16 stations, with errors being mostly less than 10 cm. Notably, Shantou station at the model boundary exhibits larger errors, which are attributed to boundary effects, whereas station 7 in Haikou may present differences due to depth interpolation or coastline resolution issues (Ding et al., 2017). Overall, the model establishes its credibility by accurately simulating water level variations.
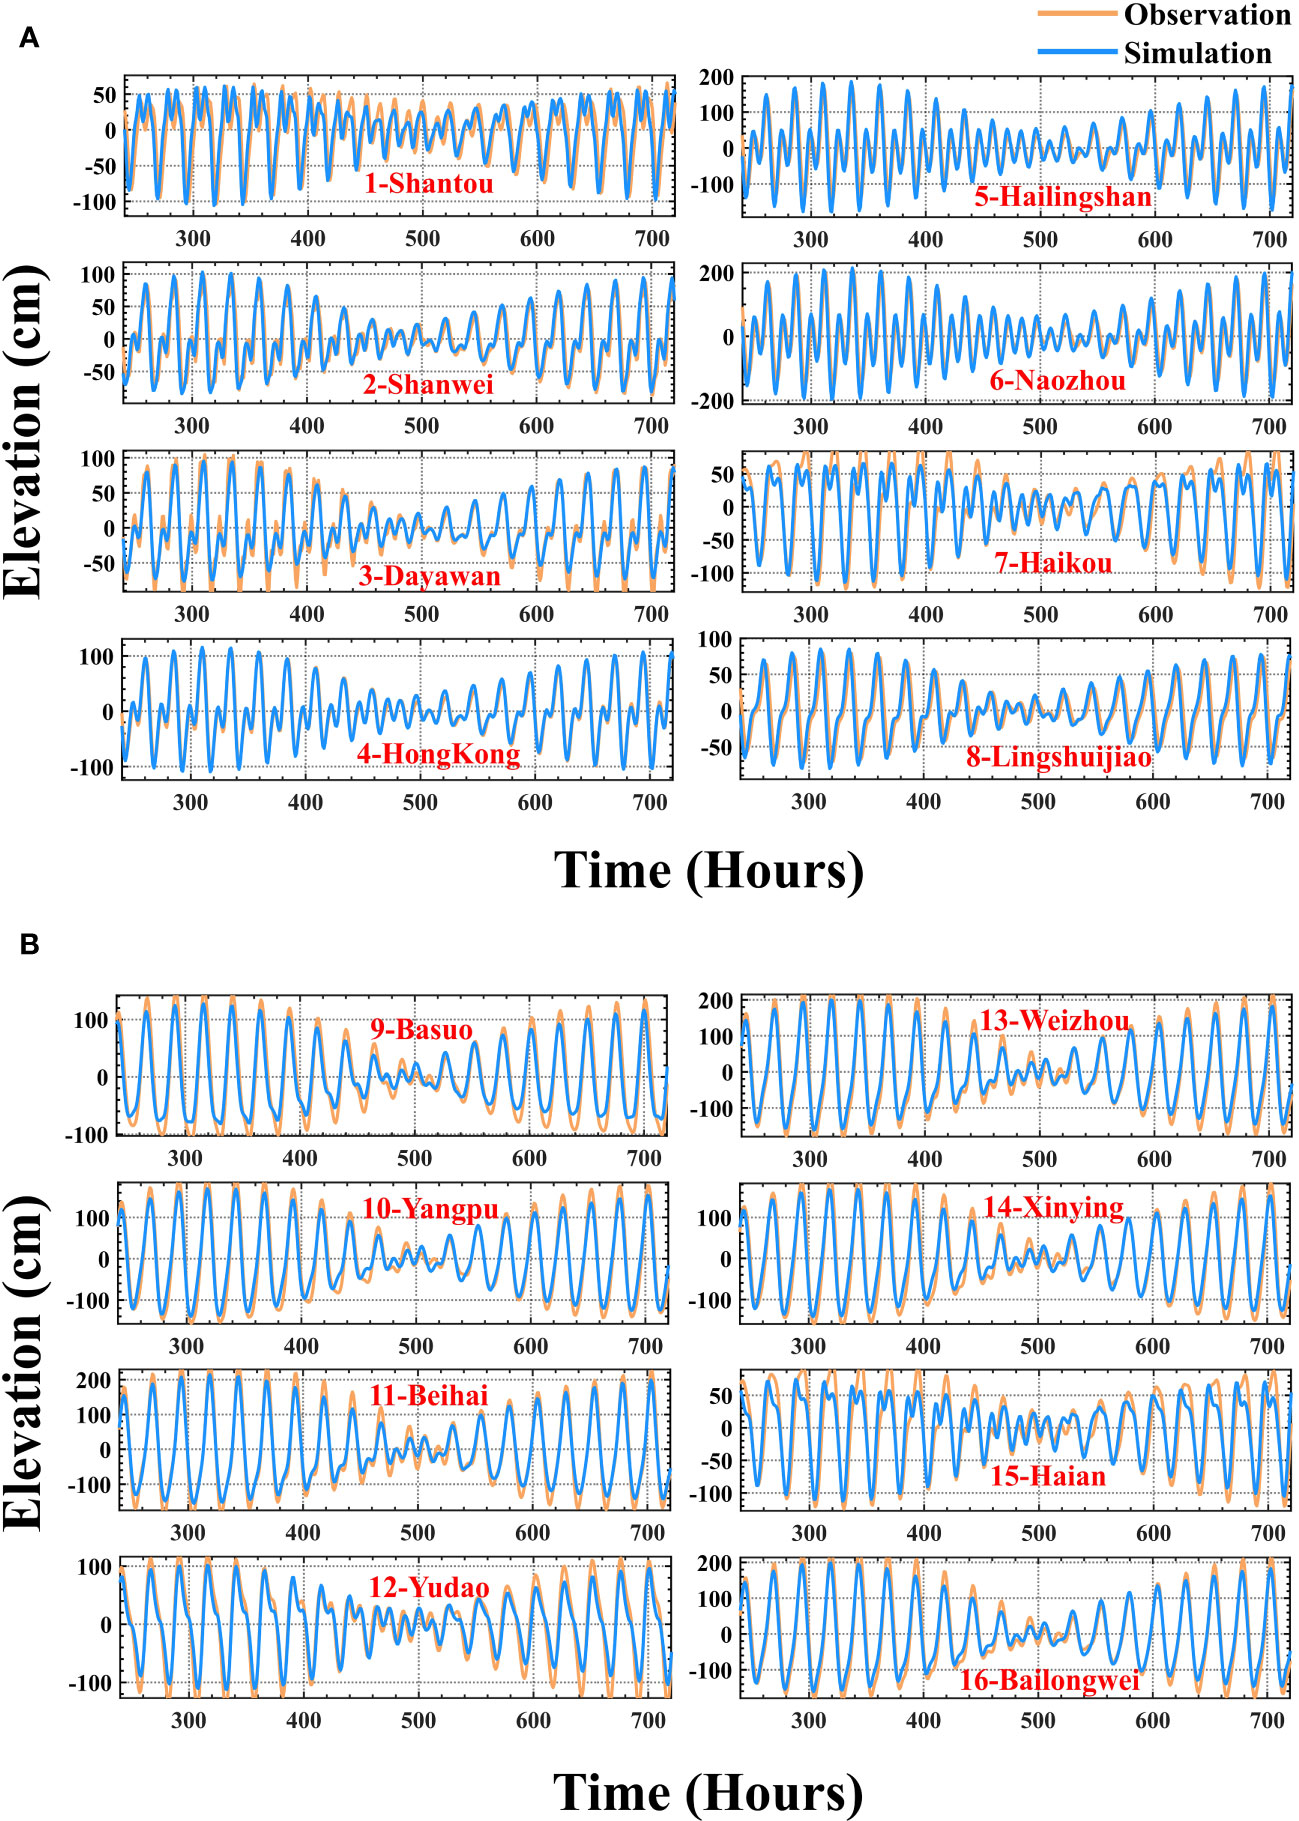
Figure 3 Fitting results between predicted (yellow) and modelled (blue) values at tidal gauge stations (panel A: station 1-8; panel B: station 9-16). The time series covers the period since 01 January 2021 at an hourly interval.
Verification of the surface flow velocity and direction in the QS was conducted by comparison with data obtained from the forecasted values of the Global Tidal Data Platform for a selected time period in March 2021. The distribution of the monitoring stations is shown in Figure 1A, and the validation results are shown in Figure 4. The modelled flow velocity generally aligns with the forecasted values both in magnitude and trend. However, some discrepancies in details are evident; these are primarily attributed to the limited selection of the two characteristic angles in the forecasted values. This limitation can result in significant angular differences during flow reversal. Despite these discrepancies, the good fit of the long time series data highlights the robustness of the model and its accurate description of the flow field in the QS.
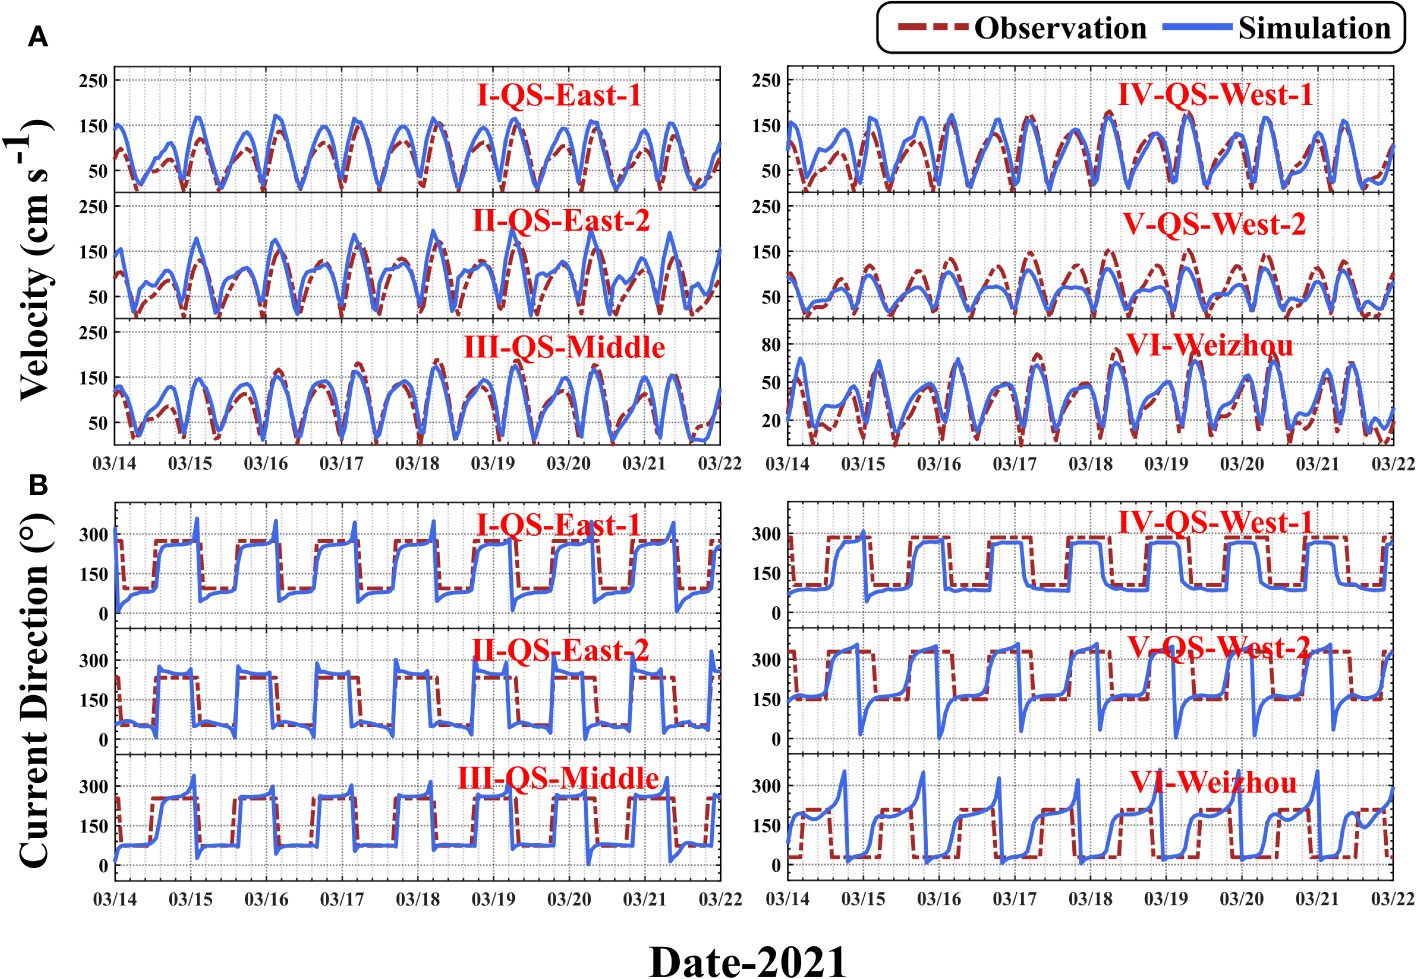
Figure 4 Validation of the modelled flow (A) rate and (B) direction. Red dotted lines represent observed values, and blue lines represent simulated values.
The distributions of tidal amplitudes and phase lags in the QS are shown in Figure 5, where the diurnal tide is characterised by K1, and the semidiurnal tide is represented by M2. The semidiurnal tidal waves exhibit a general west-to-east propagation through the strait, featuring a quasi-amphidromic point at the south-western corner of the Leizhou Peninsula. The amplitude gradually increases along the direction of propagation, ranging from approximately 10 cm at the western entrance to 50 cm at the eastern entrance. The tidal wave propagation speed can be estimated from the density of the co-phase lines. Notably, the speed of semi-diurnal tides rapidly increases after passing through the QS, whereas diurnal tides exhibit a different propagation direction. Co-phase lines for diurnal tides indicate propagation from east to west across the QS, with a noticeable decrease in speed upon entering the strait. A quasi-amphidromic point emerges at the north-eastern corner of Hainan Island. Post-modulation, the distribution of the co-phase lines becomes nearly parallel to the northern and southern coasts. Another diurnal tide enters from the southern mouth of Beibu Gulf, reaches the west side of the strait, and propagates from west to east at a speed similar to that inside the strait. Convergence of these two diurnal tides is observed north-west of Hainan Island.
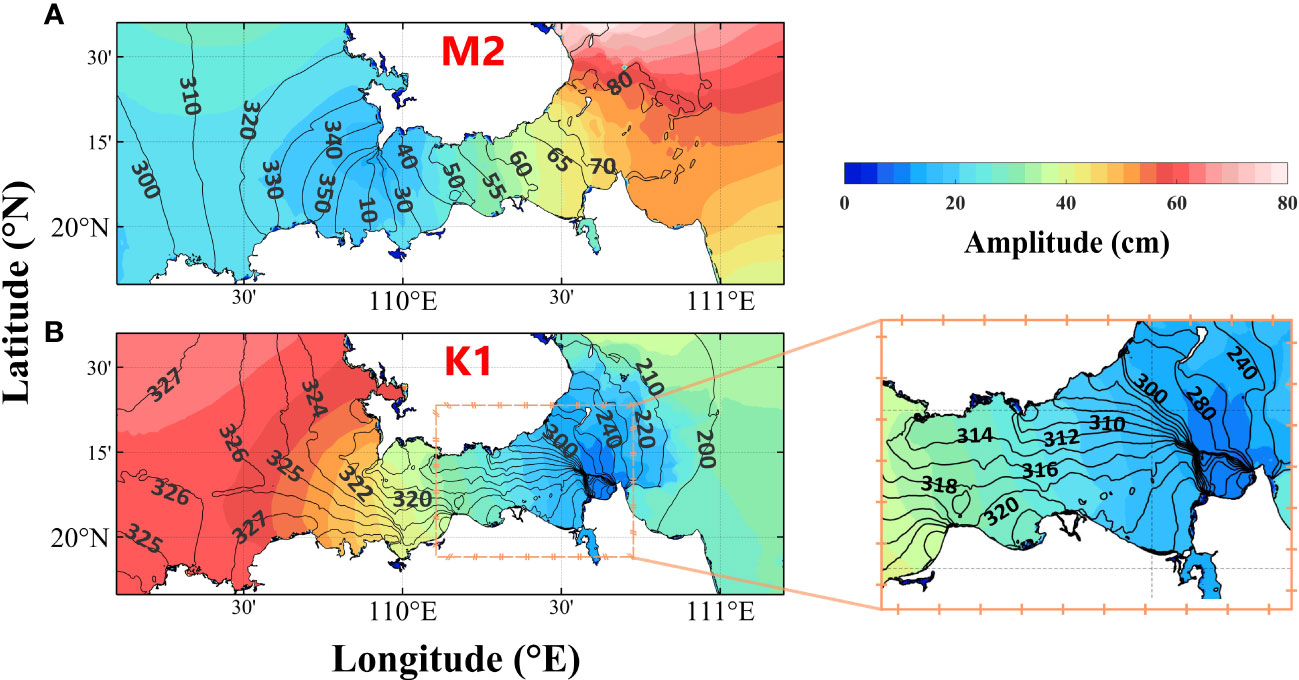
Figure 5 Amplitude and phase distributions of the semi-diurnal [M2-(A)] and diurnal [K1-(B)] tidal components in the QS.
The amplitudes of K1 increase with the phase lag, with minimum values at the eastern mouth ranging from 10 to 20 cm and maximum values at the western mouth reaching 70–80 cm. These overall characteristics align with the results of the numerical simulations of Shi et al. (2002). However, the numerical values and intervals of equal-amplitude lines and equal-phase lag lines within the strait and on the eastern side may vary owing to changes in topography and the influence of model/interpolation accuracy.
This study also considered the computational methods of Wu et al. (2020) and Dai et al. (2017) to provide the tidal flux distribution characteristics in the QS in the form of tidal constituents, as shown in Figure 6. The calculation formula is as Equation 1:
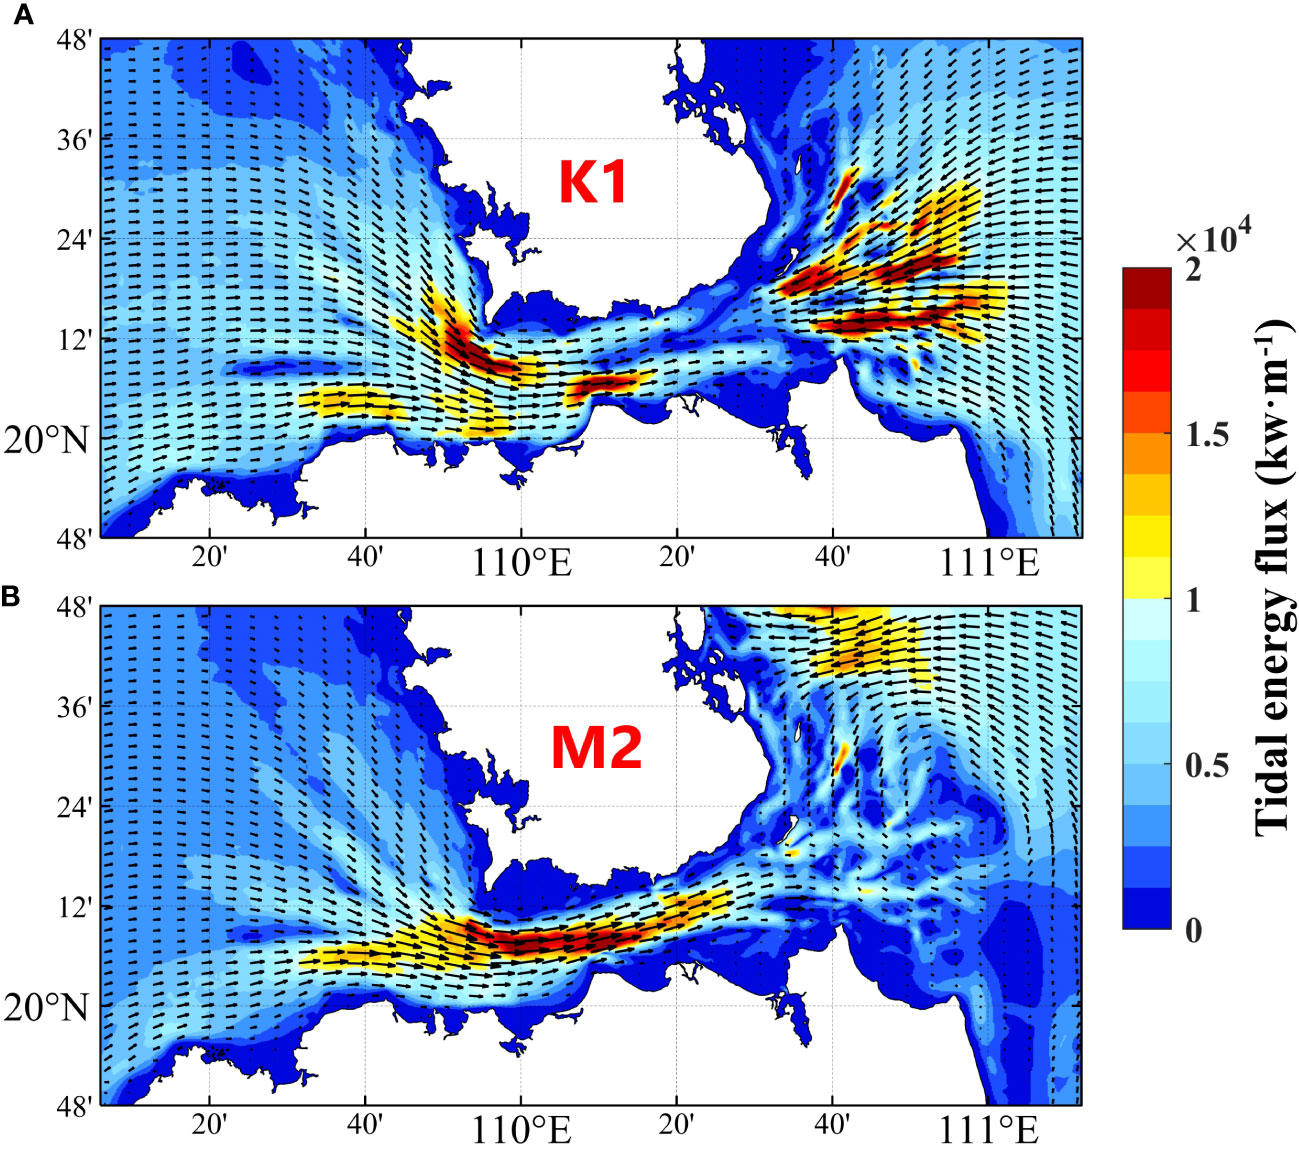
Figure 6 Distributions of the energy flux densities of the diurnal [K1-(A)] and semi-diurnal [M2-(B)] tides in the QS.
where represent the components of tidal energy flux density in the directions, is time, is the tidal period, is water depth, is the density of seawater, which is assumed to be 1,025 kg/m3 in this study, is the acceleration due to gravity, which is taken as 9.8 m/s2 in this study, represents the elevation of the sea level (in meters), represent the vertical average flow velocities in the directions (m/s), and represent the amplitude (m/s) and phase lag (°) of the tide, respectively, are the amplitudes of the tidal flow components in the directions (m/s), and represent the corresponding phase lags (°).
The overall characteristics of the tides in the QS presented in this study align with those described by Wang and Wang (2009) for the diurnal and semi-diurnal tides (represented by K1 and M2, respectively) and Zhao et al. (2010). However, our study provides a more detailed distribution in the QS. The tidal waves at the eastern and western entrances of the strait predominantly originate from the NSCS, propagating westward and bifurcating into two main branches that enter Beibu Gulf and the western coast of Guangdong Province (Shi et al., 2002).
In the semi-diurnal tide, the M2 tidal fluxes are relatively large, entering the strait from the western entrance and reaching their maximum value in the central part of the strait, i.e. up to 2×10⁴ kW/m. The K1 tidal fluxes further illustrate the characteristics of tidal waves propagating in opposite directions on both sides of the strait. Energy is transmitted from both the east and west sides into the interior of the strait with magnitudes close to those of the semi-diurnal tides. The transition zone of the interaction is located approximately along the Mulan Bay–Beila Port line, as observed from the distribution of tidal amplitudes and phase lags in Figure 5.
After passing through this transition zone, the propagation speed of the tidal waves rapidly decreases. This suggests that although the tidal waves from the east and west sides intersect north-west of Hainan Island based on the lines of equal phase lags, this may already be a result of the superposition of waves from both directions. From the perspective of tidal energy propagation, it is likely that the tidal waves on both sides of the strait meet at its eastern entrance. The current numerical model results further support the existence of local tidal wave resonance in the QS, encompassing interactions among tidal waves as well as between tidal waves and terrain (Shi et al., 2011; Ding et al., 2013; Zhu et al., 2014; Cheng et al., 2017; Li, 2022).
3.2 Residual flow exchange in the QS
The distribution and variations of the background residual flow field in the QS were examined through numerical simulations, offering insights into the seasonal and interannual variations of the water transport. The results shown in Figures 7, 8 were obtained separately for 2021, 2022, and 2023, serving as reference experiments for the exploration of the residual flow field and subsequent mechanism. Monthly averages were used to derive the residual flow distribution for each month. Unlike longer-term seasonal averaging, which might smooth the overall patterns, this study opted for monthly averages to capture more pronounced variations and achieve a more effective comparative analysis. The results for February represent the winter residual flow, whereas those for July represent the summer residual flow.
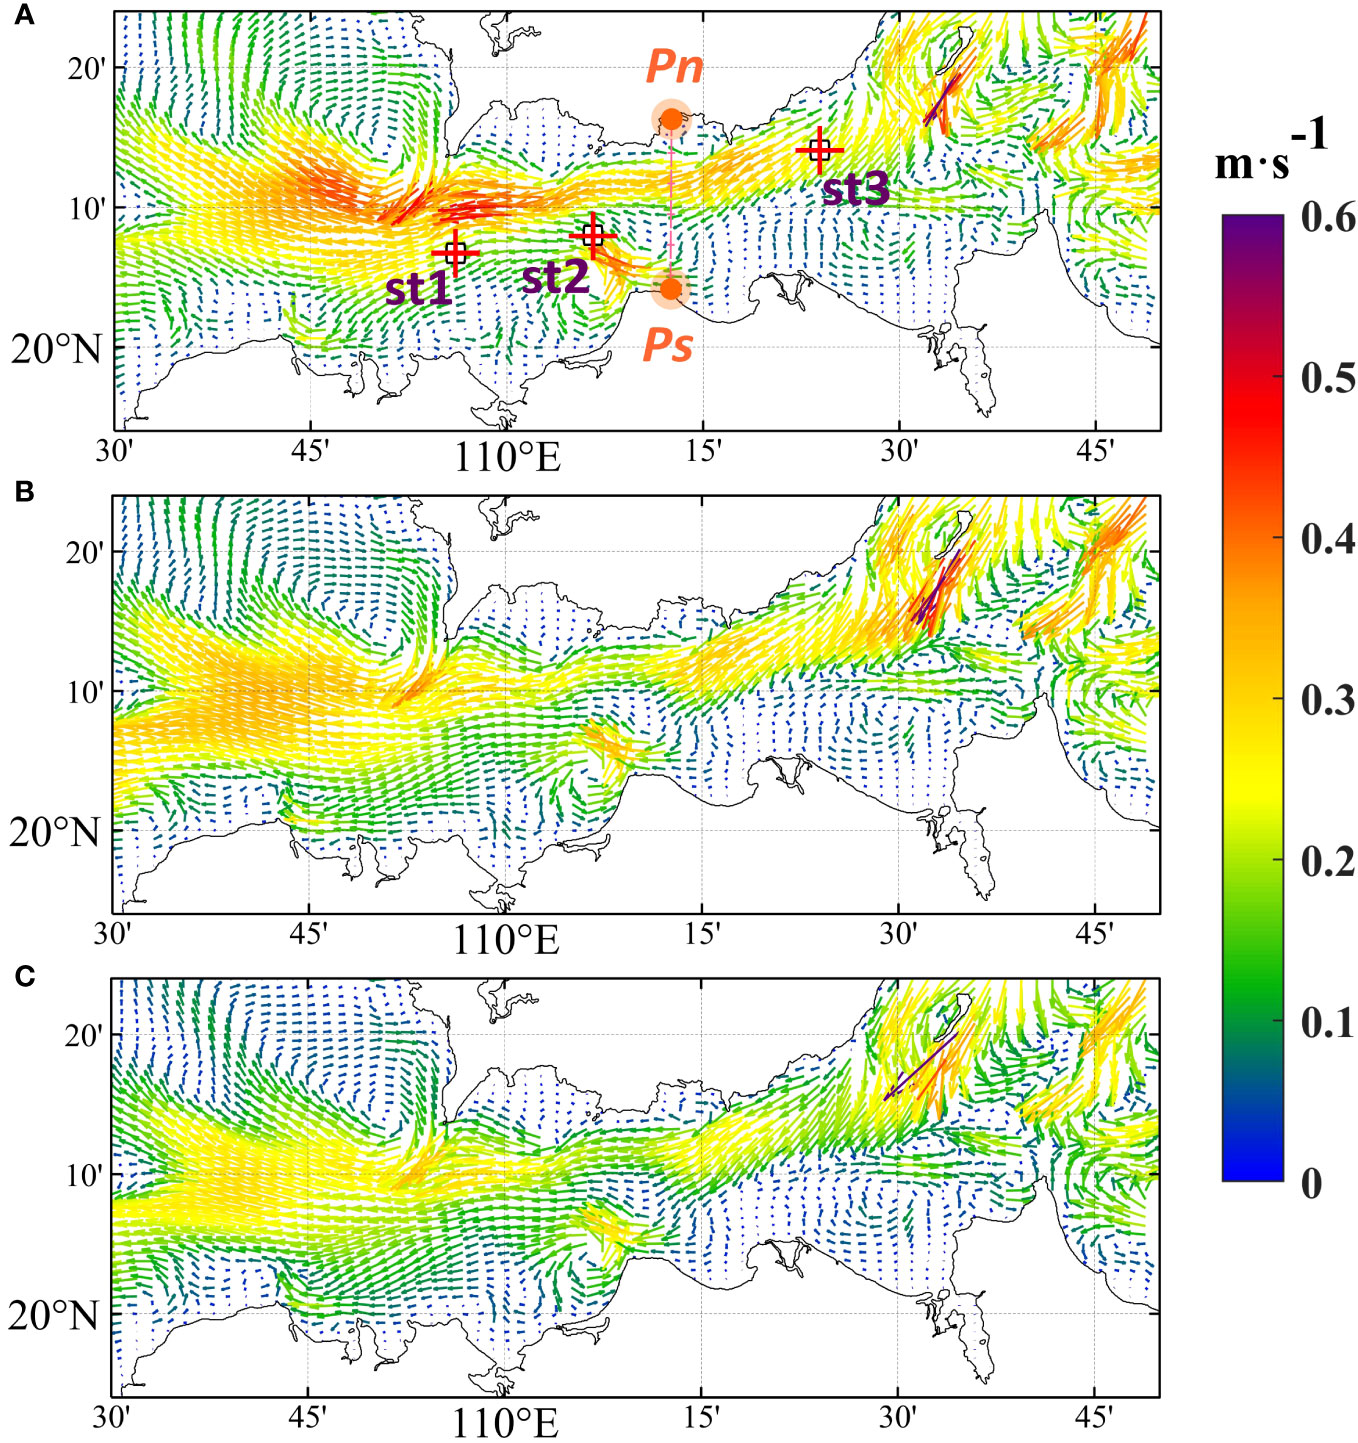
Figure 7 Distributions of surface residual currents in the QS during the winters of (A) 2021, (B) 2022, and (C) 2023. The characteristic points st1–st3 and transect Pn–Ps are described in detail in Section 4.
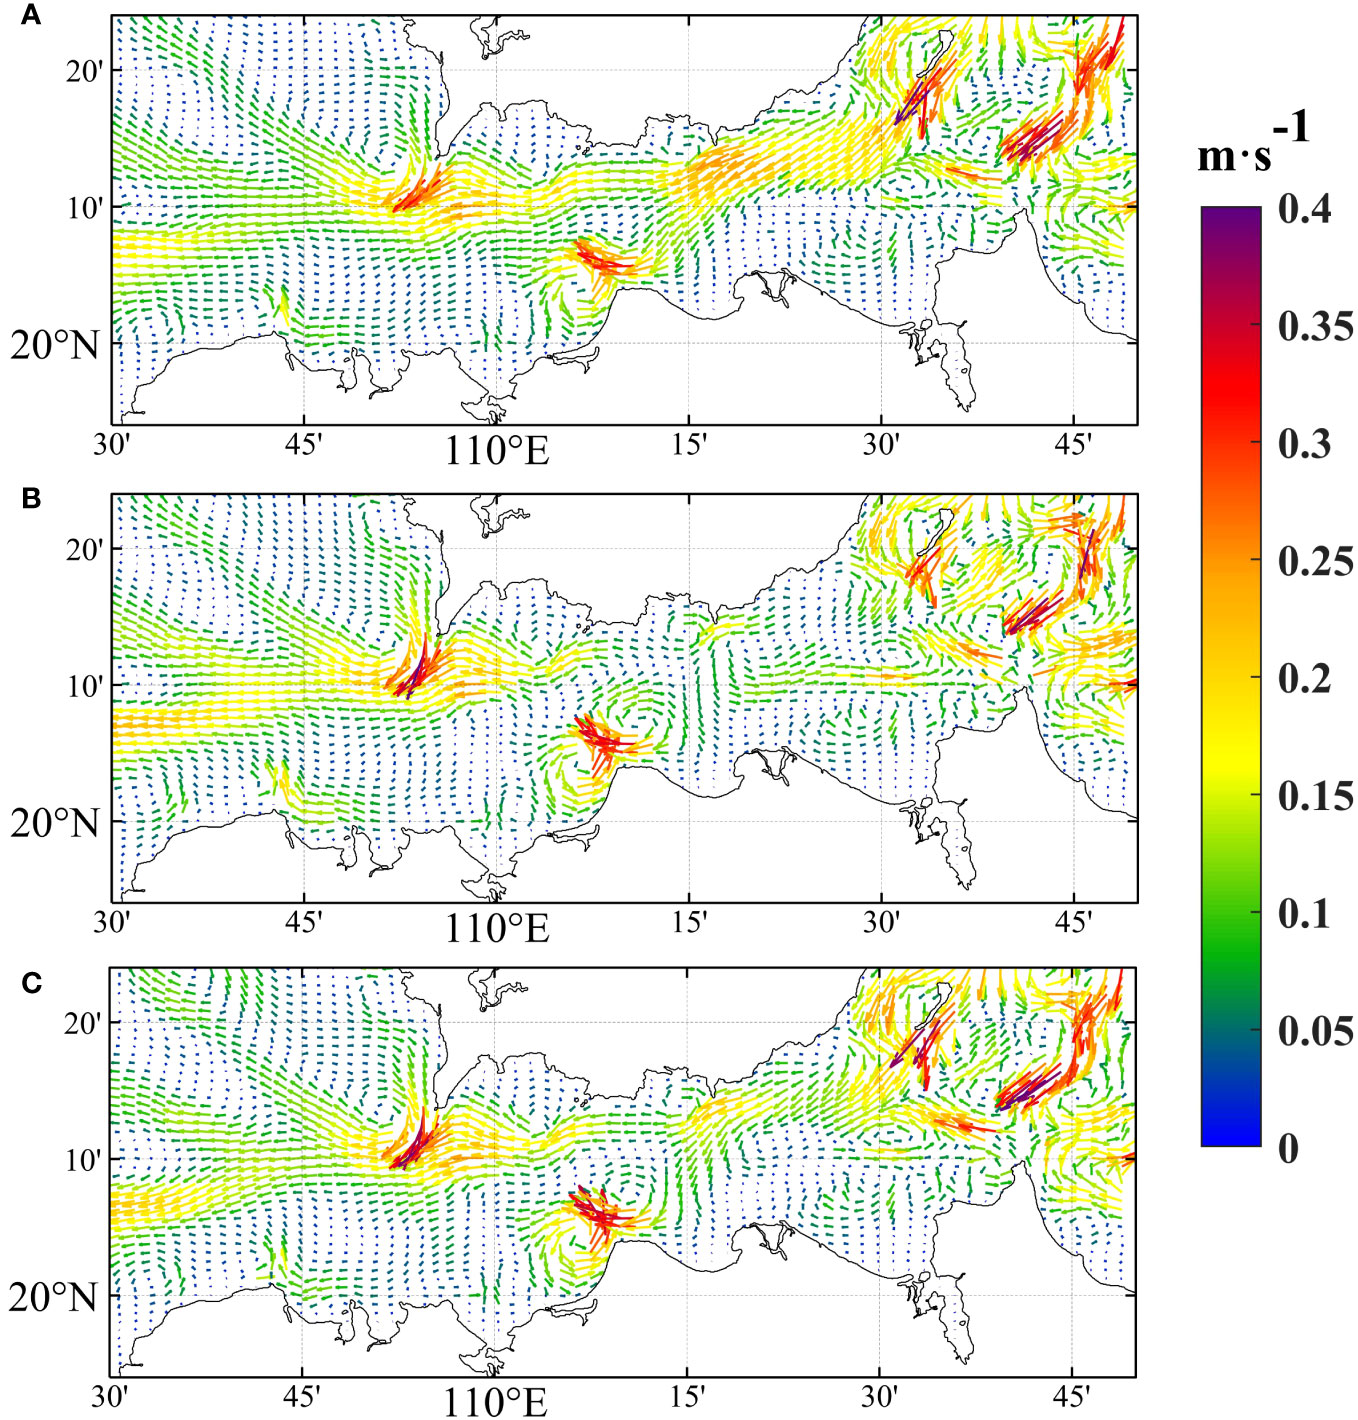
Figure 8 Distributions of surface residual currents in the QS during the summers of (A) 2021, (B) 2022, and (C) 2023.
Figure 7 reveals that the winter surface residual current in the QS generally flows westward, reaching maximum flow velocities of 0.4–0.5 m/s. The distribution of flow velocity correlates with water depth. Near the prominent dividing ridge on the west side of the strait, there is a high-velocity zone that increases with water depth, which is particularly evident in winter 2022 (Figure 7B). Additionally, irregular flow velocity distributions or eddy-producing areas are evident near the eastern entrance of the strait because of the complex terrain there. This is consistent with the findings of Shi et al. (2002) and Chen et al. (2009). Importantly, these areas do not significantly impact the residual currents within the strait and tend to disappear with the smoothing of the terrain. The distribution of the flow vectors reveals that the background flow enters from the north-eastern entrance of the strait and crosses the channel along the Leizhou Peninsula into Beibu Gulf. The flow velocity in the middle of the strait exhibits a north-high and south-low distribution; this pattern occurs also in summer (Figure 8).
The summer surface residual current in the QS (Figure 8) generally exhibits weaker velocities compared to those of the winter surface residual current, with the maximum residual current velocities reaching 0.2 m/s in certain areas near specific topographical features. The high-velocity zone in the central–western region of the strait resembles the distribution of the K1 tidal energy flux (Figure 6A). The influence of topography on current distribution is more pronounced. Numerical simulation results for 2021–2023 indicate that the QS experiences westward transport during summer, which is consistent with previous studies (Shi et al., 2002; Zu et al., 2005; Dasen, 2006; Chen et al., 2009; Zhu et al., 2014; Zheng, 2015; Ding et al., 2017).
Nevertheless, interesting features appear especially in summer 2022 (Figure 8B). During this period, a distinct eastward flow is evident for the surface residual current in the central part of the strait. This contrasts with the significant westward flow observed in summer 2021. Monthly eastward transport from the northern part of Haikou to the northern part of Mulan Bay is evident, accompanied by a noticeable weakening of the strong westward flow along the northern coast of the Leizhou Peninsula. This implies the existence of another form of eastward transport in the QS during summer, besides the diurnal oscillation characteristics proposed by Zhang et al. (2009), which manifest as subtidal oscillations in this study.
The observed eastward transport in summer 2022 may indicate interannual variability or influence of larger-scale factors, offering a new perspective on the contradictory findings of previous studies. This highlights the dynamic nature of the residual currents in QS, which are subject to varying conditions and influencing factors over time.
4 Discussion
The QS serves as a crucial channel connecting the NSCS and Beibu Gulf and is characterised by complex water transport patterns influenced by various factors. Previous studies have highlighted the significant role of tides in driving westward transport either by simulating residual currents driven by different tidal components (Shi et al., 2002) or by removing tidal influences from the models (Chen et al., 2015; Zavala-Garay et al., 2022). Gao et al. (2015) and Zavala-Garay et al. (2022) proposed that the summer monsoon could be a key factor determining the eastward flow. Factors such as coastal currents in western Guangdong and density gradients (Xia et al., 2001; Yang et al., 2003; Chen et al., 2019) also contribute to the overall dynamics. However, the direction of summer water transport in the QS remains controversial.
In Section 3.2, three years of summer surface residual currents are analysed to assess the possibility of eastward transport. Previous studies have suggested that eastward transport in the QS is mainly influenced by the south-western summer monsoon and is concentrated in the surface layer. Only after the upper water layer turns eastward can the lower layer exhibit eastward transport. In this study, vertical profiles are examined to investigate the effect of eastward flow on the depth of the water layers. The profiles are taken at the central part of the strait (near 110.2° E) along the Pn–Ps transect, as shown in Figure 7A. The results are presented in Figure 9, where panels Figures 9A–C present the distribution of residual currents along the east–west direction for the summers of 2021, 2022, and 2023, respectively, and Figure 9D presents the average state of the three years. Positive values (red) indicate eastward flow, whereas negative values (blue) indicate the opposite direction.
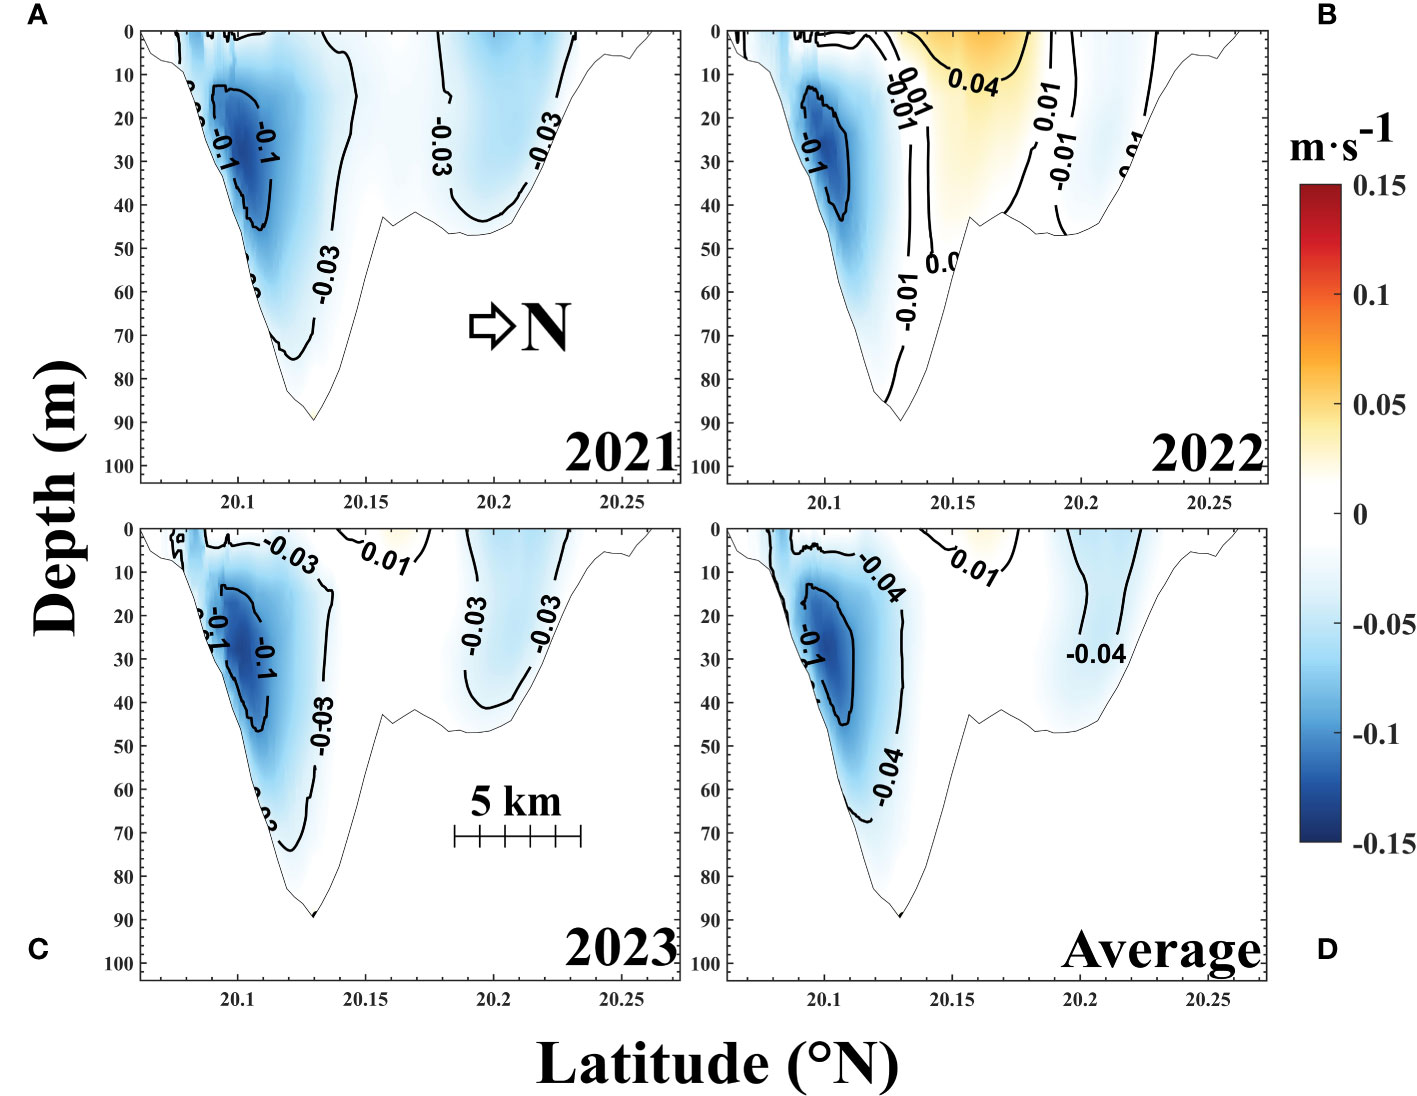
Figure 9 Distribution of residual currents along the east–west direction (transect along the Pn–Ps in Figure 7) during the summers of (A) 2021, (B) 2022, and (C) 2023 and (D) the average state of the three years.
4.1 Potential interannual variability
In summer 2021, the large-scale residual flow results presented in Figures 8, 9 suggest a prevailing westward flow in the QS from the surface to the bottom. In the profile (Figure 9A), there are two westward transport flow nuclei in the northern and southern parts, whereas the central region exhibits weak residual flow. In contrast, the results of summer 2022 indicate an eastward flow trend in the surface layer of the QS, with strong eastward transport observed in the water column. The eastward flow is concentrated in the middle part of the strait (near 20.16° N), reaching a maximum intensity in the surface layer in excess of 0.05–0.10 m/s and extending to a depth of 20 m, gradually decreasing with increasing water depth, while the northern and southern parts of the QS continue to exhibit smaller westward transport flow nuclei. This pattern is in line with the overall structure revealed by the measurements of Wang et al. (2014) along 110.18° E. The results for 2023 are almost the same as the average (Figures 8C, 9C, D), showing a transitional pattern between 2021 and 2022. In the middle part of the QS, the surface water exhibits weak eastward flow with an intensity of less than 0.05 m/s and a depth of about 10 m.
Comparatively, the simulated results for 2022 reveal more pronounced eastward flow features in both the horizontal and vertical profiles. Hence, 2022 is considered as a “significant eastward summer flow year” of the period of 2021–2023. Conversely, 2021 is considered as a “significant westward summer flow year.” Finally, 2023 is considered an intermediate year for comparison.
To scrutinise the intricacies of water transport processes in the QS, this study examines local factors. Three characteristic points, namely st1–st3, are selected to represent the western, eastern, and central parts of the strait, corresponding to areas of medium outflow (st1), strong inflow (st3), and weak flow (st2), respectively (Figure 7A). Momentum balance analysis is performed in both the x-direction (parallel to the banks) and y-direction (perpendicular to the banks) within the interior of the QS, while considering the motion equation. The methodologies of Shi et al. (2002); Jiang (2018); Wang et al. (2021), and Hench et al. (2002) were comprehensively utilised, leading to the derivation of horizontal momentum equations in both directions (as shown in Equation 2 and Equation 3):
In the equation, is the coefficient of Coriolis parameter, , are the Coriolis force terms, is the density of seawater, is the wind stress generated by the 10-m wind at the sea surface, is the pressure of seawater, is the kinematic viscosity coefficient, is the bottom friction coefficient, represents the horizontal Laplacian operator, is the water depth at a certain moment, and is the sea surface height at a certain moment. When seawater is approximately homogeneous in density, the pressure gradient terms and and the related variations in sea surface height and can be approximated. The results are shown in Figure 10, where , , , and represent the local acceleration, non-linear advection, wind stress, turbulent viscosity, and bottom friction terms, respectively. All terms were filtered for 48 h. Because this study mainly focuses on the east–west flow, in the following, only the equation with the term (i.e. across the direction of the QS) is shown, with results corresponding to various characteristic points from 2021 to 2023. When (red line in Figure 10) is positive, it represents an eastward flow at the characteristic point, whereas negative values indicate a westward flow. However, the horizontal pressure gradient in the east–west direction also affects the u-component flow. In this study, it is represented by the difference in sea level in the area adjacent to the QS, as shown in Figure 1A, by calculating the difference between the mean values of Area1 and Area2: .
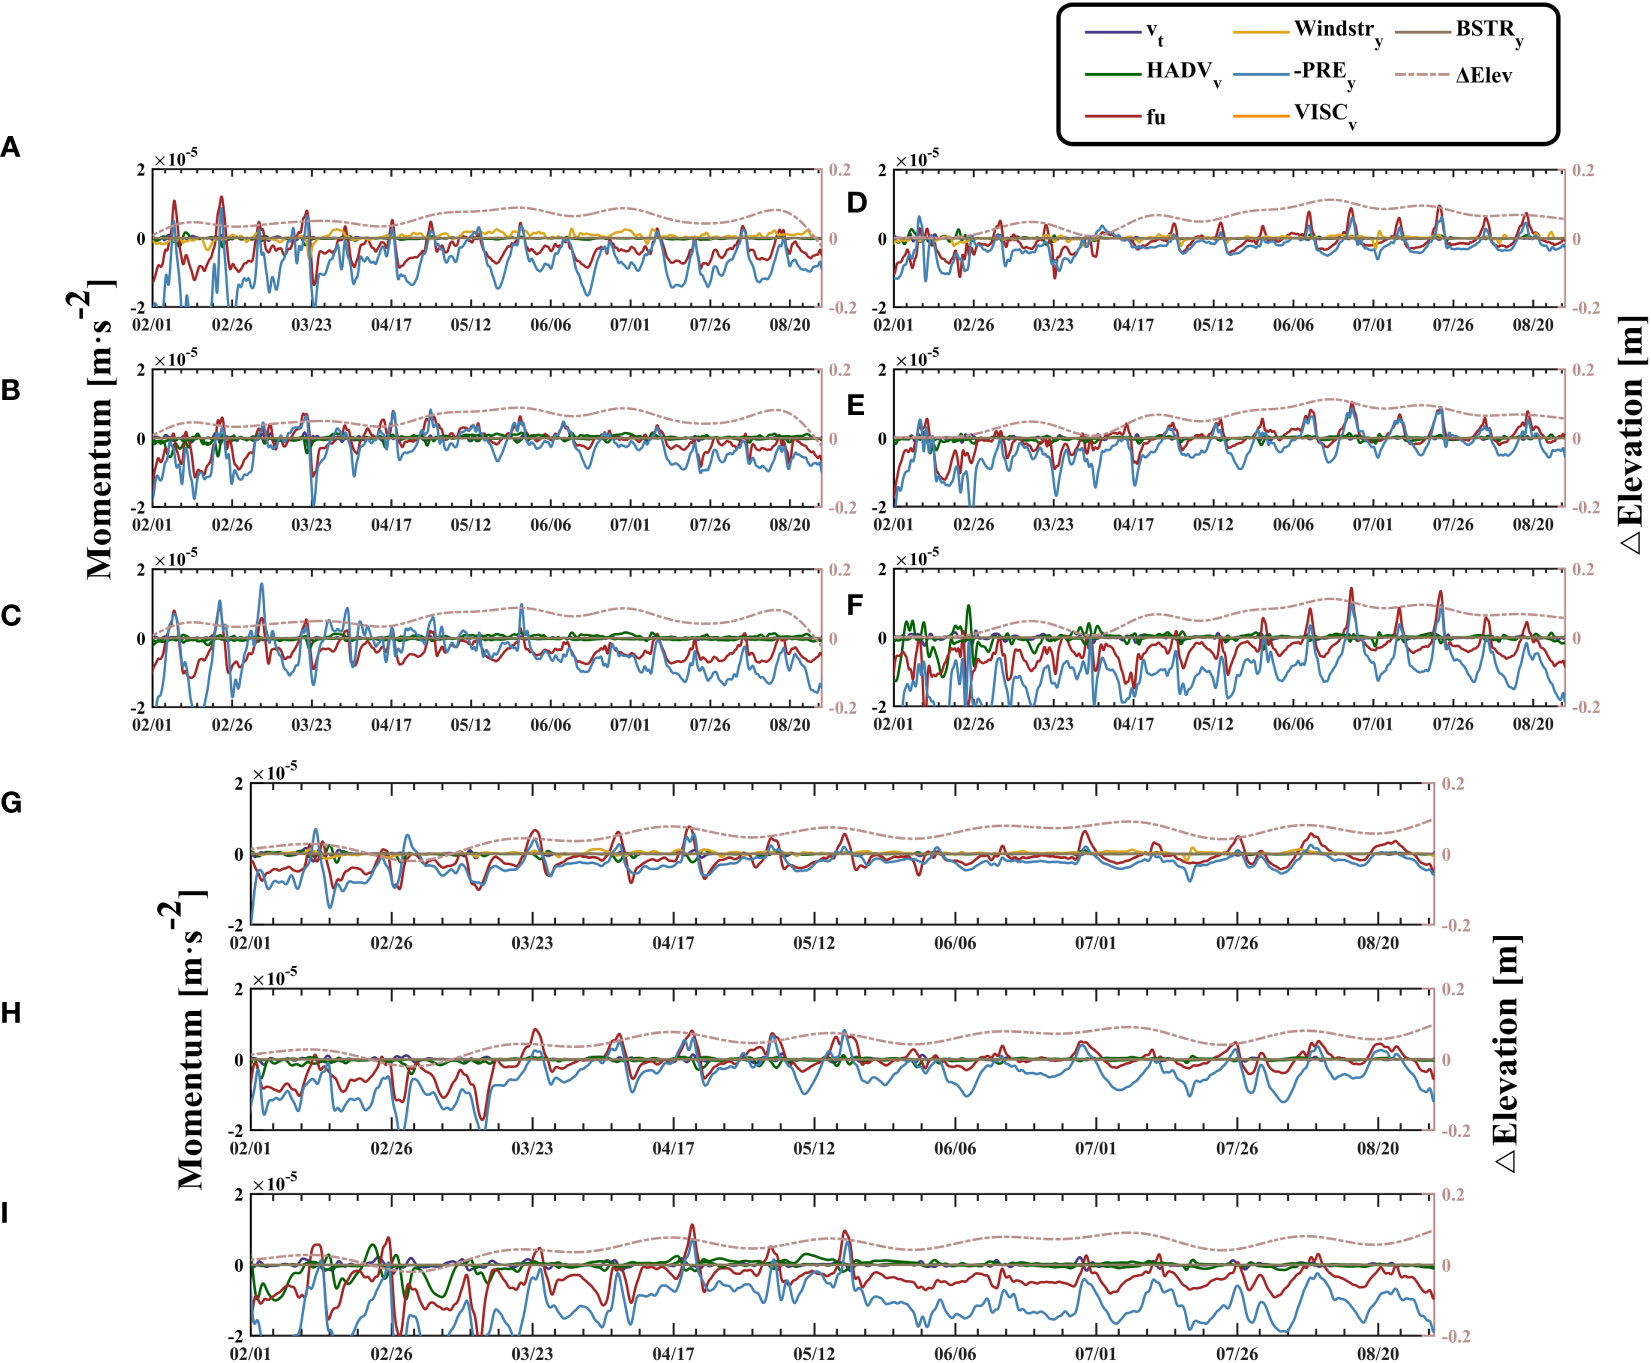
Figure 10 Momentum budget analysis at st1–st3 during 2021 (A–C), 2022 (D–F) and 2023 (G–I). The purple line represents the local acceleration, the green line represents the non-linear advection, the red line represents the Coriolis force, the yellow line represents the wind stress, the blue line represents the negative pressure gradient, the orange line represents the turbulent viscosity, the brown line represents the bottom friction terms, the pink dotted line represents the difference in sea level between the Area1 and the Area2.
In Figure 10, the Coriolis force and pressure gradient terms at st1–st3 are significantly larger in magnitude than the other factors, exhibiting quasi-synchronous variations. This suggests that the QS is in quasi-geostrophic balance, in accordance with the conclusions of Shi et al. (2002). Furthermore, the non-linear advection term is prominently enhanced only in winter and is generally much smaller than the Coriolis force term in spring and summer.
Analysing the interannual variations at the three characteristic points in 2021 (i.e. significant westward summer flow year; Figures 10A–C) shows that all points exhibit strong westward transport in winter, followed by a robust eastward oscillatory flow in spring (Zhang et al., 2009), and a return to westward flow in summer. In 2022 (i.e. significant eastward summer flow year; Figures 10D–F), there is almost no eastward oscillatory flow in spring, and the strait maintains westward transport from January onwards. However, it gradually becomes positive and shows eastward flow in the form of subtidal oscillations starting in May and is most pronounced from late June to early August. As mentioned earlier, although tidal effects may not have been completely filtered out in the results, studies have suggested that tidal effects in the QS drive the westward flow (Shi et al., 2002). Therefore, if tidal effects are entirely removed, the eastward flow may appear in a more stable form. In 2023 (intermediate year; Figures 10G–I), the results resemble those in 2021; however, the eastward oscillatory flow in spring 2023 appears later than that in 2021, and despite the eastward transport in summer 2023, its intensity is much weaker than that in summer 2022.
Although the Coriolis force and pressure gradient terms display quasi-synchronous variations, the current experiment does not definitively establish that the pressure gradient perpendicular to the direction of the QS determines the east–west flow. Instead, these two factors appear to complement each other. Compared to other local variables, the pressure gradient () in the east–west direction may have a more direct impact. In 2021, the water level difference between the western and eastern sides of the strait gradually increased with continuous westward transport, maintaining a west-high–east-low water level state in summer, with an average difference of less than 0.1 m. In 2022, water level accumulation on the west side of the QS occurred later, and the accumulation rate increased rapidly in summer, with an average difference of approximately 0.15 m. The water level difference peaked in late June and was accompanied by the strongest eastward transport. The water level difference in 2023 was average, with values similar to those in 2021, albeit with more obvious fluctuations.
Based on a comparison of several momentum balance results, it can be generally concluded that the average water level difference in the east–west direction of the QS has a significant impact on its flow direction; however, different behaviours may occur in different seasons. In late winter and early spring, a small, stable (stable only at 5 cm) may cause subtidal oscillations and a compensatory eastward flow. In summer, a larger is required to trigger a stable eastward flow mechanism. In the experiments conducted thus far, both in spring and summer, the strait has a positive water level difference (i.e. a higher water level on the west side); however, the flow direction of the strait remains inconsistent. This usually means that the critical value for the east–west flow in summer is not near zero. According to the previous discussion, this value is estimated to be approximately 10 cm (although it may vary at different locations within the QS). This phenomenon may be caused by density gradient variations and may be related to the influence of the current west of Guangdong Province and other NSCS shelf-slope current systems on the east side of the QS (Xue et al., 2004; Fang et al., 2012; Shu et al., 2018).
4.2 Wind forcing
The interannual variations mentioned in Section 4.1 prompt the investigation of external dynamics that transform into an “eastward transport promoting state.” Besides the potential influence of the NSCS current system, is likely driven also by interactions at the air–sea interface. Previous studies have shown a close relationship between the eastward flow in the QS and the south-western monsoon during summer. However, momentum balance analysis revealed that the local north–south wind magnitude is only about one-tenth of the Coriolis force term. Therefore, this study further emphasises its potential role by adopting the vorticity balance method of Gao et al. (2015) for Beibu Gulf. The monthly average wind stress vorticity from February to July in 2021–2023 was calculated in the vicinity of the strait, as shown in Figures 11, 12, where the vectors represent the monthly average wind field.
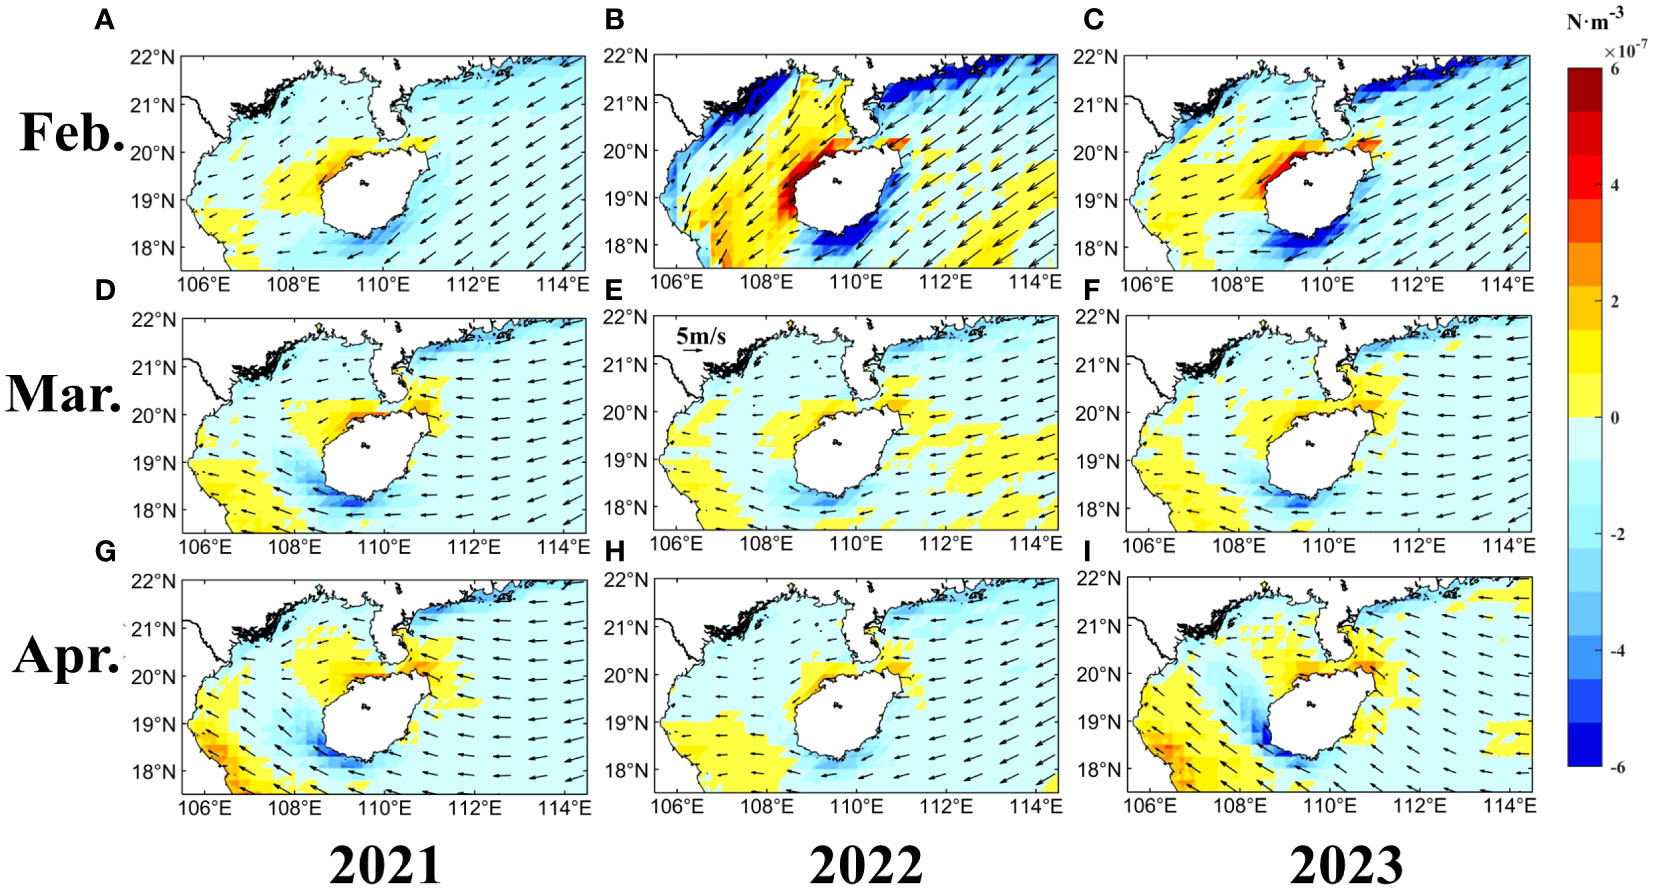
Figure 11 Monthly average wind stress curl distribution shows in color, and the vectors represent the average wind field for each month. Feb (A–C); Mar (D–F); Apr (G–I) in 2021 (A, D, G); 2022 (B, E, H) and 2023 (C, F, I).
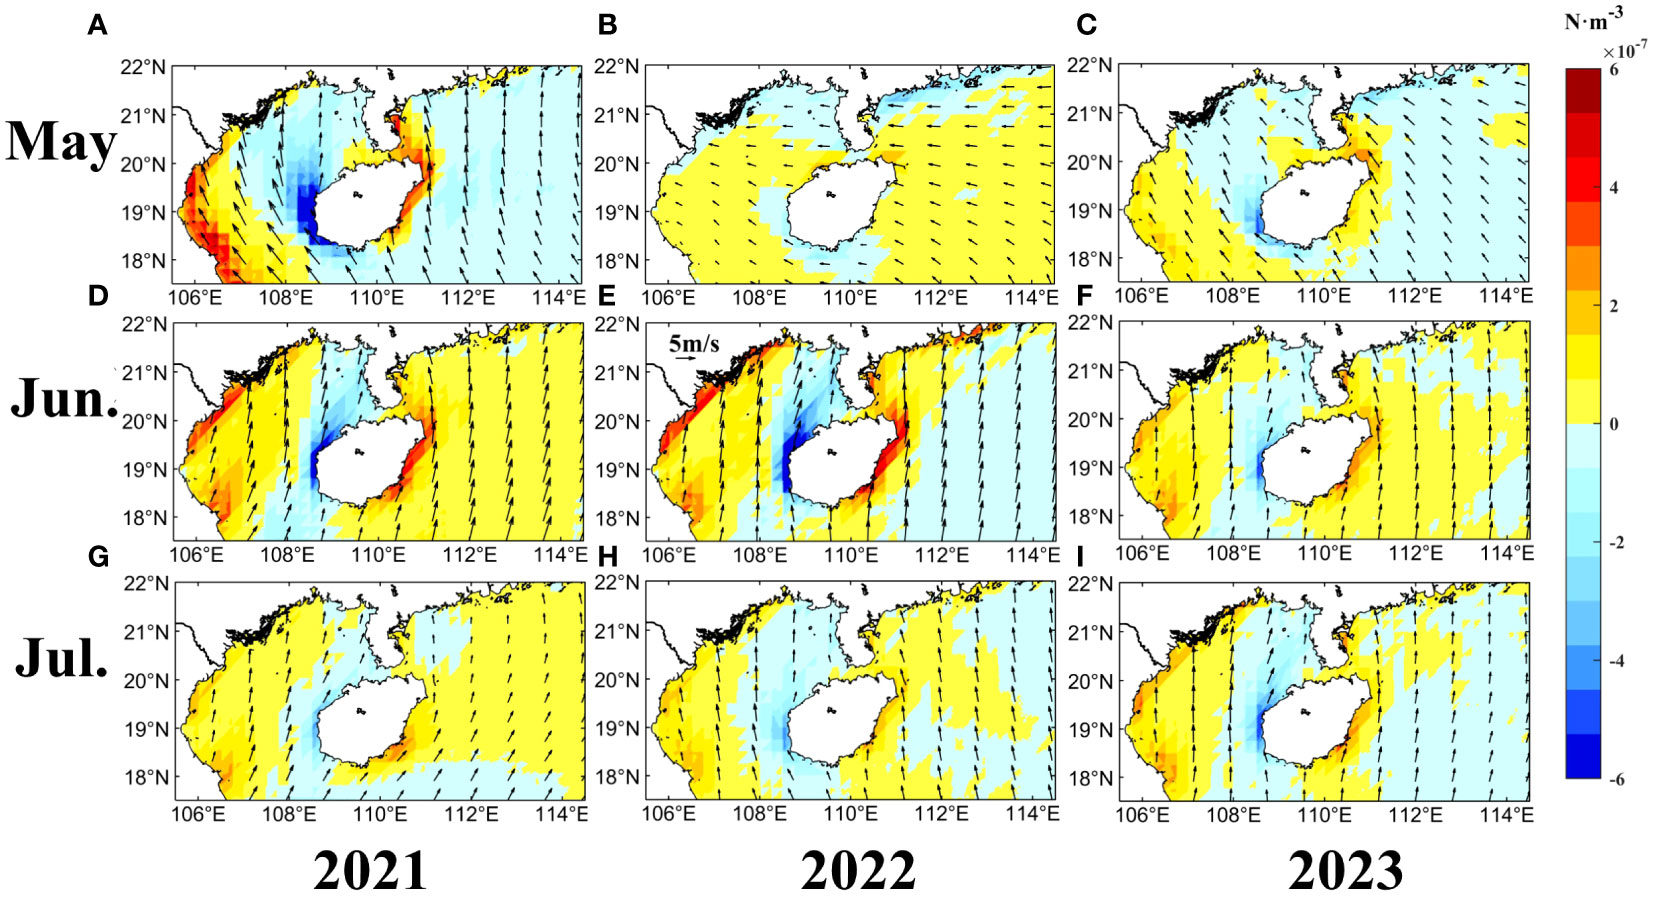
Figure 12 Monthly average wind stress curl distribution shows in color, and the vectors represent the average wind field for each month. May (A–C); Jun (D–F); Jul (G–I) in 2021 (A, D, G); 2022 (B, E, H) and 2023 (C, F, I).
From late winter to spring, the wind stress curl along the QS exhibits a basic symmetric distribution. In February 2022 (Figure 11B), there is a strong positive wind stress curl on the western side of the strait, corresponding to a positive input of vorticity (Gao et al., 2015). Furthermore, a positive vorticity causes surface divergence, whereas a negative vorticity curl produces the opposite effect. This leads to a decrease in sea surface divergence and intensifies the westward transport during winter. The wind stress curl causes a certain degree of sea level decrease, which may explain why in 2022 and 2023 exhibits a decrease or even a negative phase during late winter and early spring.
Conversely, Figure 13 shows the relationship between the Coriolis force term () at different locations and the variation in the east–west-wind (U-wind) speed. During spring, there is little change in the U-wind direction, and intermittent eastward flow occurs more frequently during the weakening process or around zero values of the long-term easterly wind (as indicated by the orange box), with the situation being more pronounced in 2022 and 2023. The subtidal-period eastward flow tends to be compensated by the relaxation process of the wind, and there is a short lag in the flow direction change relative to the wind direction change. When the easterly wind strengthens again, quickly trends towards a negative phase, in accordance with the results of Wang et al. (2021) for the Taiwan Strait. The period of the subtidal oscillations is likely related to the tidal period, as determined by comparing it with the local tidal cycles (Figure 3). However, it is difficult to explain the complete phase reversal between and the U-wind direction in summer, as well as the variation in the strength of the eastward flow (indicated by the purple box), indicating that the wind-driven influence in summer is dominated by other forms.
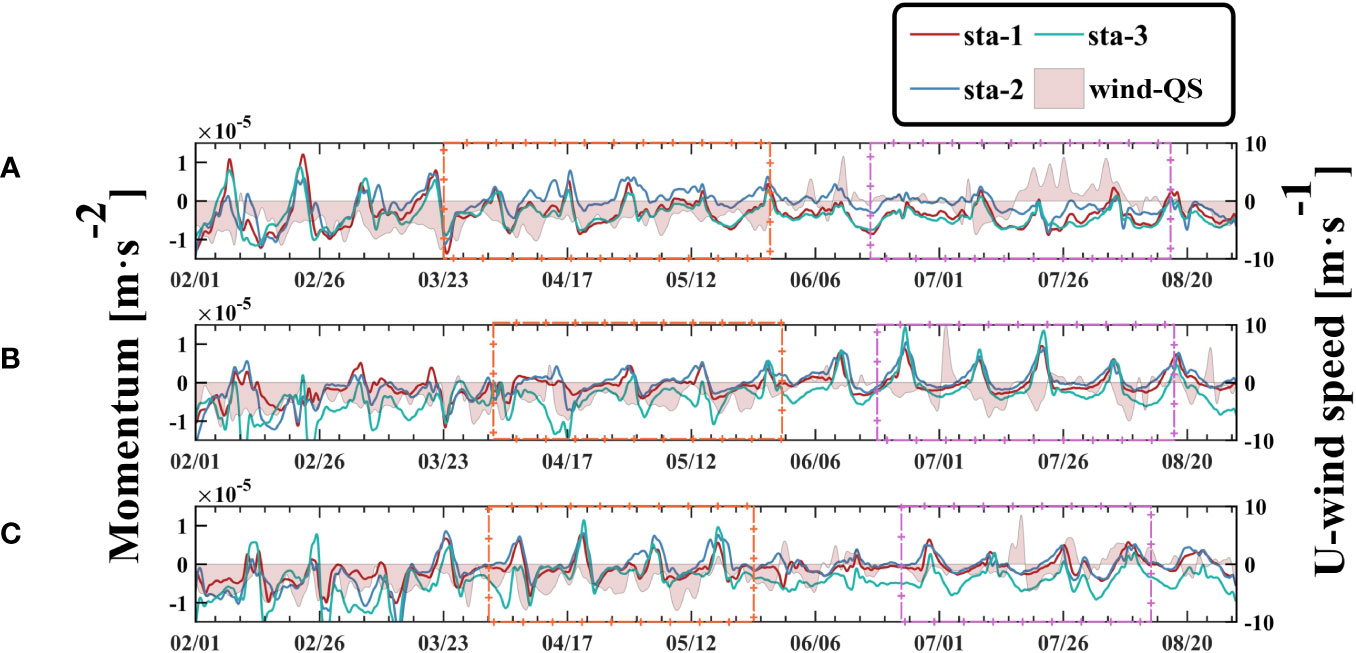
Figure 13 Momentum (Coriolis force term) at st1–st3 (represent in red, blue and wathet lines, respectively) with U-wind speed (in the QS, represents in pink area) during 2021–2023 (A-C).
In Figure 12, the difference in wind stress curl between the two sides of the strait reappears. A positive wind stress curl in the east causes surface divergence, whereas a negative wind stress curl in the west causes surface convergence, leading to a further increase in . In June and July, the region transitions to the south-western monsoon, while near the QS, the wind is mainly southerly, which has a limited impact on the east–west flow. Wind mainly causes water level changes through the wind stress curl, and the interannual differences in the wind field also have an impact on the eastward flow, mainly concentrated in the eastern region of the strait. According to Gao et al. (2015), the effect of wind stress curl is more pronounced in areas with weaker exchange with the open ocean. Therefore, the positive wind stress curl area in the eastern part of the strait in 2021 (Figure 12D) being much larger than those during the same periods in 2022 and 2023 (Figures 12E, F) does not imply stronger seawater divergence. In contrast, the broad input of positive wind stress curl may further intensify the current on the west coast of Guangdong, leading to water accumulation on the east side. This also explains why, although the difference in wind stress curl on both sides of the strait is similar, there is no eastward flow in summer 2021, which has the widest positive wind stress curl area. In summer 2022 (Figures 12E, H), there is a negative vorticity input in the eastern region, thereby weakening the south-western intrusion of the coastal flow to the west of Guangdong. The non-linear superposition of various conditions contributed to the generation of eastward transport during summer.
5 Conclusion
In this study, a three-dimensional version of the Semi-implicit Cross-scale Hydroscience Integrated System Model (SCHISM) model was employed to simulate the tidal and residual currents in the Qiongzhou Strait (QS) from 2021 to 2023. The findings indicate that the QS generally experiences westward transport throughout the year under climatological or monthly average conditions. However, eastward residual currents may occur during both spring and summer, primarily in the form of subtidal oscillations. The pressure gradient between the two sides of the strait is more likely to be a direct factor, and the threshold of the water level difference required to trigger eastward flow varies in spring and summer. The intensity and duration of these currents also exhibit interannual variabilities.
The regulatory mechanisms of the residual currents in the QS are complex and involve internal topographic modulation and tidal wave interactions within the strait, which influence the distribution of the flow field. However, local factors within the QS do not significantly impact the direction of the interannual variation of the water transport. Instead, the wind field, rather than direct local effects, is more likely to affect the water level difference on both sides of the strait through the wind stress curl in summer, thereby adjusting the direction of the current. This influence is challenging to observe during spring, because the eastward residual currents then are more likely to be compensatory flows during the wind relaxation period.
Data availability statement
Publicly available datasets analyzed in this study can be found in: https://www.hycom.org/; https://cds.climate.copernicus.eu/cdsapp#!/dataset/reanalysis-era5-single-levels?tab=form; http://global-tide.nmdis.org.cn/; https://www.ncei.noaa.gov/products/etopo-global-relief-model; https://www.ngdc.noaa.gov/mgg/shorelines/shorelines.html. The SCHISM datasets presented in this article are not readily available because these are stored on an intranet server. The replication and migration of data are restricted by computing/storing resource and its time cost. Requests to access the datasets should be directed to Quanxin Zheng, YW96YWtpMTcxMUAxNjMuY29t.
Author contributions
QZ: Formal analysis, Methodology, Writing – original draft, Writing – review & editing. HW: Funding acquisition, Supervision, Writing – review & editing. SL: Formal analysis, Methodology, Writing – review & editing. ZC: Funding acquisition, Methodology, Writing – review & editing. MB: Funding acquisition, Supervision, Writing – review & editing.
Funding
The author(s) declare financial support was received for the research, authorship, and/or publication of this article. National Natural Science Foundation of China (U20A20104) and National Natural Science Foundation of China (42076216).
Conflict of interest
The authors declare that the research was conducted in the absence of any commercial or financial relationships that could be construed as a potential conflict of interest.
Publisher’s note
All claims expressed in this article are solely those of the authors and do not necessarily represent those of their affiliated organizations, or those of the publisher, the editors and the reviewers. Any product that may be evaluated in this article, or claim that may be made by its manufacturer, is not guaranteed or endorsed by the publisher.
References
Bai P., Gu Y., Li P., Wu K. (2016). Modelling the upwelling offthe east Hainan Island coast in summer 2010. Chin. J. Oceanol. Limnol. 34, 1358–1373. doi: 10.1007/s00343-016-5147-5
Chen C., Li P., Shi M., Zuo J., Chen M., Sun H. (2009). Numerical study of the tides and residual currents in the Qiongzhou Strait. Chin. J. Oceanol. Limnol. 27, 931–942. doi: 10.1007/s00343-009-9193-0
Chen L., Li T. J., Yang W. F., Chen J. (2016). Distribution and sources of heavy metals in sediments in the northern South China Sea. J. Ecol. Environ. Sci. 25, 464. doi: 10.16258/j.cnki.1674-5906.2016.03.014
Chen Z., Qiao F., Xia C., Wang G. (2015). The numerical investigation of seasonal variation of the cold water mass in the Beibu Gulf and its mechanisms. Acta Oceanol. Sin. 34, 44–54. doi: 10.1007/s13131-015-0595-x
Chen B., Xu Z., Ya H., Chen X., Xu M. (2019). Impact of the water input from the eastern Qiongzhou Strait to the Beibu Gulf on Guangxi coastal circulation. Acta Oceanol. Sin. 38, 1–11. doi: 10.1007/s13131-019-1472-2
Chen M., Zhu Z., Zhang C., Zhu X., Liu Z., Kaneko A. (2021). Observation of internal tides in the qiongzhou strait by coastal acoustic tomography. J. Ocean Univ. China 20, 1037–1045. doi: 10.1007/s11802-021-4590-x
Cheng G., Gong W., Wang Y., Xia Z. (2017). Modeling the circulation and sediment transport in the Beibu Gulf. Acta Oceanol. Sin. 36, 21–30. doi: 10.1007/s13131-017-1012-4
Dai P., Zhang J., Zheng J. (2017). Tidal current and tidal energy changes imposed by a dynamic tidal power system in the Taiwan Strait, China. J. Ocean Univ. China 16, 953–964. doi: 10.1007/s11802-017-3237-4
Dasen C. (2006). The seasonal variation characteristics of residual currents in the Qiongzhou Strait. Trans. Oceanol. Limnol. 2, 12. doi: 10.3969/j.issn.1003-6482.2006.02.003
Ding Y., Bao X., Yao Z., Zhang C., Wan K., Bao M., et al. (2017). A modeling study of the characteristics and mechanism of the westward coastal current during summer in the northwestern South China Sea. Ocean Sci. J. 52, 11–30. doi: 10.1007/s12601-017-0011-x
Ding Y., Chen C., Beardsley R. C., Bao X., Shi M., Zhang Y., et al. (2013). Observational and model studies of the circulation in the Gulf of Tonkin, South China Sea. J. Geophys. Res.: Oceans 118, 6495–6510. doi: 10.1002/2013JC009455
Fang G., Wang G., Fang Y., Fang W. (2012). A review on the South China Sea western boundary current. Acta Oceanol. Sin. 31, 1–10. doi: 10.1007/s13131-012-0231-y
Gao J., Chen B., Shi M. (2015). Summer circulation structure and formation mechanism in the Beibu Gulf. Sci. China Earth Sci. 58, 286–299. doi: 10.1007/s11430-014-4916-2
Gao J., Wu G., Ya H. (2017). Review of the circulation in the beibu gulf, South China Sea. Continent. Shelf Res. 138, 106–119. doi: 10.1016/j.csr.2017.02.009
Hench J. L., Blanton B. O., Luettich R. A. Jr. (2002). Lateral dynamic analysis and classification of barotropic tidal inlets. Continent. Shelf Res. 22, 2615–2631. doi: 10.1016/S0278-4343(02)00117-6
Jiang Z. (2018). Numerical simulation of tidal dynamics in the Zhoushan Archipelago sea area. Zhejiang Ocean University, Zhoushan (Zhejiang.
Jiang J., Fang G., Teng F., Xu X. (2018). Numerical study on the dissipation of internal tides and the impact of self-suction and load tides on tides and waves in the South China Sea. Oceanol. Limnol. 49, 14. doi: 10.11693/hyhz20171200316
Li Y. (2022). Adaptive low-pass filtering in the qiongzhou strait: an inquiry. Oceanogr. Res. 40, 9–16.
Minh N. N., Patrick M., Florent L., Sylvain O., Gildas C., Damien A., et al. (2014). Tidal characteristics of the gulf of Tonkin. Continent. Shelf Res. 91, 37–56. doi: 10.1016/j.csr.2014.08.003
Pan H., Devlin A. T., Xu T., Lv X., Wei Z. (2022). Anomalous 18.61-year nodal cycles in the gulf of tonkin revealed by tide gauges and satellite altimeter records. Remote Sens. 14, 3672. doi: 10.3390/RS14153672
Pan H., Li B., Xu T., Wei Z. (2023). Subseasonal tidal variability in the gulf of tonkin observed by multi-satellite altimeters and tide gauges. Remote Sens. 15, 466. doi: 10.3390/rs15020466
Pawlowicz R., Beardsley B., Lentz S. (2002). Classical tidal harmonic analysis including error estimates in MATLAB using T_TIDE. Comput. Geosci. 28, 929–937. doi: 10.1016/S0098-3004(02)00013-4
Piton V. (2019). Du Fleuve Rouge au Golfe du Tonkin: dynamique et transport sédimentaire le long du continuum estuaire-zone côtière. , Toulouse, 3.
Piton V., Herrmann M., Lyard F., Marsaleix P., Duhaut T., Allain D., et al. (2020). Sensitivity study on the main tidal constituents of the Gulf of Tonkin by using the frequency-domain tidal solver in T-UGOm. Geosci. Model. Dev. 13, 1583–1607. doi: 10.5194/gmd-13-1583-2020
Piton V., Herrmann M., Marsaleix P., Duhaut T., Ngoc T. B., Tran M. C., et al. (2021). Influence of winds, geostrophy and typhoons on the seasonal variability of the circulation in the Gulf of Tonkin: A high-resolution 3D regional modeling study. Region. Stud. Mar. Sci. 45, 101849. doi: 10.1016/j.rsma.2021.101849
Shi M., Chen C., Xu Q., Lin H., Liu G., Wang H., et al. (2002). The role of Qiongzhou Strait in the seasonal variation of the South China Sea circulation. J. Phys. Oceanogr. 32, 103–121. doi: 10.1175/1520-0485(2002)032<0103:TROQSI>2.0.CO;2
Shi M., Yan J., Chen B., Gao J. (2011). Analysis of the summer tidal current spectrum and residual flow characteristics in the Qiongzhou Strait. J. Ocean Univ. China: Natural Sci. Edit. 41, 1–4. doi: 10.16441/j.cnki.hdxb.2011.11.001
Shu Y., Wang Q., Zu T. (2018). Research progress on the flow system of the northern South China Sea continental shelf and slope. Chin. Sci.: Earth Sci. 48, 276–287.
Tong J., Lei F., Mao Q., Qi Y. (2010). Non-local tidal potential contribution to the positive tidal energy flux and tidal energy dissipation in the South China Sea. J. Trop. Oceanogr. 29, 1–9. doi: 10.3969/j.issn.1009-5470.2010.03.001
Umlauf L., Burchard H. (2003). A generic length-scale equation for geophysical turbulence models. Journal of Marine Research 61 (2), 235–265.
Wang L., Pawlowicz R., Wu X., Yue X. (2021). Wintertime variability of currents in the southwestern Taiwan Strait. J. Geophys. Res.: Oceans 126, e2020JC016586. doi: 10.1029/2020JC016586
Wang Q., Wang X. (2009). Numerical simulation of the positive tidal pressure in the northwest South China Sea. J. Guangdong Ocean Univ. 29, 64–67.
Wang Q., Wang X., Xie L., Shang Q., Lü Y. (2014). Observed water current and transport through Qiongzhou Strait during August 2010. Chin. J. Oceanol. Limnol. 32, 703–708. doi: 10.1007/s00343-014-3159-6
Wu D., Wang Y., Sun Y. (2020). Characteristics and mechanisms of M2 tidal current distribution in the Taiwan Strait. J. Appl. Oceanogr. 39, 460–468.
Xia H., Li S., Shi M. (2001). Three-D numerical simulation of wind-driven current and density current in the Beibu Gulf. Acta Oceanol. Sin. 4), 455–472. doi: 10.3321/j.issn:0253-4193.2001.06.002
Xu Z., Lei F., Lou A., Cao S. (2010). Numerical simulation of tidal currents in the Beibu Gulf. Mar. Sci. 2, 10–14.
Xue H., Chai F., Pettigrew N., Xu D., Shi M., Xu J. (2004). Kuroshio intrusion and the circulation in the South China Sea. J. Geophys. Res.: Oceans 109. doi: 10.1029/2002JC001724
Yang S., Chen B., Li P. (2006). Characteristics of summer water exchange between the South China Sea and the Beibu Gulf based on temperature and salinity data. Mar. Lake Sci. Bull. 1), 7. doi: 10.3969/j.issn.1003-6482.2006.01.001
Yang S., Bao X., Chen C., Chen F. (2003). Characteristics and generation mechanism of the summer coastal currents in western Guangdong. Acta Oceanologica Sinica 25 (6), 1–8.
Yang Y., Xu Y. D., Wang F. Y., Wei X. (2015). Study and application of the model for coastal currents and material transport in western Guangdong. Sci. Technol. Eng. 15, 80–85.
Ye F., Zhang Y. J., He R., Wang Z., Wang H. V., Du J. (2019). Third-order WENO transport scheme for simulating the baroclinic eddying ocean on an unstructured grid. Ocean Model. 143, 101466. doi: 10.1016/j.ocemod.2019.101466
Yu H. C., Zhang Y. J., Jason C. S., Terng C., Sun W., Ye F., et al. (2017). Simulating multi-scale oceanic processes around Taiwan on unstructured grids. Ocean Model. 119, 72–93. doi: 10.1016/j.ocemod.2017.09.007
Zavala-Garay J., Rogowski P., Wilkin J., Terrill E., Shearman R. K., Tran L. H. (2022). An integral view of the Gulf of Tonkin seasonal dynamics. J. Geophys. Res.: Oceans 127, e2021JC018125. doi: 10.1029/2021JC018125
Zhang G., Ma T., Pan W. (2009). Characteristics of low-frequency flow at the western entrance of the Qiongzhou Strait and its response to seasonal wind fields. In Yan H., Hu J. (Eds.), Collection of Research Papers on Marine Science in the Beibu Gulf. (Beijing: Ocean Press) 2, 64–76.
Zhang Y. J., Ateljevich E., Yu H. C., Wu C. H., Jason C. S. (2015). A new vertical coordinate system for a 3D unstructured-grid model. Ocean Model. 85, 16–31. doi: 10.1016/j.ocemod.2014.10.003
Zhang Y. J., Ye F., Stanev E. V., Grashorn S. (2016). Seamless cross-scale modeling with SCHISM. Ocean Model. 102, 64–81. doi: 10.1016/j.ocemod.2016.05.002
Zhao C., Lv X., Qiao F. (2010). Numerical study of tides in the Beibu Gulf. Acta Oceanol. Sin. 4), 1–11.
Zheng B. W. (2014). Ecological studies on plankton in northern Beibu Gulf. Xiamen University, Xiamen (Fujian.
Zheng S. (2015). Numerical simulation and study of tidal currents in the Qiongzhou Strait based on FVCOM. China Ocean University, Qingdao (Shandong.
Zhu X. H., Ma Y. L., Guo X., Fan X., Long Y., Yuan Y., et al. (2014). Tidal and residual currents in the Q iongzhou S trait estimated from shipboard ADCP data using a modified tidal harmonic analysis method. J. Geophys. Res.: Oceans 119, 8039–8060. doi: 10.1002/2014JC009855
Zhu X. H., Zhu Z. N., Guo X., Ma Y. L., Fan X., Dong M., et al. (2015). Measurement of tidal and residual currents and volume transport through the Qiongzhou Strait using coastal acoustic tomography. Continent. Shelf Res. 108, 65–75. doi: 10.1016/j.csr.2015.08.016
Keywords: Qiongzhou Strait, SCHISM, numerical simulation, residual current, spring, summer
Citation: Zheng Q, Wang H, Li S, Cao Z and Bao M (2024) Dynamics of currents in the Qiongzhou strait during spring and summer based on a numerical simulation. Front. Mar. Sci. 11:1367145. doi: 10.3389/fmars.2024.1367145
Received: 08 January 2024; Accepted: 21 February 2024;
Published: 12 March 2024.
Edited by:
Francisco Machín, University of Las Palmas de Gran Canaria, SpainReviewed by:
Haidong Pan, Ministry of Natural Resources, ChinaZuhao Zhu, Ministry of Natural Resources, China
Copyright © 2024 Zheng, Wang, Li, Cao and Bao. This is an open-access article distributed under the terms of the Creative Commons Attribution License (CC BY). The use, distribution or reproduction in other forums is permitted, provided the original author(s) and the copyright owner(s) are credited and that the original publication in this journal is cited, in accordance with accepted academic practice. No use, distribution or reproduction is permitted which does not comply with these terms.
*Correspondence: Huiqun Wang, d2FuZ2hxMTEwMUBzaW8ub3JnLmNu