 Yihang Liu1,2,3†
 Muping Zhou2,3†
 Feng Zhou1,2,3*
 Qicheng Meng2,3
 Xiao Ma2,3Qianjiang Zhang2,3
 Ruijie Ye2,3
- 1School of Oceanography, Shanghai Jiao Tong University, Shanghai, China
- 2State Key Laboratory of Satellite Ocean Environment Dynamics, Second Institution of Oceanography, Ministry of Natural Resources, Hangzhou, China
- 3Observation and Research Station of Yangtze River Delta Marine Ecosystems, Ministry of Natural Resources, Zhoushan, China
This study examines the interannual and seasonal variations in the distribution of radioactive materials released from the Fukushima Daiichi Nuclear Power Plant (FDNPP) accident in the surface layer of the Kuroshio Extension (KE). Focusing on the contrasting flow conditions in 2015 (southward) and 2021 (northward) – significant oscillatory phases of the KE’s mean flow axis – the research analyzes the impact of seasonal variations on particle transport pathways. The findings reveal distinct seasonal patterns: summer releases primarily follow the eastward KE movement, while winter releases exhibit a southward trajectory. The study further quantifies the transport timescales, demonstrating that particles can reach the Luzon Strait within 10 months, subsequently diverging northward along the Kuroshio and northwestward along the Kuroshio Branch Current, potentially entering the South China Sea within 13 months. This research contributes valuable insights into the seasonal dynamics governing the dispersion and transport of Fukushima-derived radioisotopes in the surface ocean, highlighting the crucial role of the KE in influencing their trajectories.
1 Introduction
The Fukushima Daiichi Nuclear Power Plant (FDNPP) disaster in 2011, triggered by a tsunami, resulted in significant radioactive leakage. For over a decade, the Tokyo Electric Power Company (TEPCO) has managed the crisis by injecting water into the damaged reactors for cooling, amassing approximately 1.3 million tons of radioactive water in storage tanks, a situation worsened by environmental factors like groundwater and rainwater. These tanks, anticipated to reach full capacity by 2022, contain water treated by the Advanced Liquid Processing System (ALPS) but still hold long-lived radioactive isotopes, posing a substantial risk to both marine ecosystems and human health (Buesseler, 2012; Liu, 2015; Inomata et al., 2016; Zhao et al., 2021). The ocean’s role as a primary sink for these isotopes necessitates rigorous monitoring, highlighted by instances such as the detection of cesium-contaminated bluefin tuna off California’s coast post-disaster, indicating the extensive reach of this contamination even in species undertaking long-distance migrations (Buesseler et al., 2011; Aoyama et al., 2013; Fisher et al., 2013).
The migration and dispersion of radioactive materials in the marine environment surrounding the FDNPP are influenced by ocean currents, weather conditions, and monsoons. Changes in these ocean currents can impact the migration pathways and dispersion extent. Our study is specifically aimed at investigating this phenomenon. Previous studies have utilized various models to understand the movement and impact of the radioactive materials over time. For example, the POM model results indicated that the radioactive core moves eastward within 5 years and shifts to the Northeast Pacific in 5-10 years; beyond 10 years, it stabilizes southeast off Japan (Zhao et al., 2021). Other research employed SEA-GEARN and Ocean General Circulation Model (OGCM), focusing on iodine-131(131I) and cesium-137 (137Cs) diffusion, revealing that atmospheric fallout predominantly influenced radioactive concentrations near Fukushima within the initial month, with high concentrations remaining coastal (Kawamura et al., 2011). Additionally, projections using the LAMER model and MICOM suggest the contaminated water primarily flows eastward before dispersing south and west, potentially impacting China’s coast in 10-15 years, with subsurface signals leading by approximately 5 years (He et al., 2012; Nakano and Povinec, 2012).
Recent research has identified three primary pathways for the post-Fukushima discharge: (1) moving southwest into Chinese coastal waters within approximately 2 years, influenced by local currents and eddies; (2) reaching North America’s west coast in about 10-15 years, circulating back via the North Equatorial Current; and (3) heading eastward along the Kuroshio Current, then through the Luzon Strait within around 3 years (Nakano and Povinec, 2012; Kaeriyama, 2017; Zhao et al., 2021; Lu et al., 2022). This paper focuses on the southwestward pathways extending from eastern Fukushima to nearshore China, emphasizing eddies, the Kuroshio’s southern recirculation, and dispersion mechanisms.
Oceanographers worldwide have long studied the movement and trajectories of various substances in the ocean, which undergo spatial and temporal changes due to seawater movement (van Sebille et al., 2018). Two primary techniques exist for tracing these trajectories: the Lagrangian approach, which simulates substance movement in most velocity fields and was historically used to track surface drifts, and the Eulerian approach, which provides global coverage but suffers from limitations in spatial and temporal resolution and overlooks sub-mesoscale motions (van Sebille et al., 2018; Aksamit et al., 2020; Pattiaratchi et al., 2022). Although drifters from Global Drifter Program (GDP) have tracked the fastest contaminated water routes to China’s coast (Lu et al., 2022), their limited ability to account for spatiotemporal variations underlines the need for comprehensive simulation studies. These studies are essential for understanding the impact of Fukushima’s contaminated water on marine and global environments, including the roles of atmospheric transport and biological vectors, given the extended decay of radioactive nuclides. Traditional methods using OGCMs in online mode for Lagrangian tracking require extensive computational resources and can produce varied results. To clearly track the trajectories of virtual particles and quickly calculate the coordinates of virtual particles at each time step, the authors used Lagrangian particle tracking technology solved by the Runge-Kutta method to track the radioactive substances.
The majority of contaminated water released from the FDNPP rapidly merges into the Kuroshio Extension (KE) southeast of Fukushima, then travels eastward, joining the North Pacific current system. The KE, part of the Pacific western boundary currents, plays a crucial role in heat transport from the tropics to midlatitudes and impacts the North Pacific’s climate. Its variability, especially in sea surface height (SSH) and eddy kinetic energy (EKE), is significant between 33°–40°N and 140°–165°E, affected by internal oceanic nonlinearities and wind-induced Rossby waves (Joh et al., 2022). From 1993–2021, the KE shifted northward by about 210 km, largely due to changes in the North Pacific wind stress curl. This shift, affecting SST and air-sea interactions, is linked to the KE’s fluctuation between stable and unstable states, influencing mesoscale eddy formation and detachment (Kawakami et al., 2023). In shorter time scales, the mean pathway of the KE also exhibits periodic north-south shifts.
Consequently, understanding the spatiotemporal shifts in the KE is vital on both interannual and seasonal scales. The Kuroshio Current bifurcates upon reaching the northeastern Sea of Japan: one stream veers northeast into the Sea of Japan, while the other proceeds north into the East China Sea (ECS) and Yellow Sea (YS) (Jayne et al., 2009). The segment of the North Pacific Kuroshio diverging from the Japanese coast at 35°N, 140°E, and progressing into the North Pacific’s broad basin is identified as the KE, formed and propelled by the traits of the Kuroshio Current system (Qu et al., 2001). Data indicates that the KE not confined by coastal limits, functions as an eastward inertia jet, characterized by substantial undulations and dynamic eddies (Yasuda et al., 1992).
Functioning as the western periphery discharge zone of the North Pacific subtropical gyre (Figure 1), the KE demonstrates not only intense mesoscale eddy fluctuations but also significant transport and route modifications over interannual and more extended periods. The KE oscillates between extended and retracted states, each with distinct transport characteristics and trajectories, influenced by the presence of southward recirculating eddies (Qiu and Miao, 2000).
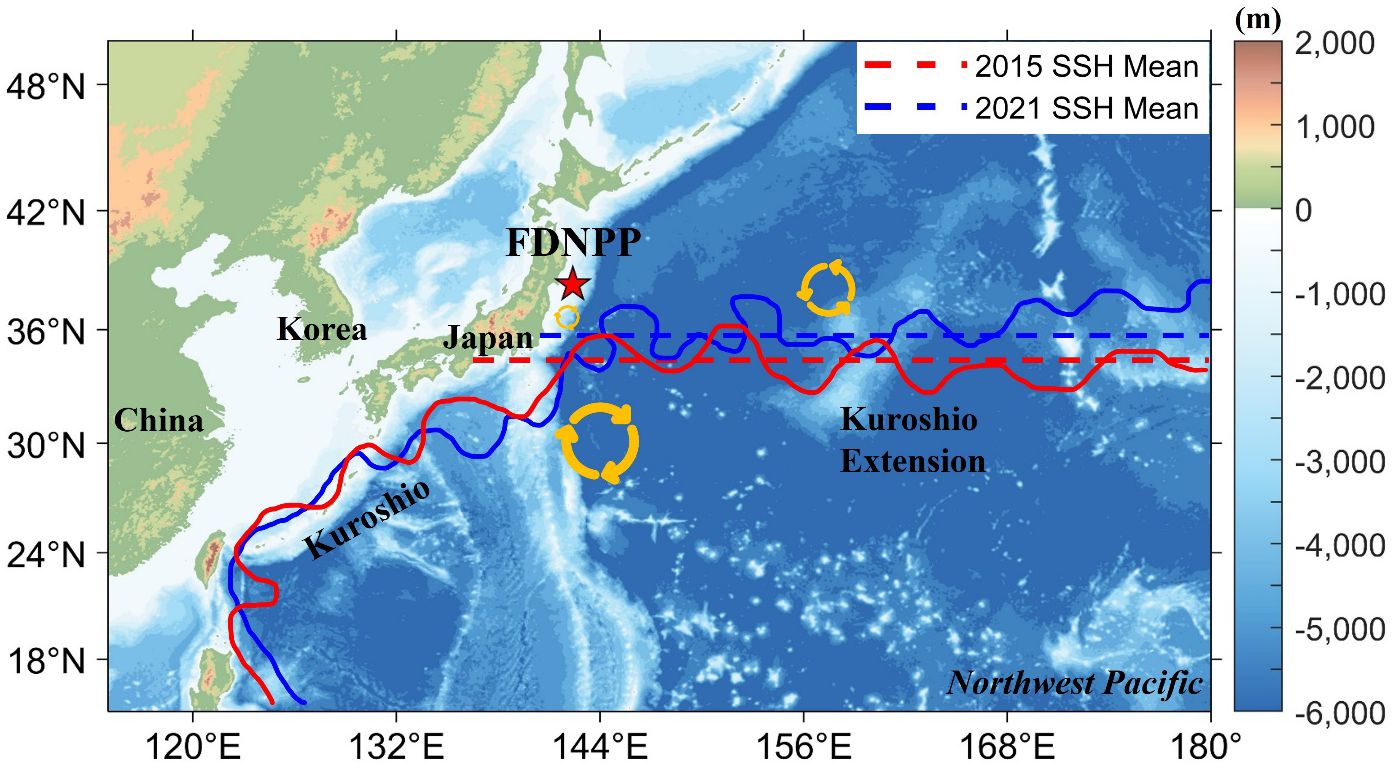
Figure 1 The figure primarily identifies the location of the FDNPP and the major current systems and related eddies in the surrounding marine area. The pentagram represents the location of the discharge outlet of the FDNPP in Japan, and the yellow circular loop represents eddies near KE. The red and blue contours represent the annual mean KE pathways of 2015 and 2021, The red and blue dashed lines signify the average latitudes of the flow axis of the KE pathways between 141°E and 158°E..
Given that the majority of the contaminated water discharged from the FDNPP merges into the KE, the question arises whether the north-south movement of the KE’s average pathway would affect the timing and spatial distribution of the southward movement of surface-level contaminated water. The experiments designed in this paper will address this question, providing explanations on both seasonal and interannual scales.
2 Methods and data
2.1 Particle tracking techniques
Modern Lagrangian research methods largely rely on high-performance computing.
Herein: x represents the position vector of the particle, t denotes time, and u(x,t) is the velocity field of the flow to the Equation 1. To understand this equation, numerical methods such as Runge-Kutta methods are often used. In particular, the fourth-order Runge-Kutta method (RK4) is a commonly used numerical solution method, and its formula is as follows (Equations 2–6):
To elucidate a given equation, numerical methods are often employed, such as the Runge-Kutta methods. In particular, the fourth-order Runge-Kutta method (RK4) stands as a frequently-used numerical solution. Its formula is presented as:
Compute the initial velocity:
Compute the intermediate velocity 1:
Compute the intermediate velocity 2:
Compute the final velocity:
Update the position:
Where: h represents the time step size, Xn denotes the particle’s position at time tn.
The variables k1, k2, k3, and k4 are intermediate values in the Runge-Kutta formulation.
By placing a multitude of virtual particles in different research areas at different times and following the temporal evolution of three-dimensional or two-dimensional velocity fields in the ocean, the spatial trajectories of particles changing over time are acquired. For each time step, only one set of calculations is required for the motion of the Lagrangian particles. In contrast, the convective diffusion of tracer concentration requires corresponding N sets of calculations, where N is the number of discrete oceanic grid units (van Sebille et al., 2020). Although a single Lagrangian particle trajectory might not allow for a meaningful analysis of oceanic pathways, placing multiple Lagrangian particles at different spatial positions within a research area can enable further analysis through probabilistic statistics combined with specific scientific queries.
Numerical models, especially those coupling Lagrangian particle tracking with ocean circulation models, are extensively employed to assess and forecast changing environmental conditions (Liubartseva et al., 2018). However, many Lagrangian tracking models suffer from compatibility issues, frequently supporting only the output data of specific hydrodynamic models. Additionally, most numerical models, when simulating floaters in the ocean, adopt a two-dimensional assumption that plastic debris is a neutrally buoyant particle floating on the sea surface. The virtual particles deployed in such models can only passively move with the background flow, which deviates considerably from the diverse and ever-changing real-world oceanic conditions (Jalón-Rojas et al., 2019).
2.2 Experimental design
This study will employ a two-dimensional offline Lagrangian particle tracking method for the tracking process. Compared to the conventional online Lagrangian particle tracking method, the computation time for this approach is significantly shorter. Furthermore, for surface layer tracking, the two-dimensional method suffices to meet research requirements. Considering the potential for rapid dispersion of contaminants in the surface layer of radioactive wastewater (Macdonald et al., 2020), and the fact that tritium in radioactive wastewater is a neutral element that can be tracked more effectively using Lagrangian virtual particles to trace the dispersal of nuclear contaminants from the FDNPP (Zhao et al., 2021). This approach helps in precisely monitoring the spread of radioactive materials from the FDNPP.
The Kuroshio Current is the world’s strongest western boundary current, and the FDNPP is located in the region where the east-flowing Kuroshio and the southwest-flowing Oyashio currents mix. This area is characterized by complex coastal currents, tide-driven flows, and mesoscale eddies. The intricate pathways of these ocean currents can be traced using Lagrangian drifters. Referencing previous research, a high-radiation zone was identified near a semi-permanent eddy approximately 100 km southwest of the FDNPP (Buesseler, 2014). Taking into account the location of the FDNPP (142.4°E, 38.3°N), the nearby land and sea distribution, and the ocean current dynamics, the region between 141°-143°E and 34°-36°N was selected as the release area for the virtual Lagrangian particles to be tracked. Coastal discharge outlets were not chosen for the experiment because the HYCOM model’s reanalysis data demonstrates suboptimal simulation of nearshore currents. Additionally, releasing Lagrangian particles too close to the coast may result in a significant loss of particles as ocean currents carry them ashore, impacting the coastal boundary. The introduction method will maintain a consistent number of particles. Given that the TEPCO’s regulatory limit for the radioactive concentration of tritium at discharge outlets is less than 1500 Bq/L, and considering that the tritium concentration in the current storage tank’s contaminated water far exceeds this threshold, the experiment is designed from a worst-case perspective, assuming a stable nuclear contaminated water tritium concentration of 1500 Bq/L during discharge.
Particle releases will be executed for two distinct years, 2015 and 2021, during different seasons. The tracking duration will range between 90 to 720 days. We will analyze and tally the tracking trajectories and spatial distribution patterns of these particles, comparing the results with those of previous studies.
2.3 Validation of particle tracking accuracy
To verify the accuracy of particle tracking, we compared the trajectories from the Lagrangian particle tracking experiments with the corresponding data from the surface drifters of the GDP. The specific steps are as follows:
Drifter data from the GDP for the years 2015 and 2021(Figures 2A, B), originating near the FDNPP ‘s vicinity (140°-150°E, 30°-45°N), were selected. At a depth of 15m, 10,000 neutral particles were uniformly released, and the trajectories of these drifters over a lifespan of 90 days were charted. By juxtaposing the GDP trajectories with those of the virtual particles, the reliability of the tracking method was assessed.
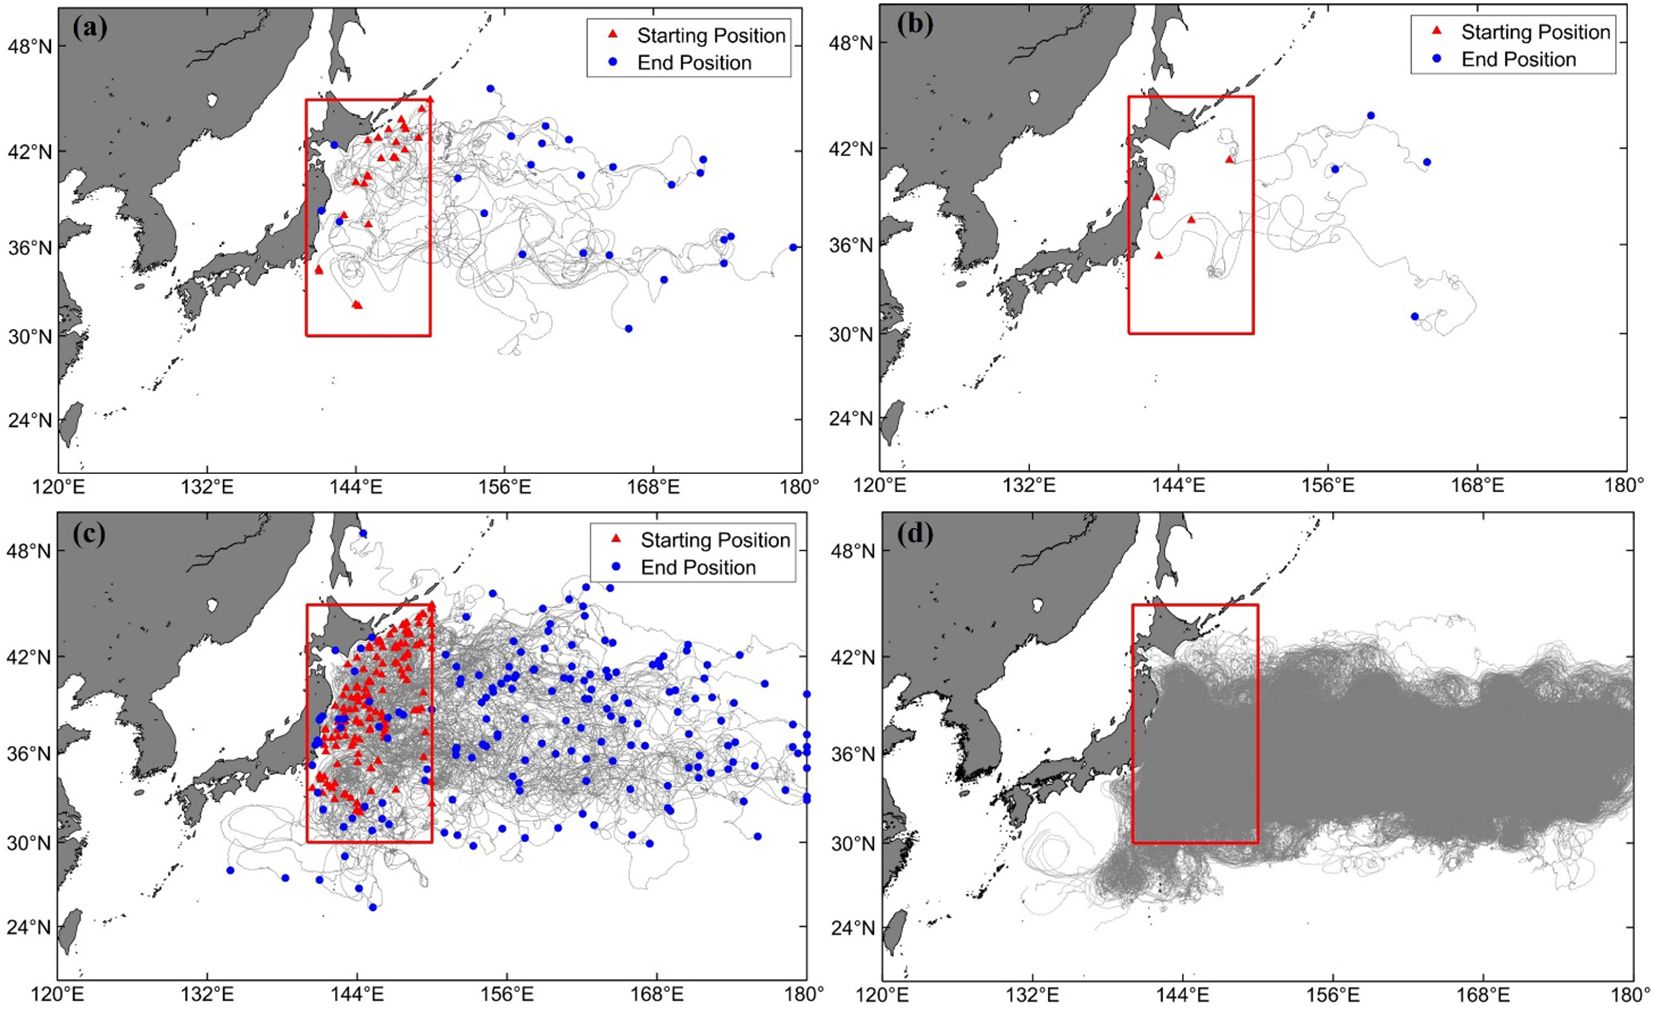
Figure 2 (A, B) respectively represent the GDP drifter trajectories with a lifecycle of approximately 90 days, originating in the waters east of Fukushima (140°-150°E, 30°-45°N, within the red box) in the years 2015 and 2020. (C) indicates the trajectories of GDP drifters within the key area over a 90-day period spanning the last 10 years. (D) represents the 90-day trajectories of particles released within the red square.
In the vicinity of the FDNPP (141°-143°E, 34°-36°N), 10,000 neutral virtual particles were uniformly released. The reanalysis data from HYCOM+NCODA (with a temporal resolution of 3 hours and a spatial resolution of 1/12°×1/12°) was employed as the background driving flow field for tracking. The tracking duration was 90 days, as shown in Figure 2D. When compared to the trajectories of the GDP drifters in Figure 2C, it is evident that the pathways largely align. Additionally, the model can simulate corresponding trajectories in the mesoscale eddy regions south of the KE in southern Japan. Therefore, the feasibility of this Lagrangian tracking model can be qualitatively validated.
2.4 Other data
This study primarily utilizes the reanalysis data from HYCOM (HYbrid Coordinate Ocean Model), which is accessible at https://www.hycom.org/. The data boasts a temporal resolution of 3 hours and a spatial resolution of 1/12° by 1/12°. Vertically, it spans a depth of 300 meters and is structured into 25 layers. Additionally, we employed the Global Drifter Program dataset (previously known as the Surface Velocity Program (SVP)). This dataset has undergone quality control and has been interpolated at 6-hour intervals for the surface drifter observations (Centurioni et al., 2019). The average error for the buoy’s latitude and longitude coordinates is less than 0.01°. For terrain mapping, we adopted ETOPO1, which is derived from a combination of global and regional datasets. ETOPO1 represents a 1-arc minute global topographic model, integrating both terrestrial and oceanic basin terrains. For further details on ETOPO1, please refer to https://www.ncei.noaa.gov/access/metadata/landing-page/bin/iso?id=gov.noaa.ngdc.mgg.dem:316.
3 Results
3.1 Interannual variation and latitudinal shifts in KE
Observations from Figure 1 indicate negligible seasonal variations in the overall flow axes of the Kuroshio Current and its extension in 2015, with noticeable southward bending at the KE near 140°E, 34°N in the south of Japan, specifically during spring and autumn. In 2021, both the KE continued to display minimal seasonal variations in their flow axes. However, when juxtaposed with the 2015 SSH field, the 2021 KE flow axis appears to be influenced by eddies, predominantly located north of the 35°N latitude. In contrast, the 2015 KE flow axis closely aligns with the 35°N latitude, situating it 2-3 degrees of latitude further south than in 2021. This alignment corroborates the descriptions provided earlier in the text and, from a different perspective, validates the viewpoints presented by Qiu and Chen (2010), thereby bolstering the reliability of this study.
Additionally, it is important to highlight that the eddy kinetic energy in the KE region exhibits significant interdecadal variations, reflecting the KE’s shifts between stable and unstable states. During active periods, the energy level triples compared to quieter times, with stable phases characterized by a strong, northward KE jet, and unstable phases marked by a weaker, eastward KE jet with a southern deviation. These transitions are driven by basin-scale wind stress curls associated with Pacific Decadal Oscillations (PDOs). Changes in PDO phases alter the Aleutian low and SSH anomalies, affecting the KE’s intensity and pathway through baroclinic Rossby wave dynamics (Qiu and Chen, 2010).
In summary (refer to Figure 3), during positive PDO, the KE shifts southward around 32°N, and northward during the opposite phases. These interdecadal shifts in the KE system’s large-scale transport pathways (Qiu, 1995, 2000; Qiu and Chen, 2010) significantly influence the trajectory of contaminated water from Fukushima. This study investigated these variations across different KE configurations, employing flow fields from two distinct states within a single cycle for experimental analysis. Using the Lagrangian particle-tracking method, it examined substance dispersion, including pollutants from the Fukushima discharge, within the fluid medium, aiming to uncover the underlying mechanisms and causes.
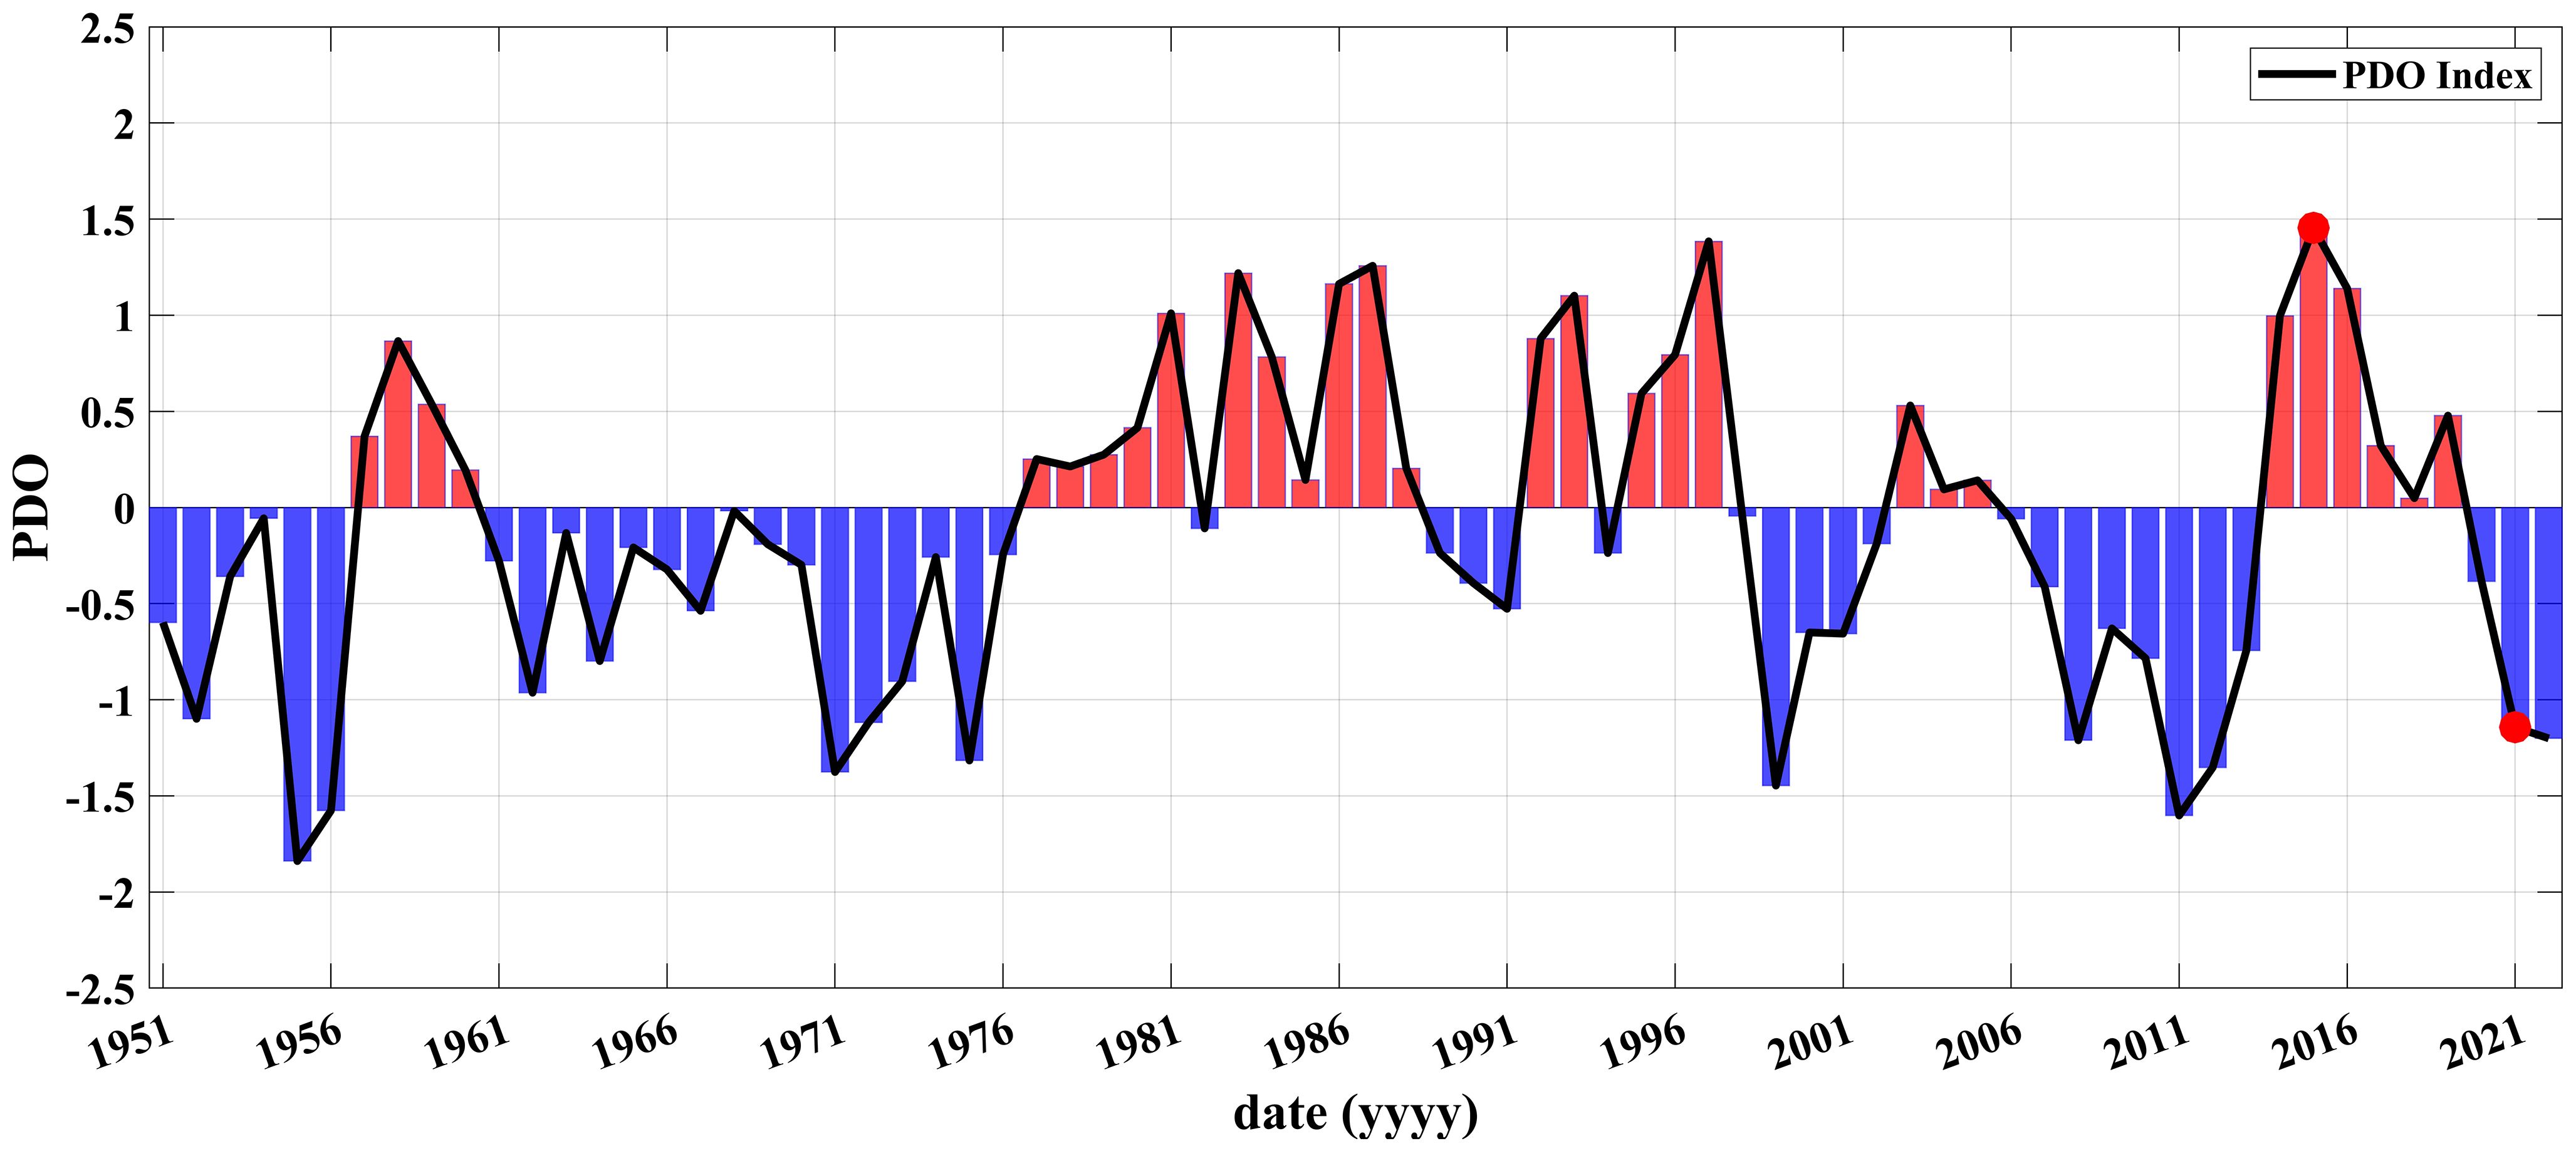
Figure 3 The PDO index. The red shading represents the positive phase of the PDO index, while the blue shading indicates its negative phase. Red circles indicate the PDO index in 2015 and 2021.
3.2 Seasonal and interannual variation of the trajectory of surface contaminated water diffusion in the Southeastern Sea Area of FDNPP.
To study the seasonal variation characteristics of the transport and diffusion trajectories of the contaminated water discharged from the FDNPP, and the transport trajectories under the stable and unstable states of the Kuroshio current’s main axis, we released 10,000 neutral particles (with a density consistent with seawater) at a depth of 15m in the southern waters of the FDNPP (141°-143°E, 34°-36°N) during different seasons of 2015 and 2021. The tracking period lasted 90 days, with an input flow data time step and output time step both set at 3 hours.
Post-tracking, as seen in Figure 4, the particle trajectories in summer and winter depict two distinct patterns: summer trajectories primarily concentrate around the extended body of the Kuroshio current, with most particles extending eastward, nearing the 180°E meridian. In stark contrast, the winter trajectories show most particles gathering in the waters south of the release point, exhibiting a southward dispersion trend. Only a few particles are transported eastward along the KE. Observing spring and autumn trajectories, the majority of particles traverse through the region of 140°-160°E, 30°-40°N. Relative to the trajectories of winter and summer, particles in spring and autumn demonstrate a minor northward motion trend. Simultaneously, a minimal number of particles deviate from the eastward-moving Kuroshio main axis, opting for a southwestward motion, joining the perennial mesoscale eddies south of the Kuroshio in the southern Japanese waters.
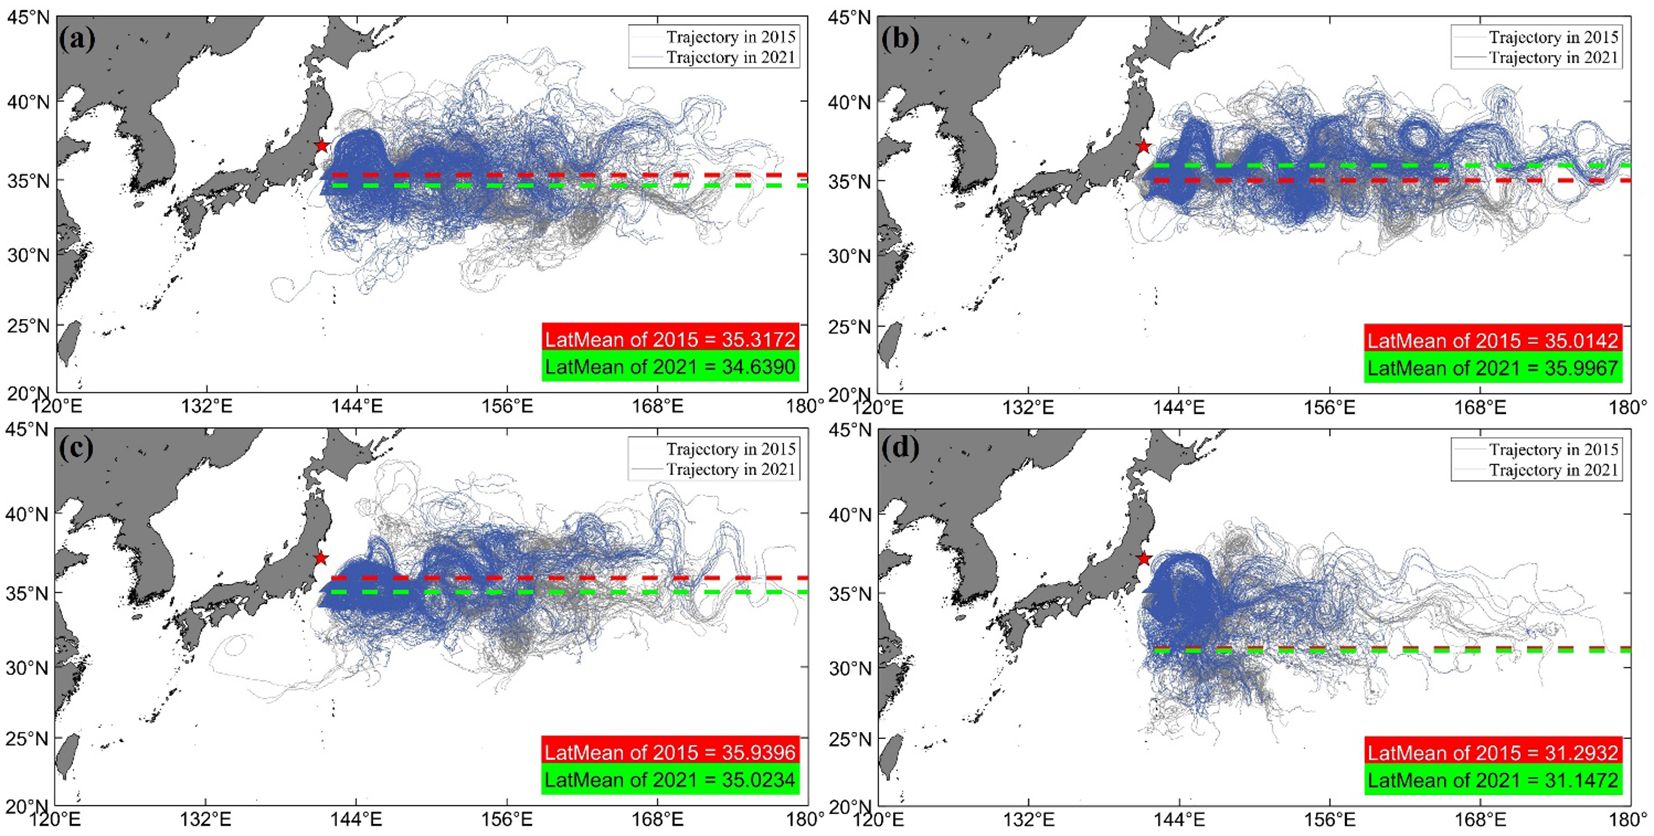
Figure 4 Trajectories of southward Lagrangian particles during the four seasons in 2015 and 2021. The red pentagram indicates the geographical location of FDNPP. The starting point of the virtual particles is located at 141°-143°E, 34°-36°N, with a depth of 15m and an approximate lifecycle of 90 days for their trajectories. The gray solid lines depict the particle trajectories from 2015, while the blue solid lines represent those from 2021. Red and green dashed lines respectively represent the zonal mean positions of the particle trajectories. Figures (A-D) correspond to the four seasons: spring, summer, autumn, and winter, respectively.
2015 was a typical period of a positive phase of the PDO (as indicated by the red circle in Figure 3). Conversely, 2021 was marked by a negative PDO phase. Consequently, the Kuroshio current’s main axis in 2021 shifted its average pathway southward to around 32°N, while in 2015 it moved northward.
Comparing the particle trajectories in different seasons of 2015 and 2021, it’s evident that the 2021 trajectories (Figure 4 grey lines) are overall shifted northward. The summer trajectory axis is around 37°N, while the winter trajectories concentrate in the region 30-36°N, 143-146°E. In contrast, the 2015 trajectories (Figure 4 blue lines) lean southward, with the summer trajectory axis around 34°N, and winter trajectories converging between 26-40°N, 142-148°E. However, within the eastward-extending Kuroshio, the trajectories are more southern than those of 2021. In 2021, the latitudinal mean values of the trajectories were about 1° further south in spring, autumn, and winter compared to those in 2015, except in summer, when the 2021 trajectories’ mean latitude was about 1° further north than in 2015. It is also observed that in spring, autumn, and winter, the mean latitudinal values of the trajectories for both 2015 and 2021 are mostly within 1° of the 35°N latitude line, but in winter, they reach near 31°N latitude. This suggests a strong southward movement tendency for most particles in winter, but it does not exclude the possibility of particles moving in other directions after heading south. Therefore, mapping the final positions of the particles is necessary for further study.
3.3 Seasonal and interannual variation in the southward diffusion trajectory of surface nuclear contaminated water in the Southeastern Sea Area of FDNPP.
From previous studies, it is known that a portion of particles in the sea near the FDNPP are influenced by the vortex and recirculation system south of the Kuroshio Current, as well as diffusion processes, moving from the eastern waters of Fukushima Prefecture southwestward into the ECS. However, the majority of these particles move eastward with the KE. Therefore, particles that cross the 30°N latitude and continue to move southward are defined as southward-moving particles. This subset of particles could potentially be the ones to reach the Chinese coastal areas in the shortest amount of time. Hence, further study and analysis on the trajectory and state of these particles is conducted.
As shown in Figure 5, the blue solid line represents the trajectories of particles released in different seasons of 2021, while the gray solid line represents those from 2015. In the spring and autumn of 2015, a fraction of the particles deviates from the KE’s main axis and move southwestward. In the autumn diagram, particles entering the southern KE vortex system can be seen parting from particles moving northward, continuing their southwest movement towards the coastal waters of China. Based on the findings, this route appears to be the fastest for particles entering Chinese coastal waters (including the SCS, ECS, and YS). In terms of coverage, trajectories of particles released in spring and winter undoubtedly have the widest range, roughly forming an isosceles triangle with the 142°E meridian as its base.
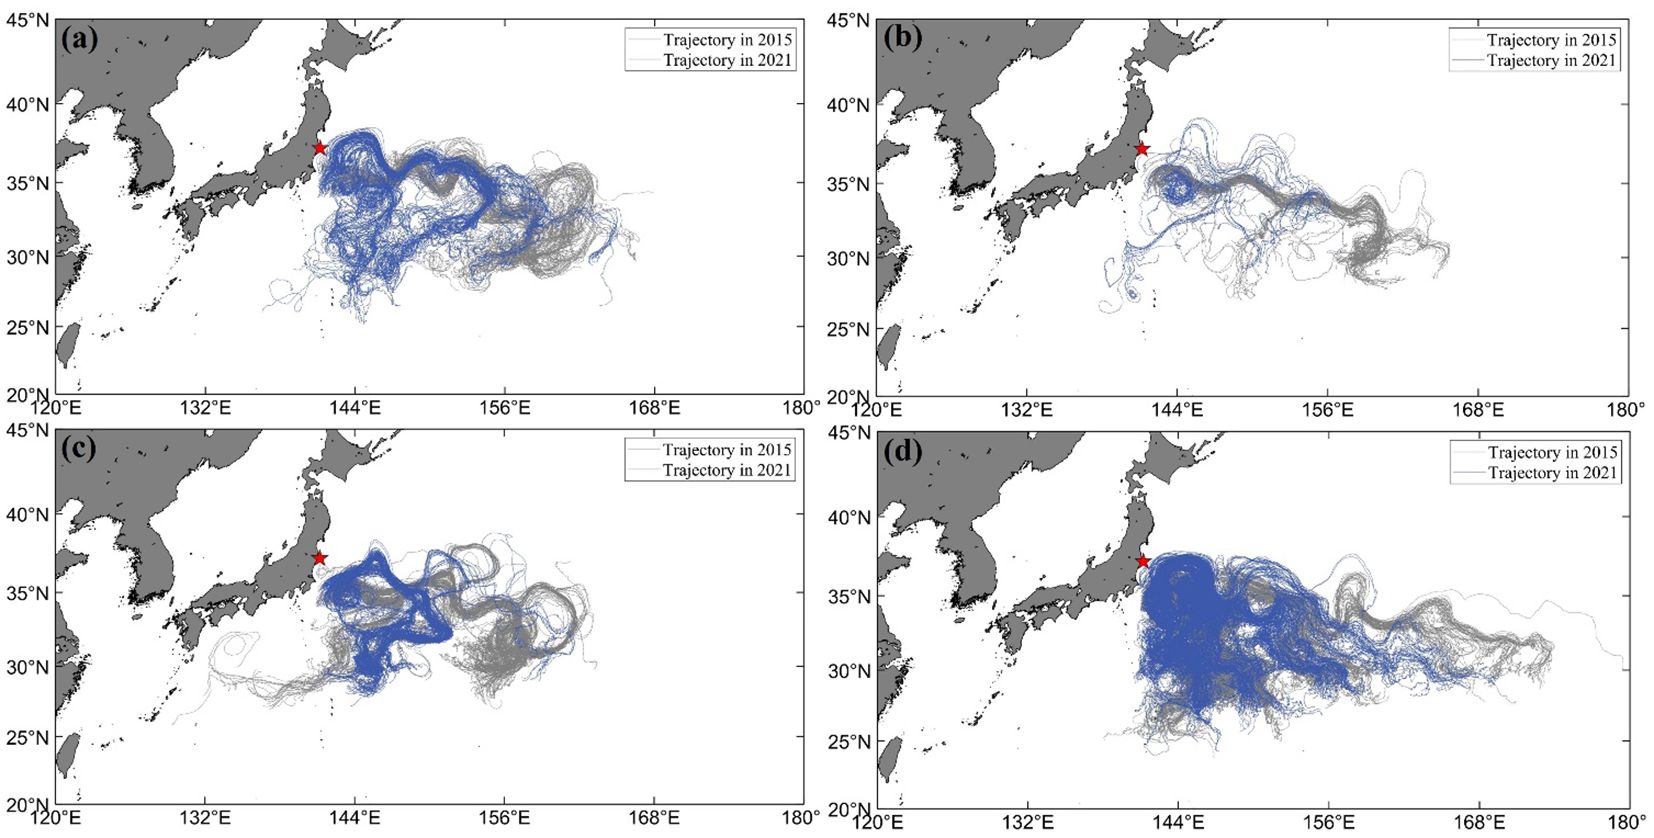
Figure 5 Trajectories of southward Lagrangian particles during the four seasons in 2015 and 2021. The starting point of the virtual particle is 141°-143°E, 34°-36°N, the depth is 15m, and the life cycle is about 90 days southward across the 30°E latitude. The solid gray line represents the particle trajectory in 2015, and the solid blue line represents the particle trajectory in 2021. Figures (A-D) correspond to the four seasons: spring, summer, autumn, and winter, respectively.
Quantitative statistics on the southward-moving particles are presented in Table 1. By calculating the percentage of southward-moving particles out of the total released, it’s observed that the highest number of these particles is in winter, followed by autumn, with the least in summer. Comparing the percentage of southward-moving particles in different seasons between 2021 and 2015, there were more such particles in the summer, autumn, and winter of 2015 than in 2021. This observation may be attributed to the southward shift of the KE’s main axis in 2015, leading to an increase in the number of particles entering the KE and moving southward.

Table 1 The ratio of particle across the 30°E latitude.
Building upon the conclusions established earlier, it is evident that during both phases of the KE, particle concentrations headed southward are at their peak in winter compared to summer. This leads to the question: could the particle pathways released in the vicinity of the FDNPP during winter potentially become the fastest route impacting the coastal areas of Asia-Pacific nations?
To visually demonstrate the swiftest invasion routes and timelines of surface-level nuclear contaminants in nearby marine areas, a two-year tracking study of 10,000 virtual particles released in each of the four seasons of 2021 was conducted. The findings reveal that particles released in all seasons primarily followed the southwestward recirculation of the KE, concentrating in the southeastern waters off Taiwan, then a portion moved northeastward along the Kuroshio near Taiwan. During this northward journey, some particles invaded the ECS and YS and the coastal areas of Zhejiang and Fujian in China. Particles traveling northward to the southern part of Japan divided into two groups: one crossing the Korea Strait into the Sea of Japan and another moving southwestward towards Jeju Island. A portion of particles gathered in the southern part of Taiwan and the southward-moving particles from Taiwan’s southwestern region invaded the SCS and continued westward.
Firstly, the study involves statistical analysis of the arrival times of particles to key maritime regions east of the Taiwan Strait in each season, utilizing a criterion based on cumulative concentration reaching 0.001 (i.e., 10 out of 10,000 particles arriving in the area). Secondly, the key areas for particle arrival were selected to provide support for subsequent research with measured data. The selection was based on the site locations of the major vertical and surface stations in Men et al. (2015) study on the release of radionuclides from the Fukushima Nuclear Accident. This study provides valuable information on the dispersion and transport of Fukushima-derived radionuclides in the ocean, which can be used to improve our understanding of the environmental impact of nuclear accidents.
In 2015, Particles released in the spring and summer take approximately 14 months to reach the vicinity of the Luzon Strait, while those released in autumn travel the fastest, taking about 9 months, and winter particles arrive in 12 months (Figures 6A-D). The time taken for particles to reach the SCS region varies by season, with corresponding durations of 24, 21, 20, and 16 months for spring, summer, autumn, and winter, respectively (Figures 7A-D). According to simulation results, the speed of southward-moving particles invading the nearby maritime areas is fastest during autumn and winter, with other seasons following in speed.
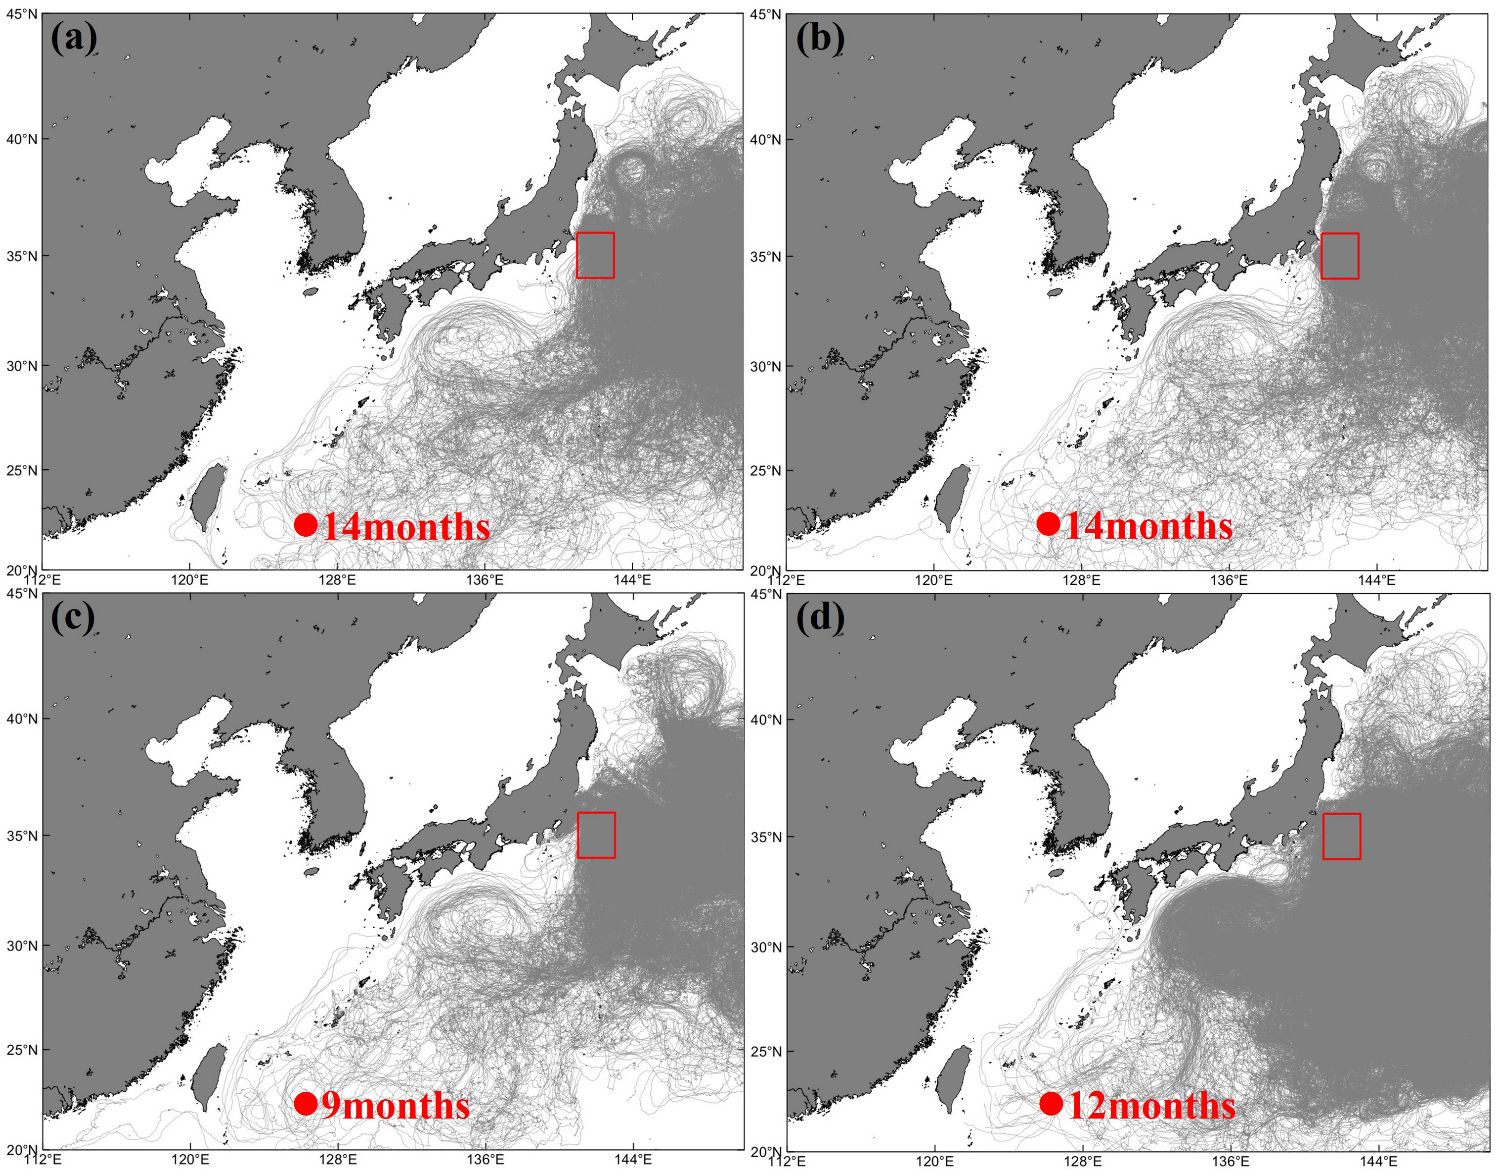
Figure 6 (A-D) respectively represents the pathways of particles released during the spring, summer, autumn, and winter of 2015, as they arrive in the marine area east of Taiwan. In these figures, gray solid lines indicate the trajectories of the particles, while red solid-line squares denote the initial release locations of the particles. The red solid circles mark the approximate time of the particles’ arrival in the southeastern sea area off Taiwan. The indicated times represent the months in which the cumulative concentration of particles reaches 0.001.
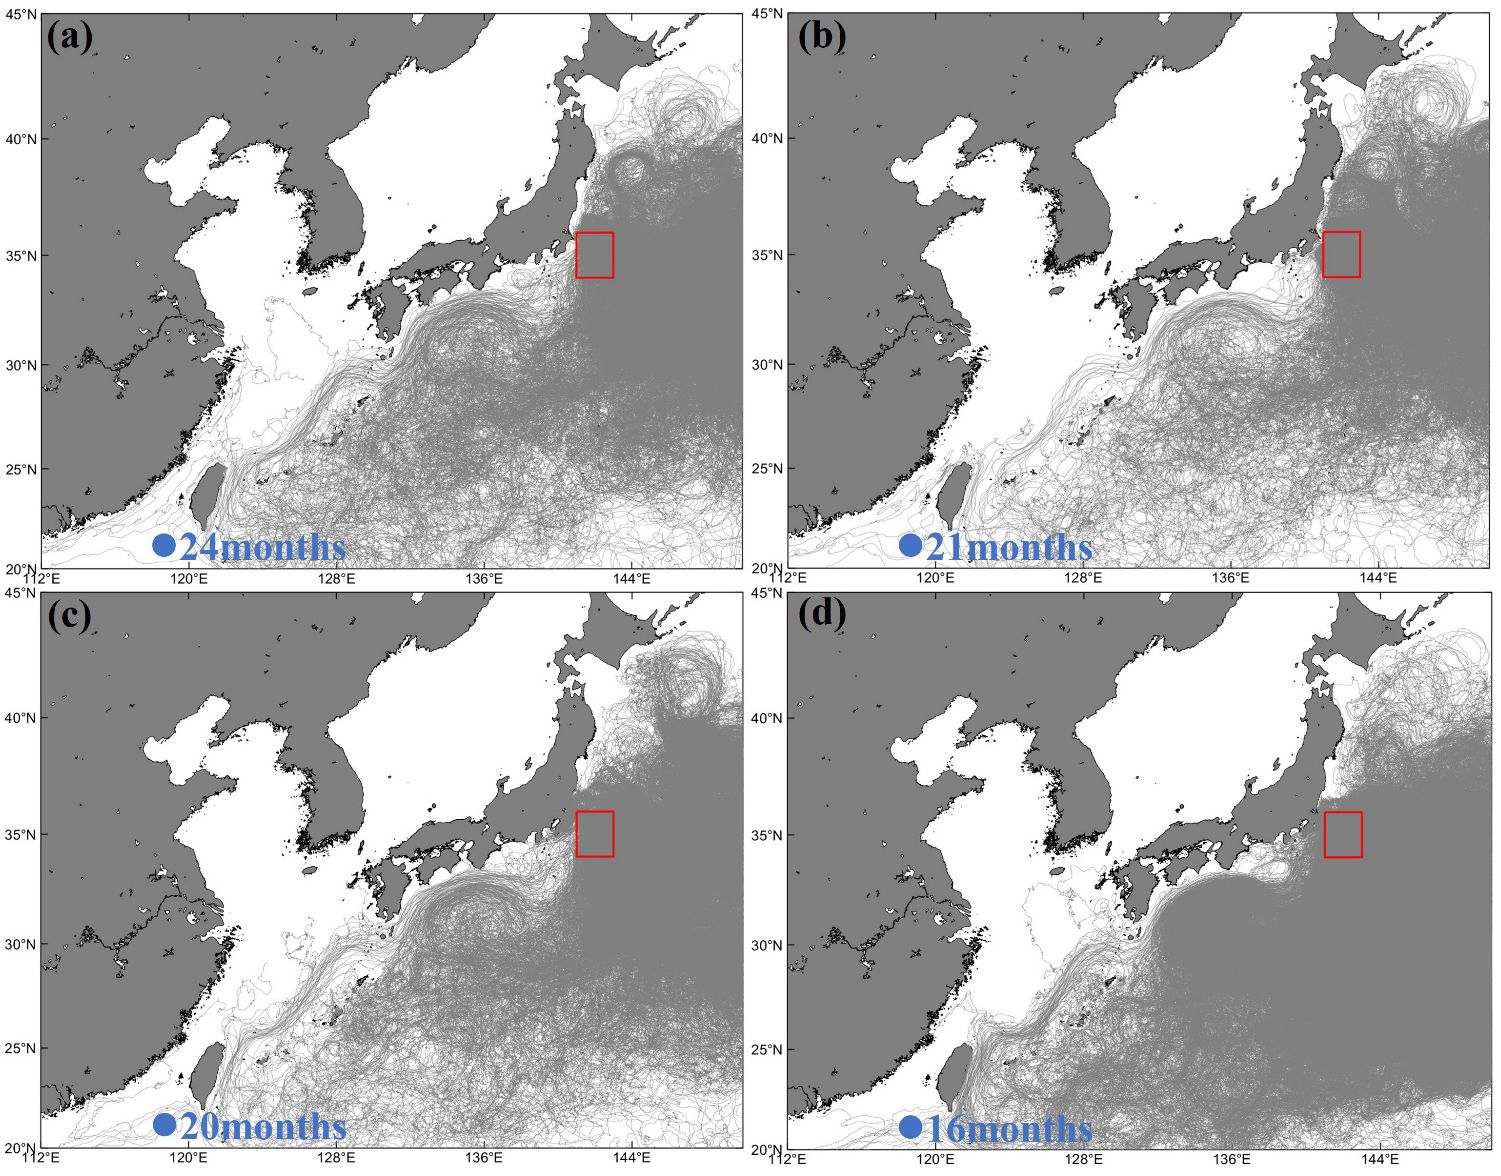
Figure 7 (A-D) respectively represents the pathways of particles released during the spring, summer, autumn, and winter of 2015, as they arrive in the marine area east of Taiwan. In these figures, gray solid lines indicate the trajectories of the particles, while blue solid-line squares denote the initial release locations of the particles. The blue solid circles mark the approximate time of the particles’ arrival in the SCS. The indicated times represent the months in which the cumulative concentration of particles reaches 0.001.
In 2021 spring (Figure 8A), particulate matter may rapidly disperse to the eastern sea area of Taiwan within 11 months, likely influenced by monsoons and ocean fronts. During summer (Figure 8B), intensified ocean currents and typhoon activities result in a more dispersed pattern, with particles taking 15 months to reach the areas east of Taiwan. The trajectory in autumn could be affected by monsoonal changes, leading to increased horizontal velocity of particle movement, taking 11 months to reach the destination (Figure 8C). In winter (Figure 8D), prevailing wind directions and ocean currents may facilitate more direct entry into the SCS, and the enhanced southward surface flow reduces the time to just 10 months.
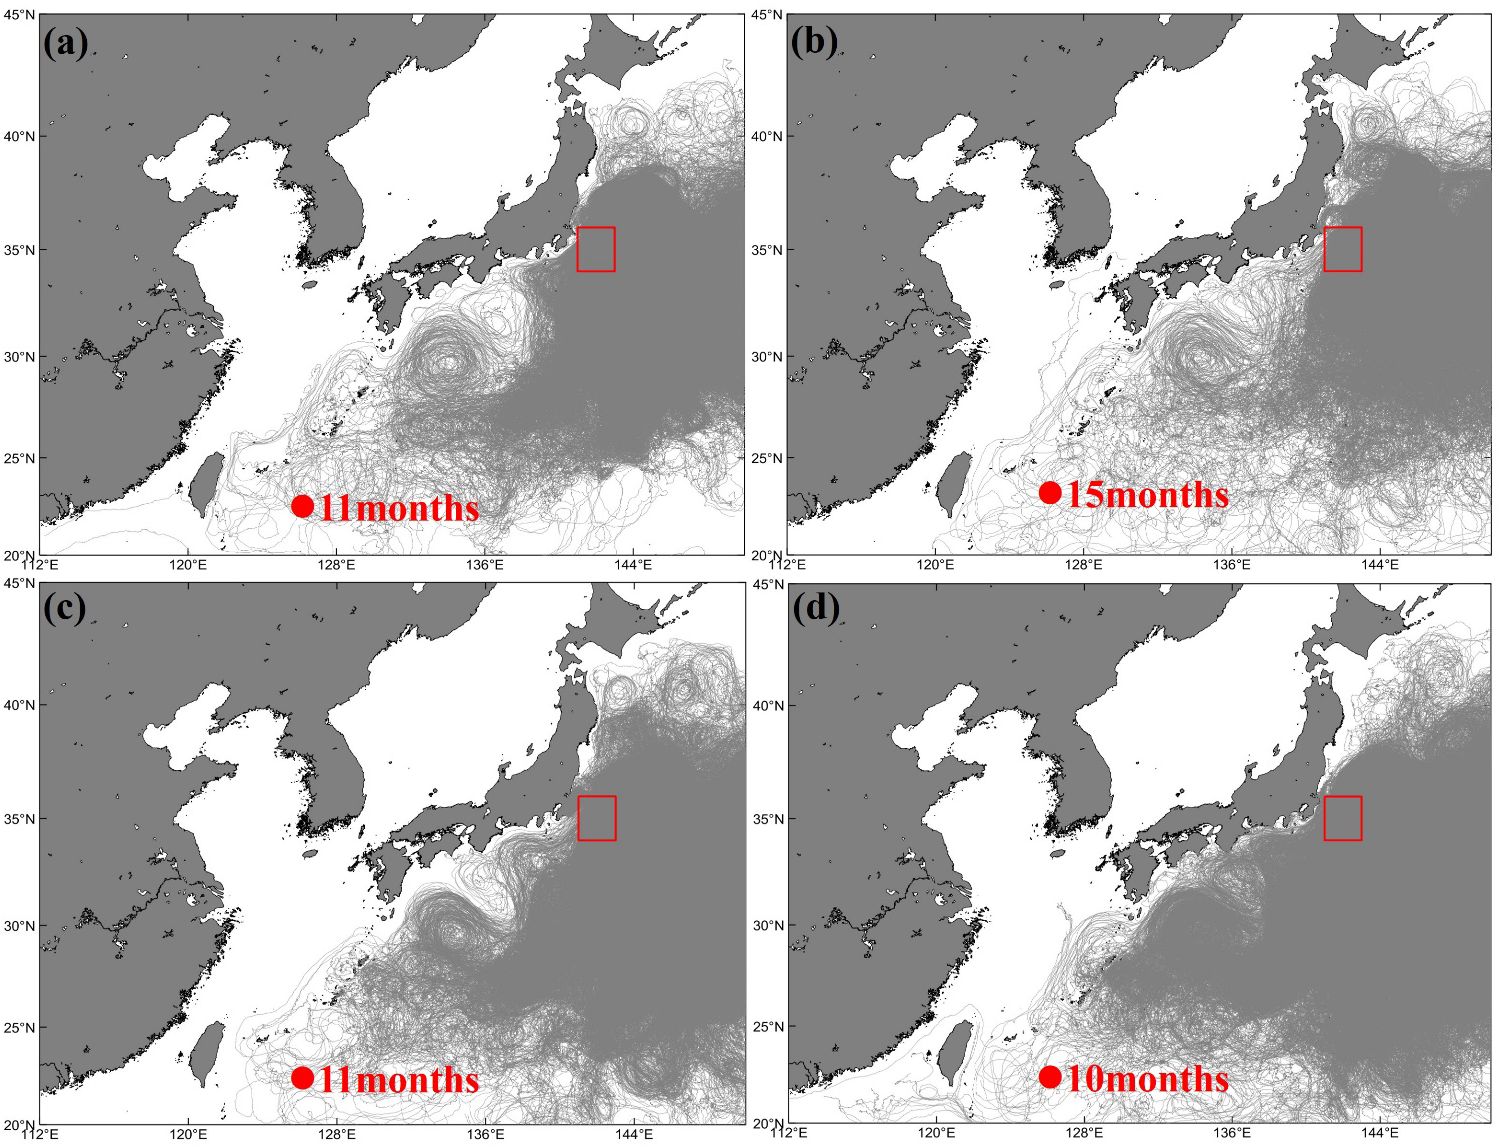
Figure 8 (A-D) respectively represents the pathways of particles released during the spring, summer, autumn, and winter of 2021, as they arrive in the marine area east of Taiwan. In these figures, gray solid lines indicate the trajectories of the particles, while red solid-line squares denote the initial release locations of the particles. The red solid circles mark the approximate time of the particles’ arrival in the southeastern sea area off Taiwan. The indicated times represent the months in which the cumulative concentration of particles reaches 0.001.
The time taken for particles with a cumulative concentration of 0.001 to reach the SCS is 23 months in spring, 17 months in autumn, and 13 months in winter (Figures 9A, C, D). In summer (Figure 9B), the cumulative concentration of particles reaching the South China Sea did not attain the 0.001 threshold during the 24-month tracking period.
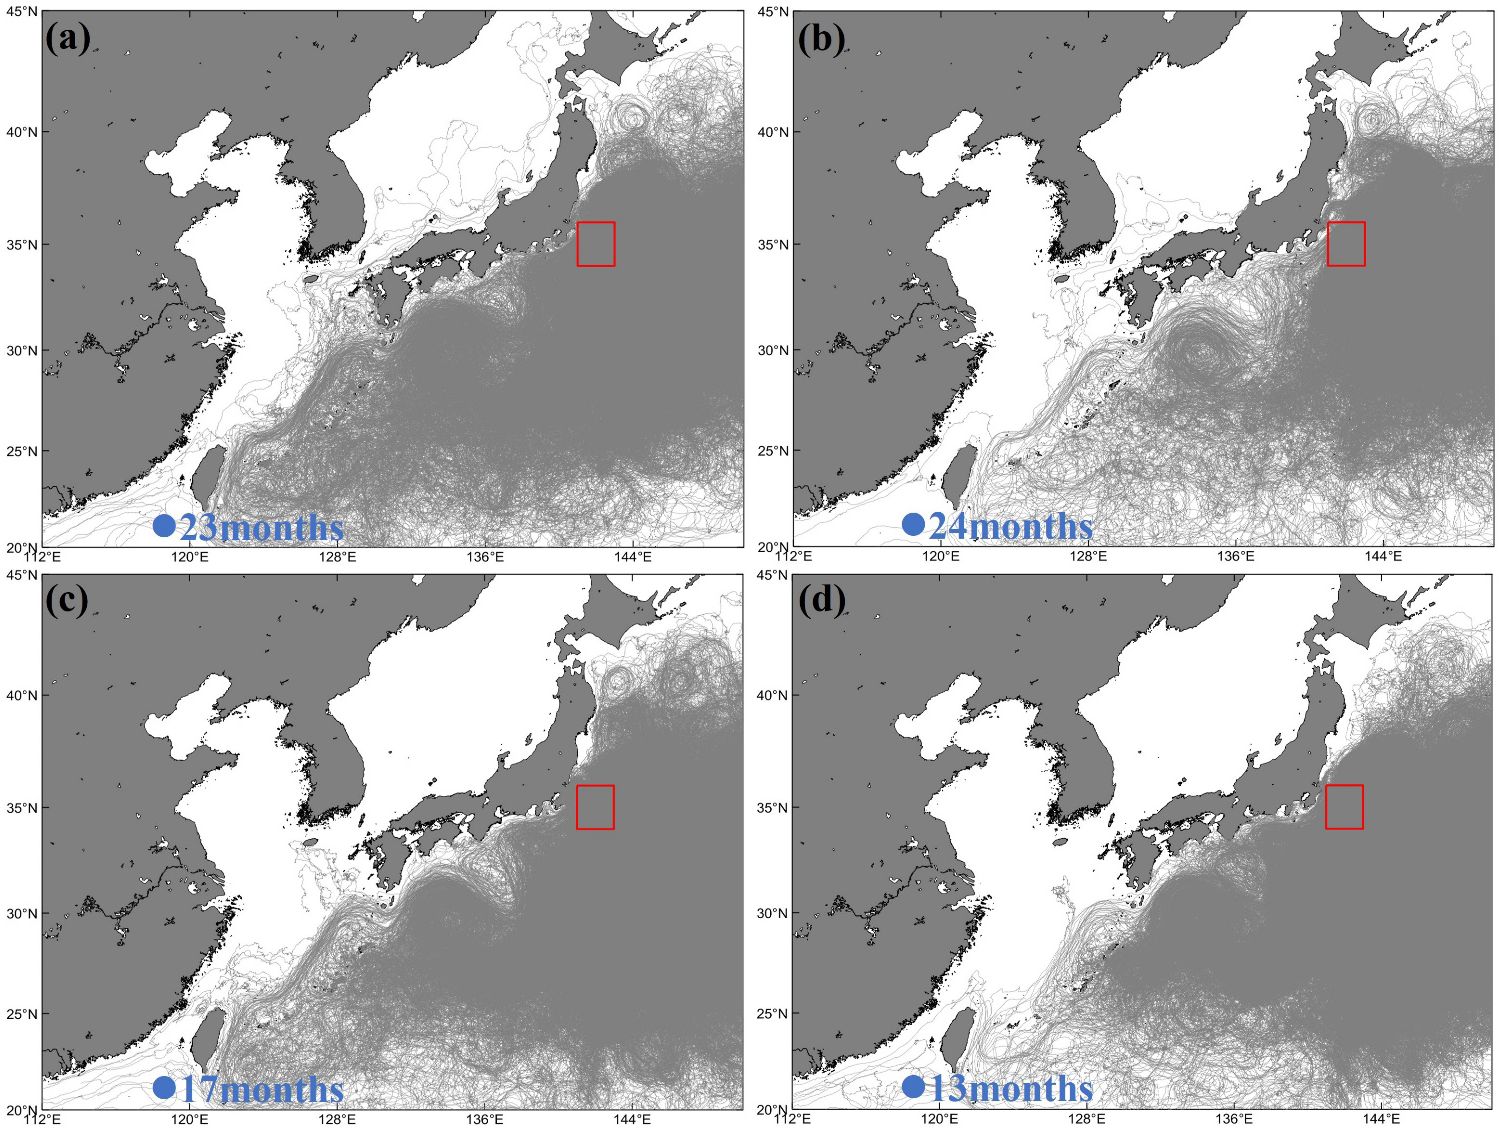
Figure 9 (A-D) respectively represents the pathways of particles released during the spring, summer, autumn, and winter of 2021, as they arrive in the marine area east of Taiwan. In these figures, gray solid lines indicate the trajectories of the particles, while blue solid-line squares denote the initial release locations of the particles. The blue solid circles mark the approximate time of the particles’ arrival in the SCS. The indicated times represent the months in which the cumulative concentration of particles reaches 0.001.
After conducting a statistical analysis of particles reaching the Luzon Strait (18°–23°N and 120°–123°E) in different seasons for the years 2015 and 2021, it was found that the proportion of southward-moving particles arriving in the Luzon Strait during winter was the highest, accounting for 1.61% and 2.11% of the total, respectively (Table 2). This contrasts with the average latitudes of particles in 2015 and 2021 as shown in Figure 4. The overall trend of particle trajectories in 2015 was more southward, thus correlating with a higher number of particles reaching the Luzon Strait.
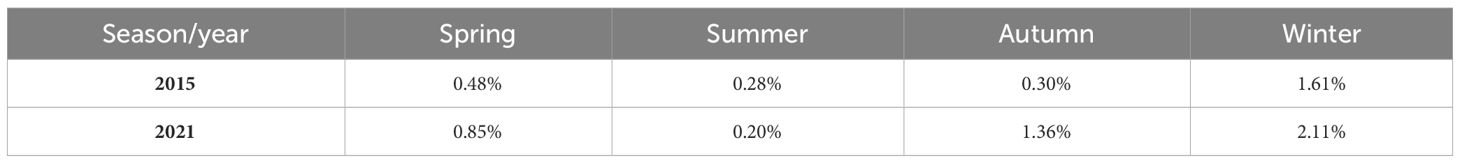
Table 2 The ratio of particles that entered or transited through the Luzon Strait (18°–23°N and 120°–123°E) in different seasons between 2015 and 2021, as a proportion of the total number of particles.
4 Summary and discussions
Prior research identified three FDNPP discharge pathways, with the fastest to China influenced by vortices, Kuroshio southern recirculation, and diffusion (Lu et al., 2022). The KE’s state, influenced by PDOs and wind stress curl forcing, affects these pathways. We compared 2015 and 2021 flow fields (representing different KE states) and found that the KE trajectory shifts southward during positive PDOs (32°N) and northward during negative PDOs (Qiu and Chen, 2010).From the traced particle trajectories, summer and winter particle pathways represent two distinct patterns: The summer trajectories primarily converge near the KE, with most particles extending eastward, nearly reaching the vicinity of the 180°E meridian. In contrast, winter trajectories display an opposite pattern to the summer. Most winter particles gather in the marine area south of the release point, showing a tendency to spread southward. Only a minor fraction of particles transports eastward with the KE. Wang and others in previous studies also observed that the Lagrangian particles released near the FDNPP form a southward branch between 170° and 130°W (Wang et al., 2012). However, this trajectory was identified only through long-term tracking and did not account for seasonal variations in the southward pathway. Our study, starting from a seasonal perspective, has discovered that winter is the season with the highest concentration of southward-moving particles. Wang et al. (2022) conducted long-term observation and measurement of radioactive cesium isotopes in seawater samples collected from stations in the northeastern SCS and the ECS. He found that the intrusion of FDNPP-derived radioactive cesium into the ECS and SCS mainly occurs in autumn and winter, along with the intrusion of Kuroshio subsurface high-salinity water into the northeastern SCS and ECS. This also provides observational evidence for the research results of this paper.
Comparing the particle trajectories between 2015 and 2021 across different seasons reveals that the 2021 trajectories are generally more northward in orientation. Summer trajectories in 2021 are centered around the 37°N latitude, while winter trajectories cluster in the 30-36°N, 143-146°E region. For 2015, trajectories trend southward, with summer pathways focused around the 34°N latitude and winter pathways situated in the 26-40°N, 142-148°E region. However, within the eastward-extending KE, the 2015 trajectories are more southward compared to those in 2021.
Zhao and colleagues employed the Princeton Ocean Model (POM) to track the surface diffusion pathways of tritium in the contaminated water discharged from the FDNPP. They conducted four different emission experiments under the constant total volume of contaminated water (Zhao et al., 2021). However, their experimental results indicated that the surface contaminants with a concentration of 0.001 did not reach the waters near Taiwan and the Chinese coast within two years. In contrast, our experiments demonstrate that with a concentration of 0.001 (representing 10 particles out of a total release of 10,000 particles), it only takes as little as 10 months for the particles to reach the waters near Taiwan, and even extend westward into the SCS.
Summarizing the 2-year trajectories of particles released in each season (Figure 10), a clearer picture emerges of the surface-level pollution from the FDNPP impacting the marine areas around Asia-Pacific nations. Firstly, influenced by the recirculation system and diffusion processes of KE in southern Japan, the shortest-time pathway from the southeastern maritime region of Fukushima Prefecture to China, Luzon, and Southeast Asian waters is established. It takes about 11 months for particles to gather in the northeastern waters off Taiwan. From the southeastern waters off Taiwan, the trajectories bifurcate southwestward and northeastward. The southwestward particles, following a branch of the Kuroshio, spend about 14.5 months moving from the southern waters of Taiwan into the SCS and continue westward; while the northeastward particles, moving north along the Kuroshio off the eastern coast of Taiwan, reach southern Japan, with some invading the ECS and the YS of China in the process, also taking around 14.5 months in total. The particles reaching southern Japan divide again, with one branch entering the Sea of Japan through the Tsushima or Korea Strait, and another re-entering the KE system near the Osumi Strait, taking approximately 20 months for this journey.
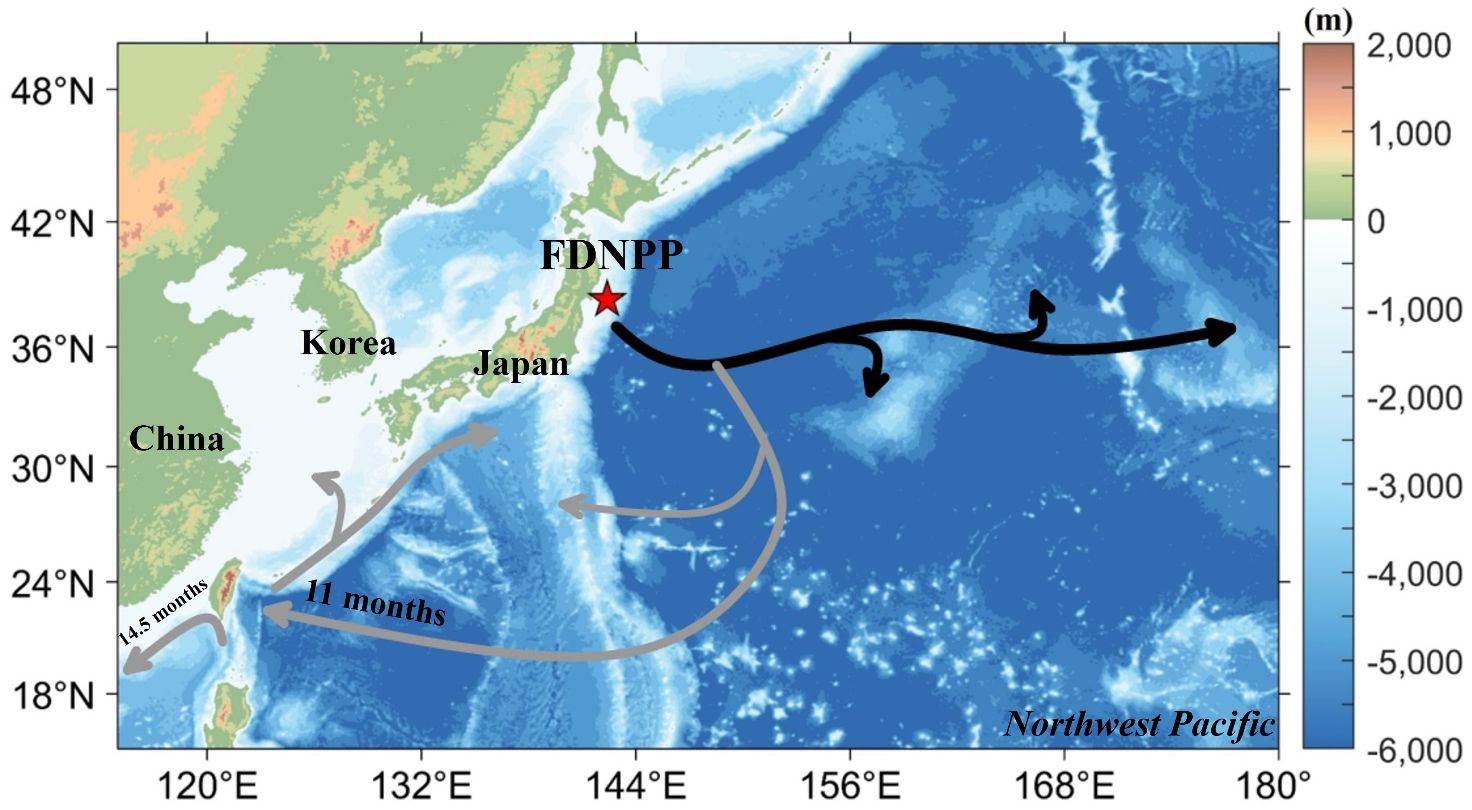
Figure 10 A schematic view of spreading channels of radioactive material with the FDNPP radioactive water in the Northwest Pacific Ocean. The pentagon symbol represents the location of the FDNPP. The black solid line represents the trajectory of eastward-moving radioactive materials, while the grey solid line indicates the pathway of southward-moving radioactive materials.
This study fills a gap in seasonal research on surface-level contaminated water discharged from the FDNPP, comparing the impact of nuclear contamination across different seasons on Asia-Pacific nations and detailing the pathways and timelines for the contamination to reach the waters near Japan and its neighboring countries. Results indicate a significant reduction in time for nuclear contaminated water to invade the waters near Taiwan, down to 10 months, and approximately 12 months for the fastest invasion into the ECS and SCS.
However, the study has limitations due to the use of a two-dimensional tracking method, neglecting the impact of vertical flow velocity in the flow field on the particles. In our tracking model, the decay of radioactive substances was not accounted for. This implies that the time it takes for particles to reach critical areas could represent an upper limit for the fastest time for radionuclides with short half-lives. Due to the influence of ocean currents, previously deposited radionuclides may lead to changes in surface-level radioactive concentrations (Kumamoto et al., 2014). In the context of the 2011 FDNPP disaster, the principal radionuclides discharged into the marine and atmospheric environments included 131I, Cesium-134 (134Cs), and 137Cs. The half-lives of these isotopes are notably diverse, being 8.02 days for 131 I, 2.06 years for 134Cs, and 30.17 years for 137Cs. Commencing in 2023, the discharge of nuclear-contaminated water into the Pacific Ocean, treated through the ALPS, still contains the presence of radionuclides such as Tritium, Carbon-14 (14C), Ruthenium-106 (106Ru), Cobalt-60 (60Co), and Strontium-90 (90Sr). The respective half-lives of these isotopes are 12.3 years for Tritium, 5730 years for 14C, 373.59 days for 106Ru, 5.26 years for 60Co. Future research will address these aspects, providing a deeper exploration of the trajectories of contaminated water discharged from the FDNPP.
Data availability statement
The original contributions presented in the study are included in the article/Supplementary Material. Further inquiries can be directed to the corresponding author.
Author contributions
YL: Writing – review & editing, Writing – original draft, Validation, Methodology, Investigation, Formal analysis, Data curation. MZ: Writing – review & editing, Writing – original draft, Validation, Funding acquisition. FZ: Writing – review & editing, Supervision, Funding acquisition, Conceptualization. QM: Writing – review & editing, Validation. XM: Writing – review & editing, Validation, Methodology. QZ: Writing – review & editing, Methodology, Formal analysis. RY: Writing – review & editing, Validation, Investigation.
Funding
The author(s) declare financial support was received for the research, authorship, and/or publication of this article. This study was supported by the National Key R&D Plan of China (No. 2023YFC3008100), the National Natural Science Foundation of China (U23A2033 and 42106010), Global Change and Air-Sea Interaction II (No. GASI-01-WPAC-STspr), and Ocean Decade project of CSK-2: “Kuroshio Edge Exchange and the Shelf Ecosystem (KEES)”.
Conflict of interest
The authors declare that the research was conducted in the absence of any commercial or financial relationships that could be construed as a potential conflict of interest.
Publisher’s note
All claims expressed in this article are solely those of the authors and do not necessarily represent those of their affiliated organizations, or those of the publisher, the editors and the reviewers. Any product that may be evaluated in this article, or claim that may be made by its manufacturer, is not guaranteed or endorsed by the publisher.
References
Aksamit N. O., Sapsis T., Haller G. (2020). Machine-learning mesoscale and submesoscale surface dynamics from Lagrangian ocean drifter trajectories. J. Phys. Oceanogr. 50, 1179–1196. doi: 10.1175/JPO-D-19-0238.1
Aoyama M., Tsumune D., Hamajima Y. (2013). Distribution of 137Cs and 134Cs in the North Pacific Ocean: impacts of the TEPCO Fukushima-Daiichi NPP accident. J. Radioanal. Nucl. Chem. 296, 535–539. doi: 10.1007/s10967-012-2033-2
Buesseler K. O. (2012). Fishing for answers off Fukushima. Science 338, 480–482. doi: 10.1126/science.1228250
Buesseler K. (2014). Fukushima and ocean radioactivity. Oceanography 27, 92–105. doi: 10.5670/oceanog.2014.02
Buesseler K., Aoyama M., Fukasawa M. (2011). Impacts of the Fukushima nuclear power plants on marine radioactivity. Environ. Sci. Technol. 45, 9931–9935. doi: 10.1021/es202816c
Centurioni L. R., Turton J., Lumpkin R., Braasch L., Brassington G., Chao Y., et al. (2019). Global in situ Observations of Essential Climate and Ocean Variables at the Air–Sea Interface. Front. Mar. Sci. 6. doi: 10.3389/fmars.2019.00419
Fisher N. S., Beaugelin-Seiller K., Hinton T. G., Baumann Z., Madigan D. J., Garnier-Laplace J. (2013). Evaluation of radiation doses and associated risk from the Fukushima nuclear accident to marine biota and human consumers of seafood. Proc. Natl. Acad. Sci. U.S.A. 110, 10670–10675. doi: 10.1073/pnas.1221834110
He Y. C., Gao Y. Q., Wang H. J., Ola J. M., Yu L. (2012). Oceanic transmission of the Fukushima Nuclear Power Plant accident in March 2011. Acta Oceanol. Sin. 34, 12–20.
Inomata Y., Aoyama M., Tsubono T., Tsumune D., Hirose K. (2016). Spatial and temporal distributions of 134 Cs and 137 Cs derived from the TEPCO Fukushima Daiichi Nuclear Power Plant accident in the North Pacific Ocean by using optimal interpolation analysis. Environ. Sci.: Processes Impacts 18, 126–136. doi: 10.1039/C5EM00324E
Jalón-Rojas I., Wang X.-H., Fredj E. (2019). Technical note: On the importance of a three-dimensional approach for modelling the transport of neustic microplastics. Ocean Sci. 15, 717–724. doi: 10.5194/os-15-717-2019
Jayne S. R., Hogg N. G., Waterman S. N., Rainville L., Donohue K. A., Randolph Watts D., et al. (2009). The Kuroshio Extension and its recirculation gyres. Deep Sea Res. Part I: Oceanogr. Res. Pap. 56, 2088–2099. doi: 10.1016/j.dsr.2009.08.006
Joh Y., Delworth T. L., Wittenberg A. T. (2022). Stronger decadal variability of the Kuroshio Extension under simulated future climate change. NPJ Clim. Atmos. Sci. 5, 63. doi: 10.1038/s41612-022-00285-z
Kaeriyama H. (2017). Oceanic dispersion of Fukushima-derived radioactive cesium: A review. Fish. Oceanogr. 26, 99–113. doi: 10.1111/fog.12177
Kawakami Y., Nakano H., Urakawa L. S., Toyoda T., Aoki K., Usui N. (2023). Northward shift of the Kuroshio Extension during 1993–2021. Sci. Rep. 13, 16223. doi: 10.1038/s41598-023-43009-w
Kawamura H., Kobayashi T., Furuno A., In T., Ishikawa Y., Nakayama T., et al. (2011). Preliminary Numerical Experiments on Oceanic Dispersion of 131 I and 137 Cs Discharged into the Ocean because of the Fukushima Daiichi Nuclear Power Plant Disaster. J. Nucl. Sci. Technol. 48, 1349–1356. doi: 10.1080/18811248.2011.9711826
Kumamoto Y., Aoyama M., Hamajima Y., Aono T., Kouketsu S., Murata A., et al. (2014). Southward spreading of the Fukushima-derived radiocesium across the Kuroshio Extension in the North Pacific. Sci. Rep. 4, 4276. doi: 10.1038/srep04276
Liu G. S. (2015). Marine radiochemistry after the Fukushima Nuclear Power Plant accident. J. Nucl. Radiochem. Sci. 37, 341–354.
Liubartseva S., Coppini G., Lecci R., Clementi E. (2018). Tracking plastics in the Mediterranean: 2D Lagrangian model. Mar. pollut. Bull. 129, 151–162. doi: 10.1016/j.marpolbul.2018.02.019
Lu X., Hu S. J., Wang F., Hu D. X., Liu H. L., Diao X. Y., et al. (2022). Analysis of the dispersion trajectories of surface oceanic substances east of Fukushima based on drifting buoy observations. Ocean. Limnol. Sin. 53, 1027–1044.
Macdonald A. M., Yoshida S., Pike S. M., Buesseler K. O., Rypina I. I., Jayne S. R., et al. (2020). A Fukushima tracer perspective on four years of North Pacific mode water evolution. Deep Sea Res. Part I Oceanogr. Res. Pap. 166, 103379. doi: 10.1016/j.dsr.2020.103379
Men W., He J., Wang F., Wen Y., Li Y., Huang J., et al. (2015). Radioactive status of seawater in the northwest Pacific more than one year after the Fukushima nuclear accident. Sci. Rep. 5 (1), 7757. doi: 10.1038/srep07757
Nakano M., Povinec P. P. (2012). Long-term simulations of the 137Cs dispersion from the Fukushima accident in the world ocean. J. Environ. Radioact. 111, 109–115. doi: 10.1016/j.jenvrad.2011.12.001
Pattiaratchi C., van der Mheen M., Schlundt C., Narayanaswamy B. E., Sura A., Hajbane S., et al. (2022). Plastics in the Indian Ocean – sources, transport, distribution, and impacts. Ocean Sci. 18, 1–28. doi: 10.5194/os-18-1-2022
Qiu B. (1995). Variability and energetics of the Kuroshio extension and its recirculation gyre from the first two-year TOPEX data. J. Phys. Oceanogr. 25, 1827–1842. doi: 10.1175/1520-0485(1995)025<1827:VAEOTK>2.0.CO;2
Qiu B. (2000). Interannual variability of the Kuroshio extension system and its impact on the wintertime SST field. J. Phys. Oceanogr. 30, 1486–1502. doi: 10.1175/1520-0485(2000)030<1486:IVOTKE>2.0.CO;2
Qiu B., Chen S. (2010). Eddy-mean flow interaction in the decadally modulating Kuroshio Extension system. Deep Sea Res. Part II: Top. Stud. Oceanogr. 57, 1098–1110. doi: 10.1016/j.dsr2.2008.11.036
Qiu B., Miao W. (2000). Kuroshio path variations south of Japan: bimodality as a self-sustained internal oscillation. J. Phys. Oceanogr. 30, 2124–2137. doi: 10.1175/1520-0485(2000)030<2124:KPVSOJ>2.0.CO;2
Qu T., Mitsudera H., Qiu B. (2001). A climatological view of the Kuroshio/Oyashio system east of Japan*. J. Phys. Oceanogr. 31, 2575–2589. doi: 10.1175/1520-0485(2001)031<2575:ACVOTK>2.0.CO;2
van Sebille E., Aliani S., Law K. L., Maximenko N., Alsina J. M., Bagaev A., et al. (2020). The physical oceanography of the transport of floating marine debris. Environ. Res. Lett. 15, 023003. doi: 10.1088/1748-9326/ab6d7d
van Sebille E., Griffies S. M., Abernathey R., Adams T. P., Berloff P., Biastoch A., et al. (2018). Lagrangian ocean analysis: Fundamentals and practices. Ocean Modell. 121, 49–75. doi: 10.1016/j.ocemod.2017.11.008
Wang F., Men W., Yu T., Huang J., He J., Lin J. D., et al. (2022). Intrusion of Fukushima-derived radiocesium into the East China sea and the Northeast South China Sea in 2011–2015. Chemosphere 294, 133546. doi: 10.1016/j.chemosphere.2022.133546
Wang H., Wang Z., Zhu X., Wang D., Liu G. (2012). Numerical study and prediction of nuclear contaminant transport from Fukushima Daiichi nuclear power plant in the North Pacific Ocean. Chin. Sci. Bull. 57, 3518–3524. doi: 10.1007/s11434-012-5171-6
Yasuda I., Okuda K., Hirai M. (1992). Evolution of a Kuroshio warm-core ring—variability of the hydrographic structure. Deep Sea Res. Part A. Oceanogr. Res. Pap. 39, S131–S161. doi: 10.1016/S0198-0149(11)80009-9
Keywords: oceanic dispersion trajectory, Fukushima Daiichi Nuclear Power Plant, radioactive water, Kuroshio extension, Lagrangian analysis, Northwest Pacific Ocean
Citation: Liu Y, Zhou M, Zhou F, Meng Q, Ma X, Zhang Q and Ye R (2024) Southward key pathways of radioactive materials from the Fukushima Daiichi Nuclear Power Plant. Front. Mar. Sci. 11:1368674. doi: 10.3389/fmars.2024.1368674
Received: 11 January 2024; Accepted: 12 March 2024;
Published: 22 March 2024.
Edited by:
Francisco Machín, University of Las Palmas de Gran Canaria, SpainReviewed by:
Fenfen Wang, State Oceanic Administration, ChinaWu Men, Nanjing University of Information Science and Technology, China
Copyright © 2024 Liu, Zhou, Zhou, Meng, Ma, Zhang and Ye. This is an open-access article distributed under the terms of the Creative Commons Attribution License (CC BY). The use, distribution or reproduction in other forums is permitted, provided the original author(s) and the copyright owner(s) are credited and that the original publication in this journal is cited, in accordance with accepted academic practice. No use, distribution or reproduction is permitted which does not comply with these terms.
*Correspondence: Feng Zhou, emhvdWZlbmdAc2lvLm9yZy5jbg==
†These authors have contributed equally to this work and share first authorship