 Shanhong Ye
- School of Art and Design, Jiangsu Ocean University, Lianyungang, China
China’s rapid economic development has consumed a large amount of energy, causing serious environmental pollution problems and contributing to global warming. This paper calculates the carbon emissions of the fishery sector and uses Random Forest (RF) for the first time to analyze the influencing factors of future carbon emissions. The results of the study show that increasing carbon sinks dominate the reduction of carbon emissions in the fisheries sector. Carbon sinks will continue to dominate emission reductions in the fisheries sector if positive mitigation measures are taken. Continuing the current pattern of fisheries development, the fishery population has a significant impact on future carbon emissions. Per capita incomes under a crude economic model will inhibit carbon emission reductions. The research results can provide guidance for the development of fishery low carbon economy and the formulation of emission reduction policies.
1 Introduction
Global warming is one of the major issues of global sustainable development and a serious challenge that humanity must face together. Global warming has led to rising sea levels, an increase in extreme weather events and the destruction of natural ecosystems, all of which pose serious threats to the survival and development of humankind (Banfi and De Michele, 2022; Smiley et al., 2022). China has pledged to achieve carbon peaking and to reduce carbon emissions per unit of gross domestic product by 65 per cent from 2005 levels by 2030 (Zhang et al., 2022). Controlling greenhouse gas emissions and curbing the greenhouse effect are both a prerequisite for the sustainable development of human society and a guarantee for the continued enhancement of human productivity (Hu et al., 2022; Zheng et al., 2022).
China is making efforts to regulate carbon emissions from industry, agriculture and transportation, with marine fisheries being an important part of the agricultural sector. Carbon emissions from the fisheries sector account for a large share of carbon emissions from the agricultural sector. Marine fisheries have the dual characteristics of carbon source and sink (Li et al., 2023). The annual carbon sequestration by China’s marine fisheries and aquaculture accounts for about 10 per cent of China’s total carbon emission reductions (Qisheng and Hui, 2016). Marine carbon sink fisheries play an active role in accounting for marine carbon sinks and in addressing climate change (Vondolia et al., 2020). The rapid development of China’s fisheries industry has brought considerable economic benefits to the coastal areas while at the same time generating large amounts of carbon emissions. For example, the large amount of energy consumed in the fishing process.
The current research on carbon emissions from China’s marine fisheries mainly focuses on accounting, spatial and temporal changes, and analysis of influencing factors. Gao et al (Li et al., 2023). analyzed the spatial-temporal variation characteristics of marine fishery carbon emission efficiency based on a violin plot and standard deviation ellipse. The results showed that the spatial distribution center of carbon emission efficiency mainly moved northward before 2014 and southward after 2014, and the spatial distribution range showed a concentrated trend. Li et al. (2022) accounted for China’s fishery carbon emissions, carbon sinks and net carbon emissions, and used logarithmic mean decomposition index (LMDI) to analyze the impact of net carbon emissions, and it was found that carbon intensity and industrial structure were the main influencing factors. Some studies have suggested that the development of the marine fishery economy and trade have a positive driving effect on carbon emissions, the expansion of the tertiary industry does not decrease carbon emissions (Zhang et al., 2023). Guan et al. (2022) also used LMDI to analyze the factors affecting carbon emissions from China’s marine fisheries, and the results showed that population (the number of people engaged in the fishery) is an important inhibitory factor for the net carbon emissions of the offshore fishing industry in most coastal provinces.
Predicting carbon emissions based on influencing factors is also a hot research topic in the field of carbon emissions, but there is less existing literature on predicting carbon emissions from China’s fisheries industry (Hou et al., 2022; Pu et al., 2022; Liu et al., 2023). Chen et al. (2022) used a system dynamics model and set up five scenarios to predict carbon emissions from China’s marine fisheries. The five scenarios are basic scenario, rapid economic growth scenario, ocean carbon sinks increased scenario, energy reduction scenario and integrated regulation scenario. The results show that rapid economic development has a significant effect on the increase of marine fisheries carbon emissions, while the adjustment of energy and industrial structure helps to control marine fisheries carbon emissions. Wang et al (Wang and Feng, 2023). also illustrated that rapid economic growth significantly affects the increase of carbon emissions, while technological progress can effectively reduce carbon emissions. Existing predictions of carbon emissions from the Chinese fishery industry mostly use traditional regression methods, which have limitations. The parameters of the prediction model are based on the fitting of historical data, and different historical data and socio-economic parameter settings will have a greater impact on the future prediction results, so the use of econometric methods for carbon emission prediction has a certain degree of uncertainty. Carbon emissions data are nonlinear, and traditional linear regression methods are difficult to achieve high accuracy (Jiang et al., 2022; Han et al., 2023; Zhao et al., 2023). Machine learning outperforms traditional regression methods for many problems with high predictive accuracy and robustness (Dang et al., 2022; Zhao et al., 2022b; Zhao et al., 2022a; Zhao et al., 2023). Chen et al (Chen et al., 2023). used the support vector regression model to establish an electricity demand forecasting model. The results show that the support vector regression model has high accuracy in forecasting demand.
In general, Existing studies of carbon emissions from marine fisheries mostly use traditional regression models, which have limited accuracy. The application of machine learning algorithms in predicting carbon emissions in marine fisheries is worth exploring. Moreover, there has been a lack of exploration in past research regarding the factors influencing carbon emissions in marine fisheries from a future perspective. The main contributions and innovations of this study include the following. This paper evaluates the carbon emissions from China’s marine fisheries based on the data related to China’s marine fisheries economy from 2006 to 2020. Then, a prediction model of China’s marine fishery carbon emissions was established using the novel machine learning models, and China’s future marine fishery carbon emissions were predicted by setting up different development scenarios. Finally, the factors influencing China’s marine fishery carbon emissions were analyzed.
2 Methodology
2.1 Carbon emissions accounting
Marine fisheries carbon emissions are equal to marine fisheries carbon sources minus marine fisheries carbon sinks :
Marine fisheries production activities involve energy consumption that generates carbon emissions. The formula for is as follows:
is the carbon emissions from energy consumption in the operation of fishing vessels. and are carbon emissions from seafood processing and mariculture.
The formula for calculating carbon sinks is as follows:
is the amount of carbon sequestered by shellfish, which consists mainly of oysters, mussels, scallops, clams, and razor clams. is the amount of carbon sequestered by algae, mainly containing kelp, wakame, nori, edelweiss, and lambda.
2.2 Bidirectional gated recurrent unit
The bidirectional gated recurrent unit (BiGRU) adds a reverse layer to the forward layer of gated recurrent unit (GRU), and Figure 1 illustrates the structure of the BiGRU (Gong and Li, 2023).
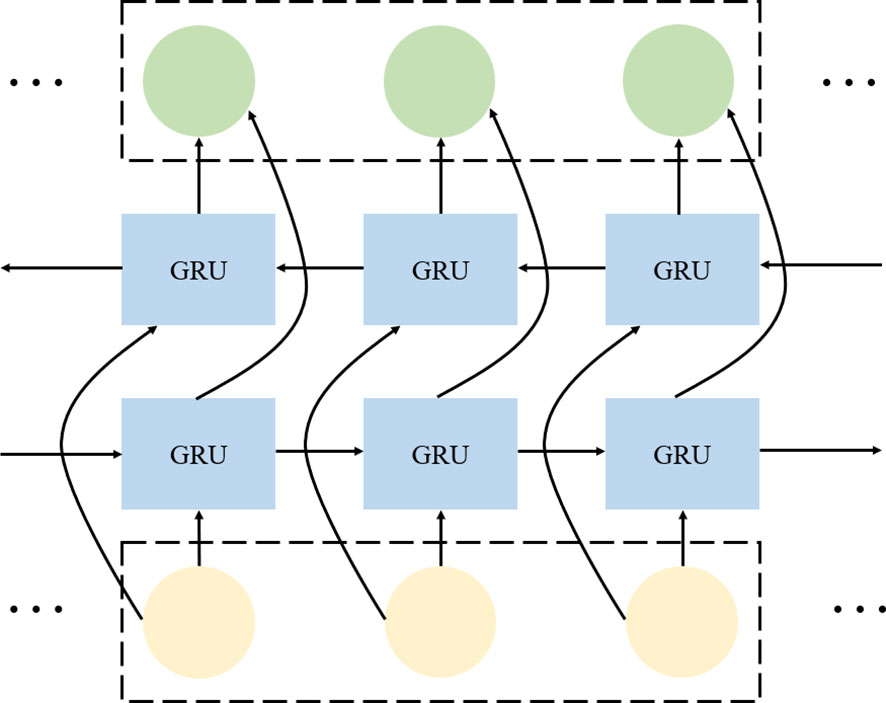
Figure 1 The structure of the BiGRU.
Unlike ordinary GRU, BiGRU use bi-directional information when processing sequence data, for both forward and reverse of the sequence. Each cell in BiGRU contains two GRU, a forward GRU and a reverse GRU, which process forward and reverse information, respectively (Wang et al., 2021). Each GRU unit has a hidden state, and the information of the hidden state can be passed from the front unit to the back unit or from the back unit to the front unit. Finally, at the output layer of BiGRU, the hidden states of forward and reverse GRU are merged to obtain a complete sequence representation. Overall, BiGRU is a model that can capture both forward and backward direction information of sequence data, which is more efficient and flexible than ordinary recurrent neural network (RNN) and GRU (Ahmed et al., 2024). By splicing forward hidden layer vector and backward hidden layer vector , the contextual information can be fully considered to improve the effectiveness of time series prediction (Liu et al., 2023). The formula is as follows:
where is the forward-propagating GRU hidden layer weight parameter at moment , is the back-propagating GRU hidden layer weight parameter at moment , and is the bias term.
2.3 Particle swarm optimization
Particle swarm algorithm (PSO) is an algorithm that simulates the feeding behavior of birds (Marini and Walczak, 2015). Particle swarm algorithms have a wide range of applications in optimization problems in areas such as neural network training, combinatorial optimization, image processing and signal processing (Yuan et al., 2019; Huo et al., 2023; Na et al., 2023). The algorithm proposes the concept of particles to simulate the birds in a flock, and the particles learn and exchange information among themselves to achieve the global optimal search (Zhang et al., 2019). All the particles in the PSO algorithm have fitness values and velocities, and all the particles know their optimal position and current position. In addition, all particles also currently know the optimal position of the entire population. During the optimization process, all particles follow the best particle in the space for searching. is the position of the particle and is the velocity. In the next iteration, the velocity and position of the solution can be obtained by the following equation.
where is the inertia factor. and denote the acceleration factor, also known as the learning factor or cognitive factor. and are random numbers in the interval 0 to 1. is the number of iterations. and are the minimum and maximum particle velocities, which are used to control the magnitude of the particle’s velocity in the search space.
2.4 PSO-BiGRU
To improve the prediction accuracy of the BiGRU model, the PSO algorithm is used to find the optimal number of neurons, iterations and learning rate of BiGRU model. Figure 2 shows the process framework of the PSO-BiGRU carbon emission prediction model.
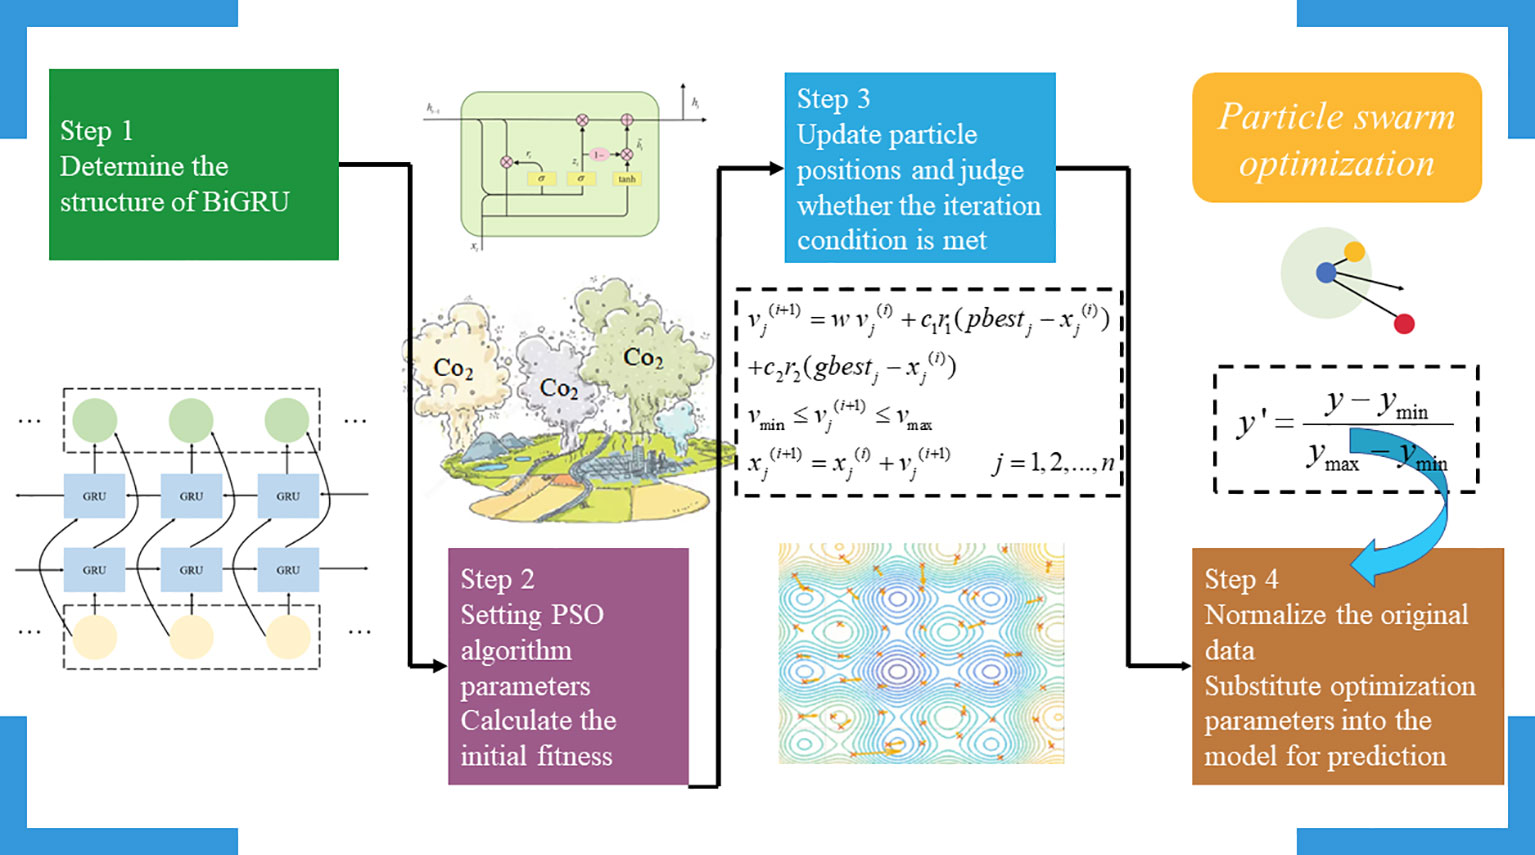
Figure 2 The flowchart of PSO-BiGRU.
The specific steps are as follows:
Step 1: Determine the structure of GRU and BiGRU.
Step 2: Set the initial value of the algorithm of PSO algorithm, and take the number of neurons of GRU and BiGRU, the number of iterations and the learning rate as the three dimensions of the particle swarm algorithm. Set the upper and lower limits of each parameter, use the MSE in the training process as the fitness function, find the fitness value of each initial particle, and determine the initial local optimal value and global optimal value.
Step 3: Update the velocity and position of the particles according to the velocity and position update formula of the PSO algorithm, and the optimal position of the particle is the optimal value of the number of GRU and BiGRU neurons, iteration number and learning rate that we need to find. Update the global and local optimal values of the particle swarm, determine whether the iteration conditions are met, and if so, output the optimal position of the particle.
Step 4: The optimal hyperparameters are output and substituted into the model for prediction.
2.5 Random forest
Random forest (RF) is a commonly used ensemble learning method that consists of multiple decision trees. RF is a widely used machine learning algorithm for classification and regression problems (Chen et al., 2023; Fathololoumi et al., 2023; Zhao et al., 2023). Random forests can also calculate the importance values of features, so they can be used to analyze the importance of influencing factors (Chang et al., 2023). Its basic idea is to randomly disrupt the value of a feature after model training, and then evaluate the importance of the feature by comparing the change in model performance before and after the addition of noise. When using the RF algorithm to assess importance, the out-of-bag data is used to calculate the model’s out-of-bag error , then the order of an influence in the out-of-bag data is randomly altered, and the transformed out-of-bag data is used to calculate the out-of-bag error . The importance value of any influence can then be calculated according to the following formula:
where is the number of decision trees.
2.6 Data sources
All data used in this study come from the China Fisheries Statistical Yearbook, the China Marine Statistical Yearbook, and provincial and municipal statistical yearbooks. There are some missing data in the Statistical Yearbook, which is filled in by smoothing method. In consideration of the missing statistics for Taiwan, Hong Kong and Macao, they were not included in the study. The economic data in the analysis of influencing factors are from the National Bureau of Statistics of China.
3 Results and discussion
3.1 Characterization of carbon emission changes in marine fisheries
Carbon emissions from China’s marine fisheries were calculated according to the formula. The results are shown in Figure 3.
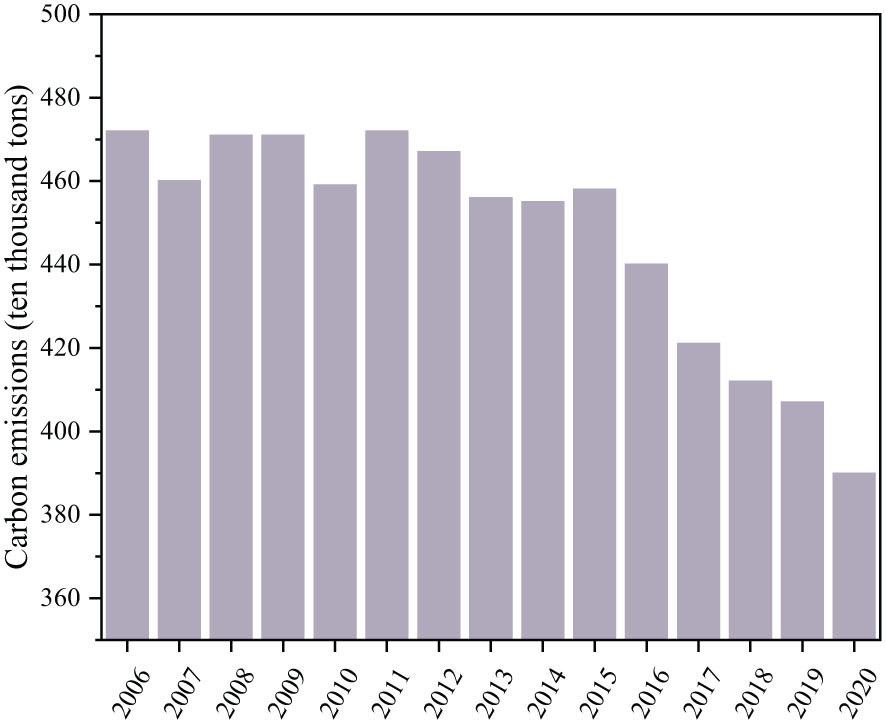
Figure 3 Carbon emissions from marine fisheries.
The overall carbon emissions from China’s marine fisheries show a downward trend during the study period. Carbon emissions from China’s marine fisheries decreased from 472 ten thousand tons in 2006 to 390 ten thousand tons in 2020, a decrease of 17 per cent. During the period from 2006 to 2015, carbon emissions from China’s marine fisheries showed a fluctuating trend, with carbon emissions varying within the range of 455 ten thousand to 472 ten thousand. Carbon emissions from China’s marine fisheries declined rapidly after 2015, and carbon emissions in 2020 have fallen by 14% compared to 2015. The rapid drop in carbon emissions is inextricably linked to China’s proposed fisheries development plan. In 2016, China proposed policies on the transformation and upgrading of the aquaculture industry, control of the fishing industry, vigorous conservation of aquatic biological resources and the standardized and orderly development of offshore fisheries. These policies reduce energy consumption in the process of fishing activities while increasing the carbon sink of marine fisheries, which are of great significance to the carbon emission reduction of marine fisheries in 2016-2020.
3.2 PSO-BiGRU prediction results
Existing literature demonstrates that carbon sinks, per capita income of fishers and fishing population all have an impact on carbon emissions from marine fisheries (Gao et al., 2022). Therefore, we chose carbon sinks, per capita income of fishers and fishery population as the input variables of the PSO-BiGRU model, and marine fishery carbon emissions as the output results of the PSO- BiGRU model. Due to the small amount of data on carbon emissions from marine fisheries, we choose the samples from 2006-2017 as the training set and the samples from 2018-2020 as the test set. Learning rate is a very important hyperparameter in machine learning, which determines the step size of the model to update the parameters. If the learning rate is too large, the model tends to oscillate and fails to give correct results. The number of neurons determines the capacity of the model. If the number of neurons is too small, it will lead to underfitting. On the contrary, if too many neurons are set up, they will be overfitted, leading to poorer predictions on new data. The number of iterations determines how often the model can see the data. If the number of iterations is too low, the model cannot fully learn the data. Conversely, if there are too many iterations, overfitting may result. PSO is used to find the optimal parameters of the BiGRU model, and the parameter optimization search range is shown in Table 1.
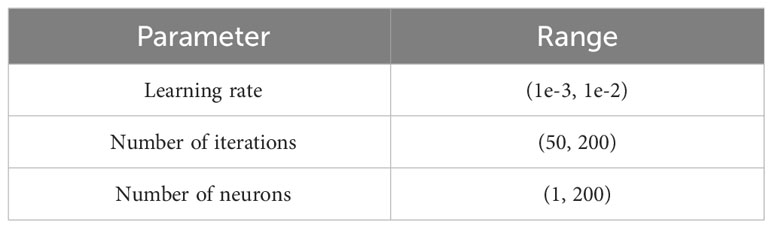
Table 1 Parameter optimization range of BiGRU.
Substitute the sample data into the PSO-BiGRU model, the results obtained are shown in Figure 4.
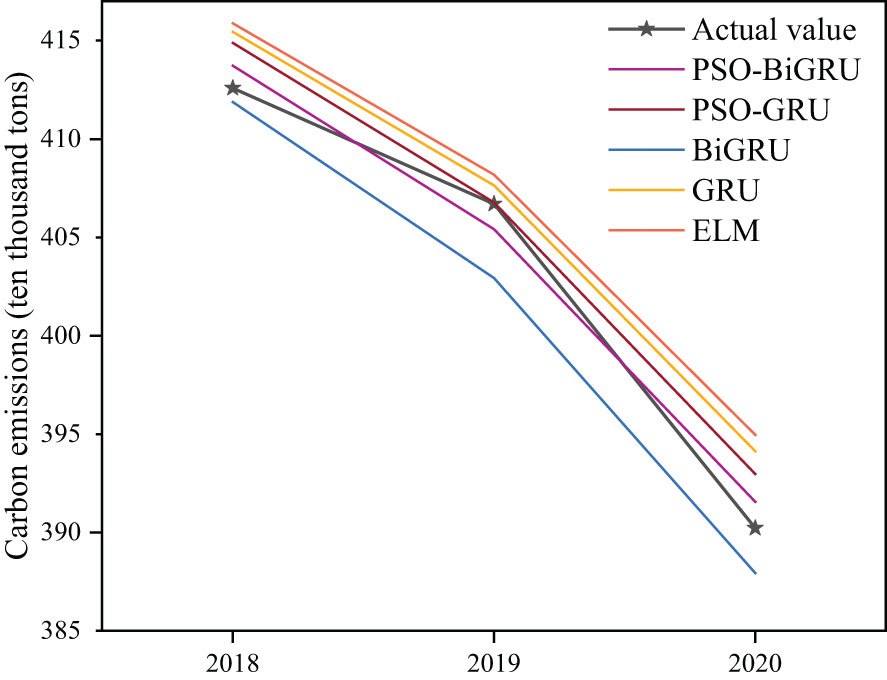
Figure 4 Comparison of model prediction result.
In order to verify the prediction accuracy of PSO-BiGRU model, PSO optimized GRU model (PSO-GRU), BiGRU model, GRU model and extreme learning machine (ELM) model are also added as comparison models in the study (Marjanovic et al., 2016; Li et al., 2018; Liu et al., 2023). As shown in the Figure 4, PSO-BiGRU is able to accurately simulate the complex relationship between carbon emissions from China’s marine fisheries and various influencing factors, and the deviation of the predicted value from the actual value is small, and the predicted value is very close to the actual value. The PSO-GRU model prediction value is very close to the actual values in 2019, but the prediction values in 2018 and 2020 are significantly worse than PSO-BiGRU. The BiGRU and GRU models can also simulate the carbon emissions of China’s marine fisheries, but the prediction results are slightly worse than those of the PSO-BiGRU and PSO-GRU models. ELM’s predicted value deviates the most from the actual value. The prediction accuracy of the ELM model is the worst among the five models.
In order to intuitively analyze the prediction effect of different machine learning models, from a quantitative perspective, we choose Mean Absolute Error (MAE), Mean Absolute Percentage Error (MAPE), and Root Mean Square Error (RMSE) as the evaluation indexes of the models. Evaluation indexes are calculated based on the prediction results of different machine learning prediction models, and the evaluation indexes are compared to measure the prediction model strengths and weaknesses. The formula for calculating the evaluation indexes are as follows:
In the formulas for MAE, MAPE and RMSE, and represent actual and prediction values of carbon emissions. The calculation results are shown in Table 2. The smaller the values of MAE, MAPE and RMSE, the smaller the gap between the predicted and actual values, and the better the prediction accuracy of the model.
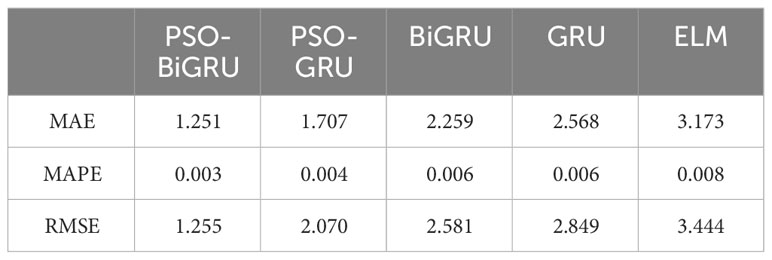
Table 2 Calculation results of model evaluation indexes.
According to the MAE, and the prediction accuracy ranked from highest to lowest is: PSO-BiGRU > PSO-GRU > BiGRU > GRU > ELM. The PSO-BiGRU model has the smallest MAE of 1.251.The model prediction error of PSO-BiGRU is reduced by 26.71%, 44.62%, 51.29%, and 60.57% compared to PSO-GRU, BiGRU, GRU, and ELM models, respectively.
According to the MAPE, and the prediction accuracy is ranked from highest to lowest as PSO-BiGRU > PSO-GRU > BiGRU > GRU > ELM. the PSO-BiGRU model has the smallest MAPE of 0.003. The ELM model has the largest MAPE of 0.008, which indicates that the prediction of the ELM model is the worst.
According to the RMSE, and the prediction accuracy ranked from highest to lowest is PSO-BiGRU > PSO-GRU > BiGRU > GRU > ELM. The PSO-BiGRU model has the smallest RMSE, which is 1.255.The model prediction error of PSO-BiGRU is compared to the PSO-GRU, BiGRU, GRU, and ELM models by 39.37%, 51.53%, 56.09%, and 63.68%, respectively. From the three evaluation indexes, the ELM model has the worst prediction and the best model is the PSO-BiGRU model.
3.3 Scenario prediction results
The use of scenario analysis requires the consideration of a wide range of factors and the design of a reasonable scenario (Li et al., 2017; Feng et al., 2023). Since different analyses of objective reality may lead to different development scenarios, this may result in different scenario prediction results (Sun et al., 2021). Therefore, objective realities should be fully and adequately considered in the study to ensure that the scenarios designed are scientific and reasonable. We selected carbon sinks, per capita income of fishers and fishery population as indicators for constructing scenarios. Based on these three indicators, we can construct possible development scenarios for China’s marine fisheries during the period 2021-2030. Taking into account the current status of China’s fisheries development, we designed three possible scenario models for the future: scenario 1, scenario 2, and scenario 3. The design of the scenario 2 is based on the Chinese government planning and the current status of fisheries development in China. The scenario 3 assumes that marine fisheries can reach a state of harmonious economic and environmental development in the future, in which the influencing factors that promote the growth of carbon emissions develop at a slower rate, while the influencing factors that inhibit the growth of carbon emissions develop at a faster rate. The scenario 1 is based on the scenario 2, assuming that China’s marine fisheries have not taken more mandatory measures for energy conservation and emission reduction, and setting the parameters of the influencing factors that promote carbon emissions from marine fisheries to be enhanced, and the parameters of the influencing factors that inhibit carbon emissions from marine fisheries to be weakened under scenario 1. The growth rates of the influencing factors under different scenarios are set as follows:
(1) Growth rate settings for carbon sinks
From 2006 to 2020, China’s marine fisheries carbon sinks show an increasing trend, from 135 ten thousand in 2006 to 212 ten thousand in 2020, with an annual growth rate of 3.3%. Based on the growth rate of China’s carbon sinks from 2006 to 2020, the growth rate of carbon sinks from 2020 to 2030 is set to be 3.3% in the scenario 2, 6% in the scenario 3 and 1.5% in the scenario 1.
(2) Setting the growth rate of per capita income of fishers
China’s National Fisheries Development Plan for the 14th Five-Year Plan envisions a per capita income target for fishers, aiming to achieve 241.1 million yuan by 2025, with an annual growth rate set at 2.4%. Based on the above planning, a per capita income growth rate of 2.4% is set for 2021-2030 in the scenario 2, 1.5% in the scenario 3 and 5% in the scenario 1.
(3) Setting the growth rate of the fishery population
The fishery population shows a decreasing trend from 2006 to 2020. Decreasing fishery population will lead to a decrease in waste and pollutants generated from fishery activities, such as fishing nets, plastic waste, etc., which is significant for increasing the sustainability of fishery activities. China is also actively introducing more advanced and sustainable fishing technologies and improving catch efficiency, all of which have led to a reduction in personnel while allowing for significant reductions in carbon emissions. Based on the above analysis, the fishery population growth rate is set at -2.4% for the scenario 2, -3% for the scenario 3 and -1% for the scenario 1 for the 2021-2030 period. The scenario 2 growth rate of the fisheries population is calculated based on the observed rate of change in the fisheries population from 2006 to 2020. After setting the growth rates of influencing factors under different scenarios, the results of carbon emission prediction of China’s marine fisheries from 2021 to 2030 using the PSO-BiGRU model are shown in Figure 5.
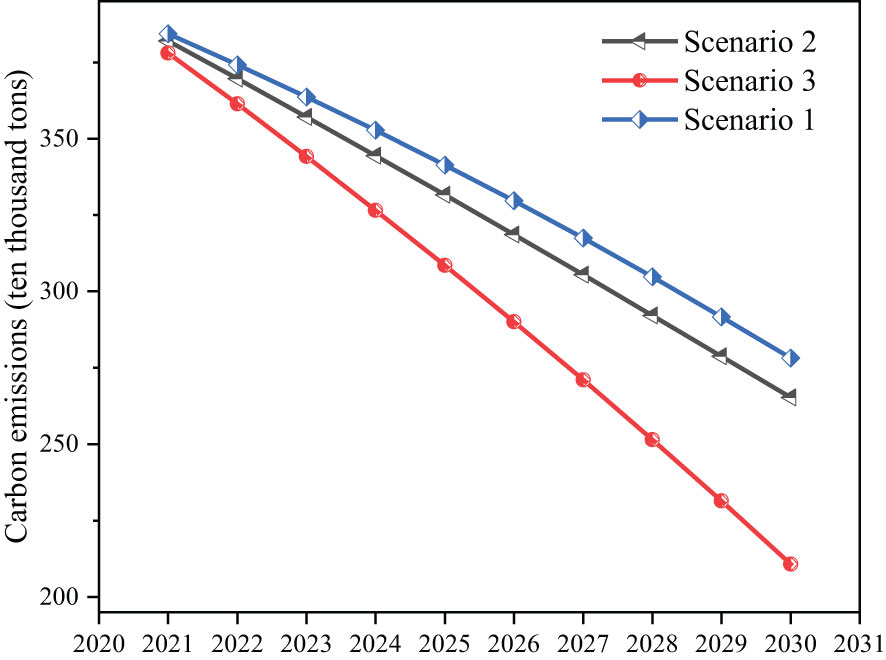
Figure 5 Results of carbon emission prediction for China’s marine fisheries from 2021 to 2030.
From Figure 5, it can be seen that carbon emissions from marine fisheries under different scenarios show a decreasing trend, from 382 ten thousand tons to 265 ten thousand tons under the scenario 2, from 378 ten thousand tons to 211 ten thousand tons under the scenario 3, and from 384 ten thousand tons to 278 ten thousand tons under the scenario 1. Comparative analysis shows that the growth rate of carbon emissions under the scenario 3 is much smaller than that under the scenario 1. The cumulative carbon emissions under the scenario 2, scenario 3 and scenario 1 are 3245 ten thousand tons, 2973 ten thousand tons and 3338 ten thousand tons, respectively. In order to achieve the goal of carbon neutrality, it is necessary to increase the energy conservation and emission reduction policy and technical support for the marine fisheries industry, to strengthen the application of clean energy, to improve the efficiency of energy use, and to promote the low carbon production methods. At the same time, the government and enterprises also need to further strengthen their sense of autonomy in carbon emission reduction and explore a low carbonization path that suits the actual situation of marine fisheries. This requires innovation and exploration at multiple levels, including policy, technology and market, so as to provide more comprehensive support for achieving carbon neutrality in marine fisheries.
3.4 Analysis of factors affecting carbon emissions
By calculating the RF importance values of different influencing factors, the impact of different factors on marine fisheries carbon emissions can be analyzed according to their importance values. By substituting the data of marine fishery carbon emission and influencing factors from 2006 to 2020 into the RF algorithm, the obtained importance values are shown in Figure 6.
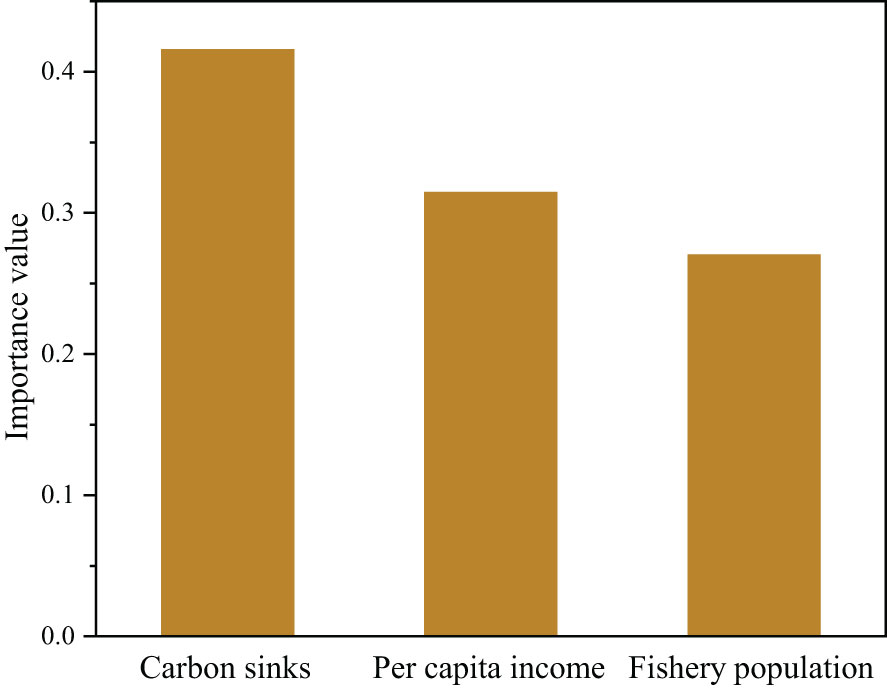
Figure 6 Importance values of factors influencing carbon emissions in 2006-2020.
Based on the prediction results of China’s marine fisheries carbon emissions from 2021-2030, we also used the RF algorithm to calculate the importance values of the factors influencing carbon emissions from 2021-2030 under different scenarios, and the results are shown in Figure 7.
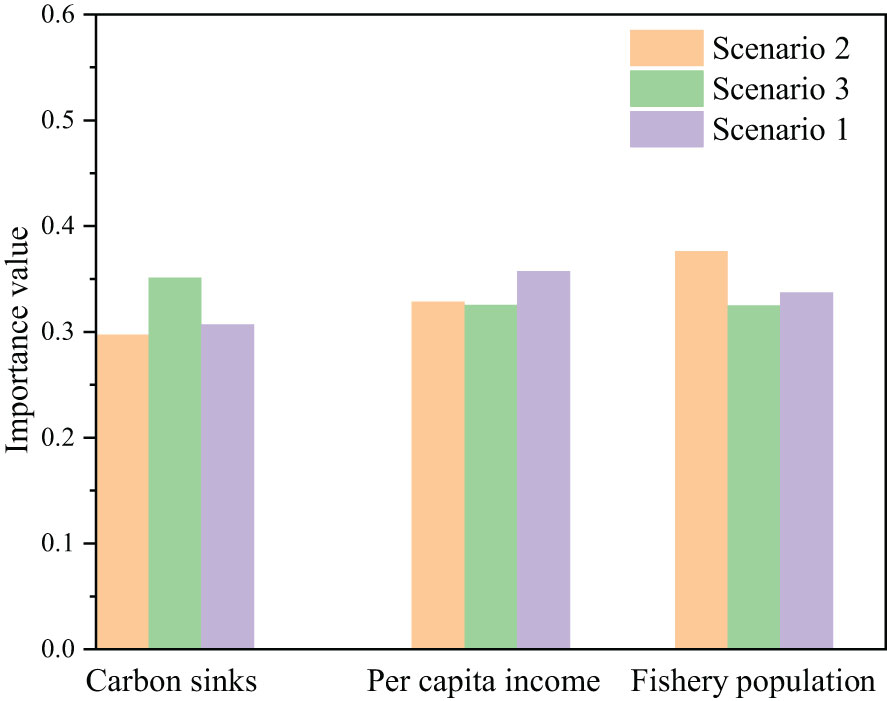
Figure 7 Importance values of factors influencing carbon emissions in 2021-2030.
As shown in Figures 6, 7, the main factor affecting carbon emissions in 2006-2020 is carbon sinks. It shows that the main reason for the decrease in carbon emissions in 2006-2020 is the increasing amount of carbon sinks. In 2021-2030, different scenarios have different influences that dominate changes in carbon emissions. The dominant factor in carbon emissions in the scenario 2 is the fishery population. This may be due to the fact that the number of fishing personnel is not strictly controlled in the scenario 2, which leads to overfishing. A large amount of fuel is used in fishing activities, especially on fishing vessels that are far away from ports. These vessels usually use only fuel oil or diesel and less clean energy, resulting in significant carbon emissions. The dominant factor of carbon emissions in the scenario 3 is carbon sinks. Increasing carbon sinks does not slow the growth of carbon emissions, but can also help to improve various ecosystems. This is because an increase in the ocean carbon sink means a greater number or variety of marine organisms. The Chinese Government should take timely measures to increase carbon sinks. The dominant factor in carbon emissions under the scenario 1 is per capita income. Carbon emissions are greatest under the scenario 1, indicating that the crude model of focusing only on economic growth under the scenario 1 is not beneficial to mitigating carbon emissions.
4 Conclusions and policy recommendations
4.1 Conclusions
In this paper, the carbon emissions from marine fisheries in China from 2006 to 2020 were accounted for. A marine fishery carbon emission prediction model was developed using PSO optimized BiGRU, and the prediction accuracy of other machine learning prediction models was compared. Then three scenarios were set up to predict the future carbon emissions of China’s marine fisheries. Finally, RF was used to analyze the past and present carbon emission impact factors of China’s marine fisheries, which is a novel attempt to analyze the carbon emission impact from the future perspective. The main conclusions are as follows:
Carbon emissions from China’s marine fisheries have shown a decreasing trend from 472 ten thousand tons in 2006 to 390 ten thousand tons in 2020, with carbon emissions entering a period of rapid reduction after 2015.
PSO-BiGRU model had the least error in predicting carbon emissions from marine fisheries. The MAE of the model was reduced by 26.71%, 44.62%, 51.29% and 60.57% compared to PSO-GRU, BiGRU, GRU and ELM.
Carbon emissions from marine fisheries showed a downward trend under different scenarios, and the rate of reduction of carbon emissions under the scenario 3 was significantly greater than that under the scenario 2 and scenario 1. It decreases from 382 ten thousand tons to 265 ten thousand tons under the scenario 2, from 378 ten thousand tons to 211 ten thousand tons under the scenario 3, and from 384 ten thousand tons to 278 ten thousand tons under the scenario 1.
The dominant factor in carbon emission reductions in 2006-2020 was carbon sinks. In 2021-2030, the dominant factor in carbon emissions is fishery population in the scenario 2, carbon sinks in the scenario 3, and per capita income in the scenario 1.
4.2 Policy implications
Considering the impact of population on carbon emissions from marine fisheries under the scenario 2, the Government of China should deepen its efforts to combat activities such as illegal fishing, and actively mitigate the impact of population on carbon emissions.
In order to address the impact of rapid economic development on carbon emissions from marine fisheries, the Chinese Government should also actively increase its investment in science and technology, actively develop ecological and energy-saving fishing vessels, strictly control the intensity of marine fishing, optimize fishing work, implement the upgrading of marine fishing vessels, and promote mechanized fishing. In addition, activities for the ecological protection of fishery resources and waters should be actively carried out and monitoring efforts should be strengthened. It should further improve the compensation mechanism for the ecological protection of fishery resources, actively respond to accidents of ecological damage in waters, and promote the increase of carbon sinks through strong measures.
Data availability statement
The original contributions presented in the study are included in the article/supplementary material. Further inquiries can be directed to the corresponding author.
Author contributions
SY: Writing – original draft, Writing – review & editing.
Funding
The author(s) declare financial support was received for the research, authorship, and/or publication of this article. This work was supported by the 2022 Social Science Fund General Project (2022SJYB1854) and 2023 Philosophy, Social Science Research Program for Universities in Jiangsu Province (2023SJYB1828), Commissioned Doctoral Research Fund Project of Jiangsu Ocean University and Jiangsu Graduate Student Research and Innovation Program.
Conflict of interest
The author declares that the research was conducted in the absence of any commercial or financial relationships that could be construed as a potential conflict of interest.
Publisher’s note
All claims expressed in this article are solely those of the authors and do not necessarily represent those of their affiliated organizations, or those of the publisher, the editors and the reviewers. Any product that may be evaluated in this article, or claim that may be made by its manufacturer, is not guaranteed or endorsed by the publisher.
References
Ahmed A. A. M., Jui S. J. J., Sharma E., Ahmed M. H., Raj N., Bose A. (2024). An advanced deep learning predictive model for air quality index forecasting with remote satellite-derived hydro-climatological variables. Sci. total Environ. 906, 167234. doi: 10.1016/j.scitotenv.2023.167234
Banfi F., De Michele C. (2022). Compound flood hazard at Lake Como, Italy, is driven by temporal clustering of rainfall events. Commun. Earth Environ. 3, 234. doi: 10.1038/s43247-022-00557-9
Chang Z. Y., Jiao Y. M., Wang X. J. (2023). Influencing the variable selection and prediction of carbon emissions in China. Sustainability 15. doi: 10.3390/su151813848
Chen X., Di Q., Hou Z., Yu Z. (2022). Measurement of carbon emissions from marine fisheries and system dynamics simulation analysis: China’s northern marine economic zone case. Mar. Policy 145, 105279. doi: 10.1016/j.marpol.2022.105279
Chen G., Hu Q. C., Wang J., Wang X., Zhu Y. Y. (2023). Machine-learning-based electric power forecasting. Sustainability 15. doi: 10.3390/su151411299
Chen T. M., Wu J. Q., Lin J. T. (2023). Classification of 3D casting models for product lifecycle management and corporate sustainability. Sustainability 15. doi: 10.3390/su151712683
Dang C., Choi T., Lee S., Lee S., Alam M., Park M., et al. (2022). Machine learning-based live weight estimation for Hanwoo Cow. Sustainability 14. doi: 10.3390/su141912661
Fathololoumi S., Vaezi A. R., Alavipanah S. K., Ghorbani A., Firozjaei M. K., Biswas A. (2023). Improving runoff prediction accuracy in a mountainous watershed using a remote sensing-based approach. Sustainability 15. doi: 10.3390/su151712754
Feng D. W., Xu W. C., Gao X. Y., Yang Y., Feng S. R., Yang X. H., et al. (2023). Carbon emission prediction and the reduction pathway in industrial parks: A scenario analysis based on the integration of the LEAP model with LMDI decomposition. Energies 16. doi: 10.3390/en16217356
Gao Y., Fu Z., Yang J., Yu M., Wang W. (2022). Spatial–temporal differentiation and influencing factors of marine fishery carbon emission efficiency in China. Environment Dev. Sustainability, 1–26. doi: 10.1007/s10668-022-02716-6
Gong R. X., Li X. L. A. (2023). Short-term load forecasting model based on crisscross grey wolf optimizer and dual-stage attention mechanism. Energies 16. doi: 10.3390/en16062878
Guan H., Chen Y., Zhao A. (2022). Carbon neutrality assessment and driving factor analysis of China’s offshore fishing industry. Water 14, 4112. doi: 10.3390/w14244112
Han Z. H., Cui B. W., Xu L. W., Wang J. W., Guo Z. Q. (2023). Coupling LSTM and CNN neural networks for accurate carbon emission prediction in 30 Chinese provinces. Sustainability 15. doi: 10.3390/su151813934
Hou Y. L., Wang Q. W., Tan T. (2022). Prediction of carbon dioxide emissions in China using shallow learning with cross validation. Energies 15. doi: 10.3390/en15228642
Hu Y., Chi Y. Y., Zhou W. B., Wang Z. Z., Yuan Y. K., Li R. Y. (2022). Research on energy structure optimization and carbon emission reduction path in Beijing under the dual carbon target. Energies 15. doi: 10.3390/en15165954
Huo Z. G., Zha X. T., Lu M. Y., Ma T. Q., Lu Z. C. (2023). Prediction of carbon emission of the transportation sector in Jiangsu province-regression prediction model based on GA-SVM. Sustainability 15. doi: 10.3390/su15043631
Jiang Z., Zhang S. H., Li W. (2022). Exploration of urban emission mitigation pathway under the carbon neutrality target: A case study of Beijing, China. Sustainability 14. doi: 10.3390/su142114016
Li G. L., Tan C. L., Zhang W. K., Zheng W. L., Liu Y. (2023). Carbon emission efficiency, technological progress, and fishery scale expansion: evidence from marine fishery in China. Sustainability 15. doi: 10.3390/su15086331
Li M. L., Wang W., De G., Ji X. H., Tan Z. F. (2018). Forecasting carbon emissions related to energy consumption in Beijing-Tianjin-Hebei region based on grey prediction theory and extreme learning machine optimized by support vector machine algorithm. Energies 11. doi: 10.3390/en11092475
Li J. Y., Zhang B. H., Shi J. F. (2017). Combining a genetic algorithm and support vector machine to study the factors influencing CO2 emissions in Beijing with scenario analysis. Energies 10. doi: 10.3390/en10101520
Li Z., Zhang L., Wang W., Ma W. (2022). Assessment of carbon emission and carbon sink capacity of China’s marine fishery under carbon neutrality target. J. Mar. Sci. Eng. 10, 1179. doi: 10.3390/jmse10091179
Liu B., Chang H. D., Li Y., Zhao Y. P. (2023). Carbon emissions predicting and decoupling analysis based on the PSO-ELM combined prediction model: evidence from Chongqing Municipality, China. Environ. Sci. pollut. Res. 30, 78849–78864. doi: 10.1007/s11356-023-28022-w
Liu P., Liu C., Wang Z. P., Wang Q. S., Han J. L., Zhou Y. P. A. (2023). Data-driven comprehensive battery SOH evaluation and prediction method based on improved CRITIC-GRA and Att-BiGRU. Sustainability 15. doi: 10.3390/su152015084
Liu X. D., Wang X. Q., Meng X. R. (2023). Carbon emission scenario prediction and peak path selection in China. Energies 16. doi: 10.3390/en16052276
Marini F., Walczak B. (2015). Particle swarm optimization (PSO). A tutorial. Chemometrics Intelligent Lab. Syst. 149, 153–165. doi: 10.1016/j.chemolab.2015.08.020
Marjanovic V., Milovancevic M., Mladenovic I. (2016). Prediction of GDP growth rate based on carbon dioxide (CO2) emissions. J. Co2 Utilization 16, 212–217. doi: 10.1016/j.jcou.2016.07.009
Na Y. W., Li Y. L., Chen D. Q., Yao Y. M., Li T. Y., Liu H. Y., et al. (2023). Optimal energy consumption path planning for unmanned aerial vehicles based on improved particle swarm optimization. Sustainability 15. doi: 10.3390/su151612101
Pu X. F., Yao J., Zheng R. Y. (2022). Forecast of energy consumption and carbon emissions in China's building sector to 2060. Energies 15. doi: 10.3390/en15144950
Qisheng T., Hui L. (2016). Strategy for carbon sink and its amplification in marine fisheries. Strategic Study Chin. Acad. Eng. 18, 68–73. doi: 10.15302/J-SSCAE-2016.03.011
Smiley K. T., Noy I., Wehner M. F., Frame D., Sampson C. C., Wing O. E. (2022). Social inequalities in climate change-attributed impacts of Hurricane Harvey. Nat. Commun. 13, 3418. doi: 10.1038/s41467-022-31056-2
Sun L. L., Cui H. J., Ge Q. S. (2021). Driving factors and future prediction of carbon emissions in the 'Belt and road initiative' Countries. Energies 14. doi: 10.3390/en14175455
Vondolia G. K., Chen W., Armstrong C. W., Norling M. D. (2020). Bioeconomic modelling of coastal cod and kelp forest interactions: Co-benefits of habitat services, fisheries and carbon sinks. Environ. resource economics 75, 25–48. doi: 10.1007/s10640-019-00387-y
Wang J. J., Cui Q., Sun X. (2021). A novel framework for carbon price prediction using comprehensive feature screening, bidirectional gate recurrent unit and Gaussian process regression. J. Cleaner Production. doi: 10.1016/j.jclepro.2021.128024
Wang G., Feng Y. (2023). Assessment and prediction of net carbon emission from fishery in Liaoning Province based on eco-economic system simulation. J. Cleaner Production 419, 138080. doi: 10.1016/j.jclepro.2023.138080
Yuan Y., Shao C. F., Cao Z. C., Chen W. X., Yin A. T., Yue H., et al. (2019). Urban rail transit passenger flow forecasting method based on the coupling of artificial fish swarm and improved particle swarm optimization algorithms. Sustainability 11. doi: 10.3390/su11247230
Zhang M. W., Gao F. F., Huang B., Yin B. (2022). Provincial carbon emission allocation and efficiency in China based on carbon peak targets. Energies 15. doi: 10.3390/en15239181
Zhang L. H., Ge R. L. T., Chai J. X. (2019). Prediction of China's energy consumption based on robust principal component analysis and PSO-LSSVM optimized by the Tabu search algorithm. Energies 12. doi: 10.3390/en12010196
Zhang X., Ye S., Shen M. (2023). Driving factors and spatiotemporal characteristics of CO2 emissions from marine fisheries in China: A commonly neglected carbon-intensive sector. Int. J. Environ. Res. Public Health 20, 883. doi: 10.3390/ijerph20010883
Zhao J., Kou L., Jiang Z., Lu N., Wang B., Li Q. (2022a). A novel evaluation model for carbon dioxide emission in the slurry shield tunnelling. Tunnelling Underground Space Technol. 130, 104757. doi: 10.1016/j.tust.2022.104757
Zhao J., Kou L., Wang H., He X., Xiong Z., Liu C., et al. (2022b). Carbon emission prediction model and analysis in the Yellow River basin based on a machine learning method. Sustainability 14, 6153. doi: 10.3390/su14106153
Zhao Y. H., Liu R. R., Liu Z. S., Liu L., Wang J. J., Liu W. X. A. (2023). Review of macroscopic carbon emission prediction model based on machine learning. Sustainability 15. doi: 10.3390/su15086876
Zhao L. H., Ren J. L., Zhang L., Zhao H. B. (2023). Quantitative analysis and prediction of academic performance of students using machine learning. Sustainability 15. doi: 10.3390/su151612531
Zhao Z. D., Zhao M. S., Lu H. L., Wang S. H., Lu Y. Y. (2023). Digital mapping of soil pH based on machine learning combined with feature selection methods in east China. Sustainability 15. doi: 10.3390/su151712874
Keywords: marine fishery, low carbon economy, energy consumption, carbon footprint, random forest
Citation: Ye S (2024) Analysis of influencing factors of carbon emissions from China’s marine fishery energy consumption under different development scenarios. Front. Mar. Sci. 11:1377215. doi: 10.3389/fmars.2024.1377215
Received: 26 January 2024; Accepted: 15 March 2024;
Published: 28 March 2024.
Edited by:
Bin Xia, Qingdao Agricultural University, ChinaReviewed by:
Zhe Pan, Hebei Agricultural University, ChinaNitin Agarwala, National Maritime Foundation, India
Copyright © 2024 Ye. This is an open-access article distributed under the terms of the Creative Commons Attribution License (CC BY). The use, distribution or reproduction in other forums is permitted, provided the original author(s) and the copyright owner(s) are credited and that the original publication in this journal is cited, in accordance with accepted academic practice. No use, distribution or reproduction is permitted which does not comply with these terms.
*Correspondence: Shanhong Ye, eWVzaGFuaG9uZ0BvdXRsb29rLmNvbQ==