 Jang Han Choi
 Yoonja Kang
 Chang-Keun Kang
 Ho Young Soh
- 1Graduate School of Chonnam National University, Yeosu, Republic of Korea
- 2Department of Ocean Integrated Science, Chonnam National University, Yeosu, Republic of Korea
- 3School of Earth Sciences and Environmental Engineering, Gwangju Institute of Science and Technology, Gwangju, Republic of Korea
We investigated the trophic dynamics between neustonic copepod communities and particulate organic matter (POM) sourced from contrasting water masses, i.e., high- and low-salinity areas, within the northeastern East China Sea. The sampling of neustonic copepod communities occurred three times in the summer (June, August, and September) of 2021, and considered the influx of the Yangtze River Diluted Water (YRDW) and the extension of the Tsushima Warm Current (TWC). To examine the relationship between the neustonic copepods and surface POM, we employed stable isotope techniques. Surprisingly, the neustonic copepod community exhibited a reluctance to feed on surface POM. The neustonic copepod community in the YRDW-dominated area in August showed higher δ13C values than those in the TWC-dominated area. The trophic groups within the neustonic copepod population appeared to consume selectively depending on the individual preferred prey sizes and composition. Using the POM from the water masses that affected the food sources consumed by neustonic copepods, we found a strong dependence on prey items originating from the TWC. This result suggests that the marine neustonic copepod community does not rely significantly on food sources derived from riverine freshwater.
1 Introduction
Neuston, as defined by Naumann (1917), are organisms that float near the water surface. They are classified into the following three ecological categories: euneuston, which permanently exist on the surface; facultative neuston, which move to the surface by diel vertical migration; and pseudoneuston, which live in the deeper layers but sporadically occur on the surface (Zaitsev, 1971). Facultative neuston and pseudoneuston tend to be commonly regarded as temporary neuston (Rawlinson et al., 2005). Neuston are important components of the marine ecosystem because they connect the surface and deeper layers of the ocean, providing food and energy for many organisms (Albuquerque et al., 2021; Dipper, 2022). Among them, neustonic copepods are a dominant component of marine zooplankton, and their feeding habits fall into two categories: particulate feeders (detritivores and omnivores) and carnivores (Hirabayasi et al., 2016; Kaji et al., 2019), as determined based on their mouthpart morphology, rather than on food type (Ohtsuka and Onbé, 1991; Schmidt et al., 2004; Michels and Stanislav, 2015). This diversity adds complexity to their role in the ecosystem. Suspended particulate organic matter (POM) serves as a significant food source for neustonic copepods (Chen et al., 2018; Im and Suh, 2019), because it consists of various components, such as zooplankton and fish fecal pellets, marine aggregates (marine snow), and phytodetritus from sinking phytoplankton (Turner, 2015). Considering the diel vertical migration of neustonic copepods, there is a potential for them to ingest POM within their vertical migration range. Neustonic copepods exhibit selectivity regarding the ingestion of POM within the pico- to microsize range (Im et al., 2015; Im and Suh, 2023). Understanding their feeding strategies from a morphological perspective is essential for comprehending their nutritional dynamics and trophic interactions within pelagic food webs, particularly in the context of their diel vertical migration.
The northeastern East China Sea (nECS) features an expansive continental shelf with water depths of less than 200 m along the southern coast of the Korean peninsula. The Tsushima Warm Current (TWC), which is a branch of the Kuroshio, flows northward from the Okinawa Trench, passing through the eastern region of Jeju Island and the Korea Strait before entering the East/Japan Sea (Lie and Cho, 2016; Park et al., 2017). During the summer monsoon (late June to August), Yangtze River Diluted Water (YRDW) travels eastward from mainland China and meets the TWC, creating a salinity front (Park et al., 2017). The YRDW also extends into the northwestern waters around Jeju Island, establishing a front through tidal mixing with the South Korea Coastal Water (SKCW) (Meng et al., 2020). These fronts significantly influence the temporal and spatial fluctuations in water masses, which, in turn, affect the composition and distribution of neustonic copepod species (Jeong et al., 2014; Choi et al., 2020). Variations in size-based phytoplankton compositions, such as picosized cyanobacteria in offshore warm waters vs. microsized diatoms in coastal cold waters, correspond to the distribution of these water masses (Yoon et al., 2020; Kang et al., 2022). In the nECS, the feeding strategies of Euchaeta sp. and Pleuromamma spp. have been found to vary according to latitude using fatty acid biomarkers (Ju et al., 2011). Although there are reports of the trophic levels and energy flow within the zooplankton community (Chi et al., 2020; Kim et al., 2022), and of feeding relationships with apex predators (such as jellyfish and fish) in this shelf sea (Wang et al., 2020; Bai et al., 2021), the precise feeding relationships at lower trophic levels, particularly regarding the different copepod and phytoplankton species compositions in contrasting water masses, remain unknown.
Gut-content analyses serve to confirm the dietary items consumed by the copepods within a brief time frame (Ohtsuka and Onbé, 1991; Nishida and Ohtsuka, 1996; Wu et al., 2004); however, it is significantly affected by the extent of digestion, contingent upon food selection (Baker et al., 2014). In instances where no hard parts are present, the identification of food items becomes challenging because of rapid digestion. In contrast, stable isotope analysis, which is a relatively more recent technique, offers a more precise depiction of dietary assimilation over an extended temporal scale (Chen et al., 2018; Im and Suh, 2019; Pizarro et al., 2019). Consequently, carbon and nitrogen stable isotopes possess an advantage in providing longer-term cumulative insights into the dietary preferences of consumers, thus offering a valuable means to interpret trophic levels within marine ecosystems (Minagawa and Wada, 1984; Kang et al., 2021). Carbon stable isotope ratios (δ13C) are particularly suited for identifying food sources because of their minimal fractionation (0‰–1‰) between diets and consumers. Therefore, δ13C values have found application as useful indicators of the original carbon source in marine food webs. Nitrogen stable isotope ratios (δ15N) are well suited for comprehending the trophic levels of organisms because of their relatively substantial and consistent increments of around 3.4‰ per trophic step (i.e., between prey and consumers) (Minagawa and Wada, 1984; Post, 2002).
In this research, we analyzed the δ13C and δ15N values of neustonic copepods and size-fractionated POM to investigate the variations in trophic niches within the neustonic copepod community in contrasting water masses. We anticipated that the food sources of neustonic copepods would exhibit differences because of the influence of the distinct water masses (with unique characteristics) of the nECS. Furthermore, we expected the trophic position of neustonic copepods to vary according to their respective food sources. Based on these expectations, we hypothesized that, if the feeding habits of neustonic copepods (i.e., carnivorous or particle feeders) resulted in distinct trophic relationships, their δ13C and δ15N values would exhibit variations between the different water masses. Consequently, this would lead to a spatial shift in the isotopic niche of the entire copepod community as a response to the differing compositions of copepod and phytoplankton species within these contrasting water masses. Specifically, because the YRDW plays a crucial role in shaping the spatial distribution of the surface water masses in the nECS, our research aimed to elucidate the impact of YRDW intrusion on the complex trophic interactions that underlie the neustonic copepod food web in this region during the summer monsoon. To accomplish this, we performed a comparative analysis of food web characteristics—focusing on community-wide metrics—regarding the temporal features of the spatial distribution of surface water masses.
2 Material and methods
2.1 Site description
The study area included areas with other physicochemical characteristics, such as YRDW outflow from China during the summer rainy period, TWC expansion with high water temperature, salinity, and inflow of SKCW into Korea. The discharge of YRDW varies from year to year. According to the YRDW discharge provided by the ocean and fisheries research institute in the Jeju special self-governed province (https://www.jeju.go.kr/jori/monitor/imap.htm), YRDW was continuously discharged at about 60,000 tons in June 2021, which was the largest value of the year. It gradually decreased from August to September. In contrast, TWC has increased relatively. The inflow of YRDW with low salinity and density characteristics can characterize the fluctuations in water masses across time and space. The variation of heterogeneous water masses affects the copepod community structure and, thus, the complexity of the food web. We performed three onboard observations considering the discharge of YRDW and the expansion of the TWC. We collected POM and neustonic copepod specimens in June (western Jeju Island), August (southern Jeju Island), and September (northeastern Jeju Island) 2021 using a research vessel (Saedongbaek) from the Chonnam National University in South Korea (Figure 1 and Supplementary Table 1). We utilized the period-specific geographical areas identified by Choi et al. (unpublished) based on the neustonic copepod community structure: areas A (affected by the YRDW) and B (remaining shelf water that had a relatively high salinity) in June; areas A (affected by the YRDW) and B (affected by the TWC) in August; and areas A (broad frontal area formed over the coast of Korea) and B (strongly influenced by the TWC) in September. The range of salinity by areas within month is as follows: areas A (25.7 to 31.3) and B (28.8 to 32.0) in June; areas A (27.9 to 29.7) and B (27.9 to 30.9) in August; and areas A (31.1 to 31.6) and B (31.2 to 32.3) in September.
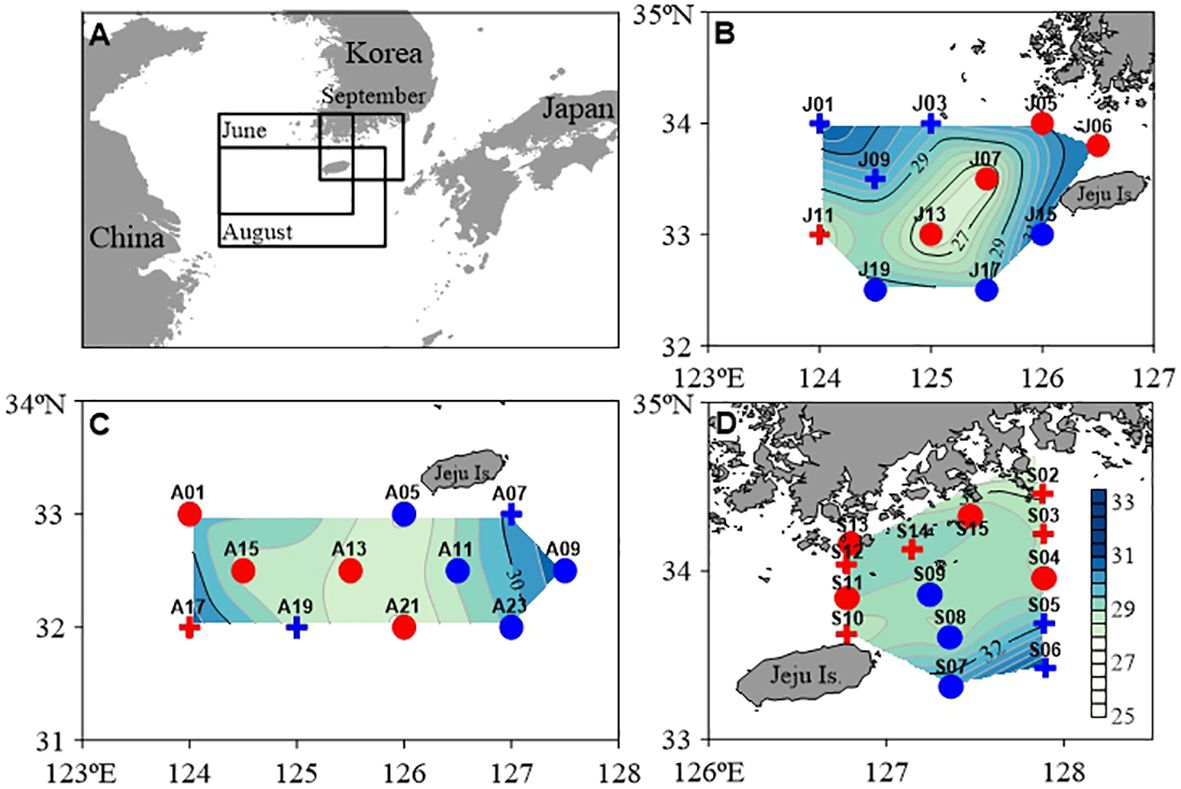
Figure 1 Map showing the distribution of surface salinity at the sampling station [(A), study area; (B), June (J); (C), August (A); (D), September (S)] in the northeastern East China Sea. For each sample, the study area was divided into (A) (red, low-salinity) and (B) (blue, high-salinity) according to the non-metric multidimensional scaling (nMDS) model via a Bray–Curtis similarity index correction based on the distribution of neustonic copepods at the species level. The areas used for stable isotope analysis were selected among the two study areas (circles). Summary of the study area is provided in Supplementary Table 1.
2.2 Sampling methods
The seawater samples (45 L) of the surface layer were used to treat pico- to microsize POM samples. All filter paper used for treatment was prewashed and precombusted (450 °C for 4 h), then filtered in triplicate. The seawater samples were continuously prefiltered through 200 μm and 20 μm sieves, and particles with a size above 20 μm were collected in Ø 47 mm GF/F filter paper (0.7 μm pore size; Whatman, Merck KGaA, Darmstadt, Germany), to obtain microsized POM (mPOM). Nanosized POM (nPOM) was collected by filtering seawater through a 20 μm sieve on Ø 47 mm GF/D filter paper (2.7 μm pore size; Whatman), whereas picosized POM (pPOM) was collected by filtering water through GF/D filter paper with GF/F filter paper. All filters were immediately frozen and stored at –80°C until the stable isotope analysis was performed. In the laboratory, all filter samples were completely dried (60 °C for 48 h) in an oven (ThermoStable SON-155, Daihan Scientific, Seoul, Korea). For stable isotope analysis, the filter samples were cut in half and, to remove inorganic carbon and obtain accurate δ13C values, acid treatment was performed by fuming it within the acid-containing desiccator overnight. The remaining filter samples were used to obtain δ15N values. All filter samples were folded and packed into a tin disk.
All copepods collected with neuston net were considered neustonic copepods because of the difficulty in distinguishing euneuston, facultative neuston and pseudoneuston in this study. A neuston net (70 cm width; 40 cm height; mesh size 333 μm) used for neustonic copepod sampling was towed horizontally at a ship speed of 2.5 to 4 knots at a distance of 2–5 m from the shipside. A flowmeter (model 438 115, Hydro-Bios Co., Altenhoz, Germany) was attached to the mouth of the net, to estimate the volume of the filtered seawater. The collected neustonic copepod samples were divided on board using a Folsom-type plankton splitter, for species identification and stable isotope analysis. The samples used for species identification were preserved in 5%–8% neutralized formalin–seawater solution. Subsamples were frozen (–80°C) on board the ship and stored frozen in the laboratory for subsequent stable isotope analysis. After transportation to the laboratory, preserved samples were once more divided using a Folsom plankton splitter before estimating abundance. Neustonic copepod species were identified and counted using a dissecting stereo microscope (SMZ645, Nikon, Tokyo, Japan). When detailed observation was required for species identification, the appendages and any other parts required for this were dissected and observed on a slide glass by mounting in 70% glycerin under high magnification of an optical microscope (ECLIPSE E200, Nikon, Tokyo, Japan). The classification system was devised based on the World Register of Marine Species (WoRMS, https://www.marinespecies.org). The density of neustonic copepod was measured and converted into abundance per unit volume (ind. m−3). Log (x + 1) transformation of data was performed to avoid bias due to differences in population abundance between survey areas and species and normalize data distribution. To measure the similarity between neustonic copepod stations, hierarchical cluster analysis was performed based on the Bray–Curtis similarity index (Shannon and Weaver, 1963) using the PRIMER software (version 6.1.6., Auckland, New Zealand; Clarke and Gorley, 2006). Subsequently, the cluster was arranged using the non-metric multidimensional scaling (nMDS) model (Figure 1). Based on the nMDS, stations with high abundance of neustonic copepods were selected, and the sampling area for stable isotope analysis was reorganized into areas A and B for each month. The neustonic copepod species in the reconstructed areas were converted to percentages to select dominant copepod species.
The chosen dominant copepod species were as follows (Table 1): areas A (Calanus sinicus and Labidocera rotunda) and B (Paracalanus parvus s. l. and L. rotunda) in June; areas A (Acartia pacifica, Canthocalanus pauper, L. rotunda, Centropages furcatus, Temora discaudata and T. turbinata) and B (A. pacifica, L. acuta, C. furcatus, T. discaudata and C. pauper) in August; and areas A (C. pauper, C. furcatus, L. acuta, Subeucalanus crassus, T. turbinata and T. discaudata) and B (Undinula vulgaris, L. acuta and C. pauper) in September. In addition to the dominant species, the minor species were selected based on their feeding relationships (area A in June: Pontellopsis yamadae; and area B in September: T. discaudata, S. crassus and C. furcatus). The feeding type of the selected neustonic copepod species was classified as either particle feeder or carnivorous based on the literature (Anraku and Omori, 1963; Acros and Fleminger, 1986; Price and Paffenhöfer, 1986; Turner, 1986; Ohtsuka and Onbé, 1991; Ohman and Runge, 1994; Hu et al., 2014; Al-Hanoun and Mayya, 2020).
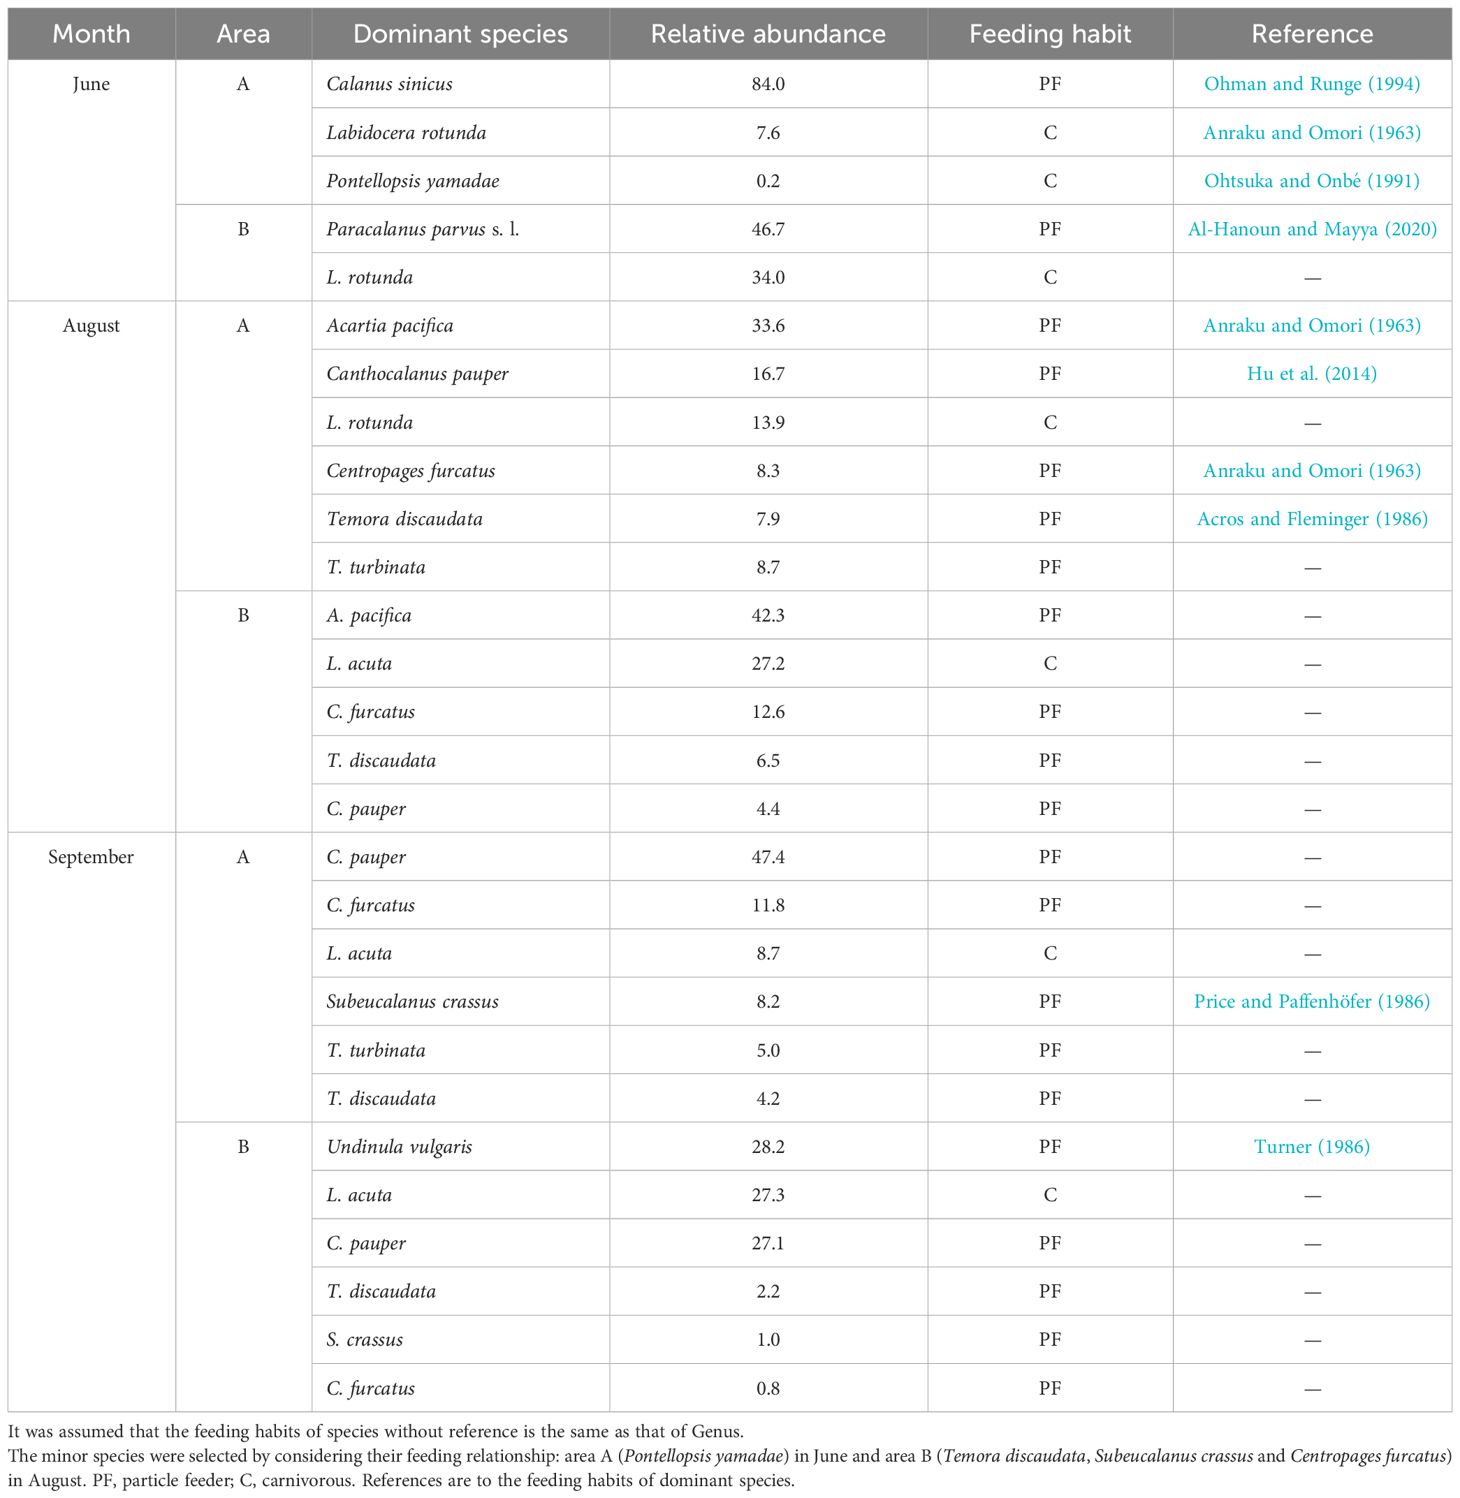
Table 1 The dominant species, relative abundance and feeding habits of dominant neustonic copepods in the study areas (low salinity, A and high salinity, B) by months (June, August, and September).
Sufficient individuals of each species (0.3–0.5 mg) selected for stable isotope analysis were collected onto precombusted GF/F (Ø 47 mm), dried in an oven (60°C for 48 h), and packed (triplicated) into a tin capsule. Moreover, radiolarians, which were predominant in area B in June, were considered as a food source for the copepods and were selected for analysis (Supplementary Figure 1). Radiolarians have silica-based skeletons, and CaCO3 content is minimal or negligible (Anderson, 2001; Matsuzaki et al., 2016). Single-celled species range in size from less than 100 μm to very large species reaching 1 to 2 mm in diameter (Anderson, 2001), but radiolarians from the northern East China Sea are reported to be small case (Matsuzaki et al., 2016). Additionally, the radiolarians in this study are relatively very small compared to L. rotunda (body length: >1.0 mm; Razouls et al., 2005–2024a). Thus, it was determined that there was a risk of loss during acid treatment; and, after drying, the samples were packed into a tin capsule with a weight of 0.3–0.5 mg.
2.3 Stable carbon and nitrogen isotope analysis
Stable isotope data for all packed POM, copepod, and radiolarian samples were obtained using continuous-flow isotope ratio mass spectrometry (CF-IRMS). Samples were oxidized at a high temperature (980°C) in an Elemental Analyzer (Flash 2000, Thermo Scientific, Waltham, MA), and the resultant CO2 and N2 were swept by Helium carrier gas in continuous flow mode and analyzed for stable isotope ratio using a Conflo IV (Thermo Scientific) interfaced with an isotope ratio mass spectrometer (Delta VPlus, Thermo Scientific). Analyses were conducted by the Alaska Stable Isotope Facility (ASIF) at the University of Alaska Fairbanks. The abundance of each stable isotope is expressed in δ notation as parts per thousand (‰) deviation from the international standards Vienna Pee Dee Belemnite for carbon and Air for nitrogen according to the following formula:
where X is 13C or 15N, and Rsample and Rstandard are the ratios of heavy to light isotopes in the samples and standards, respectively. All stable isotope results were subjected to two-point calibrations. Stable isotope ratios were calibrated using international standards of sucrose (ANU C12H22O11; National Institute of Standards and Technology (NIST), Gaithersburg, MD, United States) for carbon and of ammonium sulfate ([NH4]2SO4; NIST) for nitrogen. Using this calibration, the average δ13C and δ15N obtained for the ASIF calibration verification standard (ref/chk/peptone) were –15.8‰ ± 0.3‰ (n = 10) and 7.1‰ ± 0.1‰ (n = 10), respectively, which compare well with their accepted values of –15.8‰ and 7.0‰, respectively. The instrument precision was approximately 0.3‰ and 0.1‰ for δ13C and δ15N, respectively. Lipid extraction was not performed for each copepod sample because it may affect the value of δ15N (Bodin et al., 2007; Mintenbeck et al., 2008); rather, the δ13C of the copepod samples was calculated according to Smyntek et al. (2007), as follows:
where δ13Cex is the predicted δ13C value of the defatted copepod sample, and δ13Cbulk and C:Nbulk are the δ13C value and the C:N ratio of the experimental samples, respectively.
2.4 Data analysis
Any outliers identified among the calculated stable isotope analytical values were excluded from further analysis. Before the statistical analyses, the normality and homogeneity of variance for all isotopic data were confirmed using the Shapiro–Wilk test and Levene’s test, respectively. The significance of the differences in the δ13C and δ15N values of neustonic copepod communities observed between the different months and areas was assessed using a permutational multivariate analysis of variance (PERMANOVA) based on the Bray–Curtis similarity method (Anderson, 2017), as well as a multilevel pairwise PERMANOVA using adonis2 and pairwise adonis2 from the “vegan” package. The significance level for all statistical tests was set at 5%. Analyses were conducted using the R software (version 4.2.3) (R Core Team, 2013).
A hierarchical cluster analysis based on the δ13C and δ15N values of neustonic copepod species was performed using PRIMER, version 6.1.6, to identify trophic groups according to the Bray–Curtis similarity method. Because the isotope values within individual trophic groups met the assumptions of normality and equality of variance, multivariate and univariate analyses of variance (MANOVA and ANOVA, respectively) were performed using the Bray–Curtis similarity method, to test the significance of the differences between trophic groups. Subsequently, ANOVA of δ13C and δ15N was followed by multiple comparisons using Tukey’s honestly significant different (HSD) test, to detect differences among the trophic groups. These statistical tests were performed at P < 0.05 using IBM SPSS statistics (version 27.0 IBM Corp., Armonk, NY; George and Mallery, 2019).
The trophic niche of the dominant neustonic copepod community in the two areas according to the month of the year was described using stable isotope Bayesian ellipses in R (SIBER) (Jackson et al., 2011). The Layman metric of the total area of the convex hull (TA) can be directly converted to a measure of population niche area; however, it is very sensitive to sample size and, consequently, its value increases as the sample size increases (Layman et al., 2007). In contrast, the standard ellipse area (SEA) asymptote with a sample size of 30 and the TA increase as the number of added samples increases, with a standard ellipse containing 40% of the data, regardless of sample size (Syväranta et al., 2013). The corrected standard ellipse area (SEAc) provides a highly satisfactory estimate for all sample sizes (Jackson et al., 2011; Syväranta et al., 2013); therefore, we used SEAc as a measure of the mean core population isotopic niche. Other Layman metrics included NR (δ15N range), to provide information on the trophic length of the community, and CR (δ13C range), to estimate the diversity of the basal resources. TA and the mean distance to the centroid (CD) were used to indicate the niche width and diversity of the diet or trophic diversity of the population, respectively.
We estimated the relative contributions of the different sources [Yangtze River Water (YRW), TWC, and riverine freshwater discharge from the Korean peninsula] to the trophic groups of neustonic copepods (based on cluster groups) using a Bayesian isotope mixing model. We employed the Stable Isotope Mixing Model in R (SIMMR)−an upgraded version of the Stable Isotope Analysis in R (SIAR) (Parnell et al., 2013)—for this purpose. The δ13C and δ15N end-member values of POM originating from the YRW were obtained from the values reported from upstream to downstream (Supplementary Table 2). The δ13C and δ15N end-member values of suspended POM originating from the TWC in the eastern Jeju Island in summer were obtained from the values reported from subsurface and bottom layers. The δ13C and δ15N end-member values of suspended POM from the riverine freshwater discharge from the Korean peninsula were the values reported for the Seomjin River and Tamjin River, which are prominent rivers in the South Sea of Korea. Similar to SIAR, the SIMMR integrates stable isotope values from terminal end-members and consumers, together with the uncertainty of trophic enrichment factors, to generate credible intervals for potential dietary solutions (Parnell et al., 2010, 2013). Default settings for the number of iterations, burn-in, and Markov chain Monte Carlo chains were employed by SIMMR to explore possible solutions, excluding those that were not probabilistically consistent with the data. The accuracy of the Gellman–Rubin statistic for curve analysis was as high as 1.00. In this study, trophic enrichment factors of 0.3‰ (± 0.1‰) for δ13C and 2.2‰ (± 2.1‰) for δ15N were used for the SIMMR calculation (McCutchan et al., 2003). The SIMMR results are presented as the median (50% quartile) and the 5%–95% Bayesian credible intervals of diet proportions.
3 Results
3.1 Isotope values of the primary sources of organic matter
The δ13C values of pico- to microsized POM in the surface layer fell within narrow ranges of –23.7‰ to –25.4‰, –21.9‰ to –24.8‰, and –23.2‰ to –24.1‰ in both areas A and B in June, August, and September, respectively (Table 2). Their δ15N values fell within nearly identical ranges of 4.9‰ to 7.3‰, 5.1‰ to 7.2‰, and 4.9‰ to 8.0‰ in both areas A and B at the three time points, respectively. The radiolarians were highly abundant in area B in June and had high δ13C values, with a mean of –20.0‰.
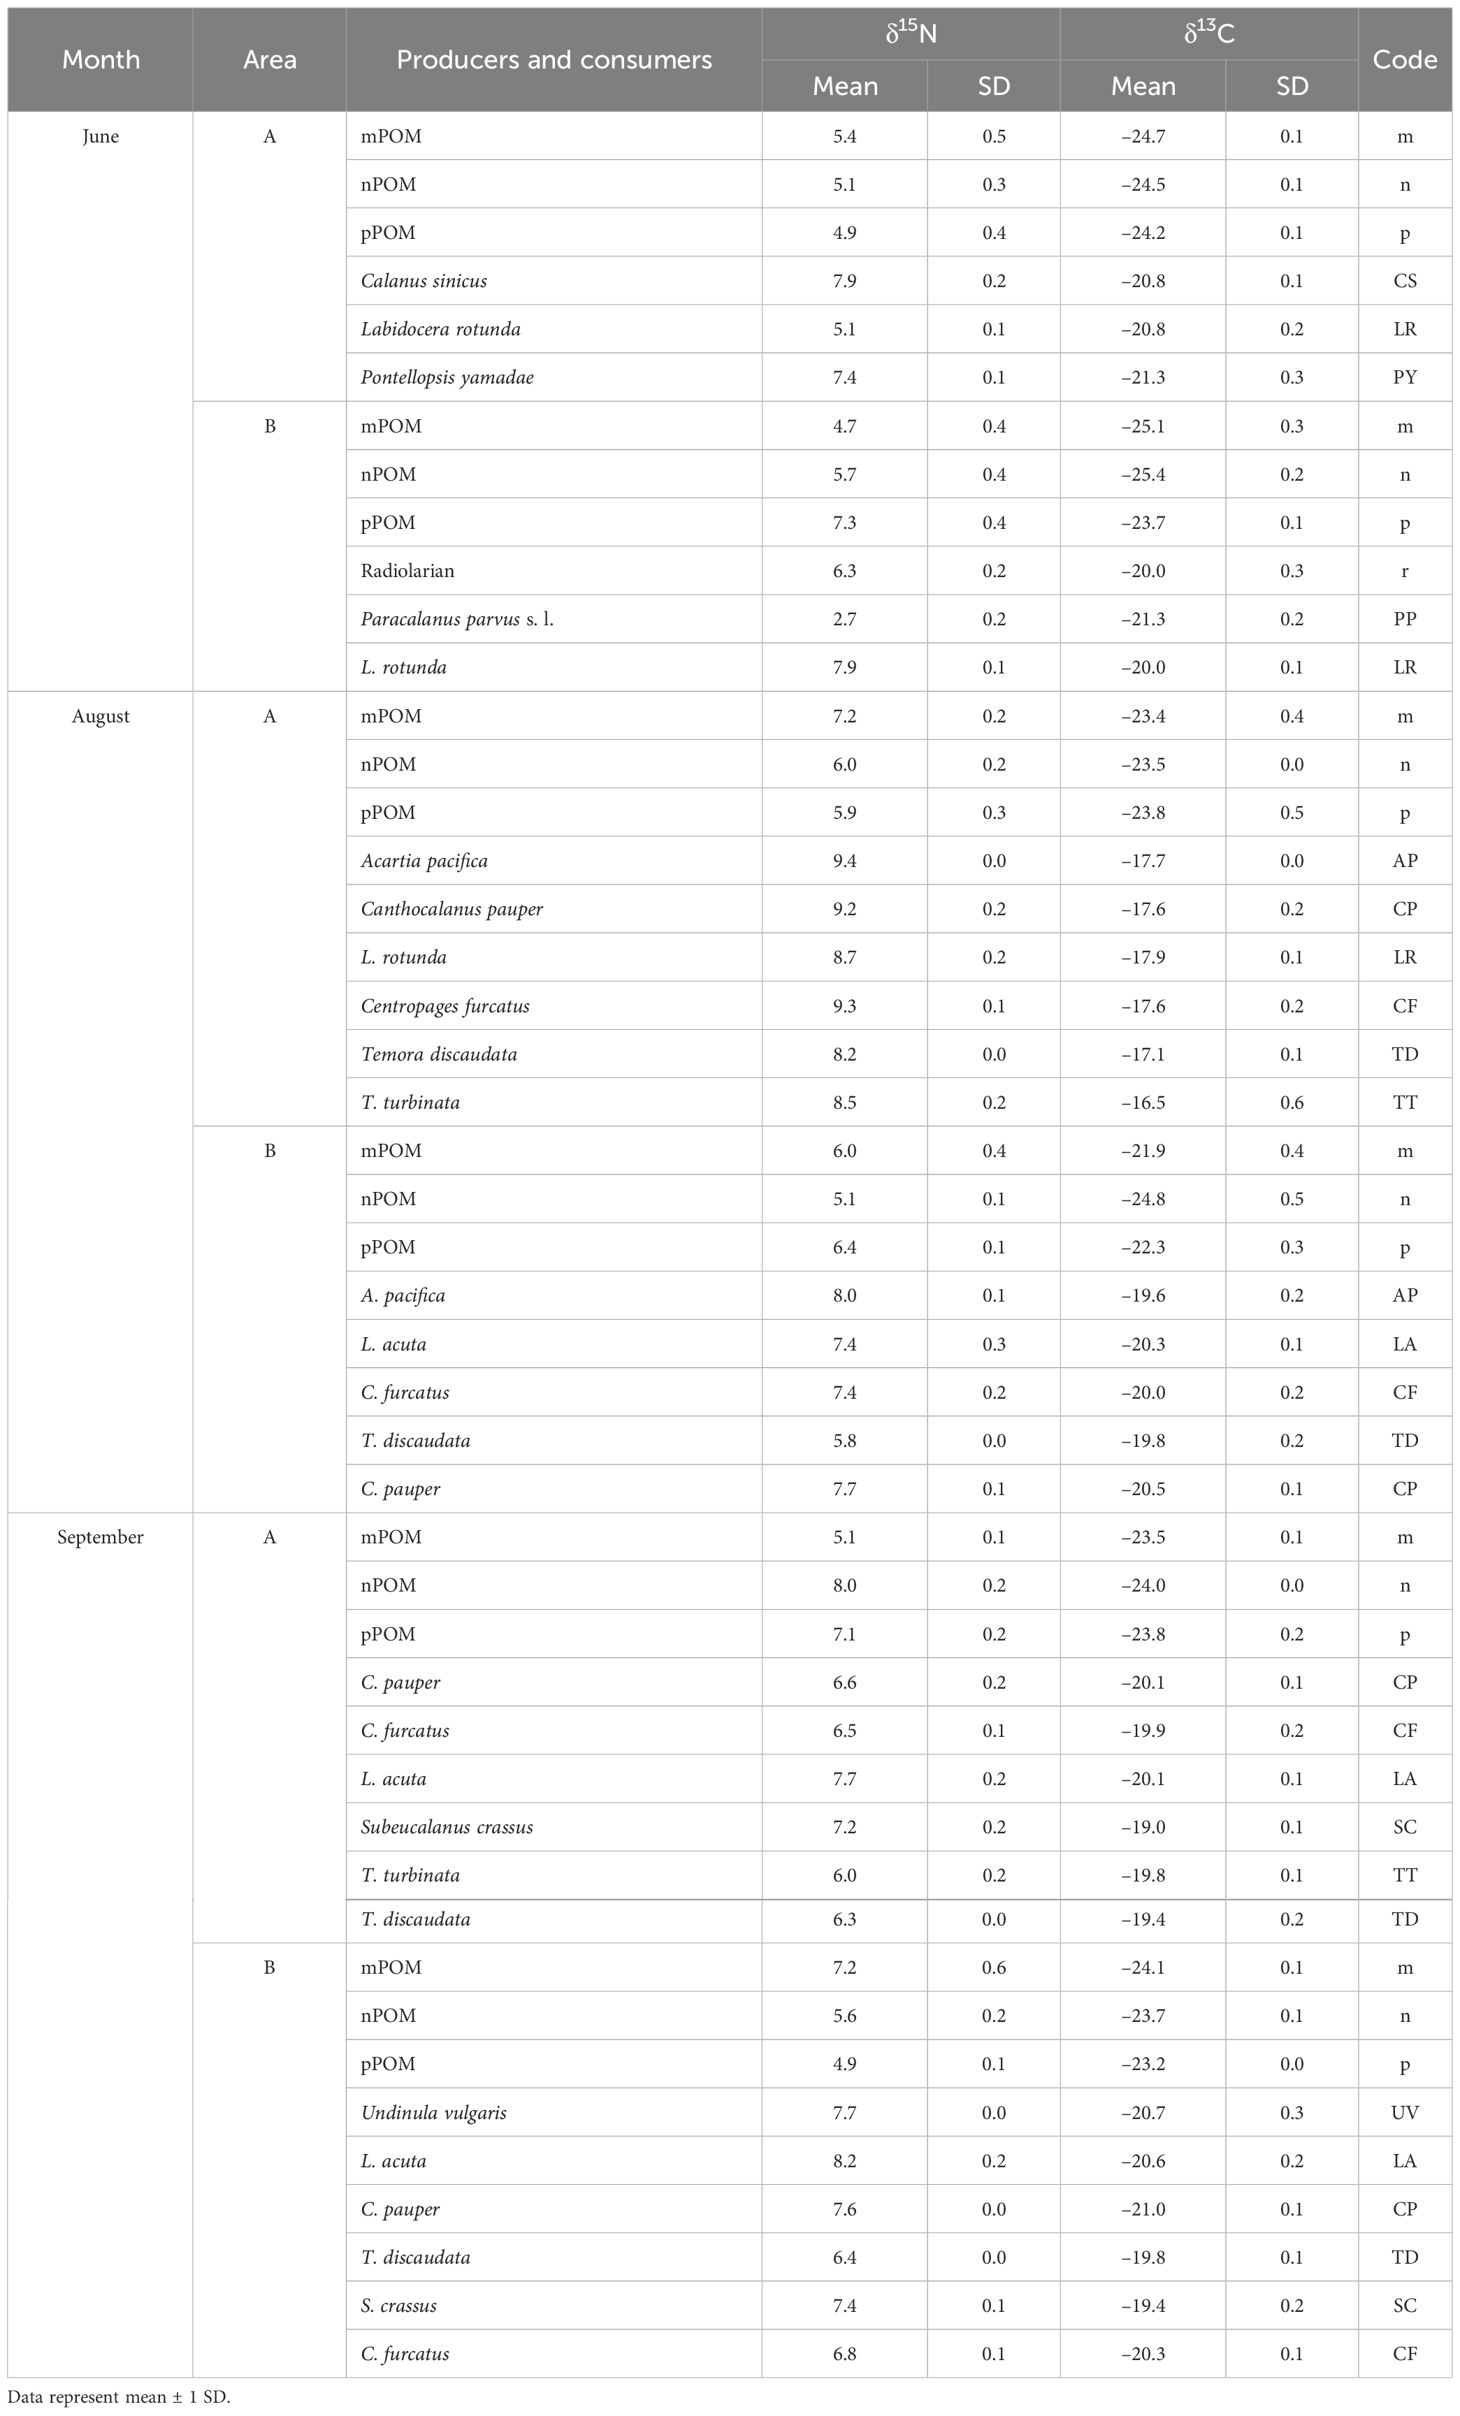
Table 2 Values of δ13C and δ15N of copepods and particulate organic matter according to area (A, low salinity; and B, high salinity) of the northeastern East China Sea.
3.2 Isotope values of neustonic copepods
The δ13C values of the dominant neustonic copepods were distinct from those of all size fractions of POM (Table 2). In area A, the mean δ13C values of copepod were consistent on each sampling occasion: –21.3‰ to –20.8‰ in June, –17.9‰ to –16.5‰ in August, and –20.1‰ to –19.0‰ in September. The values were highly elevated in August compared with the values recorded in June and September. The mean δ13C values of copepod were highly uniform in area B during the sampling period: –21.3‰ to –20.0‰ in June, –20.5‰ to –19.6‰ in August, and –21.0‰ to –19.4‰ in September.
The mean δ15N values of the dominant neustonic copepods in area A varied from 5.1‰ to 7.9‰ in June, 8.2‰ to 9.4‰ in August, and 6.0‰ to 7.7‰ in September. The values were highly elevated in August compared with the remaining two time points. The mean δ15N values of copepod in area B were also highly variable on each occasion: 2.7‰ to 7.9‰ in June, 5.8‰ to 8.0‰ in August, and 6.4‰ to 8.2‰ in September.
A multivariate two-way PERMANOVA revealed a strong interaction between area and month (F2, 64 = 17.36, P < 0.001) in terms of the δ13C and δ15N values of the neustonic copepod community (Table 3). In turn, a univariate two-way PERMANOVA also denoted a strong interaction of area × month for both δ13C (F2, 64 = 46.95, P < 0.001) and δ15N (F2, 64 = 7.460, P < 0.001) values. Pairwise comparisons within area showed significant differences in the δ13C (P < 0.001) and δ15N (P < 0.001, except for June vs. September) values between months in area A, but not in area B (P > 0.054 for all cases). Further pairwise comparisons within month revealed significant differences in the δ13C (P < 0.004) and δ15N (P < 0.005) values between areas in August and September, but not in June (P = 0.202 and 0.317 for δ13C and δ15N, respectively).
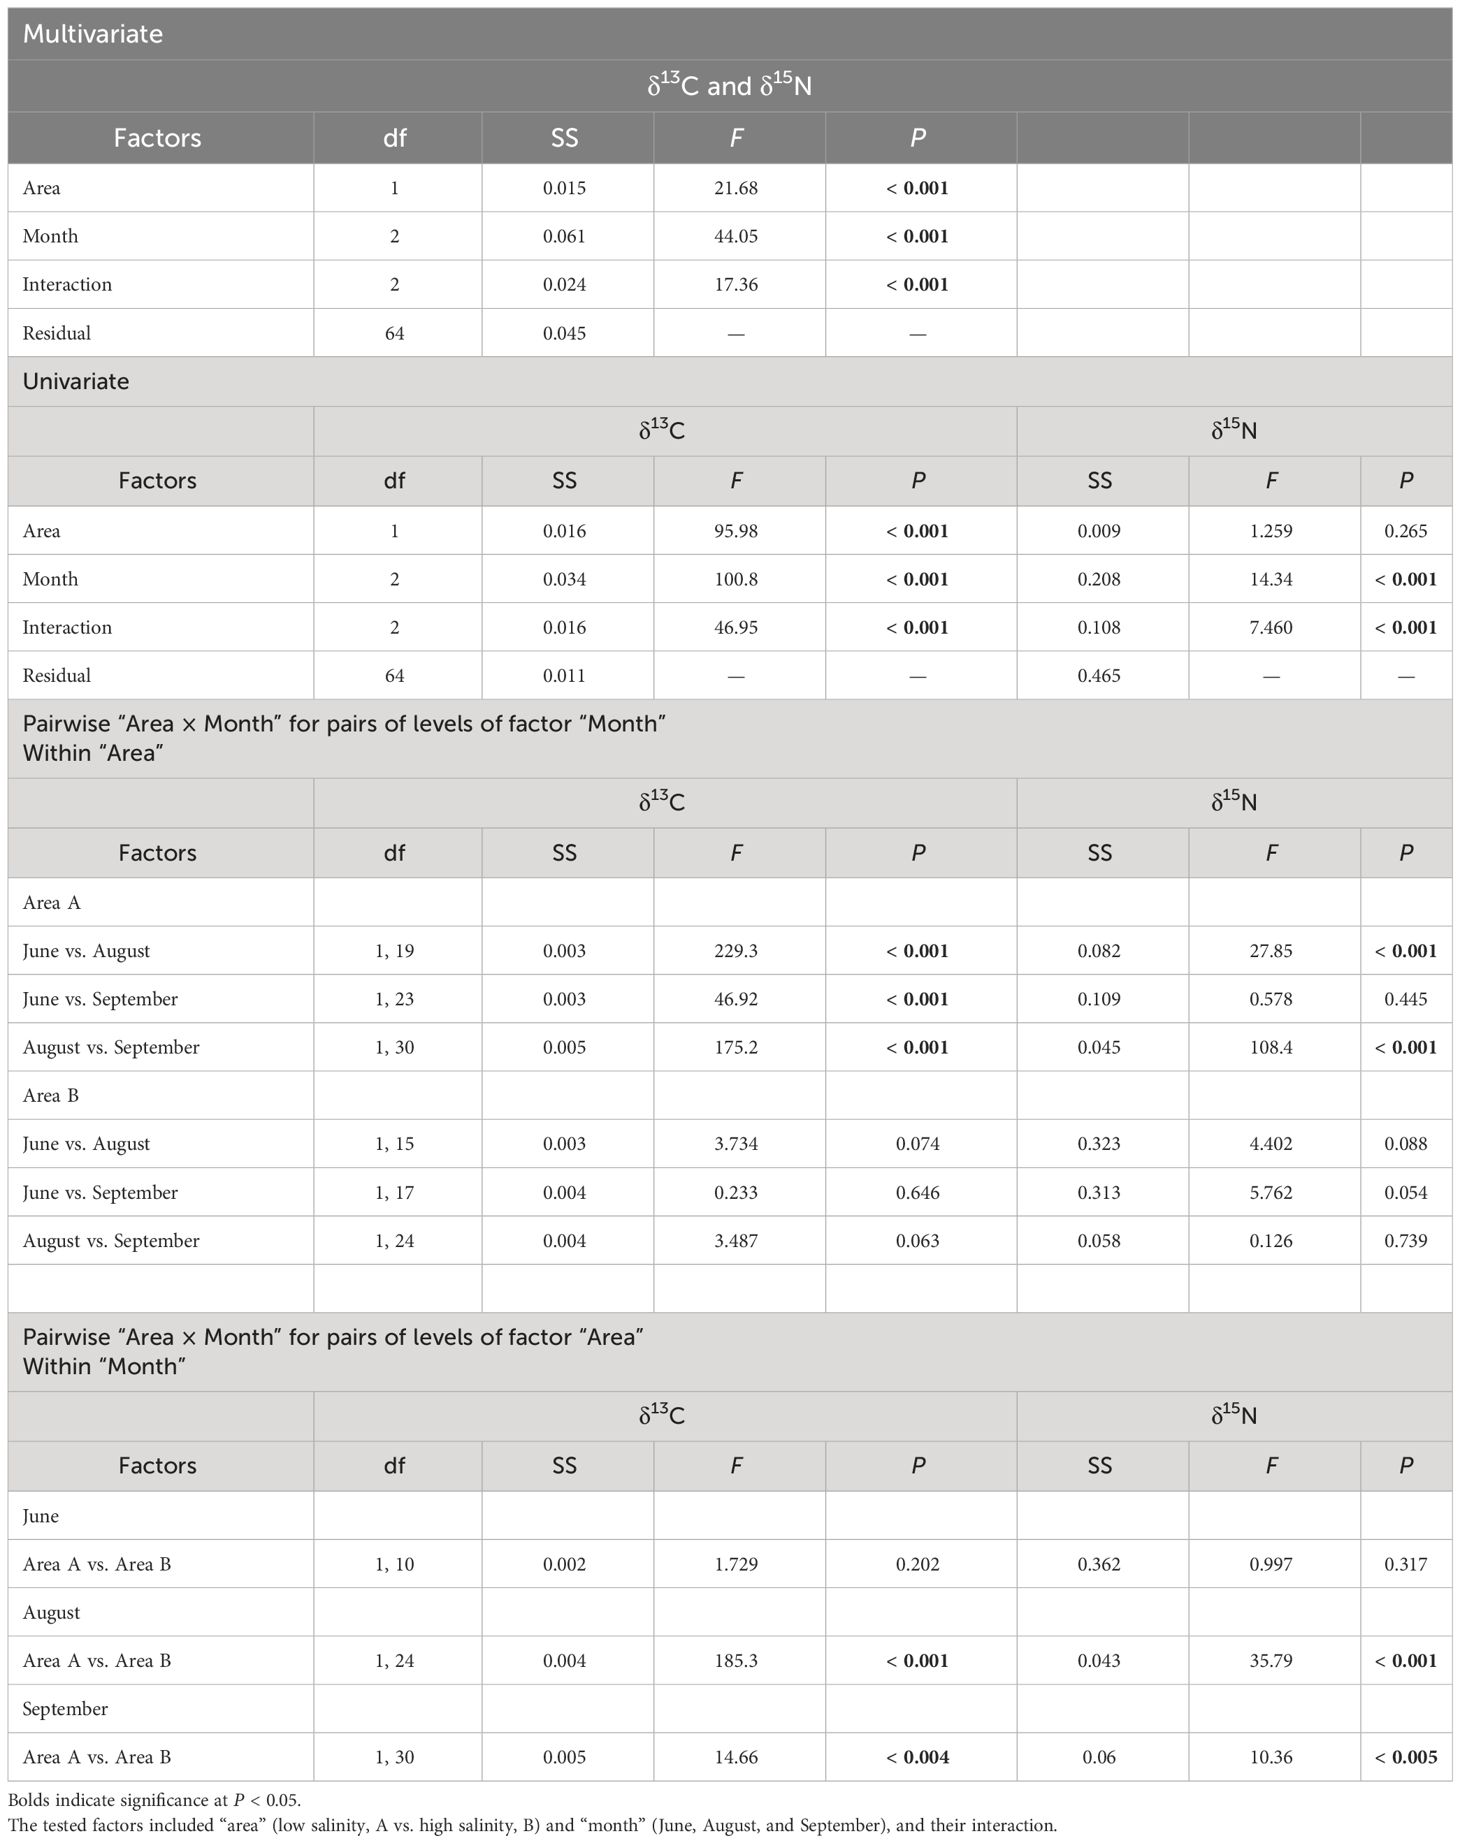
Table 3 Results of the two-way PERMANOVA (multivariate and univariate) and the pairwise comparison of the differences in the stable isotope (δ13C and δ15N) values of the copepod community.
3.3 Identification of trophic groups
A cluster analysis based on the average δ13C and δ15N values classified neustonic copepods into five distinct groups (designated as groups I, II, III, IV, and V) throughout the sampling occasions (Supplementary Figure 2). The copepod assemblages were separated into two groups in each area, except for area A in August (Figure 2). In June, group I consisted of carnivorous species (L. rotunda and P. yamadae) and a particle feeder (C. sinicus), whereas groups IV and V included a carnivorous species (L. rotunda) and a particle feeder (P. parvus s. l.) in areas A and B, respectively. In August, group I contained a carnivorous species (L. acuta) and particle feeders (C. pauper, A. pacifica, and C. furcatus), and group II consisted of a particle feeder (T. discaudata) in area B. In turn, group III comprised species of groups I and II and another carnivorous species (L. rotunda) and particle feeder (T. turbinata) in area A, with no segregation. In September, group I included a carnivorous species (L. acuta) and particle feeders (C. pauper and S. crassus) in both areas A and B, and particle feeders (C. furcatus and U. vulgaris) in area B. Group II consisted of a particle feeder (T. discaudata) in both areas A and B, and other particle feeders (C. furcatus and T. turbinata) in area A, with no carnivorous species identified in this group.
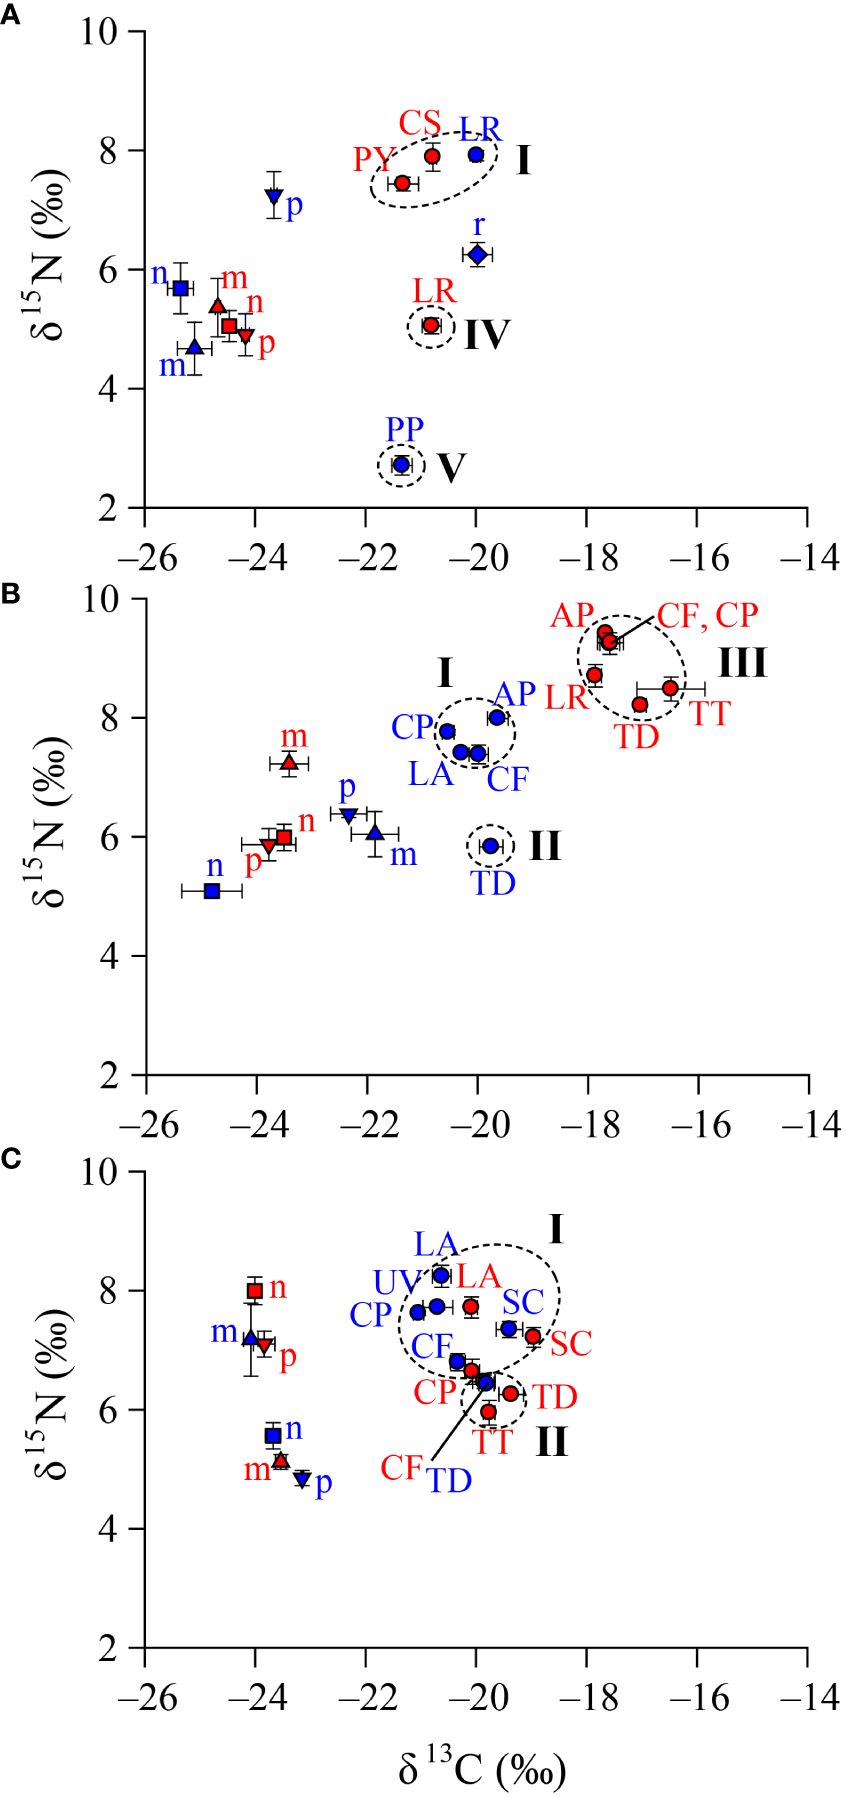
Figure 2 Trophic web structure of neustonic copepods in the northeastern East China Sea. The sampling stations [(A), June; (B), August; (C), September] were divided into areas (A) (low salinity, red color) and (B) (high salinity, blue color) according to the characteristics of the water masses. Codes are given by acronyms of the first letters of genus and species name, and are listed in Table 2. The groups of taxa (dotted circles) were chosen from the hierarchical cluster analysis (Supplementary Figure 2).
Significant differences were observed between trophic groups (one-way MANOVA, F4, 65 = 56.77, P < 0.001) in terms of the δ13C and δ15N values (Table 4). A subsequent univariate ANOVA revealed significant differences for both δ13C (F4, 65 = 77.29, P < 0.001) and δ15N values (F4, 65 = 160.4, P < 0.001). Tukey’s HSD test of the δ13C values between trophic groups revealed significant differences (P < 0.001), except for groups I vs. IV and IV vs. V). In fact, group III displayed considerably higher δ13C values than the remaining groups (P < 0.05 for all cases). In contrast, the δ13C values of groups II, IV, and V fell within the range of group I (–21.3‰ to –19.0‰). The δ15N values of copepod assemblages were clearly differentiated between trophic groups (P < 0.05 for all cases), except for group IV vs. V. Conversely, Tukey’s HSD test of each trophic group revealed slight differences in both δ13C and δ15N values, with the differences between areas and months being very small, within 1‰.
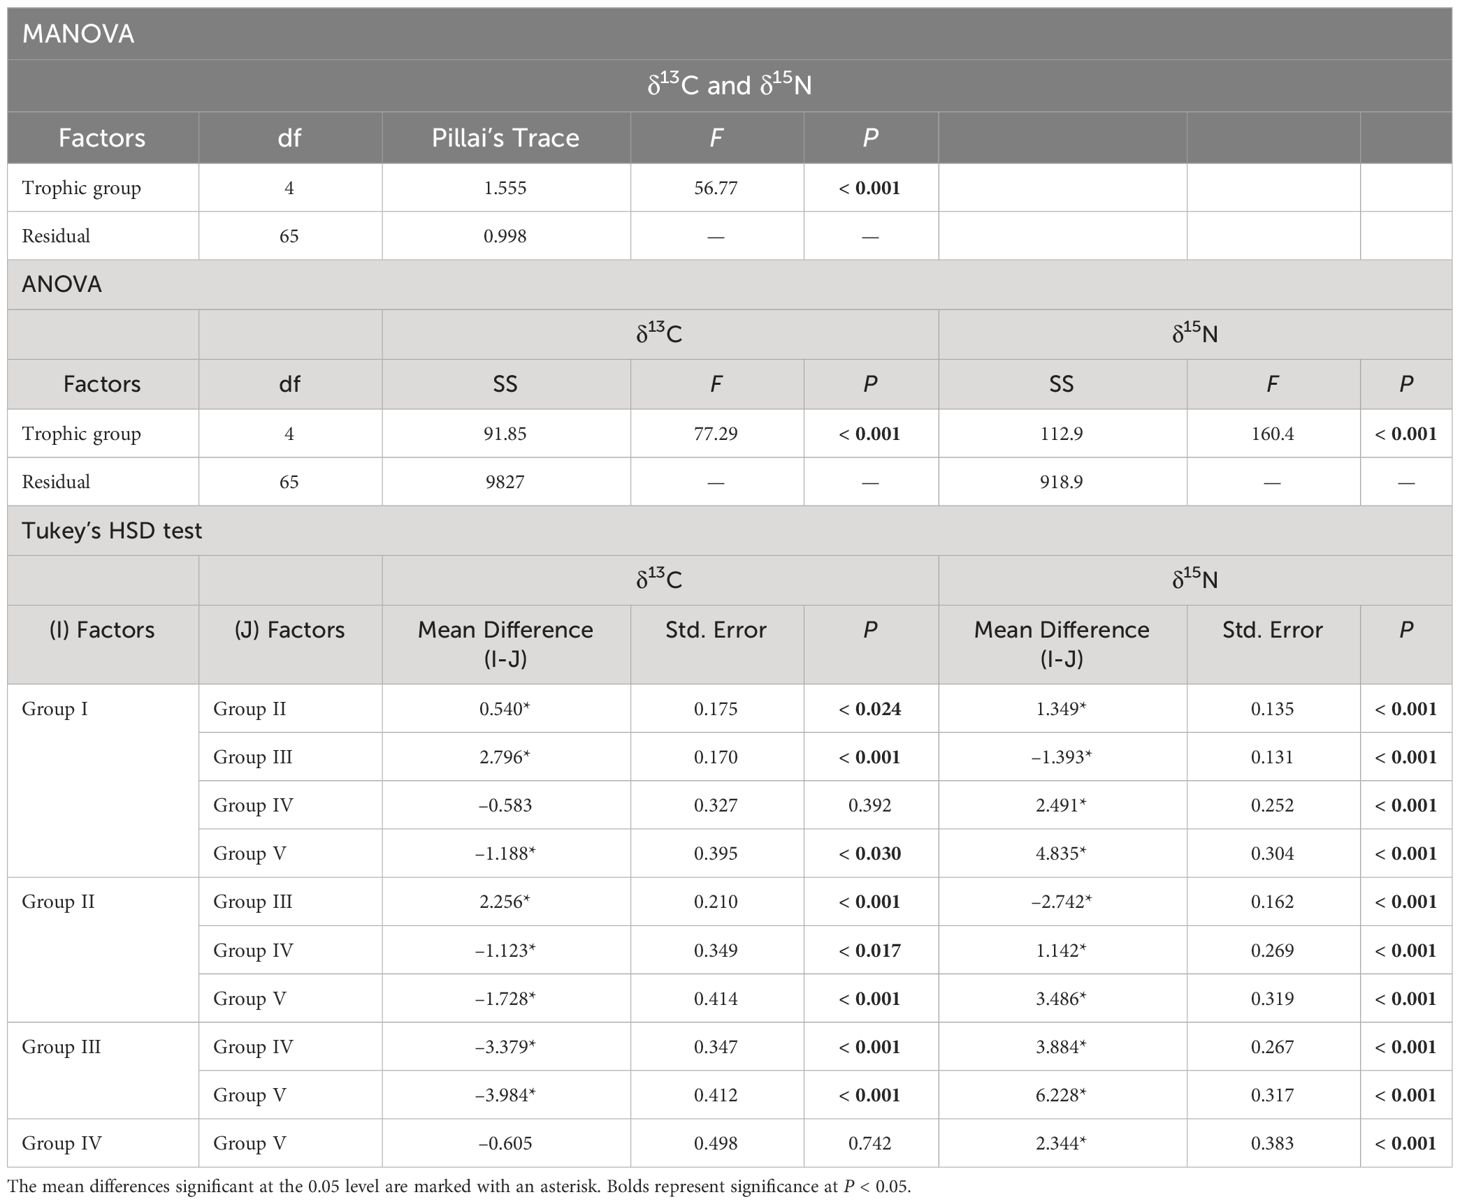
Table 4 Results of the one-way MANOVA, ANOVA, and Tukey’s HSD test results, for testing the differences in the stable isotope (δ13C and δ15N) values among the trophic groups of the northeastern East China Sea.
3.4 Community-wide trophic niche
The NR, CR, and CD values were lower in June and September (0.71‰ and 0.72‰, 0.43‰ and 0.70‰, and 0.42‰ and 0.51‰, respectively) than in August (1.60‰, 2.58‰, and 1.52‰, respectively) (Table 5). The Layman metrics further showed that the NR, CR, and CD values between two spatially different communities (i.e., low- vs. high-salinity areas in each month) were much larger in August than they were in June and September. The SEAc was much wider in area B in June than it was in the remaining months and in area A in all three months (Figure 3). The copepod communities in June and September exhibited a considerable overlap (17.0% and 13.6%, respectively) of trophic niches between areas A and B. In contrast, no niche overlap was observed between areas A and B in August.
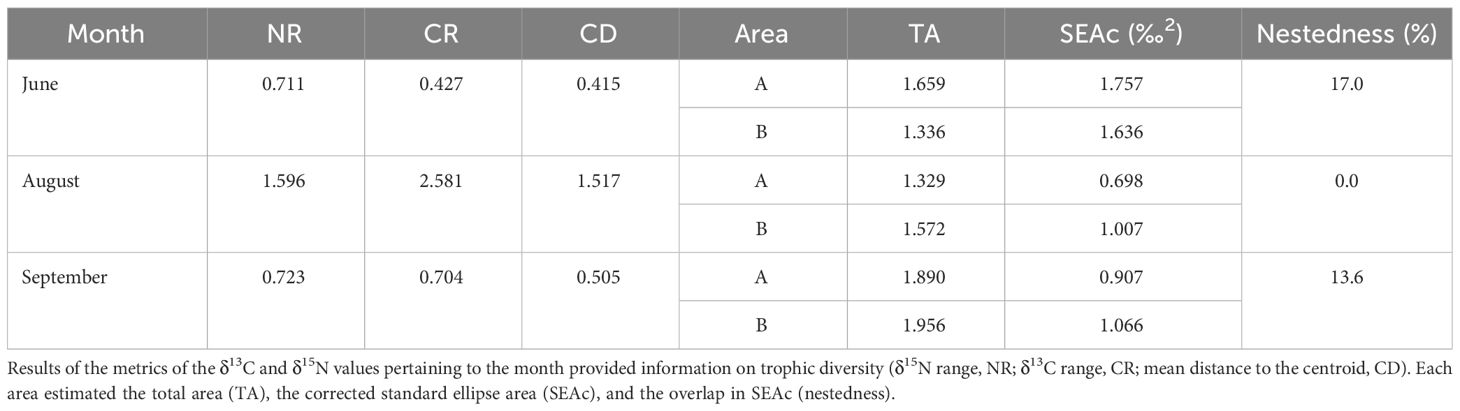
Table 5 Comparisons of the isotopic niche areas of each area (A, low salinity; and B, high salinity) according to month (June, August, and September).
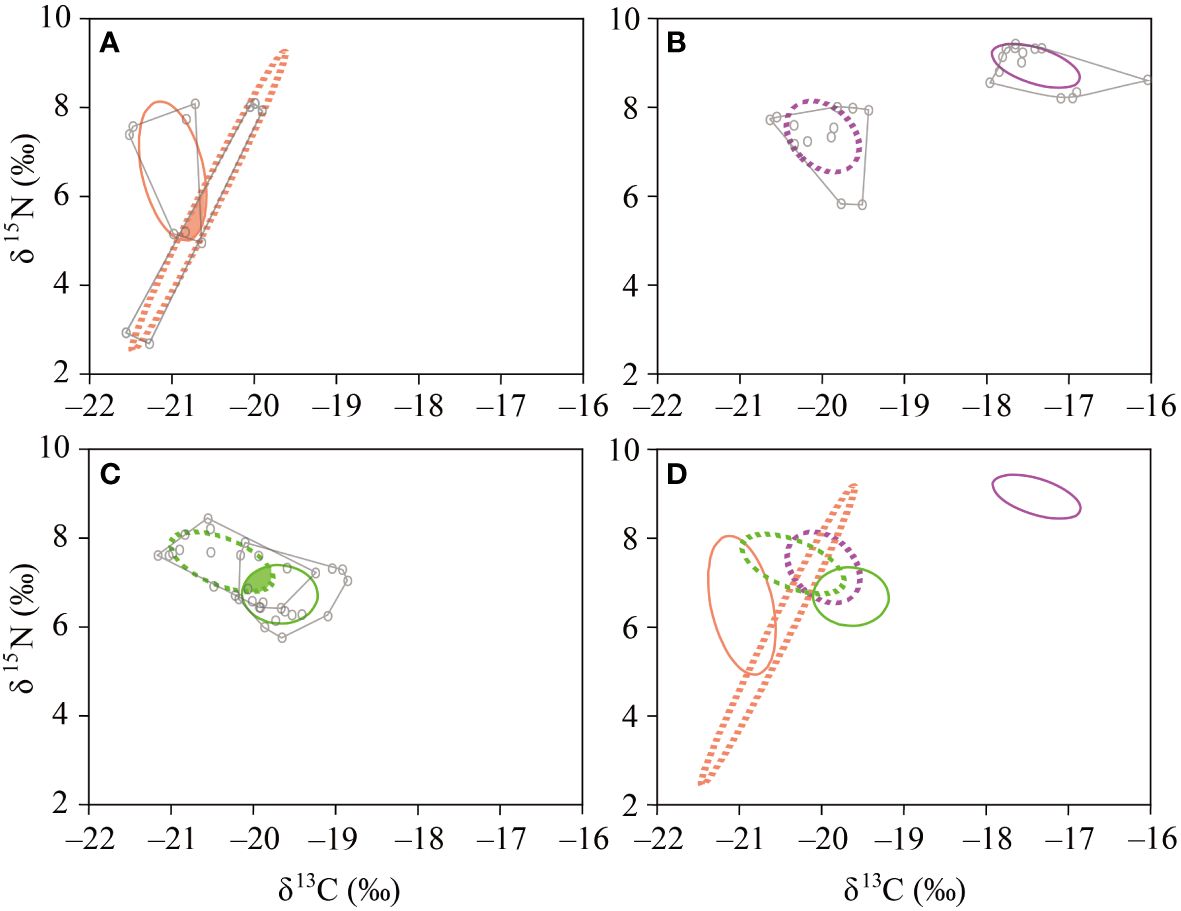
Figure 3 Isotopic niches of the neustonic copepod community. The lines and colors are as follows: areas A (low salinity, solid line), B (high salinity, dashed line), and total area (TA) of convex hull (gray line) of each area. (A) June (orange), (B) August (purple), (C) September (green), and (D) the entire study areas in the northeastern East China Sea.
3.5 Mixing-model quantification of source contribution
The SIMMR model calculation showed that almost all of the dietary nutrition of the neustonic communities in June, August, and September originated from the subsurface and bottom POM of the TWC rather than from the riverine discharge (Yangtze River and Korean rivers; Figures 4A, C). Furthermore, the nutritional source of the copepod community constituting the trophic group III (i.e., low-salinity area in August) was also calculated to be exclusively dependent upon the subsurface and bottom POM originating from the TWC (mean, 98.3%) than from the YRW (mean, 1.7%) (Figure 4B).
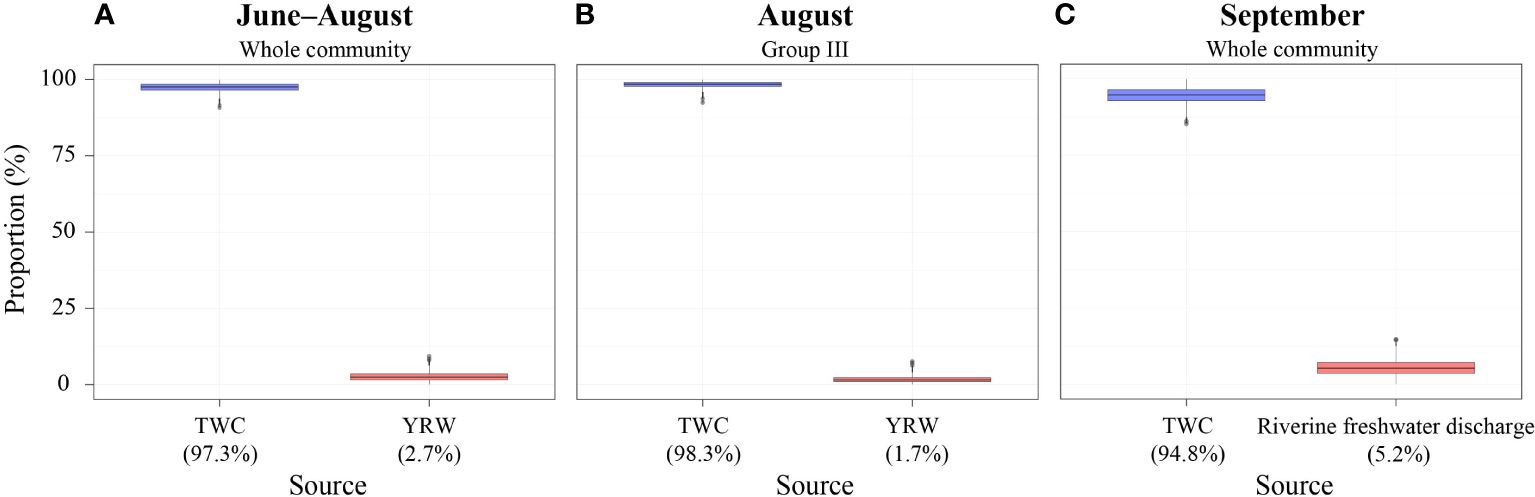
Figure 4 Comparison of the dietary compositions of the neustonic copepod community in (A) June–August, (B) August, and (C) September using a dietary mixing model. TWC, Tsushima Warm Current; YRW, Yangtze River Water.
4 Discussion
Despite the expected increase in the contribution of the POM originating from the YRDW during the summer, there were no observable conspicuous changes in the trophic niche (including trophic sources and positions) of neustonic copepods in the nECS. Our findings suggest that the primary sources of organic matter sustaining the neustonic copepod community were derived from POM produced within the TWC itself, rather than from river discharge. Although we observed slight temporal variations in trophic niche and Layman metrics, these variations were attributed to an increased contribution of phytoplankton locally produced in situ, rather than POM originating from rivers. Consequently, we sought to assess the relative importance of two factors: (1) the exclusive contribution of local POM and (2) the minimal contribution of riverine POM to support of the production of neustonic copepods in the nECS, as evidenced by our SIMMR mixing-model estimations.
4.1 Importance of local production for the community trophic niche
The δ13C and δ15N values of POM in the surface water varied according to sampling month and area and depended on oceanographic characteristics and biogeochemical processes (Michener and Kaufman, 2007). The δ13C values of marine POM typically vary from –18‰ to –23‰, whereas terrestrial POM exhibits a range of –25‰ to –28‰ (Meyers, 1997). In this study, an average range of –21.9‰ to –25.4‰ of POM of various sizes indicated a mixture of POM from terrestrial and marine origins (Table 2). The δ13C values of the POM derived from the Yangtze River estuary and riverine freshwater discharge from the Korean peninsula exhibited ranges of –23.7‰ to –26.4‰ and –24.1‰ to –26.9‰, respectively (Tan et al., 1991; Gal et al., 2012; Kang et al., 2020). Notably, it has been observed that the δ13C values tend to increase gradually with the increase in salinity from coastal regions to the open ocean (Tan et al., 1991; Wu et al., 2003; Gao et al., 2014). Consequently, the δ13C values observed across all POM sizes suggest a discernible influence of the mixing of riverine and marine sources. The δ15N values of POM across all size categories ranged from 4.7‰ to 8.0‰, falling within a range that was comparable to that of the copepod community (2.7‰–9.4‰). Notably, the δ15N values recorded in the vicinity of Jeju Island were also elevated, varying from 5.4‰ to 10.3‰ (Min et al., 2020). In coastal areas (low salinity), the δ15N values of POM increase due to the influence of wastewater inflowing in through riverine water (McClelland et al., 1997). Conversely, the δ15N values of POM in the open ocean (high salinity) are depleted due to the N2 fixation prevails by diazotrophs and Trichodesmium (Montoya et al., 2002; Wu et al., 2018). Nevertheless, POM of area affected by the TWC showed high δ15N values. Along the coast of Jeju Island, a large number of fish farms discharge wastewater with high nutrient concentrations, which contain high-protein fish tissue and feed, into the sea surrounding the island (Samanta et al., 2019; Lee et al., 2020). In addition, due to the recent increase in pig livestock, nitrate discharged from the farms flows into the under-ground water, and groundwater flows into the coastal seawater (Kim et al., 2021). For this reason, the high-concentration nutrients discharged from the Jeju Island may result in elevated δ15N values of POM as they are transported and diluted through the surrounding TWC. The surface layer, although potentially rich in food resources, is expected to host a higher concentration of predators, both visual and nonvisual (Leising et al., 2005). Based on the feeding activities of predators, such as chaetognaths and planktivorous fish, including those in the larval stages, we inferred that POM exhibited elevated δ15N values because of its higher organic matter content, including zooplankton detritus and proteins, compared with phytoplankton.
The δ13C values measured in neustonic copepods and the surface POM displayed a distinct discrepancy (Figure 2), indicating the complexity of the relationships among neustonic copepod communities. Notably, there was a clear distinction in neustonic copepods between areas A (low-salinity level) and B (high-salinity level) (Table 3). The influx of monsoon-induced river discharge has been identified as a factor that reduces the density of marine copepods (Chen et al., 2023). In area A (low-salinity level), which is affected by river discharge, the neustonic copepod communities refrained from feeding on the surface POM because of avoidance behaviors triggered by an osmotic and salinity acclimation stress (Saiz et al., 2022; Weissenberg et al., 2022). Conversely, in area B (high-salinity level), where the impact of river discharge is minimal, the neustonic copepod communities descended to avoid visual predators, such as chaetognaths and planktivorous fish, including those in the larval stages. Experimental evidence from a predator–prey system involving Acartia hudsonica revealed that, in the absence of visual predators, there was no vertical migration; however, such behavior was observed after the introduction of predators (Bollens and Frost, 1991). This pattern coincided with the arrival of krill and the subsequent response to predation by Calanus finmarchicus, which descended from the surface (Tarling et al., 2002). Considering the influence of predators and freshwater discharge, neustonic copepods are presumed to undergo vertical migration, selectively consuming POM in the subsurface chlorophyll maximum (SCM) or bottom layers. This selective strategy is interpreted as a means to enhance feeding success by increasing individual survival rates while concurrently reducing mortality rates.
The δ13C and δ15N values differed between areas in August and September, but not in June (Table 3). Approximately 60,000 tons of YRDW were discharged from the Yangtze River over the month of May (see “site description”). This discharge formed a tongue-shaped streamer that was propelled by persistent southeast monsoon winds, leading to the intermingling of areas A and B over time (Supplementary Figure 3). Subsequently, YRDW discharges decreased to 45,000 tons in August, whereas the TWC experienced a relative increase. In September, the intrusion of the TWC intensified, creating a broad frontal zone with the coastal waters of the SKCW. This water mass arrangement was also reflected in the trophic niche (Figure 3). The trophic-niche variation in neustonic copepods revealed the presence of distinct feeding strategies in response to the contrasting water masses. Neustonic copepods exhibit trophic flexibility, with a complex trophic structure that is affected by the environment (López-Ibarra et al., 2018; Albuquerque et al., 2021). In June and September, when the contrasting water masses became mixed, the trophic niche of the neustonic copepod community overlapped between the two areas; in contrast, this was not observed in August (Table 5). The trophic-niche overlap resulting from the mixing of contrasting water masses likely signifies an increased prey diversity and potential competition among organisms. Conversely, the clear separation of the water masses observed in August suggests a trophic shift in the neustonic copepod community, indicating a high prey diversity in each area. This underscores the high adaptability of neustonic copepods as flexible feeders, even in areas with diverse water masses, where specific feeding types are better suited to variations in prey availability under local conditions.
4.2 Characterization of trophic groups
The cluster analysis of neustonic copepods based on δ13C and δ15N values resulted in the broad categorization of the communities into two groups based on the month of collection (Figure 2). In June, P. yamadae, which is a neustonic copepod that is prevalent near the surface during the day and night, fell into group I, whereas L. rotunda was present in both groups I and IV. Pontellopsis yamadae, which is known for its raptorial feeding habit involving the consumption of copepodids or small copepods (such as Acartia, Euterpina, and Paracalanus) (Ohtsuka and Onbé, 1991), exhibited high δ15N values, presumably indicating the in situ consumption of large copepods. Labidocera rotunda, possessing a mouth structure and feeding habits similar to P. yamadae, was considered carnivorous in this study (Ohtsuka and Onbé, 1991). Despite its robust and sharp teeth (Anraku and Omori, 1963), the genus Labidocera can feed on phytoplankton. L. rotunda in group I was found to consume the copepod nauplii, small copepods (P. parvus s. l.), and dominant radiolarians (Ohtsuka and Onbé, 1991), resulting in elevated δ15N values (Supplementary Figure 1).
Conversely, group IV was linked to copepods that probably ingested phytoplankton particles with low δ15N values, possibly as a response to a copepod avoidance behavior triggered by river discharge. Calanus sinicus, which was identified as an indicator species of the Yellow Sea Bottom Cold Water, displayed the highest δ15N values (Wang et al., 2003). In coastal areas with nutrient input from river discharge, C. sinicus prefers nano- to microsized POM (Lee et al., 2012; Chen et al., 2018). Even in the Ulleung Basin, where river discharge is minimal, C. sinicus leans toward autotrophic and heterotrophic protozoa in the nano- to microsize range, rather than toward picosized prey (Yang et al., 2009). With the capability to consume substantial quantities of nonphytoplankton prey (Yang et al., 2009; Jang et al., 2010), C. sinicus exhibits higher δ15N values than carnivorous copepods because of the ingestion of a diverse range of prey with elevated δ15N values in the study area. In group V, P. parvus s. l., which has been characterized as a particle feeder, is believed to consume small-sized phytoplankton particles using short, sharp-edged teeth (Al-Hanoun and Mayya, 2020). During feeding experiments, Paracalanus species exhibited an increased rate of feeding ciliates and dinoflagellates within the size range of 15–20 μm, whereas the feeding rate on particles exceeding 40 μm was decreased (Suzuki et al., 1999). The observed low trophic position of P. parvus s. l. likely reflects its feeding preference for picoplankton, which is characterized by low δ15N values.
In August, the influence of contrasting water masses led to the clear differentiation of groups I, II, and III. In group I, L. acuta exhibited a feeding habit similar to that observed for L. rotunda in June. Among the particle feeders, it was reported that C. furcatus can feed on microzooplankton, including ciliates (Jang et al., 2010). The assessment of the food-source contribution of Centropages species confirmed their association with microsized POM (Chen et al., 2018). Acartia pacifica, which is a member of group I, selectively feeds on nanosized plankton (>20 μm) (Lee et al., 2012). Acartia pacifica can rapidly consume nanoflagellates more efficiently than large prey and shows a preference for tintinnid ciliates with shells among ciliates (Vargas and González, 2004; Gifford et al., 2007). Also in this group, C. pauper is known to feed on a variety of particles, ranging from phytoplankton to metazoan individuals (Hu et al., 2014), although the specific prey-size preferences have not been established well. Nevertheless, similar to that observed for C. sinicus, it is believed that they exhibit a selective feeding behavior on plankton larger than 20 μm (Jang et al., 2010; Lee et al., 2012). In group II, Temora discaudata displayed the ability to consume diatoms and dinoflagellate particles in the range of 3–106 μm, with a particular preference for food with a size between the pico- and nanorange (Turner, 1984a). The presence of groups I and II seemed to indicate the mitigation of interspecific competition by consuming prey with the sizes preferred by each taxon.
Surprisingly, group III, which was expected to exhibit decreased δ13C values because of the influence of river discharge, displayed enriched δ13C values compared with groups I and II. The copepods in group III exhibited high δ13C and δ15N values, potentially indicating the consumption of 13C-enriched phytoplankton, such as diatoms (Fry and Wainright, 1991), which can have relatively high δ15N values compared with other phytoplankton (Montoya and McCarthy, 1995). The significant increase in the δ15N values of T. discaudata in group II suggested a substantial consumption of diatoms, even though they are herbivorous prey. In particular, the δ15N values of T. discaudata in group II were significantly increased. A fatty acid and gut-content analysis revealed that species of the genus Temora are capable of feeding on small flagellates and copepod nauplii (Gentsch et al., 2009). This suggests that they act as particle feeders, consuming not only picosized phytoplankton but also both autotrophic and heterotrophic prey.
In September, the neustonic copepod species became intertwined because of the mixing of contrasting water masses. Undinula vulgaris, which was part of group I, exhibited an indiscriminate particle-feeding habit, as it consumed phytoplankton of various sizes and shapes (Turner, 1986). Specifically, U. vulgaris fed predominantly on nanosized plankton, dinoflagellates, and diatoms (Kleppel et al., 1996). Subeucalanus crassus displayed the ability to consume prey of diverse sizes, encompassing living and dead phytoplankton (diatoms and dinoflagellates), sediment, fecal pellets, and crustaceans (Turner, 1984b). Notably, this species exhibited a preference for nanosized plankton over other phytoplankton (Kleppel et al., 1996). Unlike most species that capture live prey, Eucalanidae species, including S. crassus, can also detect and consume dead prey (Turner, 1984b; Paffenhöfer and Van Sant, 1985), which is a feeding behavior that is considered a survival strategy to minimize the potential competition between species within the water column. Canthocalanus pauper and C. furcatus were allocated to groups I and II, respectively. Although the constituent species of groups I and II were intermingled, areas A and B appeared to be distinct. As mentioned previously, C. pauper and C. furcatus, which belong to group I in area B (with high salinity), primarily consumed nano- and microsized plankton, exhibiting high δ15N values. These species were presumed to have consumed plankton with lowered δ15N values, possibly because of the adverse effects of river discharge in group II located in area A (with a lower salinity).
Our SIMMR mixing-model calculation supports that neustonic copepod community rejects to feeding surface POM and reflecting vertical migration to subsurface and bottom layers caused by the possible influences of factors such as river discharge or the presence of visual and nonvisual predators. The SCM layer within the range of vertical migration contains phytoplankton that can be consumed by the neustonic copepods, but also contains toxic diatoms, dinoflagellates, or other harmful algae (Miralto et al., 1999; Pierson et al., 2005). So they can migrate to deep layer to find nutrient-replete and non-toxic preys (Im and Suh, 2019). Therefore, we suggest that further research is needed on feeding in the subsurface and bottom layers of the neustonic copepods. In the future, it is necessary to approach the prey and feeding ecology of neustonic copepod species through research such as culture experiments using video cameras to determine the sinking prey feeding behavior of copepods, DNA sequence analysis of gut-contents, and fatty acid analysis (Cleary et al., 2017; Van der Jagt et al., 2020; Cui et al., 2021).
5 Conclusion
We observed variations in the food-source composition of neustonic copepods according to the trophic group, rather than the salinity levels of the water masses. Although a distinct trophic-niche shift was observed between high- and low-salinity environments in August, the contribution of riverine POM to the diets of neustonic copepods was minimal, even in the low-salinity area. The neustonic copepod community exhibited no association with surface POM. This suggests the presence of intricate feeding relationships among trophic groups, reflecting vertical migration caused by the possible influences of factors such as river discharge or the presence of visual and nonvisual predators. Furthermore, our examination of trophic groups within the neustonic copepod community revealed differences in individual preferred prey sizes and types. These copepods, which were primarily characterized as opportunistic particle feeders, exhibited a capacity for navigating both inter- and intraspecific competition within water masses through selective feeding. Our SIMMR estimation, aimed at identifying the source water mass that affected the food consumed by neustonic copepods, highlighted a predominant reliance on dietary items of derived from the TWC. This aligns with the existing literature, supporting the notion of a minimal influence from river-derived material on ocean phytoplankton productivity (Mutia et al., 2021). Consequently, it can be inferred that the marine neustonic copepod community is not significantly dependent on freshwater-originated food. In future studies, a comprehensive examination incorporating other zooplankton taxonomic groups, together with neustonic copepods, would provide a more detailed understanding of the entire planktonic food web.
Data availability statement
The original contributions presented in the study are included in the article/Supplementary Material. Further inquiries can be directed to the corresponding authors.
Ethics statement
The manuscript presents research on animals that do not require ethical approval for their study.
Author contributions
JHC: Writing – review & editing, Writing – original draft, Visualization, Validation, Methodology, Investigation, Formal analysis, Data curation, Conceptualization. YK: Writing – review & editing, Methodology, Conceptualization. C-KK: Writing – review & editing, Validation, Conceptualization. HYS: Writing – review & editing, Funding acquisition.
Funding
The author(s) declare financial support was received for the research, authorship, and/or publication of this article. This study was supported by ‘Predictable Effects of Climate Change on Marine Ecosystem in The Tsushima Warm Current System of Korean Waters’ program of Korea Institute of Marine Science and Technology Promotion (KIMST) funded by the Ministry of Oceans and Fisheries (KIMST-20220558). It was also part of the project, titled “Research center for fishery resource management based on the information and communication technology”, funded by the Ministry of Oceans and Fisheries, Korea (RS-2018-KS181192).
Acknowledgments
We would like to express our gratitude to the reviewers for their insightful suggestions and comments. We also thank the crew of the research vessel Saedongbaek from Chonnam National University for their support during our fieldwork.
Conflict of interest
The authors declare that the research was conducted in the absence of any commercial or financial relationships that could be construed as a potential conflict of interest.
Publisher’s note
All claims expressed in this article are solely those of the authors and do not necessarily represent those of their affiliated organizations, or those of the publisher, the editors and the reviewers. Any product that may be evaluated in this article, or claim that may be made by its manufacturer, is not guaranteed or endorsed by the publisher.
Supplementary material
The Supplementary Material for this article can be found online at: https://www.frontiersin.org/articles/10.3389/fmars.2024.1378025/full#supplementary-material
Supplementary Figure 1 | The dominant radiolarians in the area B in June. The radiolarians were observed in gut of Labidocera rotunda.
Supplementary Figure 2 | Hierarchical clustering of the average δ13C and δ15N values of neustonic copepods in June, August, and September for study areas A and B using the Bray–Curtis similarity (average grouping method).
Supplementary Figure 3 | (A) Ocean prediction data based on marine numerical models provided by the ocean and fisheries research institute in the Jeju special self-governed province showing salinity distribution. (B) Water temperature–salinity diagram to determine the point of introduction of the Yangtze River Diluted Water into the areas A and B in northeastern East China Sea. The dotted line indicates the criteria for water with abnormally low salinity (>22 °C, 25–30) (Hyun and Pang, 1998). During the study period, approximately 60,000 tons of the YRDW were discharged continuously from the Yangtze River a month before the survey (end of May) was conducted (see ‘site description’). Furthermore, the southeast monsoon winds blow to form a tongue-shaped ‘streamer’. The ‘streamer’ phenomenon was observed in area A in June (Figure 1). Accordingly, water temperature–salinity diagram was drawn to identified how much YRDW had flowed into the study area in June, and abnormally low-salinity water inflow was observed according to water temperature (>22 °C) and salinity (25–30). Because of the continuous inflow of YRDW and active surface mixing caused by the persistent southeast monsoon winds, it was judged that there was little difference between the δ13C values of POM in areas A and B in June.
References
Acros F., Fleminger M. (1986). Distribution of filter-feeding calanoid copepods in the eastern equatorial pacific. CalCOFI Rep. La jolla, California, 27, 170–187.
Albuquerque R., Bode A., González-Gordillo J. I., Duarte C. M., Queiroga H. (2021). Trophic structure of neuston across tropical and subtropical oceanic provinces assessed with stable isotopes. Front. Mar. Sci. 7. doi: 10.3389/fmars.2020.606088
Al-Hanoun K., Mayya W. (2020). Feeding of paracalanus parvus (Claus 1863) order calanoida (Copepoda) in the coastal waters of baniyas (Eastern mediterranean). SSRG Int. J. Agric. Env. Sci. 7, 54–61. doi: 10.14445/23942568/IJAES-V7I4P108
Anderson O. R. (2001). “Protozoa, radiolarians,” in Encyclopedia of Ocean Sciences. Eds. Steve A. T., Turekian K. K. (Academic Press, Oxford, UK), 613–617.
Anderson M. J. (2017). “Permutational multivariate analysis of variance (PERMANOVA),” in Wiley statsRef: Statistics Reference Online (Hoboken, New Jersey: John Wiley and Sons, Ltd), 1–15. doi: 10.1002/9781118445112.stat07841
Anraku M., Omori M. (1963). Preliminary survey of the relationship between the feeding habit and the structure of the mouth-parts of marine copepods 1. Limnol. Oceanogr. 8, 116–126. doi: 10.4319/lo.1963.8.1.0116
Bai H., Wang Y., Zhang T., Dai F., Huang L., Sun Y. (2021). Determination of trophic levels of marine fish in the Yellow Sea and northern East China Sea using nitrogen stable isotope (δ15N) analysis of otoliths. J. Oceanol. Limnol. 40, 634–642. doi: 10.1007/s00343-021-0388-3
Baker R., Buckland A., Sheaves M. (2014). Fish gut content analysis: robust measures of diet composition. Fish Fish 15, 170–177. doi: 10.1111/faf.12026
Bodin N., Le Loc’h F., Hily C. (2007). Effect of lipid removal on carbon and nitrogen stable isotope ratios in crustacean tissues. J. Exp. Mar. Bio. Ecol. 341, 168–175. doi: 10.1016/j.jembe.2006.09.008
Bollens S. M., Frost B. W. (1991). Diel vertical migration in zooplankton: rapid individual response to predators. J. Plankton Res. 13, 1359–1365. doi: 10.1093/plankt/13.6.1359
Chen X., Cui Z., Zhang Y., Zhang X., Chen J., Wei Y. (2023). Contrasting effects of river inflow and seawater intrusion on zooplankton community structure in Jiaozhou bay, the Yellow Sea. Mar. Environ. Res. 192, 106194. doi: 10.1016/j.marenvres.2023.106194
Chen M., Kim D., Liu H., Kang C. K. (2018). Variability in copepod trophic levels and feeding selectivity based on stable isotope analysis in Gwangyang Bay of the southern coast of the Korean Peninsula. Biogeosciences 15, 2055–2073. doi: 10.5194/bg-15-2055-2018
Chi X., Dierking J., Hoving H. J., Luskow F., Denda A., Christiansen B., et al. (2020). Tackling the jelly web: Trophic ecology of gelatinous zooplankton in oceanic food webs of the eastern tropical Atlantic assessed by stable isotope analysis. Limnol. Oceanogr. 66, 289–305. doi: 10.1002/lno.11605
Choi J. H., Kim D. J., Soh H. Y. (2020). Environmental factors affecting neustonic zooplankton in the southwestern area of Korea in summer. Korean J. Environ. Biol. 38, 461–475. doi: 10.11626/KJEB.2020.38.3.461
Cleary A. C., Søreide J. E., Freese D., Niehoff B., Gabrielsen T. M. (2017). Feeding by Calanus glacialis in a high arctic fjord: potential seasonal importance of alternative prey. ICES J. Mar. Sci. 74, 1937–1946. doi: 10.1093/icesjms/fsx106
Cui S., Li Y., Liu L., Wang Q., Chen F. (2021). Changes in astaxanthin and fatty acid concentrations during the developmental process in the calanoid Arctodiaptomus walterianus in an alpine lake at low latitudes. J. Plankton Res. 43, 314–324. doi: 10.1093/plankt/fbab019
Dipper F. (2022). “Open water lifestyles: marine plankton,” in Element of Marine Ecology, 5ed. Ed. Dipper F. (Elseiver, Butterworth-Heinemann, Cambridge, UK), 229–255.
Fry B., Wainright S. C. (1991). Diatom sources of 13C-rich carbon in marine food webs. Mar. Ecol. Prog. Ser. 76, 149–157. doi: 10.3354/meps076149
Gal J. K., Kim M. S., Lee Y. J., Seo J., Shin K. H. (2012). Food web of aquatic ecosystem within the Tamjin River through the determination of carbon and nitrogen stable isotope ratios. Korean J. Limnol. 45, 242–251.
Gao L., Li D., Ishizaka J. (2014). Stable isotope ratios of carbon and nitrogen in suspended organic matter: Seasonal and spatial dynamics along the Changjiang (Yangtze River) transport pathway. J. Geophys. Res. Biogeosci. 119, 1717–1737. doi: 10.1002/2013JG002487
Gentsch E., Kreibich T., Hagen W., Niehoff B. (2009). Dietary shifts in the copepod Temora longicornis during spring: evidence from stable isotope signatures, fatty acid biomarkers and feeding experiments. J. Plankton Res. 31, 45–60. doi: 10.1093/plankt/fbn097
George D., Mallery P. (2019). IBM SPSS statistics 26 step by step: A simple guide and reference (New York: Routledge). 1–402. doi: 10.4324/9780429056765
Gifford S. M., Rollwagen-Bollens G., Bollens S. M. (2007). Mesozooplankton omnivory in the upper San Francisco Estuary. Mar. Ecol. Prog. Ser. 348, 33–46. doi: 10.3354/meps07003
Hirabayasi T., Ohtsuka S., Urata M., Tomikawa K., Tanaka H. (2016). Molecular evidence on evolutionary switching from particle-feeding to sophisticated carnivory in the calanoid copepod family Heterorhabdidae: drastic and rapid changes in functions of homologues. J. Nat. Hist. 50, 1–14. doi: 10.1080/00222933.2016.1155779
Hu S., Guo Z., Li T., Carpenter E. J., Liu S., Lin S. (2014). Detecting in situ copepod diet diversity using molecular technique: development of a copepod/symbiotic ciliate–excluding eukaryote–inclusive PCR protocol. PloS One 9, e103528. doi: 10.1371/journal.pone.0103528
Hyun K. H., Pang I. C. (1998). Abnormally low salinity waters around Cheju Island in summer. Bull. Mar. Res. Inst. Cheju Nat. Univ. 22, 69–78.
Im D. H., Suh H. L. (2019). Evidence for resource partitioning by ontogeny and species in calanoid copepods. Prog. Oceanogr. 176, 102111. doi: 10.1016/j.pocean.2019.05.003
Im D. H., Suh H. L. (2023). Trophic positions of sympatric copepods across the subpolar front of the East Sea during spring: a stable isotope approach. Water 15, 416. doi: 10.3390/w15030416
Im D. H., Wi J. H., Suh H. L. (2015). Evidence for ontogenetic feeding strategies in four calanoid copepods in the East Sea (Japan Sea) in summer, revealed by stable isotope analysis. Ocean Sci. J. 50, 481–490. doi: 10.1007/s12601-015-0044-y
Jackson A. L., Inger R., Parnell A. C., Bearhop S. (2011). Comparing isotopic niche widths among and within communities: SIBER–Stable Isotope Bayesian Ellipses in R. J. Anim. Ecol. 80, 595–602. doi: 10.1111/jane.2011.80.issue-3
Jang M. C., Shin K., Lee T., Noh I. (2010). Feeding selectivity of calanoid copepods on phytoplankton in Jangmok Bay, south coast of Korea. Ocean Sci. J. 45, 101–111. doi: 10.1007/s12601-010-0009-0
Jeong H. G., Suh H. L., Lee W., Soh H. Y. (2014). Seasonal variation of the neustonic zooplankton community in southern waters of Korea. Ocean Sci. J. 49, 167–181. doi: 10.1007/s12601-014-0017-6
Ju S. J., Ko A. R., Lee C. R. (2011). Latitudinal Variation of Nutritional Condition and Diet for Copepod Species, Euchaeta sp. and Pleuromamma spp., from the Northwest Pacific Ocean Using Lipid Biomarkers. Ocean Polar Res. 33, 349–358. doi: 10.4217/OPR.2011.33.3.349
Kaji T., Song C., Murata K., Nonaka S., Ogawa K., Kondo Y., et al. (2019). Evolutionary transformation of mouthparts from particle-feeding to piercing carnivory in Viper copepods: Review and 3D analyses of a key innovation using advanced imaging techniques. Front. Zool. 16, 1–14. doi: 10.1186/s12983-019-0308-y
Kang H. Y., Kim C., Kim D., Lee Y. J., Park H. J., Kundu G. K., et al. (2020). Identifying patterns in the multitrophic community and food-web structure of a low-turbidity temperate estuarine bay. Sci. Rep. 10, 16637. doi: 10.1038/s41598-020-73628-6
Kang H. Y., Lee Y.-J., Kim C., Kim D., Kim D.-H., Kim J.-H., et al. (2021). Food Web Trophic Structure at Marine Ranch Sites off the East Coast of Korea. Front. Mar. Sci. 8. doi: 10.3389/fmars.2021.653281
Kang J. J., Oh H. J., Youn S. H., Park Y., Kim E., Joo H. T. (2022). Estimation of phytoplankton size classes in the littoral sea of korea using a new algorithm based on deep learning. Mar. Sci. Eng. 10, 1450. doi: 10.10.3390/jmse10101450
Kim S. H., Kim H. R., Yu S., Kang H. J., Hyun I. H., Song Y. C., et al. (2021). Shift of nitrate sources in groundwater due to intensive livestock farming on Jeju Island, South Korea: with emphasis on legacy effects on water management. Water Res. 191, 116814. doi: 10.1016/j.watres.2021.116814
Kim J., Yun H. Y., Won E. J., Choi H., Youn S. H., Shin K. H. (2022). Influences of seasonal variability and potential diets on stable isotopes and fatty acid compositions in dominant zooplankton in the East Sea. Korea. J. Mar. Sci. Eng. 10, 1768. doi: 10.3390/jmse10111768
Kleppel G. S., Burkart C. A., Carter K., Tomas C. (1996). Diets of calanoid copepods on the West Florida continental shelf: relationships between food concentration, food composition and feeding activity. Mar. Biol. 127, 209–217. doi: 10.1007/BF00942105
Layman C. A., Arrington D. A., Montaña C. G., Post D. M. (2007). Can stable isotope ratios provide for community-wide measures of trophic structure? Ecol 88, 42–48. doi: 10.1890/0012-9658(2007)88[42:csirpf]2.0.co;2
Lee T., Moon J. H., Jung S. K., Park G., Kwon S., Min S. H., et al. (2020). Changes in the nutrient budget due to physiochemical factors in the coastal area of Jeju, Korea. J. Coast. Res. 95, 57–61. doi: 10.2112/SI95-011.1
Lee D. B., Song H. Y., Park C., Choi K. H. (2012). Copepod feeding in a coastal area of active tidal mixing: diel and monthly variations of grazing impacts on phytoplankton biomass. Mar. Ecol. 33, 88–105. doi: 10.1111/j.1439-0485.2011.00453.x
Leising A. W., Pierson J. J., Cary S., Frost B. W. (2005). Copepod foraging and predation risk within the surface layer during night-time feeding forays. J. Plankton Res. 27, 987–1001. doi: 10.1093/plankt/fbi084
Lie H. J., Cho C. H. (2016). Seasonal circulation patterns of the Yellow and East China Seas derived from satellite-tracked drifter trajectories and hydrographic observations. Prog. Oceanogr. 146, 121–141. doi: 10.1016/j.pocean.2016.06.004
López-Ibarra G. A., Bode A., Hernández-Trujillo S., Zetina-Rejón M. J., Arreguín-Sánchez F. (2018). Trophic position of twelve dominant pelagic copepods in the eastern tropical Pacific Ocean. J. Mar. Syst. 187, 13–22. doi: 10.1016/j.jmarsys.2018.06.009
Matsuzaki K. M., Itaki T., Kimoto K. (2016). Vertical distribution of polycystine radiolarians in the northern East China Sea. Mar. Micropaleontol. 125, 66–84. doi: 10.1016/j.marmicro.2016.03.004
McClelland J. W., Valiela I., Michener R. H. (1997). Nitrogen-stable isotope signatures in estuarine food webs: A record of increasing urbanization in coastal watersheds. Limnol. Oceanogr. 42, 930–937. doi: 10.4319/lo.1997.42.5.0930
McCutchan J. H. Jr., Lewis W. M. Jr., Kendall C., McGrath C. C. (2003). Variation in trophic shift for stable isotope ratios of carbon nitrogen, and sulfur. Oikos 102, 378–390. doi: 10.1034/j.1600-0706.2003.12098.x
Meng Q., Li P., Zhai F., Gu Y. (2020). The vertical mixing induced by winds and tides over the Yellow Sea in summer: a numerical study in 2012. Ocean Dyn. 70, 847–861. doi: 10.1007/s10236-020-01368-2
Meyers P. A. (1997). Organic geochemical proxies of paleoceanographic, paleolimnologic, and paleoclimatic processes. Org. Geochem. 27, 213–250. doi: 10.1016/S0146-6380(97)00049-1
Michels J., Stanislav N. G. (2015). Mandibular gnathobases of marine planktonic copepods – feeding tools with complex micro- and nanoscale composite architectures. Beilstein J. Nanotechnol. 6, 674–685. doi: 10.3762/bjnano.6.68
Michener R., Kaufman L. (2007). “Stable isotope ratios as tracers in marine food webs: an update,” in book: Stable Isotopes in Ecology and Environmental Science, 2nd (Wiley-Blackwell, Oxford), 238–282. doi: 10.1002/9780470691854
Min J. O., Lee C. H., Youn S. H. (2020). Food-web structures in the lower trophic levels of the korean seas (East sea, west sea, south sea, and east China sea) during the summer season: using carbon and nitrogen stable isotopes. J. Korean Soc Mar. Environ. Saf. 26, 493–505. doi: 10.7837/kosomes.2020.26.5.493
Minagawa M., Wada E. (1984). Stepwise enrichment of 15N along food chains: further evidence and the relation between 15N and animal age. Geochim. Cosmochim. Acta 48, 1135–1140. doi: 10.1016/0016-7037(84)90204-7
Mintenbeck K., Brey T., Jacob U., Knust R., Struck U. (2008). How to account for the lipid effect on carbon stable-isotope ratio (δ13C): sample treatment effects and model bias. J. Fish Biol. 72, 815–830. doi: 10.1111/j.1095-8649.2007.01754.x
Miralto A., Barone G., Romano G., Poulet S. A., Lanora A., Russo G. L., et al. (1999). The insidious effects of diatoms on copepod reproduction. Nature 402, 173–176. doi: 10.1038/46023
Montoya J. P., Carpenter E. J., Capone D. G. (2002). Nitrogen fixation and nitrogen isotope abundances in zooplankton of the oligotrophic North Atlantic. Limnol. Oceanogr. 47, 1617–1628. doi: 10.4319/lo.2002.47.6.1617
Montoya J. P., McCarthy J. J. (1995). Isotopic fractionation during nitrate uptake by phytoplankton grown in continuous culture. J. Plankton Res. 17, 439–464. doi: 10.1093/plankt/17.3.439
Mutia D. M., Carpenter S., Jacobs Z., Jebri F., Kamau J. N., Kelly S. J., et al. (2021). Productivity driven by Tana river discharge is spatially limited in Kenyan coastal waters. Ocean Coast. Manage. 211, 105713. doi: 10.1016/j.ocecoaman.2021.105713
Naumann E. (1917). Beiträge zur kenntnis des teichnanno-planktons. II. Über das neuston des Süsswassers. Biol. Zentbl. 37, 98–106.
Nishida S., Ohtsuka S. (1996). Specialized feeding mechanism in the pelagic copepod genus Heterorhabdus (Calanoida: Heterorhabdidae), with special reference to the mandibular tooth and labral glands. Mar. Biol. 126, 619–632. doi: 10.1007/BF00351329
Ohman M. D., Runge J. A. (1994). Sustained fecundity when phytoplankton resources are in short supply: omnivory by Calanus finmarchicus in the Gulf of St. Lawrence. Limnol. Oceanogr. 39, 21–36. doi: 10.4319/lo.1994.39.1.0021
Ohtsuka S., Onbé T. (1991). Relationship between mouthpart structures and in situ feeding habits of species of the family Pontellidae (Copepoda: Calanoida). Mar. Biol. 111, 213–225. doi: 10.1007/BF01319703
Paffenhöfer G. A., Van Sant K. B. (1985). The feeding response of a marine planktonic copepod to quantity and quality of particles. Mar. Ecol. Prog. Ser. 27, 55–65. doi: 10.3354/meps027055
Park K. A., Park J. E., Choi B. J., Lee S. H., Shin H. R., Lee S. R., et al. (2017). Schematic maps of ocean currents in the Yellow Sea and the East China Sea for science textbooks based on scientific knowledge from oceanic measurements. J. Korean Soc Oceanogr. 22, 151–171. doi: 10.7850/jkso.2017.22.4.151
Parnell A. C., Inger R., Bearhop S., Jackson A. L. (2010). Source partitioning using stable isotopes: coping with too much variation. PloS One 5, e9672. doi: 10.1371/journal.pone.0009672
Parnell A. C., Phillips D. L., Bearhop S., Semmens B. X., Ward E. J., Moore J. W., et al. (2013). Bayesian stable isotope mixing models. Environmetrics 24, 387–399. doi: 10.1002/env.2221
Pierson J. J., Halsband-Lenk C., Leising A. W. (2005). Reproductive success of Calanus pacificus during diatom blooms in Dabob Bay, WA. Prog. Oceanogr. 67, 314–331. doi: 10.1016/j.pocean.2005.09.002
Pizarro J., Docmac F., Harrod C. (2019). Clarifying a trophic black box: stable isotope analysis reveals unexpected dietary variation in the Peruvian anchovy Engraulis ringens. PeerJ 7, e6968. doi: 10.7717/peerj.6968
Post D. M. (2002). The long and short of food-chain length. Trends Ecol. Evol. 17, 269–277. doi: 10.1016/S0169-5347(02)02455-2
Price H. J., Paffenhöfer G. A. (1986). Capture of small cells by the copepod Eucalanus elongatus1. Limnol. Oceanogr. 31, 189–194. doi: 10.4319/lo.1986.31.1.0189
Rawlinson K. A., Davenport J., Barnes D. K. A. (2005). Temporal variation in diversity and community structure of a semi-isolated neuston community. Biol. Environ.: Proc. R. Irish Acad. 105B, 107–122. doi: 10.1353/bae.2005.a809844
Razouls C., Desreumaux N., Kouwenberg J., de Bovée F. (2005–2024a) Biodiversity of Marine Planktonic Copepods (morphology, geographical distribution and biological data) (Sorbonne University, CNRS). Available online at: http://copepodes.obs-banyuls.fr/en (Accessed March 02, 2024).
R Core Team (2013). R: A language and environment for statistical computing (Vienna, Austria). Available at: https://www.R-project.org/.
Saiz E., Griffell K., Olivares M., Solé M., Theodorou I., Calbet A. (2022). Reduction in thermal stress of marine copepods after physiological acclimation. J. Plankton Res. 44, 427–442. doi: 10.1093/plankt/fbac017
Samanta P., Shin S., Jang S., Song Y. C., Oh S., Kim J. K. (2019). Stable carbon and nitrogen isotopic characterization and tracing nutrient sources of Ulva blooms around Jeju coastal areas. Environ. pollut. 254, 113033. doi: 10.1016/j.envpol.2019.113033
Schmidt K., McClelland J. W., Mente E., Montoya J. P., Atkinson A., Voss M. (2004). Trophic-level interpretation based on 15N values: implications of tissue-specific fractionation and amino acid composition. Mar. Ecol. Prog. Ser. 266, 43–58. doi: 10.3354/meps266043
Shannon C. E., Weaver W. (1963). The Mathematical Theory of Communication (Urbana: University of Illinois Press), 345. first published in 1949.
Smyntek P. M., Teece M. A., Schulz K. L., Thackeray S. J. (2007). A standard protocol for stable isotope analysis of zooplankton in aquatic food web research using mass balance correction models. Limnol. Oceanogr. 52, 2135–2146. doi: 10.4319/lo.2007.52.5.2135
Suzuki K., Nakamura Y., Hiromi J. (1999). Feeding by the small calanoid copepod Paracalanus sp. on heterotrophic dinoflagellates and ciliates. Aquat. Microb. Ecol. 17, 99–103. doi: 10.3354/ame017099
Syväranta J., Lensu A., Marjomäki T. J., Oksanen S., Jones R. I. (2013). An empirical evaluation of the utility of convex hull and standard ellipse areas for assessing population niche widths from stable isotope data. PloS One 8, e56094. doi: 10.1371/journal.pone.0056094
Tan F. C., Cai D. L., Edmond J. M. (1991). Carbon isotope geochemistry of the Changjiang Estuary. Estuar. Coast. Shelf Sci. 32, 395–403. doi: 10.1016/0272-7714(91)90051-C
Tarling G. A., Jarvis T., Emsley S. M., Matthews J. B. L. (2002). Midnight sinking behaviour in Calanus finmarchicus: a response to satiation or krill predation? Mar. Ecol. Prog. Ser. 240, 183–194. doi: 10.3354/meps240183
Turner J. T. (1984a). Zooplankton feeding ecology: contents of fecal pellets of the copepods Temora turbinata and T. stylifera from continental shelf and slope waters near the mouth of the Mississippi River. Mar. Biol. 82, 73–83. doi: 10.1007/BF00392765
Turner J. T. (1984b). Zooplankton feeding ecology: Contents of fecal pellets of the copepods Eucalanus pileatus and Paracalanus quasimodo from continental shelf waters of the Gulf of Mexico. Marine ecology progress series. Mar. Ecol. Prog. Ser. 15, 27–46. doi: 10.3354/meps015027
Turner J. T. (1986). Zooplankton feeding ecology: contents of fecal pellets of the copepod Undinula vulgaris from continental shelf waters of the Gulf of Mexico. Mar. Ecol. 7, 1–14. doi: 10.1111/j.1439-0485.1986.tb00144.x
Turner J. T. (2015). Zooplankton fecal pellets, marine snow, phytodetritus and the ocean’s biological pump. Prog. Oceanogr. 130, 205–248. doi: 10.1016/j.pocean.2014.08.005
Van der Jagt H., Wiedmann I., Hildebrandt N., Niehoff B., Iversen M. H. (2020). Aggregate feeding by the copepods Calanus and Pseudocalanus controls carbon flux attenuation in the Arctic shelf sea during the productive period. Front. Mar. Sci. 7. doi: 10.3389/fmars.2020.543124
Vargas C. A., González H. E. (2004). Plankton community structure and carbon cycling in a coastal upwelling system. I. Bacteria, microprotozoans and phytoplankton in the diet of copepods and appendicularians. Aquat. Microb. Ecol. 34, 151–164. doi: 10.3354/ame034151
Wang P., Zhang F., Liu M., Sun S., Xian H. (2020). Isotopic evidence for size-based dietary shifts in the jellyfish Cyanea nozakii in the northern East China Sea. J. Plankton Res. 42, 689–701. doi: 10.1093/plankt/fbaa042
Wang R., Zuo T., Wang K. (2003). The Yellow Sea Cold Bottom Water - an oversummering site for Calanus sinicus (Copepoda, Crustacea). J. Plankton Res. 25, 169–183. doi: 10.1093/plankt/25.2.169
Weissenberg E. V., Monttola G., Uurasmaa T. M., Anttila K., Engstrom-Ost J. (2022). Combined effect of salinity and temperature on copepod reproduction and oxidative stress in brackish-water environment. Front. Mar. Sci. 9. doi: 10.3389/fmars.2022.952863
Wu C., Fu F. X., Sun J., Thangaraj S., Pujari L. (2018). Nitrogen Fixation by Trichodesmium and unicellular diazotrophs in the northern South China Sea and the Kuroshio in summer. Sci. Rep. 8, 2415. doi: 10.1038/s41598-018-20743-0
Wu C. H., Hwang J. S., Yang J. S. (2004). Diets of three copepods (Poecilostomatoida) in the southern Taiwan Strait. Zool. Stud. 43, 388–392.
Wu Y., Zhang J., Li D. J., Wei H., Lu R. X. (2003). Isotope variability of particulate organic matter at the PN section in the East China Sea. Biogeochemistry 65, 31–49. doi: 10.1023/A:1026044324643
Yang E. J., Kang H. K., Yoo S., Hyun J. H. (2009). Contribution of auto-and heterotrophic protozoa to the diet of copepods in the Ulleung Basin, East Sea/Japan Sea. J. Plankton Res. 31, 647–659. doi: 10.1093/plankt/fbp014
Yoon Y. H., Park J. H., Lee H. J., Soh H. Y. (2020). Characteristics of ecological structure and spatial distribution of micro-plankton in relation to water masses in the northern East China Sea (nECS) in summer 2019. Korean J. Environ. Biol. 38, 355–370. doi: 10.11626/KJEB.2020.38.3.355
Keywords: neustonic copepods, Tsushima warm current, Yangtze River Diluted Water, stable isotopes, trophic niche
Citation: Choi JH, Kang Y, Kang C-K and Soh HY (2024) Trophic niche of a neustonic copepod community sustained by local production in high- and low-salinity summer water masses in the northeastern East China Sea. Front. Mar. Sci. 11:1378025. doi: 10.3389/fmars.2024.1378025
Received: 29 January 2024; Accepted: 14 March 2024;
Published: 28 March 2024.
Edited by:
Siu Gin Cheung, City University of Hong Kong, Hong Kong SAR, ChinaReviewed by:
Min-Seob Kim, National Institute of Environmental Research (NIER), Republic of KoreaHyuntae Choi, Hanyang University, Republic of Korea
Copyright © 2024 Choi, Kang, Kang and Soh. This is an open-access article distributed under the terms of the Creative Commons Attribution License (CC BY). The use, distribution or reproduction in other forums is permitted, provided the original author(s) and the copyright owner(s) are credited and that the original publication in this journal is cited, in accordance with accepted academic practice. No use, distribution or reproduction is permitted which does not comply with these terms.
*Correspondence: Chang-Keun Kang, Y2trYW5nQGdpc3QuYWMua3I=; Ho Young Soh, aHlzb2hAam51LmFjLmty