 Ye Meng
 Zhipeng Qu
 Xueyan Li2,3
- 1College of Engineering, Ocean University of China, Qingdao, China
- 2Coast Institute and Institute of Sea-Crossing Engineering, Ludong University, Yantai, China
- 3Key Laboratory of Coastal Disasters and Defence of Ministry of Education, Hohai University, Nanjing, China
- 4Yinjiang Water Conservancy Management Station in Haishu District, Ningbo, China
- 5Shandong Provincial Key Laboratory of Ocean Engineering, Qingdao, China
Due to the influence of storm surges, hard coastal protection structures may exacerbate beach erosion, hence beach nourishment methods are considered in coastal protection and restoration efforts. An experiment is conducted in a wave flume to compare the advantages and disadvantages of three types of beach nourishment methods (berm nourishment, profile nourishment, and bar nourishment) under non-storm and storm wave conditions. The experiment analyzes wave height distribution, beach morphology changes, net sediment transport, shoreline recession, beach width increase, and beach volume changes. The findings indicate that the implementation of bar nourishment strategies facilitates the pre-breaking of storm waves, thereby mitigating the disruption caused by wave breaking on water flow dynamics. Moreover, the application of berm and profile nourishment methods proves to be highly effective in expanding the width of the beach and bolstering its stability. However, it is worth noting that bar nourishment exhibits limited efficacy in terms of restoring beach berms and mitigating coastal erosion within the same duration of wave action. The study presents two equations incorporating hydrodynamic parameters to predict the erosion or accretion status of beaches, and compares the predicted results with experimental data, thereby refining the criteria and making the formulas more applicable to beach nourishment projects. These findings provide valuable insights into the strengths and weaknesses of different beach nourishment methods, which will contribute to the implementation of nourishment projects.
1 Introduction
Traditional methods of coastal protection have relied on the construction of hard structures such as dikes, breakwaters, seawalls, and revetments to mitigate the impact of waves and prevent sediment movement along the shore (André et al., 2016; Chen et al., 2017; Chi et al., 2023). While hard structures may provide temporary protection against coastal erosion, they do not address the root causes of erosion and may even have secondary impacts on the coastline. For example, in recent years, the construction of artificial structures has led to noticeable beach erosion in the Wanpingkou Beach of Rizhao, Shandong Province (Yin et al., 2018). Recognizing the limitations of hard structures in coastal protection, there has been a growing trend towards the use of soft coastal protection methods in coastal engineering. These methods aim to restore the natural state of the coast by leveraging local dynamic conditions (Gee, 1965; Chen et al., 2022). One such soft solution is beach nourishment, which involves artificially creating a more robust sand environment for eroded beaches, rather than directly combating sediment loss. Beach nourishment effectively dissipates wave energy on the shore surface, providing immediate relief for eroding beaches, while also serving as a long-term source of sand for beach protection (Barnard et al., 2009).
Beach nourishment is a process that involves two main aspects: sediment supply in the nearshore area to compensate for erosion-induced sediment losses on the upper nearshore profile, and the dissipation of wave energy to allow waves to break further offshore, thus protecting the beach surface (van Duin et al., 2004; Grunnet et al., 2005). Artificial beach nourishment can be categorized into four types based on the location of sand replenishment (Seymour et al., 1995): dune nourishment, nourishment of subaerial beach(the sand supply area is similar to the berm nourishment), profile nourishment, and bar nourishment. Dune nourishment requires a substantial amount of sand, while nourishment of subaerial beach necessitates continuous monitoring and post-replenishment activities. Profile nourishment entails intricate sand replenishment techniques, with the replenished beach susceptible to storm surge damage. Bar nourishment poses implementation challenges, involving the construction of numerous artificial sandbars below the mean low tide level, parallel to the shore.
During the beach nourishment project, cross-shore sediment transport is vital for the implementation of effective nourishment strategies, which is primarily governed by a combination of wave-induced processes and tidal currents (Li et al., 2023; Zhang et al., 2024). Waves play a crucial role in the movement of sediment across the shore, as they generate currents that drive sediment transport. The swash and backwash processes associated with waves carry sediment landward and seaward, respectively, causing a net sediment movement. Tidal currents also influence sediment transport by exerting additional forces on the shoreline, redistributing sediment in response to the changing water levels (Khoury et al., 2019; Qu et al., 2023). Furthermore, alongshore sediment transport is responsible for shaping coastal features such as spits, barrier islands, and tombolos (Kobayashi et al., 2007; McCall et al., 2010). These features not only contribute to the dynamic nature of the coastline but also protect inland areas from wave action. The direction and intensity of prevailing waves and currents determine whether added sand will remain near the nourishment site or be transported elsewhere (Herman et al., 2021). In areas with high transport rates, nourished sand may be quickly dispersed, reducing the project’s lifespan. This necessitates more frequent replenishments or larger initial volumes of sand to maintain beach stability over time.
Physical model tests serve as a reliable research method to replicate beach nourishment in a realistic, objective, and vivid manner. Numerous physical model experiments have been conducted to investigate the impact of beach nourishment on nearshore sediment movement and hydrodynamic characteristics (Grasso et al., 2011; Larsen et al., 2023). Through the laboratory study on sediment spread rate, Work and Rogers (1998) discovered that the survival of a nourishment project was positively correlated with the beach fill length and wave period, while negatively correlated with the break wave height and beach slope. The replenished sediment was lost quickly, and then the evolution slowed as cross-shore sediment transport decreased (Karasu et al., 2008). Smith et al. (2017) found that the role of nearshore submerged sediment nourishment was similar to the function of offshore breakwaters, and the cross-shore sediment movement contributed little to landward sediment accumulation, providing an essential reference for bar nourishment studies. In a study conducted by Atkinson and Baldock (2020), three distinct locations for nourishment were examined, namely, on the berm, within the bar trough, and as a shoreline placement. The findings of the study indicated that the implementation of nourishment effectively mitigated shoreline recession and mean recession of the profile when compared to non-nourished beaches under conditions of sea level rise, with the highest efficacy observed when all the nourishment was added to the active profile.
However, the research on beach nourishment is still in exploration due to the complexity of beach nourishment and the absence of long-term and real-time monitoring and evaluation of nourishment projects. Accordingly, this study conducts a physical experiment to carry out beach nourishment at three distinct locations, aiming to observe and analyze the evolution of profiles and hydrodynamic changes under identical wave actions over an equivalent time frame. In addition, the maintenance and protection effects of different beach nourishment methods under non-storm and storm wave conditions are compared and analyzed. By understanding the effects of different nourishment methods on beach morphology and sediment transport, coastal managers can minimize adverse ecological consequences and ensure the sustainability of beach protection projects.
2 Experiment description
2.1 Wave flumes and instrumentation
The beach nourishment experiment was conducted in a wave flume that could absorb reflected waves at Ludong University, Yantai, China. This study employed an experimental setup similar to Baldock et al. (2017) and utilized a model with a scale of 1:15, following the principles of Froude similarity law. The length of the beach area was 14.75 m and the width was 0.73 m. The static water level was 0.7 m, the initial slope of the beach was 1/15, and the elevation of the front toe of the dune was 0.8 m (Figure 1A). Nine wave gauges were arranged sequentially in the direction of wave incidence to obtain the wave height change, with the starting point of the beach foot as the zero point: -13.25 m, -12.23 m, -11.52 m, 0 m, 0.47 m, 1.22 m, 4.04 m, 6.37 m, 7.86 m. The sampling rate of the wave gauges was 30 Hz. Besides, the beach model in the experiment consisted of natural sand with a median diameter D50 = 0.284 mm, D90 = 0.437 mm, and a coefficient of uniformity D60/D10 = 1.72. The measurement of morphology change in the experiment was conducted using three PointGrey high-speed cameras for lateral observation, combined with image processing techniques to achieve real-time dynamic extraction of beach profiles.
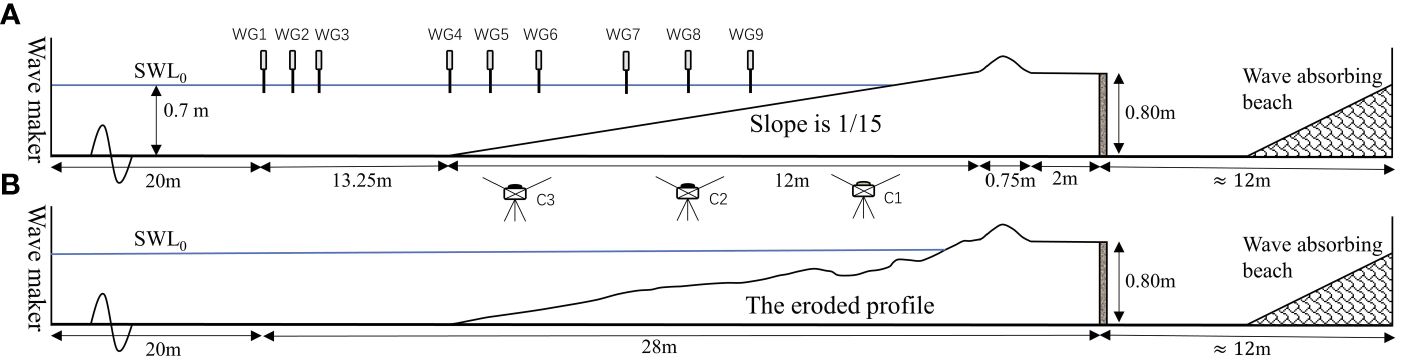
Figure 1 Experimental set up for beach nourishment: (A) The initial profile. (B) The eroded profile. WG represents the wave gauge. C1, C2, and C3 represent the PointGrey cameras.
The photos taken by the PointGrey cameras are grayscale images (only black and white), with grayscale values ranging from 0 to 255, and a resolution of 2048×2048 pixels. The three cameras can be synchronized using a multi-camera acquisition system, with a maximum acquisition frequency of 60Hz. In this experiment, a shooting frequency of 10Hz was used, which can meet the observation requirements for profile and water surface changes. The process of profile identification is shown in Figure 2. Firstly, select the area to be identified in the image (red box), then adjust the brightness of the image to identify the beach profile. Finally, the identified beach profile is calibrated using a grid board and compared with data from a laser rangefinder. The maximum difference in elevation of the sand bar identified by image recognition can be controlled within 0.5 cm.
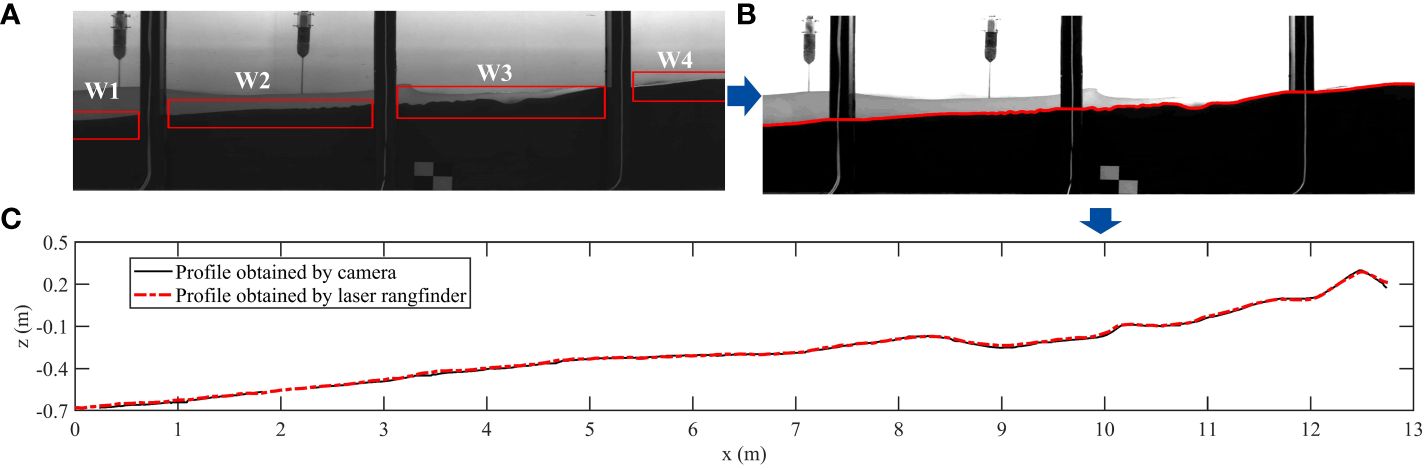
Figure 2 Image analysis process: (A) Select the pixel range of the captured image, where W represents different windows. (B) Perform brightness processing on the image to identify the beach profile. (C) Compare the identified profile with the data from the laser rangefinder. The blue arrows represent the steps of image recognition process.
2.2 The eroded profile, the nourishment locations, and wave conditions
The experimental procedure is divided into two steps to generalize the experiment and make the experimental results more applicable due to the countless types of beach erosion in nature. The first step is obtaining the outline of the eroded profile (Figure 1B), while the second step is feeding sand on the eroded profile. The experimental design is based on Wanpingkou Beach as a reference, with a coastline length of approximately 6.39 km, width ranging from 50 to 160 m, and slopes varying between 0.03 to 0.06. The region behind the coast is predominantly characterized by gentle beach shoulders. Since 2010, the average erosion rate of the northern part of the beach has been about 2 - 3 m/a, while the central part of the beach has seen an average erosion rate of approximately 0.4 - 0.5 m/a. Both the northern and central parts of the beach are generally experiencing erosion, while the southern part is in a state of slow accretion due to the construction of dikes. From the low tide line to the beach shoulder, the sediment grain size ranges between 0.2 to 1.25 mm, illustrating the phenomenon where wave action causes the sediment particles to coarsen from sea to shore. According to the storm surge process in the Wanpingkou Beach area in 2020, the maximum significant wave height reached 2.8 m offshore, while the maximum wave height reached 3.7 m. In order to understand the morphological evolution and hydrodynamic characteristics of the Wanpingkou Beach area in Rizhao, the incident wave parameters in this experiment were based on the actual sea conditions at the site.
The final eroded profile (Figure 3C) was used as the initial profile for beach nourishment. According to linear wave theory, the average wave energy density per unit area on the water surface is proportional to the square of the wave height (Goda, 2010), E = ρgH2/16, where E is the average wave energy density per unit area (J/m2), ρ is the water density, H is wave height, g is the acceleration by gravity. The variation in wave height meant changes in the energy of the incident wave, resulting in acceleration or erosion of the beach.
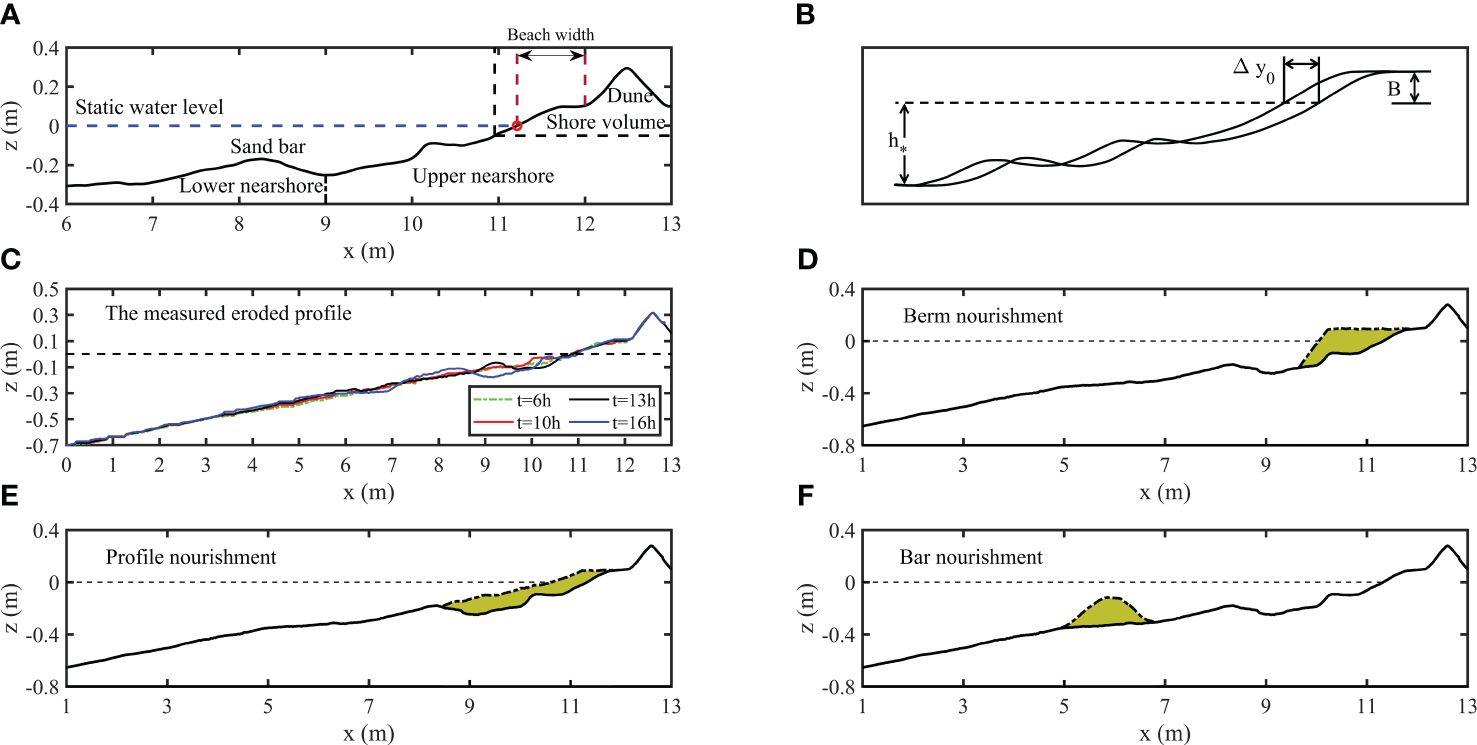
Figure 3 (A) Schematic diagram of a beach-dune profile. The shore volume is computed above the 0.05 m water depth. The vertical dotted line (x = 9 m) delineates the lower nearshore and the upper nearshore. The red circle represents the shoreline position. (B) The maximum height B, the closure depth h∗, and the shoreline recession Δy0. (C) The measured eroded profile. Nourishment locations (shaded) and volumes: (D) Berm nourishment. (E) Profile nourishment. (F) Bar nourishment.
Numerous researchers have observed the response of beaches under different wave conditions through flume experiments (Atkinson et al., 2018; Pan et al., 2022). However, many predictive formulas for beach erosion and accretion have been developed either for field use or based on monochromatic waves (Gourlay and Meulen, 1968; Sunamura and Horikawa, 1974; Hattori and Kawamata, 1980), which introduces uncertainty when these empirical formulas are applied beyond the parameter space for which they were developed. Therefore, Table 1 lists the monochromatic wave parameters that induce eroded profiles. By using monochromatic waves, it is possible to maintain a controlled environment in the flume, precisely manipulate variables such as wave period, height, and length, and clearly observe the impact of these variables. The results show that the beach profile changes rapidly in the first 2 hours, but the changes become almost imperceptible afterwards. Adjustments were made to the wave height and duration based on the observed results, gradually increasing the wave height to 0.08 m and 0.1 m. However, no significant sandbars appeared in the beach profile (red line in Figure 3C). At the 11th hour, the wave height was increased to 0.125 m, resulting in the formation of troughs and sandbars. The wave height was further increased to simulate the gradually increasing storm wave (black line in Figure 3C). Finally, the wave height reached 0.21 m, corresponding to an actual storm duration of approximately 12 hours (blue line in Figure 3C). The eroded profile was recorded on multiple transparent PVC sheets that matched the size of the flume’s glass. To ensure the eroded profile is the same for each trial, a handheld laser and a spirit level are used to align the leveled beach profile with the profile documented on the PVC sheets during each reconstruction.
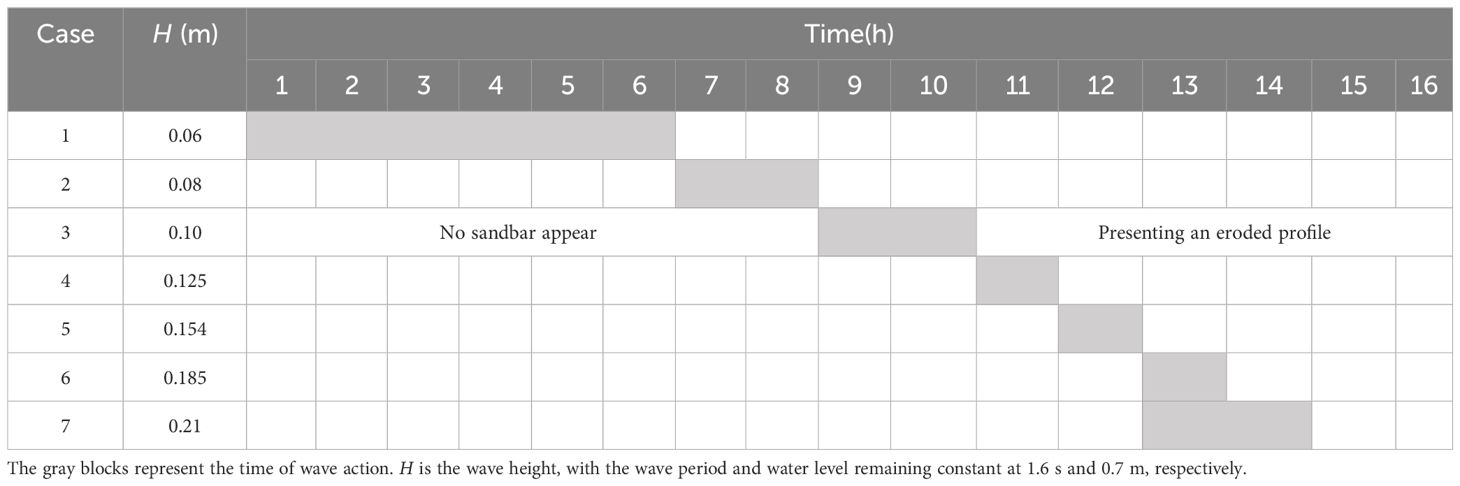
Table 1 Hydrodynamic conditions lead to the eroded profile.
The different parameters of the nourished beach used in the following sections are shown in Figure 3A. Three beach nourishment methods (berm nourishment, profile nourishment, and bar nourishment) were presented in this study (Atkinson and Baldock, 2020; Larsen et al., 2023). The berm nourishment involved extending the beach berm towards the sea by replenishing sand ranging from x = 9.65 m to x = 11.84 m (Figure 3D). The edge of the beach berm moved 1.52 m towards the sea, the slope of the beach toward the sea was 1/2 after sand replenishment, and two-thirds of the replenished sand was above the mean water level. The replenished sediment in profile nourishment in this experiment was located mainly within the upper nearshore (x = 8.42 - 11.76 m), the edge of the beach berm extended 0.5 m to the sea, and the slope of the beach toward the sea was 1/10 (Figure 3E). There was no apparent sandbar in profile nourishment as the furthest sand replenishment extended to the crest of sandbar. Bar nourishment, as shown in Figure 3F, was an artificial sandbar formed by replenished sediment from x = 4.9 to x = 6.8 m, which was located on the seaward side of the original topographic sandbar. The slope on both sides of the sandbar is 1/4, and the height of the artificial bar was about 0.2 m.
The sediment used for beach nourishment was of the same particle size as that of the eroded profile. The sand replenishment volume design follows Dean (2002)’s theory, assuming that the new profile formed by the nourishment sediment was consistent with the change in the natural beach profile. This relationship can be expressed mathematically using Equation 1, where the sand replenishment volume ∀ is determined by three key factors: the maximum height B of the profile movement in the vertical direction, the closure depth h∗ representing the seaward boundary of the active coastal zone, and the shoreline recession Δy0 (Figure 3B).
where H is the wave height in deep water, the maximum wave height in Table 1 is 0.21 m, L is the corresponding deep water wavelength, and the closure water depth h∗ calculated by Equation 2 is 0.36 m (Hallermeier, 1981; Nicholls et al., 1998). Besides, the maximum height B in this experiment is the height of the beach berm above the static water, with a value of 0.1 m, and shoreline recession Δy0 is about 0.52 m. Thus, the single-width sand replenishment volume ∀ calculated is 0.24 m3/m. The width of the narrow region of the flume in the experiment is 0.73 m, the sand replenishment volume calculated is 0.175 m3, with the weight of replenished sand at each nourishment location is about 280 kg.
Wave steepness, defined as the ratio of wave height to wavelength, plays a crucial role in determining the behavior of ocean waves and whether they will break or not (Goda and Suzuki, 1976; Suh et al., 2010). The breaking of waves can have profound impacts on the coastal environment, including the erosion of beaches, alterations to the shoreline, and changes to the distribution of sediment (Liang et al., 2023). According to a report by the Federal Emergency Management Agency (FEMA), the wave steepness for extreme extratropical storms in large water bodies and relatively deep water is around 0.03, while for major hurricanes it is approximately 0.04 (Dean et al., 2005). To investigate the nourishing effect of sediment feeding at different locations under the non-storm wave and storm wave conditions, the study defined wave conditions where the wave steepness exceeds 0.03 as storm wave conditions (H/L ≥ 0.03), and the rest of the wave conditions were defined as non-storm wave conditions (H/L< 0.03) in the second step of the beach nourishment experiment. The wave parameters in Table 2 were obtained from Wave Gauge 1, which was the wave gauge located closest to the wave maker. Monochromatic waves with wave heights from 0.06 m to 0.185 m and wave periods from 1.2 s to 2 s were chosen to explore the law of sediment transport under different wave conditions. Case A1 to A5 were defined as non-storm wave conditions, and Case B1-B5 were defined as storm wave conditions. Additionally, two cases (C1 and C2) without nourishment were included for comparison (Risio et al., 2010).
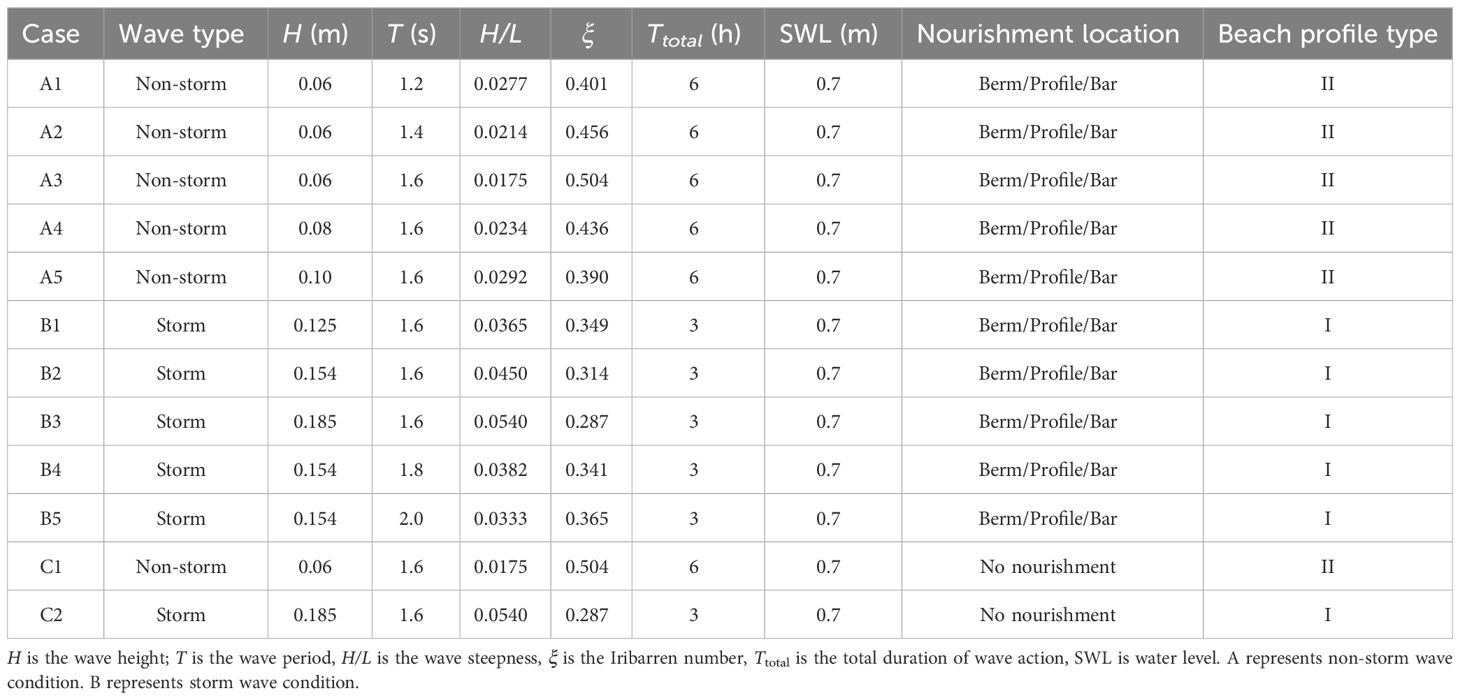
Table 2 Hydrodynamic conditions of the experiment.
Sunamura and Horikawa (1974) divided the beach morphology profile into three types according to the direction of sediment movement based on the results of the flume experiment. The formula used to classify the beach profiles can be expressed as:
where H is the wave height at deep water, L is the wavelength, H/L is deep water wave steepness, tanβ is beach slope, D is sediment particle size, C1 is the criterion number. The criterion number (C1) is a crucial factor in determining the beach profile. If C1 > 8, the beach profile is of Type I, characterized by shoreline recession and sediment accumulation in the offshore area. If 4< C1< 8, the beach profile is of Type II, characterized by sediment transport in both onshore and offshore directions, the advancement of the shoreline, and the formation of a sandbar. If C1< 4, the beach profile is of Type III, characterized by onshore sediment transport, a prograding shoreline, and no sediment accumulation in the offshore area. Besides, the Iribarren number is used to describe the type of breaking wave: spilling (ξ< 0.5), plunging (0.5< ξ< 3.3), collapsing or surging (ξ > 3.3). Considering the varying slopes of the beach following sand filling, the reference profile type chosen is based on the initial slope of 1/15. The observed alteration in beach morphology during the initial stage (Figure 3C) aligns with the forecasted outcome derived from the formula proposed by Sunamura and Horikawa (1974).
In addition, the primary factor that causes sediment suspension is the turbulence generated by breaking waves (Hoefel and Elgar, 2003; Li et al., 2023). In a study conducted by Hattori and Kawamata (1980), the disturbance energy of water flow on sediment within the breaking wave zone was calculated to differentiate between the suspended load and bed load. This criterion can provide a better understanding of beach 210 erosion and accretion:
where H is the wave height at deep water, T is the wave period, L is the wavelength, tanβ is the beach slope, ω is sediment settling velocity, C2 is the criterion number. The beach type can be determined based on the value of C2. If C2< 0.5, the beach profile is accretive; if C2 = 0.5, the beach is in equilibrium; and if C2 > 0.5, the beach profile is erosive.
2.3 Scaling
The focus of the research is on the changes in the profile and hydrodynamic conditions of nourished beaches at different locations, particularly in exploring sediment transport in nearshore areas, with the requirement that wave conditions satisfy the similarity of sediment movement. This experiment references the hydrodynamic conditions of the Wampiakou Beach area in Rizhao, and follows the principles of Froude similarity, making its findings more applicable to beaches within Shandong Province. The issue of scale effects in beach experiments cannot be ignored, and it is necessary to consider the key factors that influence the experiment results. Therefore, this research primarily examines shoreline retreat and changes in beach volume. Previous research has demonstrated consistent findings regarding the retreat of the shoreline at different scales, confirming geometric similarity and volume conservation in laboratory-scale experiments (van Rijn, 2011; Atkinson et al., 2018). However, using unscaled sediments in the experiment leads to steeper profiles at smaller scales. Additionally, large settling velocity weakens offshore sediment transport and reduces the sediment transport rate (Vellinga, 1982; Larsen et al., 2023). To address these effects, Equation 3 from Sunamura and Horikawa (1974) is applied to differentiate between erosive and accretive beaches.
2.4 Sediment transport calculations
In this experiment, sediment bedload is mainly considered to study the law of onshore or offshore sand transport in the beach morphology change after sand replenishment. The amount of sediment transported through a single-width section unit time is defined as the net sediment transport flux qs, which is given by the sand transport continuity equation (Atkinson and Baldock, 2020):
where ρ is sediment porosity with a value of 0.4, zb 235 is bed level and qs is net sediment transport flux.
where qs(x) is the single-width net sediment transport at the x position of the profile, calculated by integrating Equation 5 over the entire active profile area, and xmax corresponds to the farthest position (x = 13.0 m) of the observable profile change. Besides, qs > 0 represents the net onshore sediment transport, and qs< 0 represents the net offshore sediment transport.
The absolute mass Vabs is used to evaluate the rate of beach profile change under three beach nourishment methods:
where zb is the elevation difference of the beach surface relative to the previous unit time, and w is the width of the sand nourishment area. The larger values of Vabs indicate a larger amount of profile change, while smaller values represent a slower change in beach sediment transport.
To analyze the bias of data distribution, commonly used metrics include Root Mean Square Error (RMSE) and Scatter Index (SCI).
where Nd represents the total number of measured and target values, Si represents the target values, and Mi represents the measured values. The Scatter Index (SCI) normalizes the errors and avoids abnormal results for data with small means and large variabilities.
3 Result
3.1 Hydrodynamic change
During the propagation of waves towards the shore, the wave shape is influenced by changes in the topography. As shown in Figure 4, the typical waveforms at the Wave Gauge 8 during the early, middle, and late stages of the wave generation process (50 - 55 s, 350 - 335 s, 650 - 650 s) in Case B4. In the sandbar nourishment, the waves have already broken in the early stage due to the shallow water depth and the distance of the replenishment location from the shore (Figure 4C). In the berm nourishment and profile nourishment, the waves exhibit more pronounced asymmetry (Figure 4D) and skewness (Figure 4E). In the 0 - 30 min stage, the waves in the bar nourishment break earlier, resulting in a smaller value of wave energy flux. As time progresses, the wave dissipation effect at the replenishment location gradually weakens, and the waveforms gradually recover to those observed in the other two nourishment methods, with the wave energy flux approaching that of the other conditions (Figure 4F).
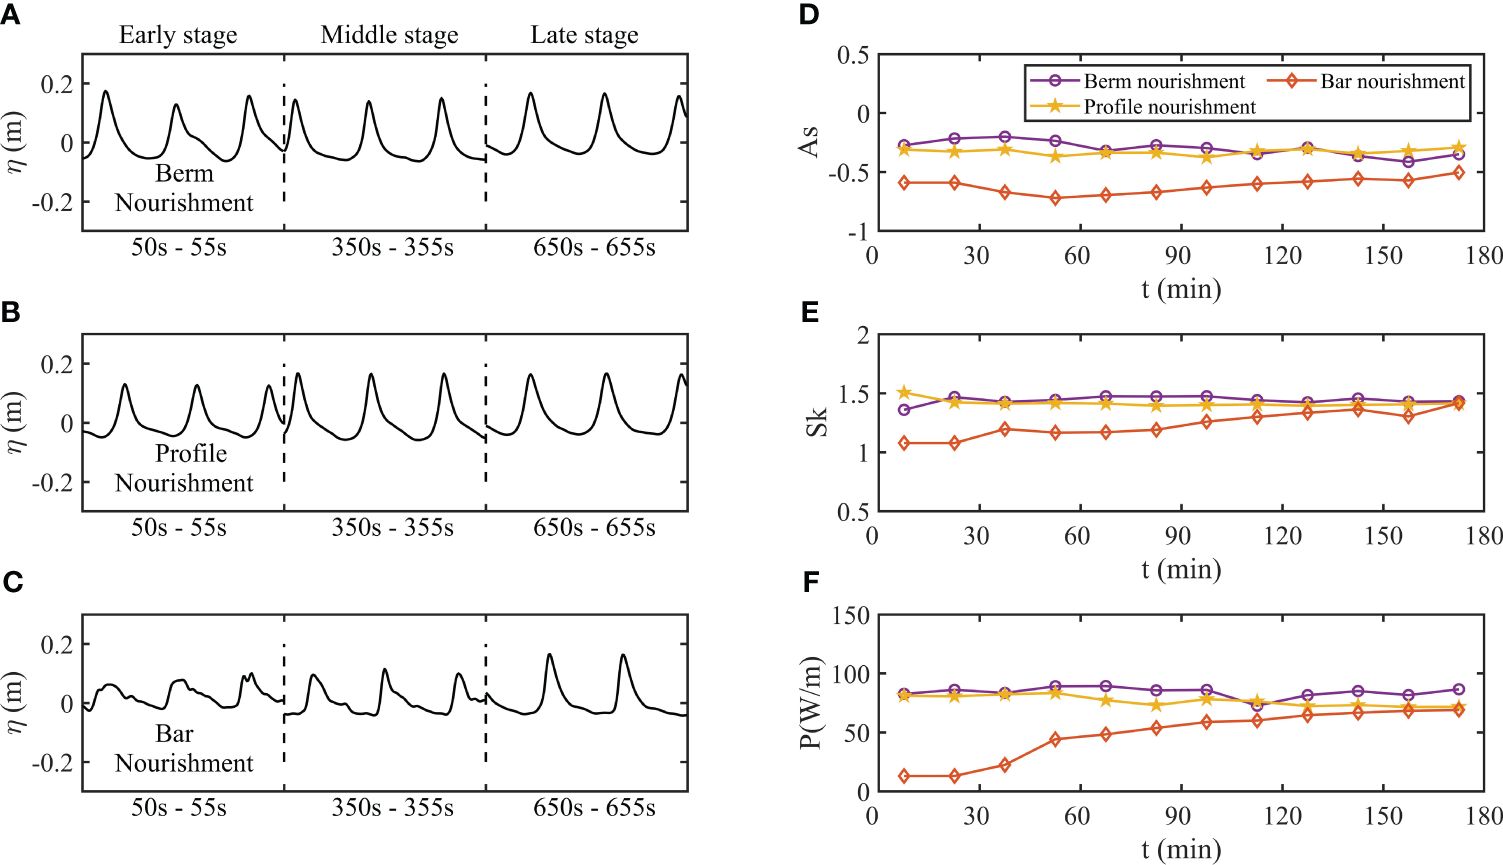
Figure 4 (A-C) Typical wave shapes during three different time periods in beach nourishment methods. (D) Wave asymmetry. (E) Wave skewness. (F) Wave energy flux P.
Comparing the average wave height variation of the three sand replenishment locations in Figure 5, the wave heights of berm nourishment and profile nourishment are similar in the deep water under storm conditions, while the wave height decreases significantly near the sand replenishment location in bar nourishment. From the wave breaking pattern at 20 s in Figure 5A, it can be observed that wave breaking occurs near x = 6 m on the seaward side of the bar. The type of wave breaking is a plunging wave, with a large amount of air being entrained into the water, impacting the crest of the sand bar and the landward side, causing a disturbance that suspends a large amount of sediment and moves it to both sides. The wave energy passing through the sand bar is attenuated, resulting in a significant decrease in wave height. As a result, there is minimal change in the landward side topography of the sand bar, indicating that the sand bar effectively protects against erosion. The elevation of the bar crest also rapidly decreases under the action of waves, causing the seaward slope of the sand bar to become gentler(Figure 5B).
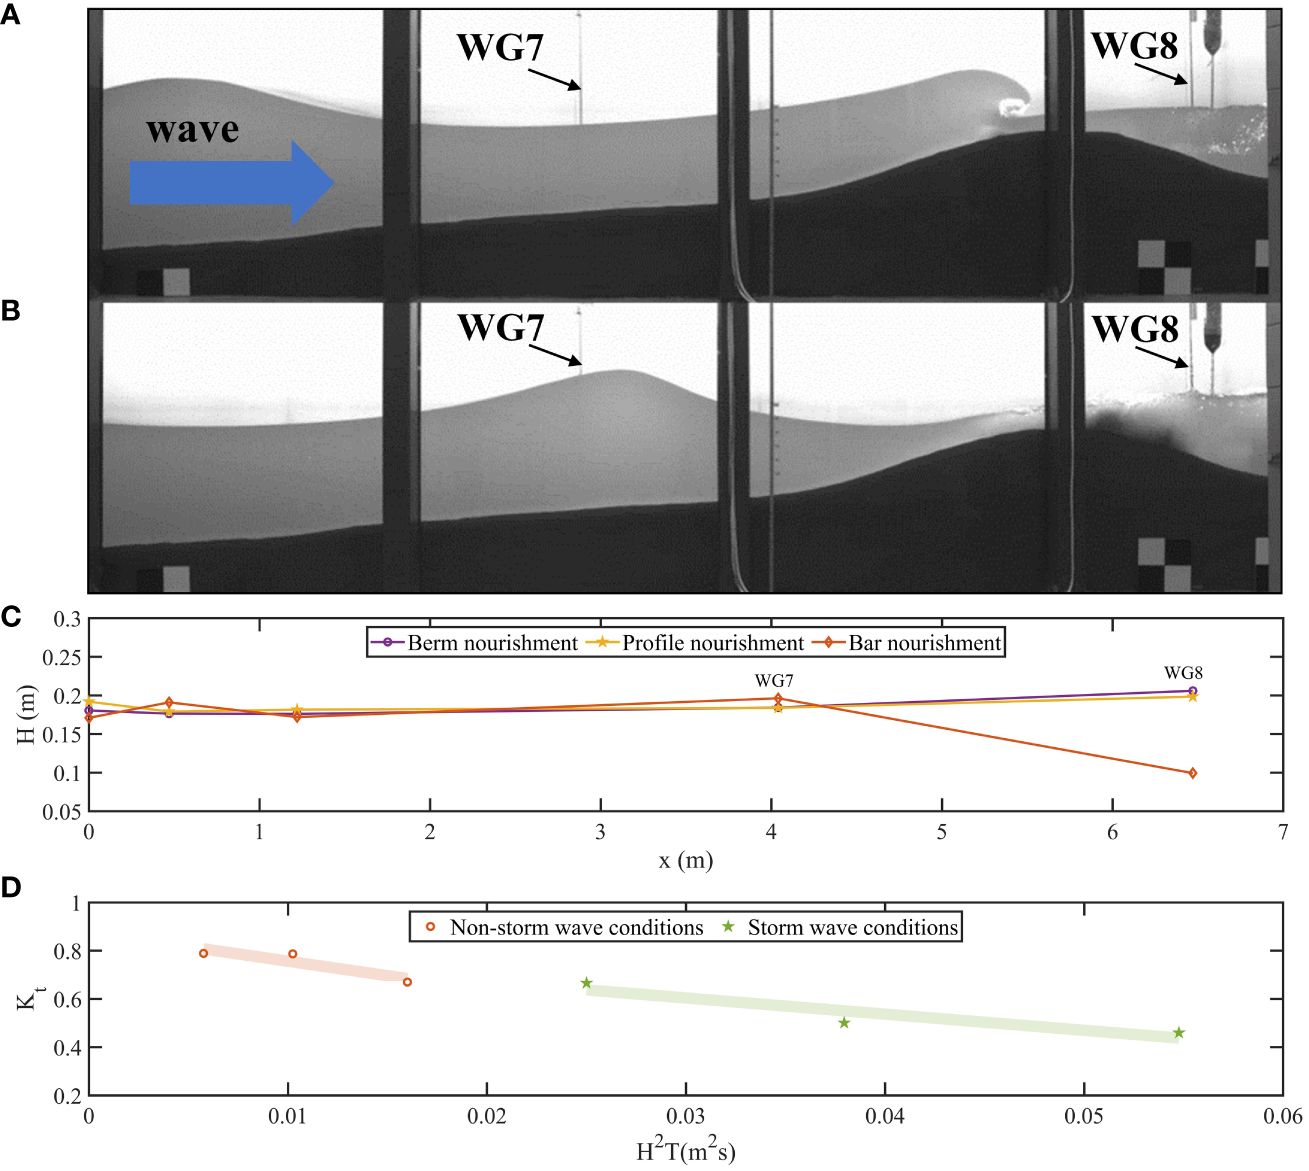
Figure 5 (A) Before the wave breaking in the bar nourishment. The blue arrow indicates the direction of the incident wave. (B) After the wave breaking in the bar nourishment. (C) Average wave heights from wave gauges for different beach nourishment methods during storms. (D) The transmission coefficient in bar nourishment cases(Case A3, A4, A5, B1, B2, and B3 with the same wave period).
An artificial sandbar composed of replenished sediment in bar nourishment reduces the incident wave energy and protects the stability of the beach. The sand feed location and the protection mechanism in bar nourishment differ from the berm nourishment and profile nourishment. Therefore, it is necessary to analyze the attenuation of wave height due to the presence of an artificial bar during wave transmission. The measurement data of Wave Gauge 7 (x = 4.04 m) at the front foot of the sandbar seaward is taken as the incident wave height Hi, and the wave height at Wave Gauge 8 (x = 6.37 m) at the back foot of the sandbar is used as the transmission wave height Ht (Figure 5A). The transmission coefficient value, Kt = Ht/Hi, is used to evaluate the wave dissipation ability of the sandbar under different wave heights. The smaller value of the transmission coefficient Kt represents a stronger wave dissipation ability. The transmittance coefficient of bar nourishment in Figure 5D decreases with the wave height increase regardless of non-storm wave conditions or storm wave conditions, indicating that the wave dissipation effect in bar nourishment becomes more evident at higher wave height conditions. The values of the transmission coefficient are larger under storm wave conditions compared to non-storm wave conditions, which means that the existence of the artificial bar would allow storm waves to break up in advance, eliminating the disturbance of water flow caused by wave breaking near the shore to maintain the stability of the beach.
3.2 Coastal terrain modification by sediment transport
The cross-shore transport of sediment can alter the coastal terrain, including the morphology of beaches, the position of shorelines, and overall topography (Lim and Lee, 2023). More importantly, when sediment is transported away from the beach, it can lead to beach erosion, hastening the process of shoreline retreat. Conversely, if sediment is deposited onto the beach, it can result in beach accretion (Armaroli et al., 2013).
3.2.1 Morphology change
The wave condition of H = 0.06 m, T = 1.6 s, and a wave steepness of 0.0175 is selected as an example of non-storm wave conditions in this section (Figure 6). For berm nourishment, most of the replenishment sediment is unchanged and a little sediment above the mean water level has collapsed slightly after 6 hours of non-storm wave action. In profile nourishment, the trough of the eroded profile is filled with replenished sand, and the broken wave carries the suspended sediment onshore to deposit on the beach berm (Figure 6B), which is consistent with the prediction of accumulation beach profile (Type II) described in Table 2. For bar nourishment, the wave motion is influenced by the bottom bed due to the sharp decrease in water depth at the crest of the bar before the wave propagates to the sandbar. This enhances the nonlinearity of the wave, and the trajectory of the fluid particle is not closed, resulting in onshore sand transport, a gentle seaside slope of the sandbar, a steeper landward slope of the sand bar, and an onshore moving bar crest. There is a slight sand acceleration at the berm of the beach in the range x = 10.5 - 11.5 m, and sand replenishment near the sandbar location moves shoreward in the range x = 5 - 7 m (Figure 6C), which shows the trend that the sediment in artificial bar tends to replenish to the beach surface as a sand source. According to Equation 6, Figure 6D displays the net sediment transport flux of the three nourishment methods. The offshore sediment transport rate in the berm nourishment conditions in the x< 8 m area is almost negligible, indicating no sediment transport in the area. Offshore sand transport in the x = 10 - 11 m area increases with the increase of the offshore distance (horizontal position x value decreases), and the offshore sediment transport reaches a maximum value at x = 10 m (near the shoreline). In the profile nourishment, the onshore sand transport rate increases in the area from x = 10.2 m to x = 11 m, and the maximum onshore sand transport rate is at x = 10.2 m (near the shoreline). In the bar nourishment condition, there is apparent onshore sand transport at the locations of x = 6.3 m (near the artificial bar) and x = 10.7 m (near the shoreline).
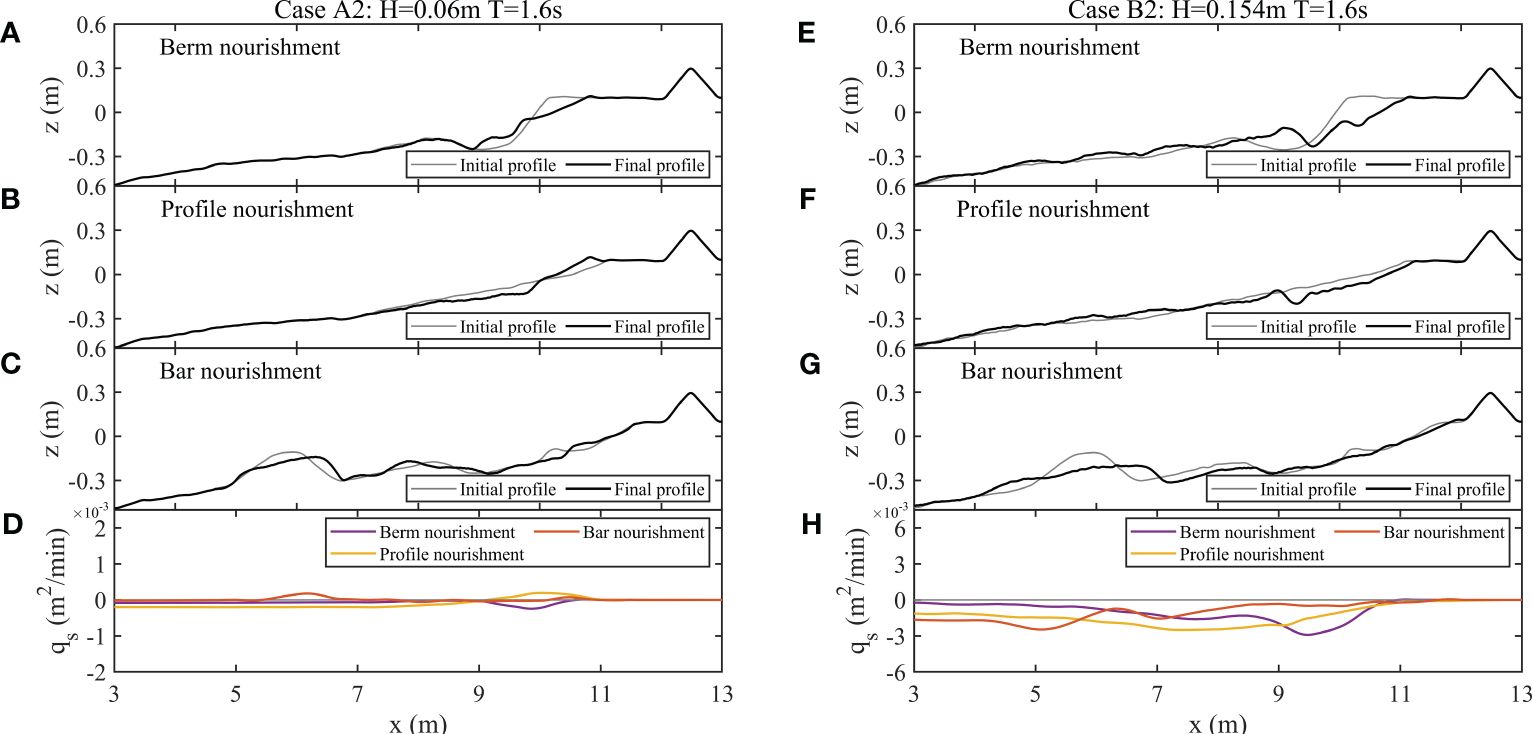
Figure 6 (A–C) Changes in beach profile after sand nourishment under non-storm wave conditions. (D) Net sediment transport flux of three nourishment methods under non-storm wave conditions. (E–G) Changes in beach profile after sand nourishment under storm wave conditions. (H) Net sediment transport flux of three nourishment methods under storm wave conditions.
The wave condition H = 0.154 m and T = 1.6 s with a wave steepness of 0.045 is selected as an example of storm wave condition to observe the movement of the replenished sand in different locations and find the protective effect of three sand replenishment methods under the action of a short-term storm. Although most of the nourishing sediment directly widens the width of the beach berm under the berm nourishment method, it is easy to collapse or even transmit offshore under the 3-hour storm wave attack. The frequent upwash and backflow of the wave result in a rapid reduction in sand replenishment near the berm of the beach, slowing the slope and forming a new sandbar closer to the shore to protect the stability of the beach. The shoreline retreat distance continues to increase, and the final edge of the beach berm position is at x = 11.31 m (Figure 6E). For profile nourishment, there is no severe erosion of the beach part above the water surface, and the edge of the beach berm position retreats slightly to x = 11.35 m, indicating that this form of sand replenishment has an excellent protective effect on the beach berm (Figure 6F). In addition, a bar and trough appear near x = 9 m, and offshore sediment is deposited from x = 4 m to x = 7 m, accompanied by intense onshore and offshore sediment transport. The morphology change of the nearshore beach is small, and there is only a slight erosion of the beach berm in bar nourishment (Figure 6G). The wave energy is attenuated by the artificial sandbar, and the height of the bar crest drops rapidly under the action of storm waves, which indicates that bar nourishment plays an excellent protective role in maintaining the stability of the beach. In the case of shoreline beach nourishment, sediment loss primarily occurs in the beach berm region, with suspended sediment being deposited in the nearshore area between x = 5 m and 9.5 m. Although the sand transport trend in profile nourishment is similar to that of subaerial beach nourishment, the maximum value of sediment transport flux is less than that in the berm nourishment case. In bar nourishment, the highest sand transport flux occurs near the artificial sand bar, with minimal transport in the nearshore area, indicating that most wave energy dissipates near the artificial bar, and the beach berm is well protected even during storm conditions.
From Figure 7, it can be observed that the slope of the swash zone remained constant after the bar nourishment, with a value of approximately 0.19, which is the same as the slope of the eroded profile. For berm nourishment, the slope of the swash zone decreases from 0.5 to approximately 0.19, while for profile nourishment, the slope increases from 0.1 to approximately 0.19. Based on Equations 8 and 9 , when comparing the three beach nourishment methods, it's evident that berm nourishment yields the highest discrete value relative to the reference value of 0.19 (RMSE = 0.03, SCI = 0.156). Following this, profile nourishment exhibits a slightly lower discrete value (RMSE = 0.023, SCI = 0.123), and sandbar nourishment shows the lowest discrete value (RMSE = 0.022, SCI = 0.114). The underlying cause for this phenomenon is that, during berm nourishment, the majority of the feed sand is deposited within the swash zone. Under non-storm wave conditions where the wave steepness (H/L) is less than 0.03, the slope of the swash zone for berm nourishment is marginally smaller than that for profile nourishment. However, under storm wave conditions with wave steepness greater than 0.03, the slope of the swash zone for berm nourishment is slightly larger than that for profile nourishment. Based on the experimental observations, it can be inferred that the slope of the swash zone after sand replenishment with the same grain size of sand will eventually approach a constant value, which is the slope of the eroded beach. This is because the properties of the sediment itself dominate the formation of the slope of the swash zone after sand replenishment, while the nourishment method or incident wave conditions have minimal influence on the slope of the swash zone.
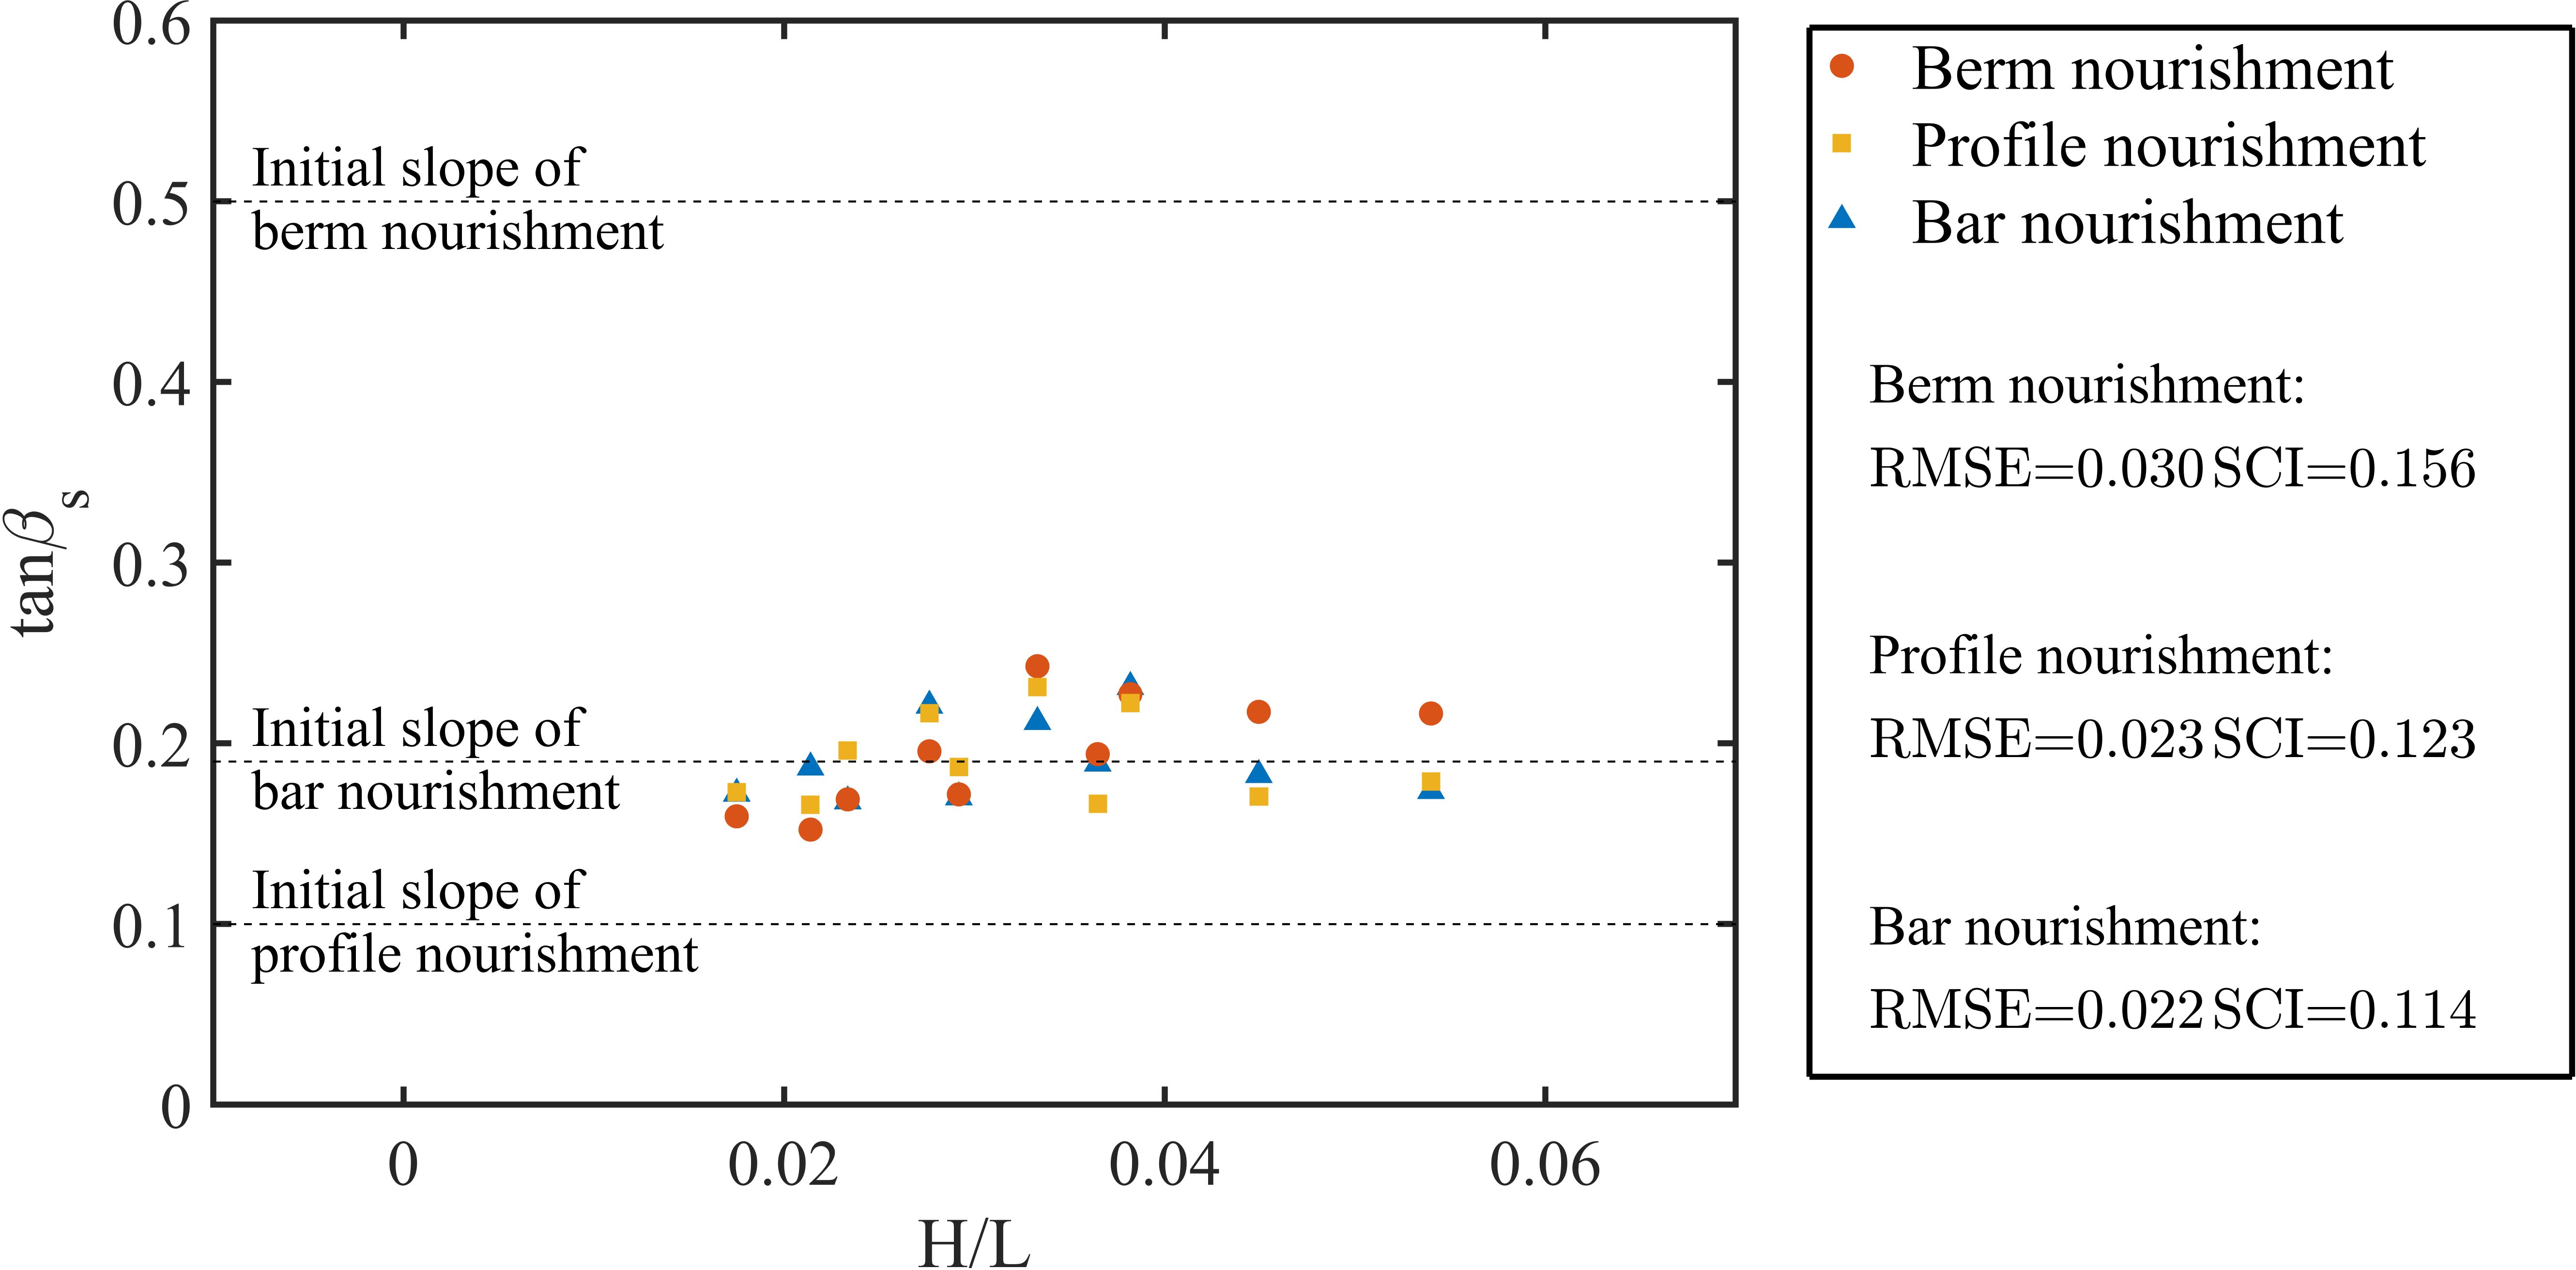
Figure 7 The slope of the swash zone (tanβs) under different wave conditions.
3.2.2 Shoreline recession and beach width
The primary factor for assessing the effects of beach nourishment is the shoreline position. This refers to the point where the static water level intersects with the beach profile, as indicated by the red circle in Figure 3A (Enríquez et al., 2019). Besides, the beach width is calculated from the toe of the dune to the shoreline. As shown in Figure 8A, the shoreline in the berm nourishment method (purple line) initially recedes slightly landward due to the extended shoreline position after replenishing the sand. In contrast, the shoreline in profile nourishment (yellow line) moves seaward, and the beach width increases due to the accumulation of beach profile caused by incident waves. After 6 hours, the shoreline positions in the berm nourishment and the profile nourishment are getting closer, which indicates the slow movement of replenished sand on the eroded profile leading to the formation of a more stable reorganized beach under non-storm wave conditions. Under 6 hours of non-storm wave action, the shoreline change for both bar nourishment (red line) and no nourishment conditions (black dashed line) exhibits similarity with no discernible trend in the direction of movement.
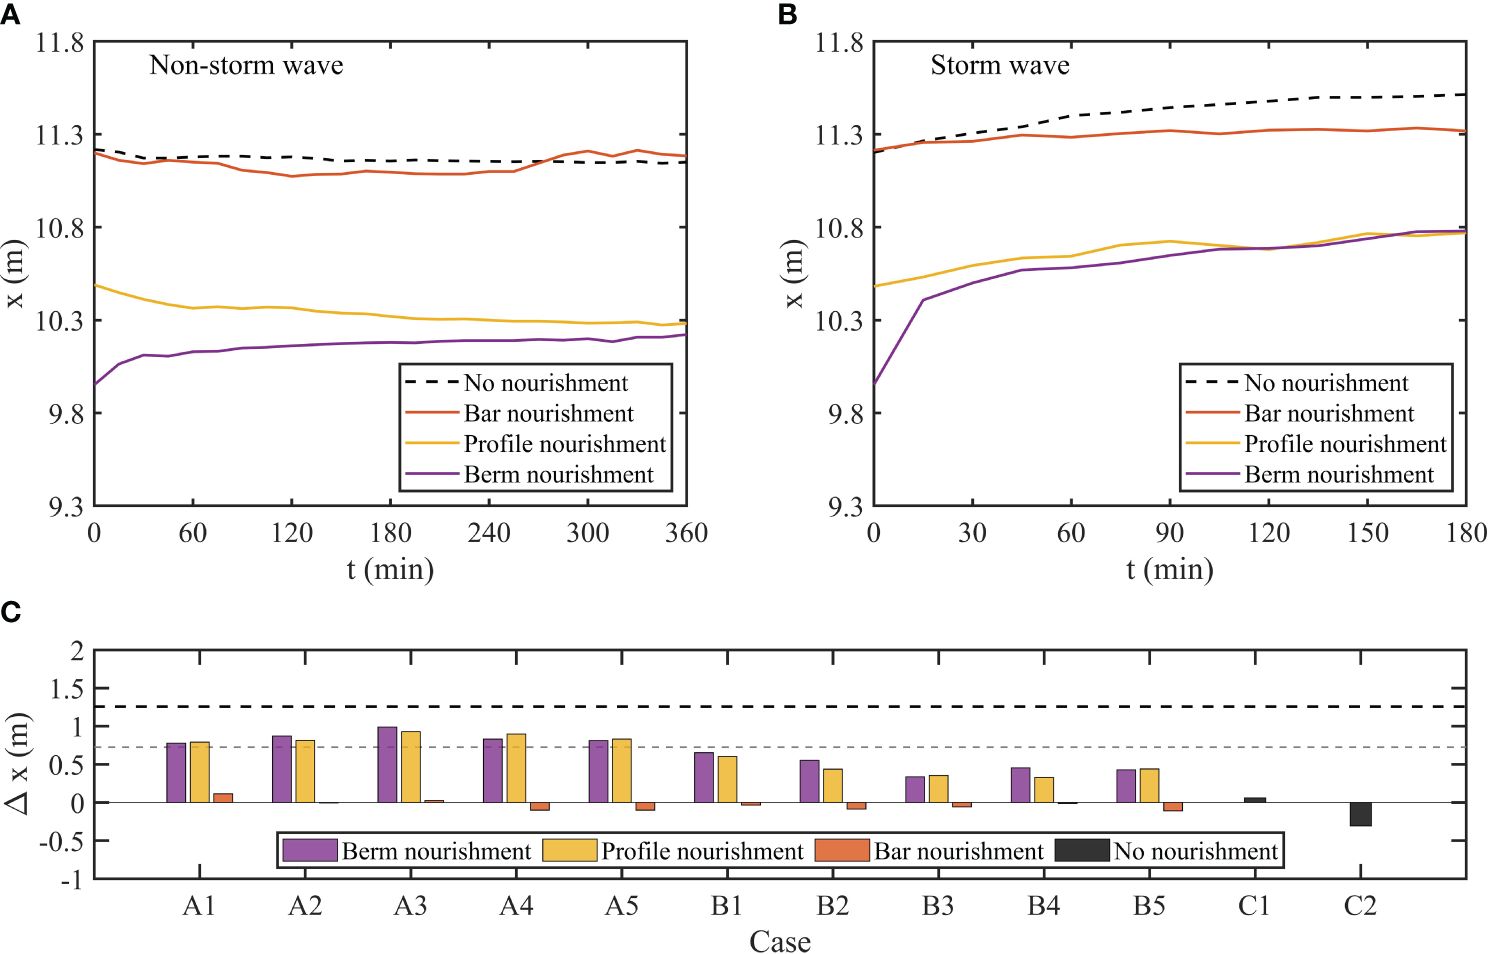
Figure 8 Shoreline position in four cases: no nourishment (black dashed line), bar nourishment (red line), profile nourishment (yellow line), and berm nourishment (purple line). (A) Non-storm wave case: H = 0.06 m, T = 1.6 s. (B) Storm wave case: H = 0.185 m, T = 1.6 s. (C) The added beach width of three beach nourishment methods after different wave actions (Positive values represent the increasing width of the beach seaward). When sediment feed is complete, the dashed black line represents the increased beach width in the berm nourishment, and the dashed gray line represents the increased beach width in profile nourishment. In the Y-axis, where x represents the position of the shoreline, and Δx represents the added beach width.
Under storm waves, the shoreline retreats to varying degrees, regardless of whether the beach is nourished (Figure 8B). The bar nourishment (red line) effectively protects the shoreline from severe retreat during storm waves compared to the no-nourishment condition (black dashed line). The shoreline retreats under all storm conditions and recedes further than non-storm wave conditions, as the incident storm wave causes an erosion beach profile (Type I beach in Table 2). The shoreline retreat distance is the smallest in bar nourishment because the artificial sandbar decays the incident wave energy and slows the erosion of shallow water areas. The shoreline retreat distance is the longest in the berm nourishment method and the second farthest in profile nourishment. The offshore distance of the shoreline position in both methods still far exceeds the shoreline position in bar nourishment, mainly due to the difference in beach width after the beach reconstruction in three nourishment methods. The shoreline positions in the berm nourishment and profile nourishment retreat rapidly in a short time, and the final shoreline positions of the two cases almost reach the same location at x = 10.76 m.
Despite the initial differences in beach width following sediment supplementation between berm nourishment (dashed black line in Figure 8C) and profile nourishment (dashed grey line in Figure 8C), the final beach widths resulting from both methods (pink and yellow columns in Figure 8C) are similar under both storm and non-storm wave conditions. This similarity may be attributed to the accumulation of most of the replenished sediment in the upper part of the eroded profile, which is frequently impacted by wave swash. However, only cases A1, A2, and A3 in the bar nourishment (red column in Figure 8C) result in an increase in beach width, as the sand supply location is located below the eroded beach and can not be transported to the nearshore area within the same duration of wave action. The relative width of the beach in bar nourishment is slightly widened or reduced, primarily dependent on the types of incident waves described in Table 2. Compared to the no nourishment condition (Case C2, the black column in Figure 8C), all three nourishment methods effectively prevent beach width reduction. Moreover, the replenished sand in the berm nourishment and profile nourishment cases directly increases beach width and is also utilized as a sand source to fill the trough caused by the undertow.
3.2.3 Change in beach volume
The beach shore volume is calculated from 0.05 m (the lowest point of wave downwash near the shoreline) below the average water level to the front foot of the dune (Figure 3A). To analyze the effects of wave height changes on beach changes for three nourishment methods, the single-width shore erosion volume is calculated within the range of active wave action of upwash and downwash. This volume tends to increase as wave height increases, as observed in Figure 9A. The increase in wave height leads to a quick redistribution of replenished sand under strong wave disturbance in storm waves for berm nourishment and profile nourishment. This is due to the replenished sand being mainly located in the wave swash zone in the form of suspended sediment and bedload sediment (Masselink and Russell, 2006). In contrast, the single-width erosion in bar nourishment varies less with the wave height change because the artificial bar reduces part of the wave energy at a longer distance offshore, thereby eliminating the effect of large wave heights on shore erosion. According to Equation 3 of Sunamura and Horikawa (1974), the increase in wave height is not conducive to the occurrence of offshore sediment transport (Figure 9C). In the non-storm wave cases, the single-width erosion also increases with the wave height in the profile nourishment. As the wave period increases, long waves in the storm wave conditions are easier to transfer to the shore, causing the sediment volume on the beach berm to collapse with frequent wave runup, thereby increasing the single-width erosion in berm nourishment and profile nourishment (Figure 9B). The presence of the artificial sand bar in bar nourishment causes waves to break up prematurely, preventing excessive erosion of the shore by long waves in storm wave conditions.
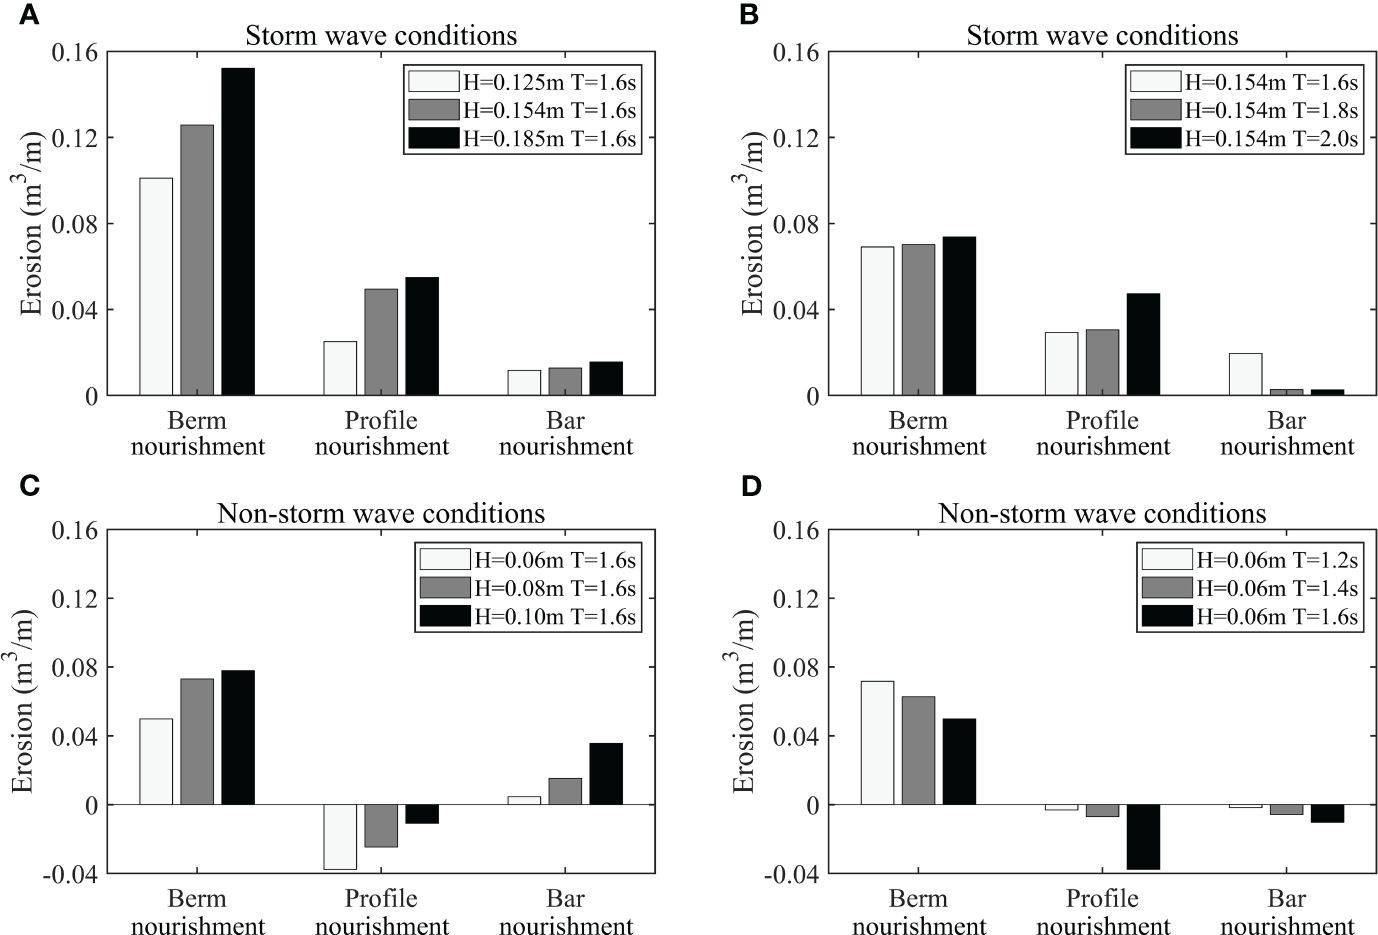
Figure 9 Single-width erosion of sand replenishment at different locations under different wave heights and wave periods. (A) Same period, different wave heights under storm conditions. (B) Same wave height, different periods under storm conditions. (C) Same period, different wave heights under non-storm conditions. (D) Same wave height, different periods under non-storm conditions. Positive values indicate erosion status, while negative values indicate accumulation status.
Figure 9D illustrates that the berm nourishment results in continued erosion of the shore volume due to the collapse mechanism affecting most of the replenished sediment. The volume of sediment accumulation in both bar nourishment and profile nourishment increases with the wave period. In profile nourishment, the sediment accumulation is greater at T = 1.6 s than in bar nourishment due to the wider nourishment area extending from the beach berm to underwater. This allows the replenished sediment to serve as a sand source for the beach shore while also dissipating waves. However, the presence of an artificial bar leads to early wave breaking and enhances the nonlinearity of incident wave transmission to the shore. Consequently, sediment transmission to the shore is slower in bar nourishment, and as the wave runup height increases with the wave period, the sediment is pushed to the foot of the dune with a weak accumulation effect.
As shown in Figure 10, the value of Vabs (calculated using Equation 7) is higher during the storm wave conditions than during the non-storm wave conditions. The rate of volume change of the beach profile drops quickly at the beginning of the storm (t/Ttotalranges from 0 to 0.2). Then the amount of change is similar among the three beach nourishment methods with no significant differences. Among the three beach nourishment methods, the rate of volume change at the beginning is minimal among the profile nourishment, which may be due to the fact that the profile is closer to the equilibrium state, whether in non-storm or storm wave conditions. However, the value of Vabs in the bar nourishment is consistently high in non-storm wave conditions because the sandbar in the bar nourishment is constantly altered by wave action.
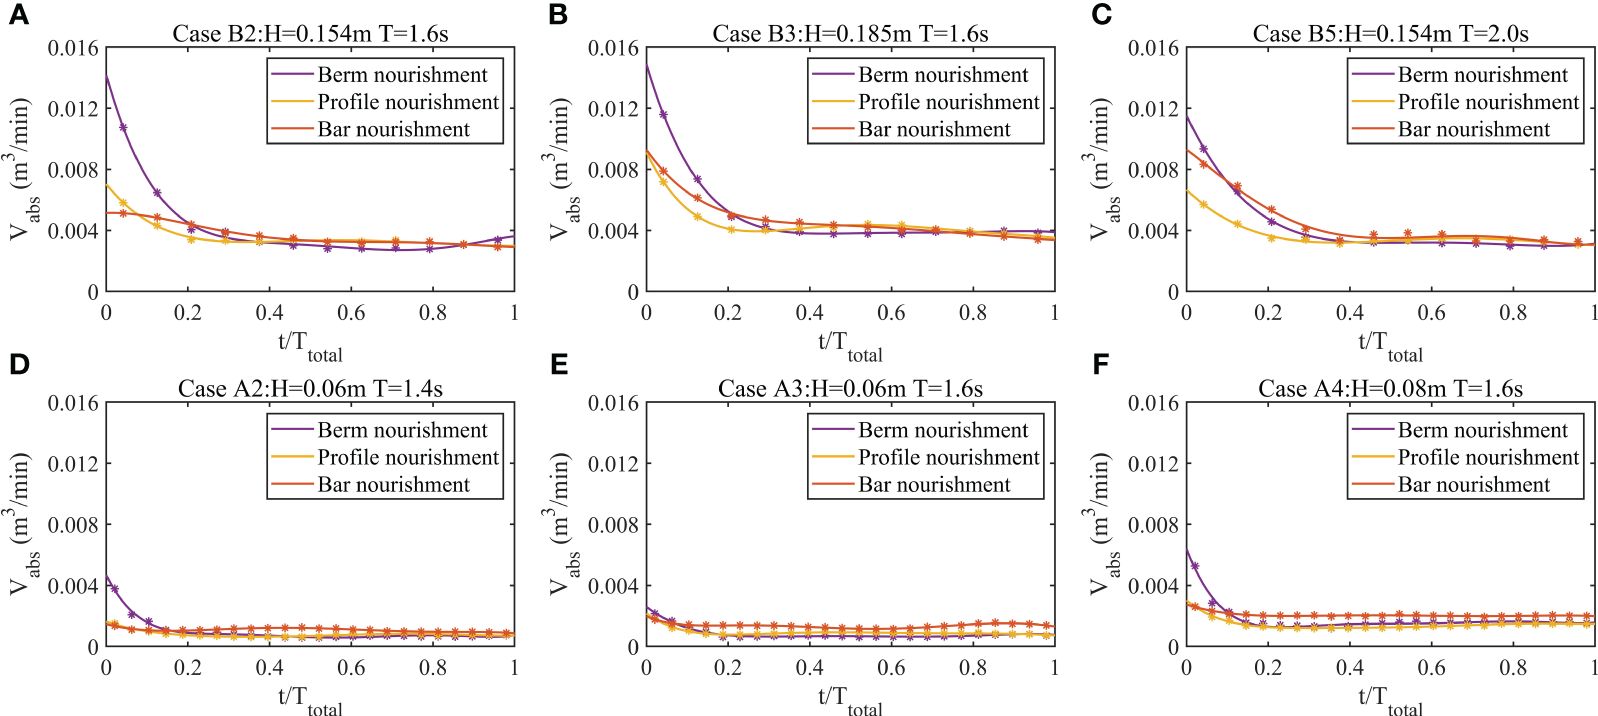
Figure 10 The rate of the profile change in different cases. (A) Case B2. (B) Case B3. (C) Case B5. (D) Case A2. (E) Case A3. (F) Case A4.The asterisk represents the measured value, and the solid line is the fitted curve of the measured value. The total wave generation time is denoted as Ttotal, while t represents the wave generation time.
As shown in Figure 11, the variation range of volume at the shore, the lower nearshore, and the upper nearshore under storm wave conditions are more significant than under non-storm wave conditions. The difference in variation between cases is closely linked to the intensity of the incident wave. The average values of the volume of the beach shore, the volume of the upper nearshore, and the volume of the lower nearshore are used to explore the sediment transfer trend in the three beach nourishment methods. The dominant offshore transport under storm waves leads to sediment transfer from the upper to the lower nearshore in berm nourishment and profile nourishment, resulting in a decrease in the volume of the shore and the volume of the upper nearshore and an increase in the volume of the lower nearshore. After a severe storm, the final volume (the shore, the lower nearshore, and the upper nearshore) in the berm nourishment and profile nourishment is similar, which is different from bar nourishment due to the distinction in the sand supplement locations. The volume of the lower nearshore in bar nourishment is much reduced because of the substantial deformation of the artificial sandbar under continuous wave action. The replenished sediment near the sandbar affected by vertical turbulence is suspended in the water and moving offshore.
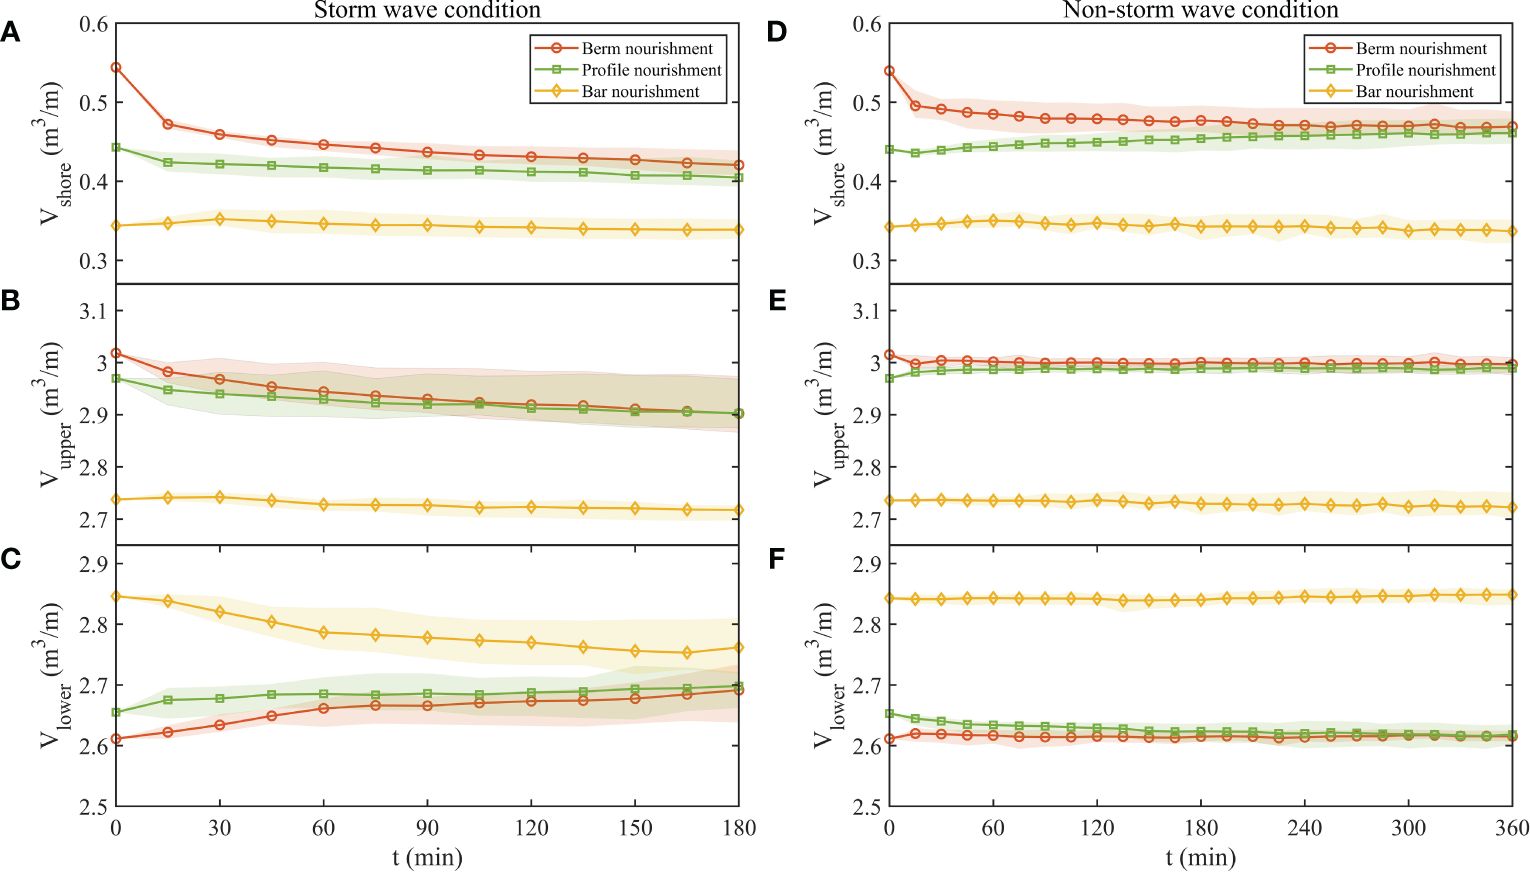
Figure 11 (A-C) are the variation of shore volume Vshore, the volume of the upper nearshore Vupper, the volume of the lower nearshore Vlower in storm wave conditions(Case B1 to B5). (D-F) are the variation of shore volume Vshore, the volume of the upper nearshore Vupper, the volume of the lower nearshore Vlower in non-storm wave conditions (Case A1 to A5). The red circle line, the green square line, and the yellow diamond line represent the mean value in the berm nourishment, profile nourishment, and bar nourishment, respectively. The red area, the green area, and the yellow area represent the envelope of volume change in the berm nourishment, profile nourishment, and bar nourishment, respectively.
Under non-storm wave conditions, there is no significant change in the volume of the upper and lower nearshore in the berm nourishment and bar nourishment (Figures 11D–F). The decrease in the shore volume in the berm nourishment is mainly due to the collapse in the nearshore area. Besides, non-storm waves lead to the accumulation of shore volume and a slight reduction in the lower nearshore in the profile nourishment, indicating an onshore sediment transport trend.
3.3 Prediction of beach erosion or accretion after nourishment
Sand replenishment is a common practice used to add sand to both the surface of the beach and the shoreline. While the initial addition of sand may increase the volume of the beach, over time the beach tends to reach a state of equilibrium where the volume remains relatively stable. To ensure the success of beach nourishment projects, it is essential to assess erosion and accretion on the beach surface in a timely manner. This assessment helps to prevent significant sediment loss and the need for secondary replenishment due to erosion. Therefore, accurate evaluation of beach erosion is paramount in beach nourishment projects to achieve the desired effect of sedimentation and beach equilibrium.
The current formulas used to determine beach types are based on a straight slope, but their applicability in sand replenishment scenarios needs to be confirmed (Gourlay and Meulen, 1968; Dean, 1973). To improve the accuracy of the profile prediction formula, it is necessary to include wave steepness, sediment properties, and the initial slope in the formula, such as Equation 3. This is because the slope of the beach surface changes significantly after sand replenishment. In the case of bar nourishment, the energy of the incident wave dissipates. Therefore, this section only discusses berm nourishment and profile nourishment, with corresponding initial slope tanβ of 0.5 and 0.1, respectively. The selection criteria for the formula in this section is its ability to distinguish erosion after beach nourishment.
The formula proposed by Sunamura and Horikawa (1974) for predicting the erosion state of beaches is applicable to beaches with slopes ranging from 1/45 to 1/8 (Equation 3). When the value exceeds the reference line of C1 = 8, it is accurate for predicting the erosion state in this experiment, as shown in Figure 12A. The formula has been found to be effective for beach nourishment, as it is calibrated using data from flume experiments. Sunamura and Horikawa (1974) emphasizes that when the formula is compared with natural beach data, using the maximum wave height observed during the period and calculating the wavelength based on the period corresponding to this wave height, the results show a similar trend to those obtained in the laboratory. However, it is observed that the boundaries of erosion and accretion shift overall to the left. One possible reason for this shift could be the scale effect. Therefore, when applying Sunamura and Horikawa (1974)’s formula to natural beaches, the coefficient C1 should be adjusted from 8 to 18. The formula proposed by Hattori and Kawamata (1980) (Equation 4) predicts erosion in all cases when the value of parameter C2 is greater than 0.5, which contradicts experimental results(Figure 12B). Hattori and Kawamata (1980)’s formula utilizes the energy formula for sediment transport rate through wave-induced motion, determining the stirring power Pf of waves and currents within the surf zone acting on sediment as (where W is the weight of sediment in water, um is the maximum wave-induced velocity, tanβ is the beach slope within the surf zone, and a1 is a coefficient). With the same incident waves, the sediment used in this experiment (D50 = 0.284 mm) is slightly larger than that in Hattori and Kawamata (1980)’s test (D50 = 0.22 mm). Thus, a greater stirring power is required to initiate sediment suspension in this experiment, facilitating sediment transport and offshore movement in a suspended load manner. However, the difference in coefficients observed in the results of this experiment may originate from another factor. The precondition for the applicability of Hattori and Kawamata (1980)’s formula is that wave breaking induces turbulence, consequently causing sediment to be disturbed and suspended. During beach nourishment, it’s possible that the positions of wave breaking have been altered. For instance, profile nourishment may fill in the troughs of original wave breaking zones, or berm nourishment might induce intense turbulence post-wave breaking. These changes directly impact the processes of nearshore sediment suspension, transport, and redistribution. In terms of the parameters in the formula, when replenishing sand in the nearshore area, the selection of the actual slope value of the swash zone tends to be larger, which is the reason for the coefficient discrepancy. Comparing Equations 3, 4, the absolute value of the slope exponent coefficient in the formula by Hattori and Kawamata (1980) is larger. Based on the data obtained from this experiment, the value of parameter C2 in Hattori and Kawamata (1980)’s formula has been adjusted to 1.25 to effectively distinguish erosion and non-erosion conditions. It is important to note that the parameter verification in this study was based on laboratory data, and further verification with field data after beach nourishment will be necessary for future studies.
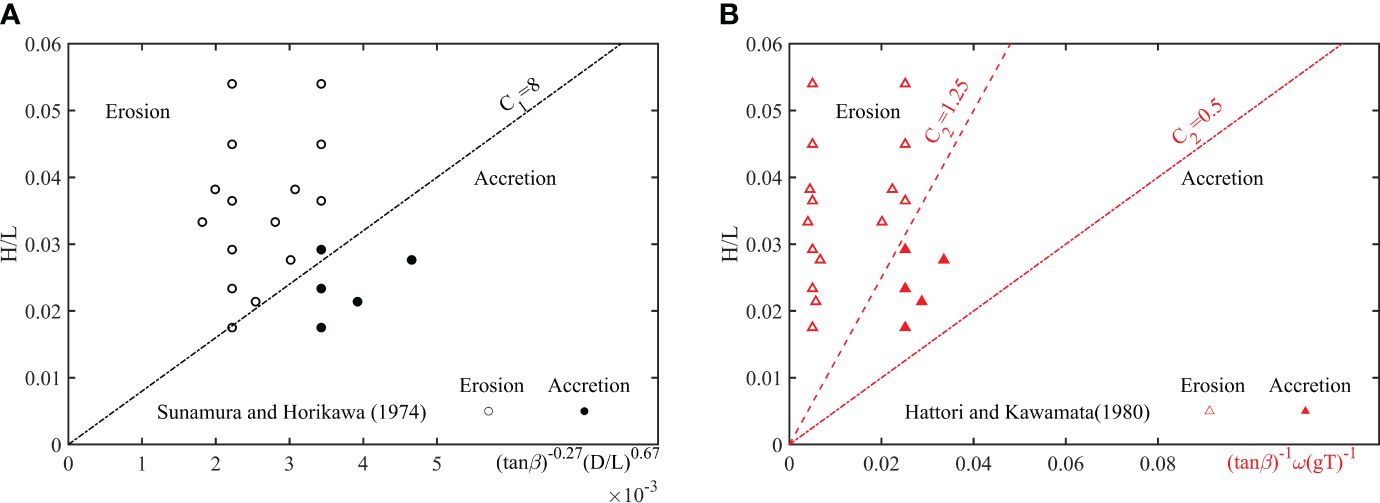
Figure 12 Comparison of the state of erosion or accretion predicted by the two equations with the experimental results after sand replenishment. (A) Black shows the prediction results of Sunamura and Horikawa (1974)’s formula and C1 is the criterion number in the formula;(B) Red shows the prediction results of Hattori and Kawamata (1980)’s formula and C2 is the criterion number in the formula.
4 Discussion
This study reports the outcomes of physical model experiments that investigate three beach nourishment methods and summarizes them in Table 3, which greatly enriched the understanding of the morphology evolution law after beach nourishments. There is no doubt that bar nourishment can protect beaches from erosion by severe storm conditions, but the effects are not immediately apparent, such as the widening of the beach berm and the advancement of the shoreline (Ojeda and Guillén, 2008). Bar nourishment aims to gradually transfer sand from the lower nearshore to the upper nearshore. The limitations of this study are that under the action of monochromatic waves for 6 hours, sediment deposition near the shore only occurred in three specific conditions (Case A1, A2, and A3). Compared to the other two methods of nearshore sediment replenishment, only a small amount of sediment moved towards the shore within the same duration of wave action, making it difficult to observe a significant sediment transport trend in a short period. The bar nourishment method may not have a noticeable effect on sediment replenishment in a short period, which could potentially influence decision-making for beach managers.
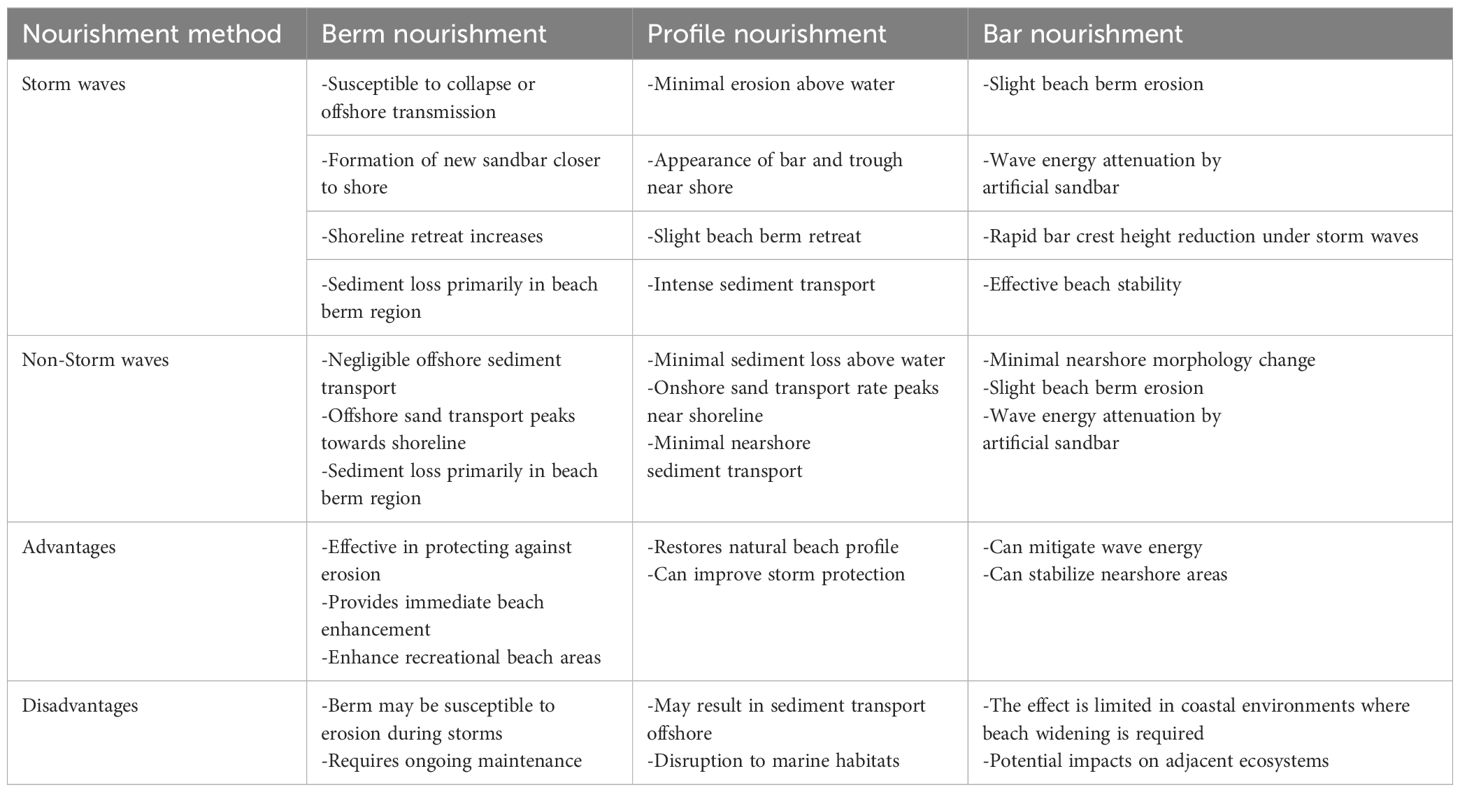
Table 3 Summary of different beach nourishment methods.
In coastal environments, beach profiles are dynamically shaped by the interplay of non-storm and storm waves. This natural process leads to significant alterations in the beach profile over time. The experiment conducted by Grasso et al. (2011) demonstrates that intermittent replenishment of sand in the upper nearshore zone, similar to profile nourishment, effectively facilitates sediment transfer and assists in the restoration of beach surfaces. These findings underscore the efficacy of sediment augmentation in the upper nearshore as a strategy for beach preservation. Building on these experimental insights, it is advisable to evaluate berm nourishment or profile nourishment, particularly for beaches experiencing smaller wave heights. While a substantial proportion of the added sand predominantly accumulates in the upper nearshore, a fraction of the sediment is concurrently transported offshore. This process not only helps replenish the beach but also contributes to the restoration of underwater topography (Karasu et al., 2008; van Bemmelen et al., 2020). In addition, due to issues related to alongshore sediment transport, estimating the amount of sediment loss in beach nourishment projects is extremely challenging. The “Sand Engine” beach nourishment project on the Dutch coast revealed a correlation between sediment transport and wave energy, whereby high-energy months drive alongshore movement while low-energy months prompt cross-shore sediment migration (de Schipper et al., 2016, 2021). Due to flume width limitations, our study exclusively addressed cross-shore sediment transport, with a specific focus on predicting erosion and accretion patterns in beach nourishment projects. Future opportunities are anticipated to facilitate additional exploration of nearshore sediment transport dynamics.
In this experiment, the observed profile changes and sediment migration rates show some differences compared to those in nature, due to the use of unscaled sediments. This factor does not fundamentally alter the comparative effectiveness of different nourishment methods, such as berm, profile, and bar. However, it suggests that the extent of changes, particularly concerning beach profile steepness and sediment redistribution, could be more pronounced in these experimental conditions. The quicker settling of sediments, due to faster fall velocities, results in a shorter offshore transport distance before they settle out of suspension. This diminished offshore movement leads to a lower overall sediment transport rate across the profile. Consequently, sediment tends to remain closer to its initial placement during beach nourishment. This might give the impression of better retention of nourishment volumes, but it could also mean that the beach profile does not adjust or equilibrate to natural conditions as effectively over time. The expedited sediment fall velocities observed in our experiments could prompt more immediate changes in the beach profile than what might typically be seen in natural settings, especially under storm wave conditions. It is important to note that our findings, derived from flume experiments, are likely to underestimate sediment transport rates in both the swash zone and upper shoreface. This limitation suggests that the results of this flume experiment may overestimate the stability of underwater sediments in beach nourishment projects. Given Wanpingkou Beach’s status as a popular tourist destination, it is advisable from a management perspective to prioritize berm nourishment. This approach is essential to significantly increase beach width and ensure long-term stability post-nourishment.
Beach nourishment is a multifaceted process influenced by various factors such as local geography, sediment characteristics, wave conditions, and environmental regulations. Additionally, each beach nourishment method has its advantages and limitations, making it challenging to definitively determine the “best” method in all circumstances. However, based on our findings, some insights and considerations can be offered that may guide decision-making in beach nourishment projects. We suggest that project planners and stakeholders carefully evaluate the specific objectives, constraints, and environmental conditions of their particular site before selecting a beach nourishment method. Factors to consider may include the desired beach morphology, the availability of sediment sources, the cost-effectiveness of each method, and the long-term sustainability of the chosen approach (Brand et al., 2022). In the future, a combination of sand replenishment in different areas can be considered to bring out the best effect of sand replenishment and conservation and to improve the efficiency of beach nourishment.
5 Conclusions
In this study, wave height distribution, the evolution of the profile, net sediment transport, shoreline recession, and the change in beach volume are observed and recorded to investigate the effect of three beach nourishment methods (berm nourishment, profile nourishment, and bar nourishment) under non-storm and storm waves. Among the three beach nourishment methods, the wave dissipation effect in the bar nourishment is stronger, resulting in the wave break in advance and lower wave height near the shore. The differences in profile changes caused by different sand feed locations: the beach berm collapse is the main feature in the berm nourishment; there is a slight accumulation or erosion trend near the shore in profile nourishment; the beach profile change is concentrated near the artificial bar in bar nourishment. The increase in wave height leads to shore erosion in storm wave conditions and the increase in wave period leads to sediment deposition on the shore in non-storm wave conditions. The slope of the swash zone is constant under a variety of non-storm and storm wave conditions, which is related to the properties of the sediment itself.
Regardless of the variation in incident waves, the final shoreline positions in the berm nourishment and profile nourishment are similar, and both methods effectively widen the beach width. Although bar nourishment can effectively decline the shoreline recession compared with no nourishment case, it cannot expand the width of the beach in a short time.
The overall change rate of the profile under storm wave conditions is higher than that under non-storm wave conditions. Under storm wave conditions, the minimum value of change rate at the beginning is profile nourishment, and the overall change rate of the three beach nourishment methods is close after a long time. Bar nourishment maintains a high change rate under non-storm wave conditions. The volume of the shore, the upper nearshore, and the lower nearshore tend to be similar in the berm nourishment and profile nourishment, especially in storm conditions where there is a significant transfer of sediment from the upper part to the lower nearshore. Under non-storm wave conditions, the slow transport of sediment from the nourished sandbar to the nearshore does not yield immediate visible effects after sand replenishment.
Last but not least, the prediction of erosion and accretion after beach nourishment is found to be accurate by Sunamura and Horikawa (1974)’s formula. The erosion prediction outcomes derived from the formula proposed by Hattori and Kawamata (1980) tend to overestimate, prompting a revision of its criterion number, denoted as C2, from 0.5 to 1.25, based on the integration of data from a beach nourishment experiment conducted in a wave flume.
Data availability statement
The original contributions presented in the study are included in the article/supplementary materials, further inquiries can be directed to the corresponding author/s.
Author contributions
YM: Data curation, Writing – original draft, Writing – review & editing. ZQ: Data curation, Methodology, Writing – original draft, Writing – review & editing. XL: Resources, Writing – review & editing. MZ: Data curation, Methodology, Writing – original draft, Writing – review & editing. BL: Conceptualization, Funding acquisition, Resources, Writing – review & editing.
Funding
The author(s) declare that financial support was received for the research, authorship, and/or publication of this article. The authors would like to acknowledge the support of the National Key Research and Development Program of China (Grant No. 2021YFB2601100), the National Natural Science Foundation of China (Grant No. 52088102).
Conflict of interest
The authors declare that the research was conducted in the absence of any commercial or financial relationships that could be construed as a potential conflict of interest.
Publisher’s note
All claims expressed in this article are solely those of the authors and do not necessarily represent those of their affiliated organizations, or those of the publisher, the editors and the reviewers. Any product that may be evaluated in this article, or claim that may be made by its manufacturer, is not guaranteed or endorsed by the publisher.
References
André C., Boulet D., Rey-Valette H., Rulleau B. (2016). Protection by hard defence structures or relocation of assets exposed to coastal risks: Contributions and drawbacks of cost-benefit analysis for long-term adaptation choices to climate change. Ocean. Coast. Manage. 134, 173–182. doi: 10.1016/j.ocecoaman.2016.10.003
Armaroli C., Grottoli E., Harley M. D., Ciavola P. (2013). Beach morphodynamics and types of foredune erosion generated by storms along the emilia-romagna coastline, Italy. Geomorphology 199, 22–35. doi: 10.1016/j.geomorph.2013.04.034
Atkinson A. L., Baldock T. E. (2020). Laboratory investigation of nourishment options to mitigate sea level rise induced erosion. Coast. Eng. 161, 103769. doi: 10.1016/j.coastaleng.2020.103769
Atkinson A. L., Baldock T. E., Birrien F., Callaghan D. P., Nielsen P., Beuzen T., et al. (2018). Laboratory investigation of the bruun rule and beach response to sea level rise. Coast. Eng. 136, 183–202. doi: 10.1016/j.coastaleng.2018.03.003
Baldock T., Birrien F., Atkinson A., Shimamoto T., Wu S., Callaghan D., et al. (2017). Morphological hysteresis in the evolution of beach profiles under sequences of wave climates-part 1; observations. Coast. Eng. 128, 92–105. doi: 10.1016/j.coastaleng.2017.08.005
Barnard P., Erikson L. H., Hansen J. (2009). Monitoring and modeling shoreline response due to shoreface nourishment on a high-energy coast. J. Coast. Res., 29–33.
Brand E., Ramaekers G., Lodder Q. (2022). Dutch experience with sand nourishments for dynamic coastline conservation–an operational overview. Ocean. Coast. Manage. 217, 106008. doi: 10.1016/j.ocecoaman.2021.106008
Chen W. L., Muller P., Grabowski R. C., Dodd N. (2022). Green nourishment: An innovative nature-based solution for coastal erosion. Front. Mar. Sci. 8. doi: 10.3389/fmars.2021.814589
Chen Y., Xu Z., Lee D.-Y. (2017). Numerical test on the impacts of submerged breakwaters for different design parameters. J. Coast. Res. 79, 299–303.
Chi S., Zhang C., Zheng J. (2023). Sandy shoreline recovery ability after breakwater removal. Front. Mar. Sci. 10. doi: 10.3389/fmars.2023.1191386
Dean R. G. (1973). Heuristic models of sand transport in the surf zone. In First Australian Conference on Coastal Engineering. Engineering Dynamics of the Coastal Zone, 1973 215–221.
Dean B., Collins I., Divoky D., Hatheway D., Scheffner C. N. (2005). FEMA coastal flood hazard analysis and mapping guidelines focused study report. Tech. rep.
de Schipper M. A., de Vries S., Ruessink G., de Zeeuw R. C., Rutten J., van Gelder-Maas C., et al. (2016). Initial spreading of a mega feeder nourishment: Observations of the sand engine pilot project. Coast. Eng. 111, 23–38. doi: 10.1016/j.coastaleng.2015.10.011
de Schipper M. A., Ludka B. C., Raubenheimer B., Luijendijk A. P., Schlacher T. A. (2021). Beach nourishment has complex implications for the future of sandy shores. Nat. Rev. Earth Environ. 2, 70–84. doi: 10.1038/s43017-020-00109-9
Enríquez A. R., Marcos M., Falqués A., Roelvink D. (2019). Assessing beach and dune erosion and vulnerability under sea level rise: A case study in the mediterranean sea. Front. Mar. Sci. 6. doi: 10.3389/fmars.2019.00004
Gee H. C. (1965). Beach nourishment from offshore sources. J. Waterways. Harbors. Division. 91, 1–5. doi: 10.1061/jwheau.0000403
Goda Y. (2010). Random seas and design of maritime structures Vol. 33 (World Scientific Publishing Company). 2, 1665–1678. doi: 1142/7425
Goda Y., Suzuki T. (1976). Estimation of incident and reflected waves in random wave experiments. In Coastal Engineering 1976, 828–845. doi: 10.9753/icce.v15.47
Grasso F., Michallet H., Barthélemy E. (2011). Experimental simulation of shoreface nourishments under storm events: A morphological, hydrodynamic, and sediment grain size analysis. Coast. Eng. 58, 184–193. doi: 10.1016/j.coastaleng.2010.09.007
Grunnet N. M., Ruessink B., Walstra D.-J. R. (2005). The influence of tides, wind and waves on the redistribution of nourished sediment at terschelling, the Netherlands. Coast. Eng. 52, 617–631. doi: 10.1016/j.coastaleng.2005.04.001
Hallermeier R. J. (1981). A profile zonation for seasonal sand beaches from wave climate. Coast. Eng. 4, 253–277. doi: 10.1016/0378-3839(80)90022-8
Hattori M., Kawamata R. (1980). Onshore-offshore transport and beach profile change. in Coastal Engineering, 1980, 1175–1193 doi: 10.1061/9780872622647.072
Herman P. M. J., Moons J. J. S., Wijsman J. W. M., Luijendijk A. P., Ysebaert T. (2021). A mega-nourishment (sand motor) affects landscape diversity of subtidal benthic fauna. Front. Mar. Sci. 8. doi: 10.3389/fmars.2021.643674
Hoefel F., Elgar S. (2003). Wave-induced sediment transport and sandbar migration. Science 299, 1885–1887. doi: 10.1126/science.1081448
Karasu S., Work P. A., Cambazoğlu M. K., Ömer Y (2008). Coupled longshore and cross-shore models for beach nourishment evolution at laboratory scale. J. Waterway. Port. Coastal. Ocean. Eng. 134, 30–39. doi: 10.1061/(asce)0733-950x(2008)134:1(30
Khoury A., Jarno A., Marin F. (2019). Experimental study of runup for sandy beaches under waves and tide. Coast. Eng. 144, 33–46. doi: 10.1016/j.coastaleng.2018.12.003
Kobayashi N., Agarwal A., Johnson B. D. (2007). Longshore current and sediment transport on beaches. J. Waterway. Port. Coastal. Ocean. Eng. 133, 296–304. doi: 10.1061/(ASCE)0733-950X(2007)133:4(296
Larsen B. E., van der A D. A., Carstensen R., Carstensen S., Fuhrman D. R. (2023). Experimental investigation on the effects of shoreface nourishment placement and timing on long-term cross-shore profile development. Coast. Eng. 180, 104258. doi: 10.1016/j.coastaleng.2022.104258
Li Y., Wang P., Li Q., Dai W., Zhao B., Chen D., et al. (2023). Roles of breaking and reflection in wave energy attenuation on the shoreface-nourished beach. Phys. Fluids. 35(8). doi: 10.1063/5.0156764
Liang B., Qu Z., Lee D. Y., Zhang X. (2023). Laboratory investigation of hydrodynamic and sand dune morphology changes under wave overwash. J. Geophys. Res.: Oceans. 128(9):e2023JC019845. doi: 10.1029/2023jc019845
Lim C., Lee J.-L. (2023). Derivation of governing equation for short-term shoreline response due to episodic storm wave incidence: comparative verification in terms of longshore sediment transport. Front. Mar. Sci. 10. doi: 10.3389/fmars.2023.1179598
Masselink G., Russell P. (2006). Flow velocities, sediment transport and morphological change in the swash zone of two contrasting beaches. Mar. Geol. 227, 227–240. doi: 10.1016/j.margeo.2005.11.005
McCall R., de Vries J. V. T., Plant N., Dongeren A. V., Roelvink J., Thompson D., et al. (2010). Two-dimensional time dependent hurricane overwash and erosion modeling at santa rosa island. Coast. Eng. 57, 668–683. doi: 10.1016/j.coastaleng.2010.02.006
Nicholls R. J., Birkemeier W. A., hong Lee G. (1998). Evaluation of depth of closure using data from duck, NC, USA. Mar. Geol. 148, 179–201. doi: 10.1016/S0025-3227(98)00011-5
Ojeda E., Guillén J. (2008). Shoreline dynamics and beach rotation of artificial embayed beaches. Mar. Geol. 253, 51–62. doi: 10.1016/j.margeo.2008.03.010
Pan Y., Yin S., Chen Y., Yang Y., Xu C., Xu Z. (2022). An experimental study on the evolution of a submerged berm under the effects of regular waves in low-energy conditions. Coast. Eng. 176, 104169. doi: 10.1016/j.coastaleng.2022.104169
Qu Z., Liang B., Lee D. Y., Zhang Z. (2023). The effect of water level rise on coastal wave overwash and inundation of dunes in laboratory. Estuarine. Coast. Shelf. Sci. 282, 108246. doi: 10.1016/j.ecss.2023.108246
Risio M. D., Lisi I., Beltrami G., Girolamo P. D. (2010). Physical modeling of the cross-shore short-term evolution of protected and unprotected beach nourishments. Ocean. Eng. 37, 777–789. doi: 10.1016/j.oceaneng.2010.02.008
Seymour R. J., Bockstael N. E., Campbell T. J., Dean R. G., Komar P. D., Pilkey O. H., et al. (1995). Beach Nourishment and Protection (National Academies Press). doi: 10.1061/9780872622647.072
Smith E. R., Mohr M. C., Chader S. A. (2017). Laboratory experiments on beach change due to nearshore mound placement. Coast. Eng. 121, 119–128. doi: 10.1016/j.coastaleng.2016.12.010
Suh K.-D., Kwon H.-D., Lee D.-Y. (2010). Some statistical characteristics of large deepwater waves around the korean peninsula. Coast. Eng. 57, 375–384. doi: 10.1016/j.coastaleng.2009.10.016
Sunamura T., Horikawa K. (1974). Two-dimensional beach transformation due to waves. Coast. Eng. Proc. 1, 53. doi: 10.9753/icce.v14.53
van Bemmelen C., de Schipper M., Darnall J., Aarninkhof S. (2020). Beach scarp dynamics at nourished beaches. Coast. Eng. 160, 103725. doi: 10.1016/j.coastaleng.2020.103725
van Duin M., Wiersma N., Walstra D., van Rijn L., Stive M. (2004). Nourishing the shoreface: observations and hindcasting of the egmond case, the Netherlands. Coast. Eng. 51, 813–837. doi: 10.1016/j.coastaleng.2004.07.011
van Rijn L. (2011). Coastal erosion and control. Ocean. Coast. Manage. 54, 867–887. doi: 10.1016/j.ocecoaman.2011.05.004
Vellinga P. (1982). Beach and dune erosion during storm surges. Coast. Eng. 6, 361–387. doi: 10.1016/0378-3839(82)90007-2
Work P. A., Rogers W. E. (1998). Laboratory study of beach nourishment behavior. J. Waterway. Port. Coastal. Ocean. Eng. 124, 229–237. doi: 10.1061/(asce)0733-950x(1998)124:5(229
Yin P., Duan X.-y., Gao F., Li M.-n., Lü S.-h., Qiu J.-d., et al. (2018). Coastal erosion in shandong of China: status and protection challenges. China Geol. 1, 512–521. doi: 10.31035/cg2018073
Keywords: beach nourishment, profile evolution, sediment transport, shoreline recession, beach erosion, erosion prediction
Citation: Meng Y, Qu Z, Li X, Zhu M and Liang B (2024) An experimental study on the evolution of beach profiles under different beach nourishment methods. Front. Mar. Sci. 11:1381937. doi: 10.3389/fmars.2024.1381937
Received: 04 February 2024; Accepted: 19 March 2024;
Published: 04 April 2024.
Edited by:
Zeng Zhou, Hohai University, ChinaCopyright © 2024 Meng, Qu, Li, Zhu and Liang. This is an open-access article distributed under the terms of the Creative Commons Attribution License (CC BY). The use, distribution or reproduction in other forums is permitted, provided the original author(s) and the copyright owner(s) are credited and that the original publication in this journal is cited, in accordance with accepted academic practice. No use, distribution or reproduction is permitted which does not comply with these terms.
*Correspondence: Zhipeng Qu, cXV6aGlwZW5nQHN0dS5vdWMuZWR1LmNu
†ORCID: Zhipeng Qu, orcid.org/0000-0001-5136-067X
Bingchen Liang, orcid.org/0000-0003-2725-7212