 Mak Gracic
 Guy Gubnitsky
 Roee Diamant
- 1Hatter Department of Marine Technologies, University of Haifa, Haifa, Israel
- 2Project Cetacean Translation Initiative (CETI), New York, NY, United States
- 3Faculty of Electrical Engineering and Computing, University of Zagreb, Zagreb, Croatia
Echolocation clicks, emitted by Sperm Whales (Physeter macrocephalus) and Dolphins for foraging, echolocation and socialization, serve as bioindicators for monitoring marine ecosystems. Detecting click signals provides information on the abundance of species, their behavior and their responses to environmental changes. This paper provides a survey of the many detection and classification methodologies for clicks, ranging from 2002 to 2023. We divide the surveyed techniques into categories by their methodology. Specifically, feature analysis (e.g., phase, ICI and duration), frequency content, energy-based detection, supervised and unsupervised machine learning, template matching and adaptive detection approaches. Also surveyed are open access platforms for click detections, and databases openly available for testing. Details of the method applied for each paper are given along with advantages and limitations, and for each category we analyze the remaining challenges. The paper also includes a performance comparison for several schemes over a shared database. Finally, we provide tables summarizing the existing detection schemes in terms of challenges address, methods, detection and classification tools applied, features used and applications.
1 Introduction
Echolocation clicks are emitted by cetaceans for self-navigation or to locate prey (Zapetis and Szesciorka, 2022). In view of the high occurrence of echolocation clicks, these signals serve as important bioindicators that can be used to draw conclusions about the abundance of cetacean species (Frasier et al., 2022; Fleishman et al., 2023). The analysis of these signals for presence detection or to classify individuals includes the temporal and spectral processing and the characterization of signals to investigate animal behavior patterns (André et al., 2011). Indirectly, the detection and classification of clicks can serve as key techniques to understand anthropogenic impacts on the marine environment and to develop data-driven strategies and regulations (Frasier et al., 2022; Allen et al., 2024). Since monitoring the activities of marine animals by passive acoustic monitoring (PAM) requires the analysis of large data sets, there is a need for automatic detection (Barkley et al., 2024). The development of such detectors for echolocation clicks results from the broadband structure of these signals (Au and Hastie, 2007). While previous surveys are offered for detection of bioacoustics vocalizations [(Bittle and Duncan, 2013; Usman et al., 2020; Rideout, 2022)], ours complements these by focusing on detection of transients, focusing on methods that work for these specific signals. We also present the databases used in the reviewed papers as well as implement most significant detection algorithms and compare them to the most commonly used detection software. The methods described herein rely solely on passive acoustic monitoring, which poses no ethical concerns for marine life (Falk and Williams, 2022).
Echolocation clicks of sperm whales and dolphin groups are impulse-like signals that are generated in the animal’s nasal passage as a directionally signal. To produce these signals, marine mammals push air through a pair of specialized organs called monkey lips or phonic lips (Andreas et al., 2022). The result of the air pressure passing through these lips is a “clapping” sound, often referred to as a click (Au and Hastie, 2007). The click sound can also be modified by a special organ in the animal’s forehead that focuses the shape of the click signal, similar to an acoustic lens (Andreas et al., 2022). This process generates short transients that travel through the water and return to the animal as reflections. The animal uses these echoes to create a sound-based image of its surroundings. This last process involves the lower jaw bone, which receives the vibrations and then transmits them to the inner ear (Au and Hastie, 2007). From the sound-based images, the animal is able to analyze its distance to objects, the shape and density of reflectors, and even the speed and trajectory of potential prey (Knuth, 2021). Since we know for the most part how marine animals produce clicks, methods for recognizing such signals are offered for each individual species. Nevertheless, some general characteristics of clicks can be derived.
1.1 Characteristics of clicks
The structure of an echolocation click of a sperm whale or dolphin is characterized by its duration, frequency band, emission rate and directionality (Baumann-Pickering et al., 2010a). These clicks are typically short, pulse-like signals with a frequency band ranging from a few kHz in baleen whales to 160 kHz in some toothed whale species such as the harbor porpoise, depending on the species (Tyack and Janik, 2013). The duration of a sperm whale or dolphin click can range from microseconds to milliseconds (Madsen et al., 2004; Koschinski et al., 2023), and clicks are often produced in sequences: from a few clicks per second to several hundred (Goold and Jones, 1995; Johnson et al., 2008). The direction and shape of the sound beam vary from a narrow beam of 5° in narwhals (Monodon monoceros) to a wide beam that is almost omnidirectional in sperm whales (Physeter macrocephalus) (Zimmer et al., 2005; Koblitz et al., 2016). The distinguishing features of the click usually include the bandwidth, the center frequency and the inter-click interval (ICI) (Baumann-Pickering et al., 2010a; Baumann-Pickering et al., 2013; Cohen et al., 2022; Ziegenhorn et al., 2022). The latter can change depending on factors such as water depth (Simard et al., 2010). Differences in duration and pattern can also vary considerably; not only between species, but also between different individuals of the same species or even for the same individual under different conditions (Baumann-Pickering et al., 2010a; Leu et al., 2022; Cantor et al., 8091). For example, it is known that the change in male sperm whales ICI for slow clicks is between 4 and 10 seconds (Oliveira et al., 2013). The detection of clicks from a particular sperm whale or dolphin must therefore take into account the specific characteristics of the target clicks and distinguish them from clicks from other sources. Furthermore, to be robust, the detection scheme must be able to deal with sounds recorded from the marine environment, all of which may have transient characteristics similar to clicks.
1.2 Challenges for click detection
The main challenges in detecting echolocation clicks of sperm whales or dolphins lie in avoiding false detections due to anthropogenic noise disturbances (e.g., cavitation noise from ships), biological sources (e.g., snapping shrimp noise (SSN)) and transients that follow the strong tail distribution of clicks at sea (Zimmer, 2011). If the propeller turns fast enough, the low pressure areas of the propeller can fall below the vapor pressure and the seawater can boil at ambient temperatures. When the bubbles behind the propeller reach ambient pressure, they implode and large, transient sounds reminiscent of bubble cavitation are emitted (Zhang and Lin, 2019). These signals are generated with an intensity of up to 180dB1µPa / Hz@1m (2009), which can be heard from tens of kilometers away. The SSN signals, in turn, are generated when a snapping shrimp closes its claws quickly. This creates a jet of water that is forced out between the claws and cavitation bubbles are formed. The maximum measured signal strength of SSN was found to be 220 dB re 1 µPa at 1 m (Versluis et al., 2000). Both cavitation and SSN, as well as transients, e.g., caused by waves, can easily be confused with the clicking of a whale or dolphin (Au et al., 1998).
An example of this can be seen in Figure 1, where the time domain of a sperm whale click measured in the Bahamas (Atlantic Undersea Test and Evaluation Center (AUTEC) data) (upper panel) is shown together with SSN clicks (bottom panel). Another challenge is the growing need to detect clicks in real time to enable a real-time system of fixed ocean observatories (Zaugg et al., 2010). Here, a detector with low complexity is needed. In addition, echolocation clicks from multiple emitting animals may overlap in time due to the fast emission rate of the animals, which requires the ability to separate the sources. Finally, measuring the ICI poses another challenge as the sequence of clicks may change over time or overlap with other sources emitting at the same time. Considering the above challenges, a variety of techniques have been proposed to find a robust trade-off between detection and false positive rate.
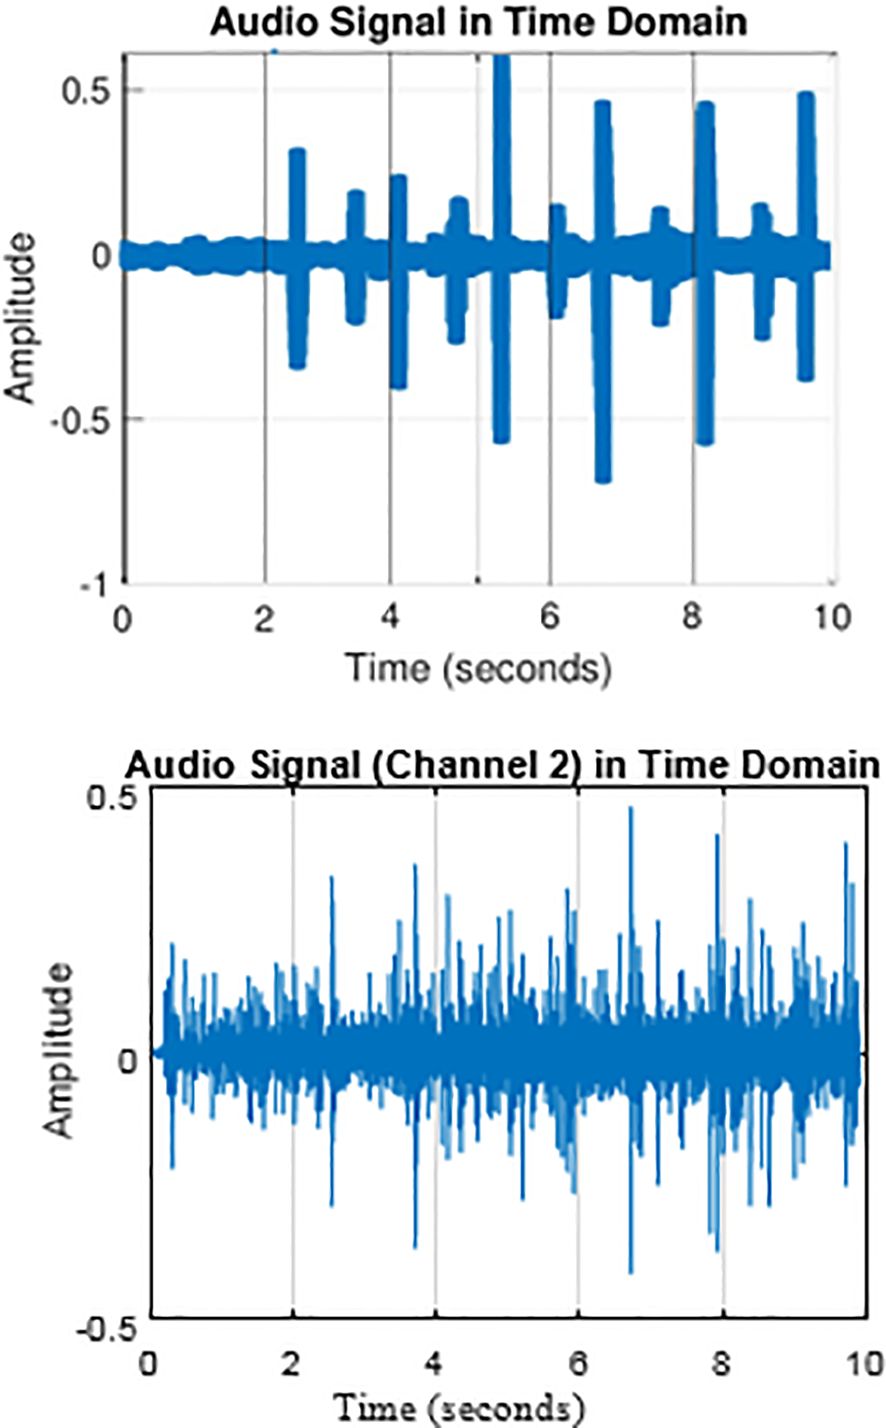
Figure 1. Time domain representation of sperm whale click and SNN transient showing similarities. (A) Recorded click from AUTEC dataset; (B) Typical transient noise from AUTEC dataset.
1.3 Metrics of performance evaluation
For performance evaluation, common metrics are the probability of detection, the F-score and the Receiver Operating Characteristic (ROC). The probability of detection or sensitivity measures the ability of the detection method to correctly identify echolocation clicks. This can be within a certain buffer or for individual clicks. When the detection of individual clicks is of interest, e.g., for classification, the F-score is a balanced measure that combines precision (the proportion of detected clicks that are clicks) with recall (equivalent to the probability of detection). The ROC curve offers a compromise between the probability of detection and the false positive. The Area Under the ROC Curve (AUC) is a measure of this trade-off, where 1 is perfect detection and 0.5 is the chance level, where the ‘chance level’ is the performance expected from random guessing. In the following, we present the available methods for detecting echolocation clicks in detail and comment on their suitability for different scenarios and signals.
1.4 Structure of survey
The Figure 2 represents a structured breakdown of the click detection algorithms, divided into three primary methods. Three branches emanate from the root of the hierarchy. This subdivision represents different system models, ranging from knowing the actual signal structure of the click to no assumed information. The first branch, “feature analysis”, uses the intrinsic properties of the signal, such as “phase”, “frequency” and “energy”, to distinguish echolocation clicks from signals originating from, for example, snapping shrimps. These techniques involve statistical analysis and thresholding, which makes them computationally efficient but prone to errors in detection due to their lack of adaptability to signal variation. Each of these attributes is analyzed by specific techniques such as wavelet transforms and spectral analysis for frequency or energy detection and the Teager–Kaiser energy operator (TKEO) for energy. The second branch, “machine learning based click detection”, is proposed when no statistical information about the click is available. Based on a large dataset of labeled clicks, as well as noise samples, a model is trained to distinguish between clicks and non-click noises and to assign the detected click to its source. The focus is on “supervised convolutional neural networks (CNNs)”, which are an important tool for pattern recognition in complex data sets. Other paradigms of neural networks and machine learning strategies, such as support vector machines, also fall into this category, indicating a variety of methods tailored to learn directly from data. The third and final branch, “data-dependent methods”, uses a predefined knowledge of the expected analytical structure of the echolocation click to compare signals from the channel with a template. The aim is to recognize similarities between the signals and determine the detection based on predefined thresholds. Methods such as the “Tuned Filter”, the “Side Test” and the “Adaptive Threshold” provide a means to improve the detection process. At the end of each category, we present a table summarizing the most important information about the reviewed categories. Next, we provide an overview of challenges that remain with each category. Finally, a summary including useful information about the methods examined is presented, where the ‘useful information’ refers to the key acoustic features. A detailed explanation of the implementation of the selected detector algorithms from each category, including the results obtained with real data, is presented. The algorithms were selected based on their relevance, ingenuity and impact on the field. A list of relevant available databases was then presented. Finally, all methods were grouped based on certain criteria to show some of the alternative criteria by which the methods could have been grouped and to highlight the similarity between the methods from the same groups. In addition, some common metrics are identified to evaluate the detection performance.
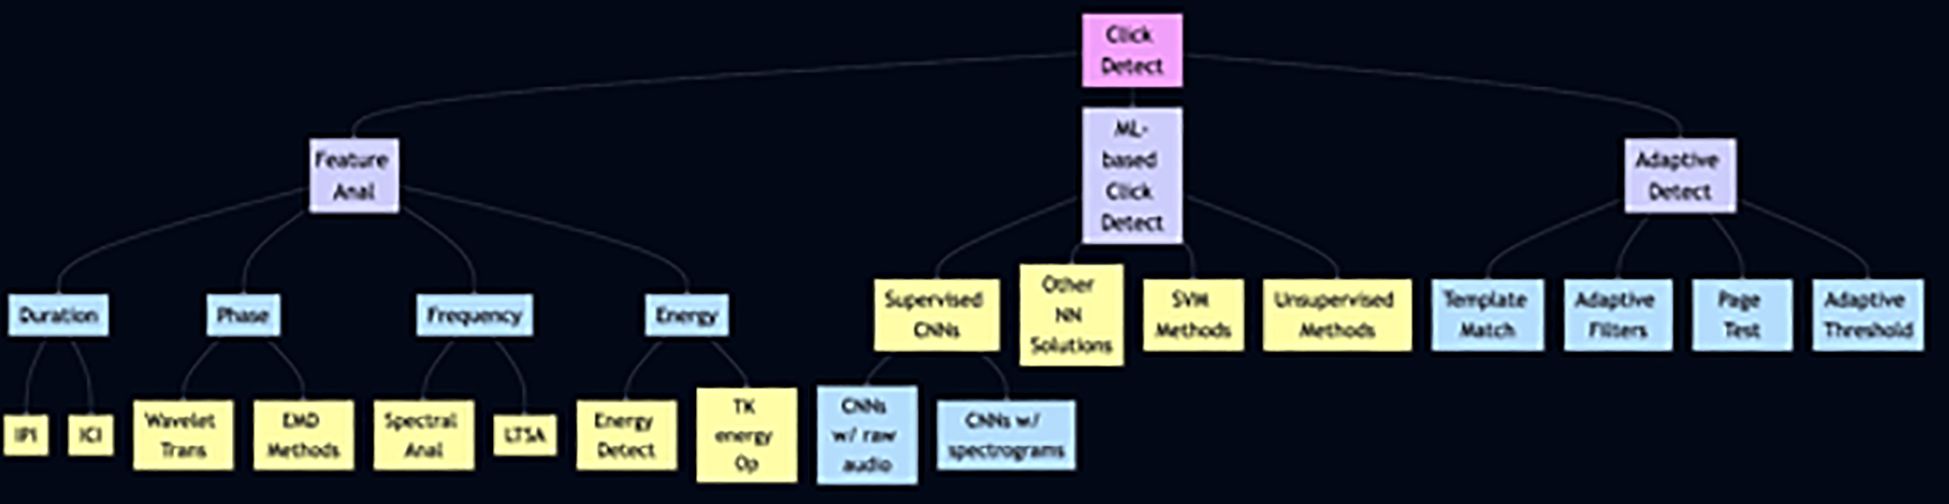
Figure 2. The block diagram of algorithm categories.
This survey provides a comprehensive assessment of click detection methods by categorizing the existing literature based on three main aspects:
1. Methods relying on feature analysis. Table 1.
2. Methods relying on machine learning techniques. Table 2.
3. Methods relying on statistical data analysis. Table 3.
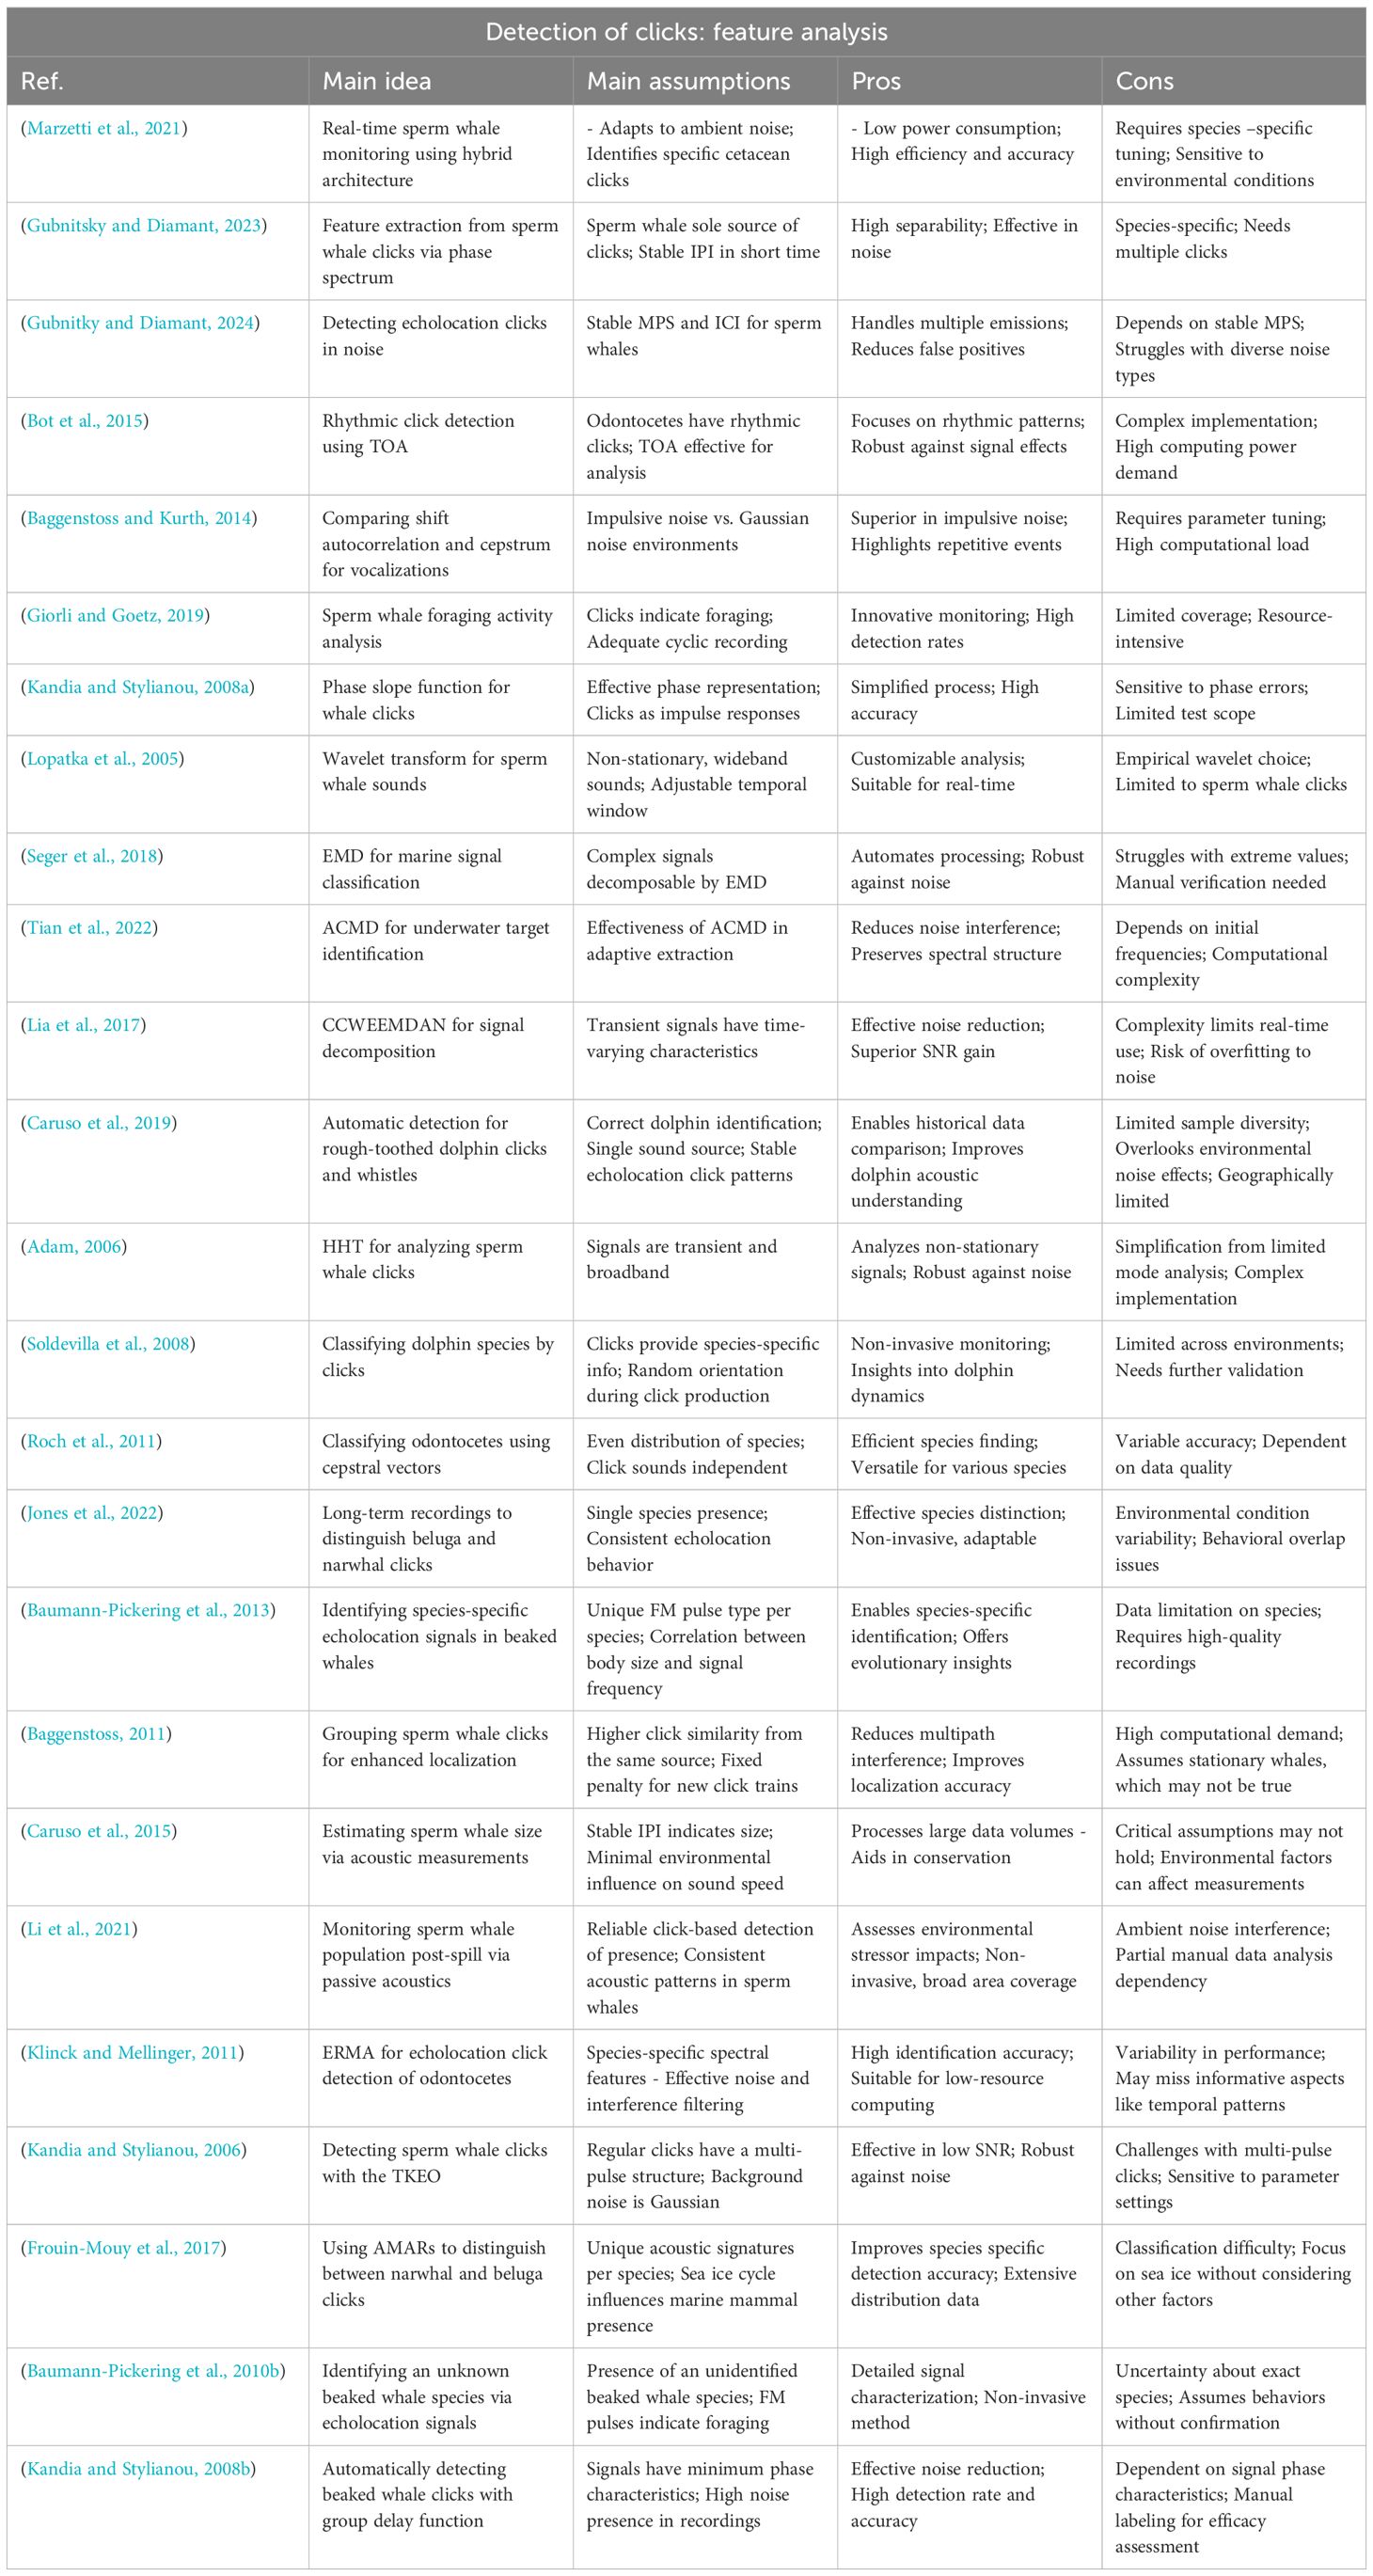
Table 1. Summary of feature analysis detection techniques.
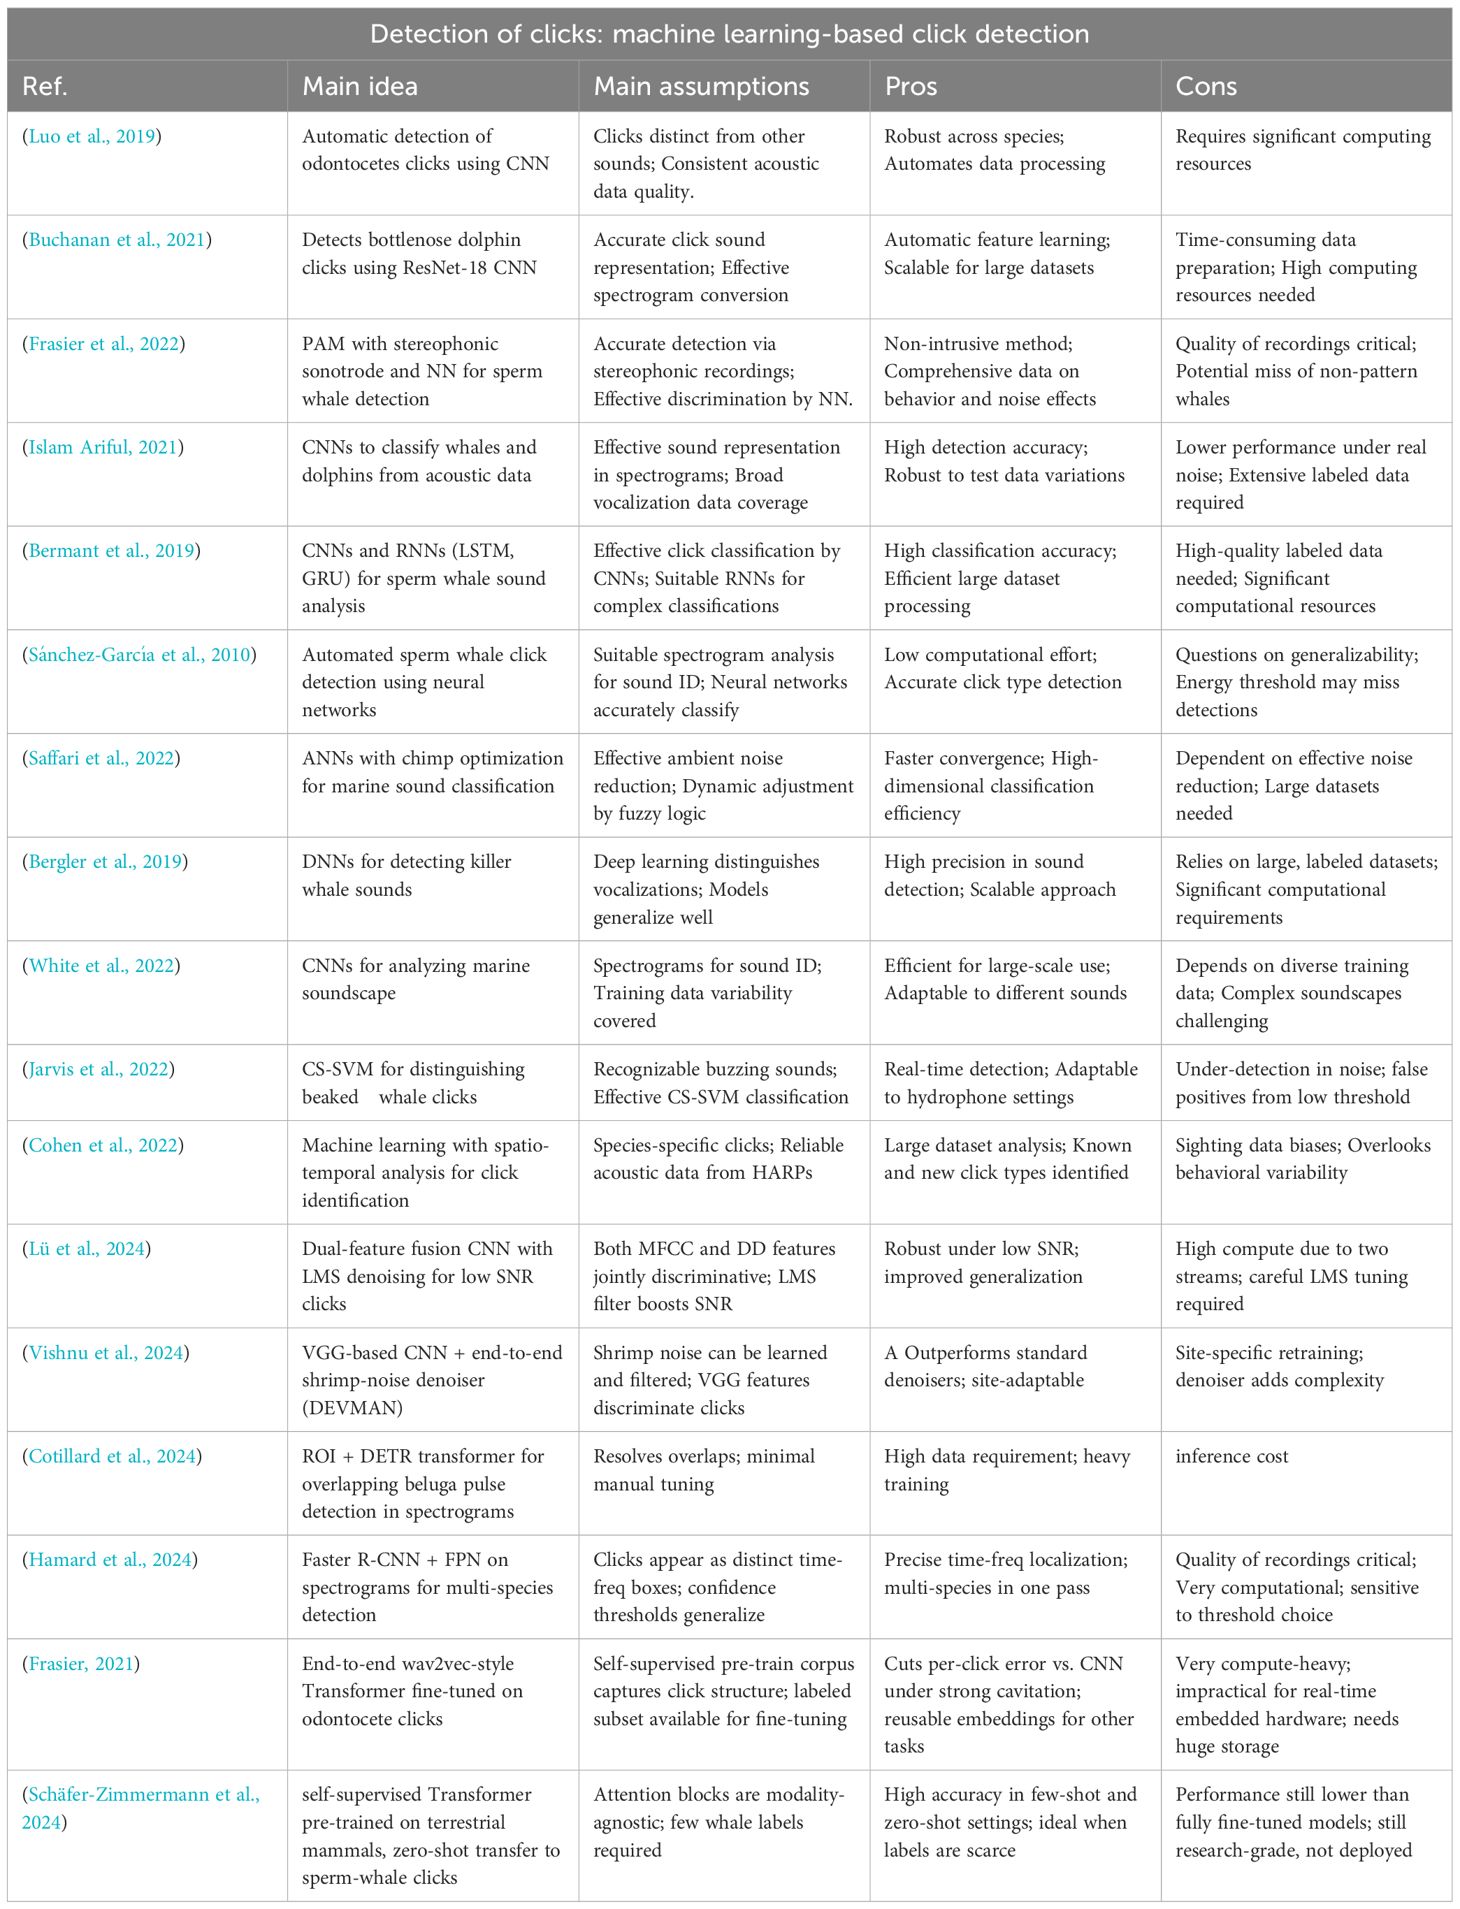
Table 2. Summary of machine learning detection techniques.
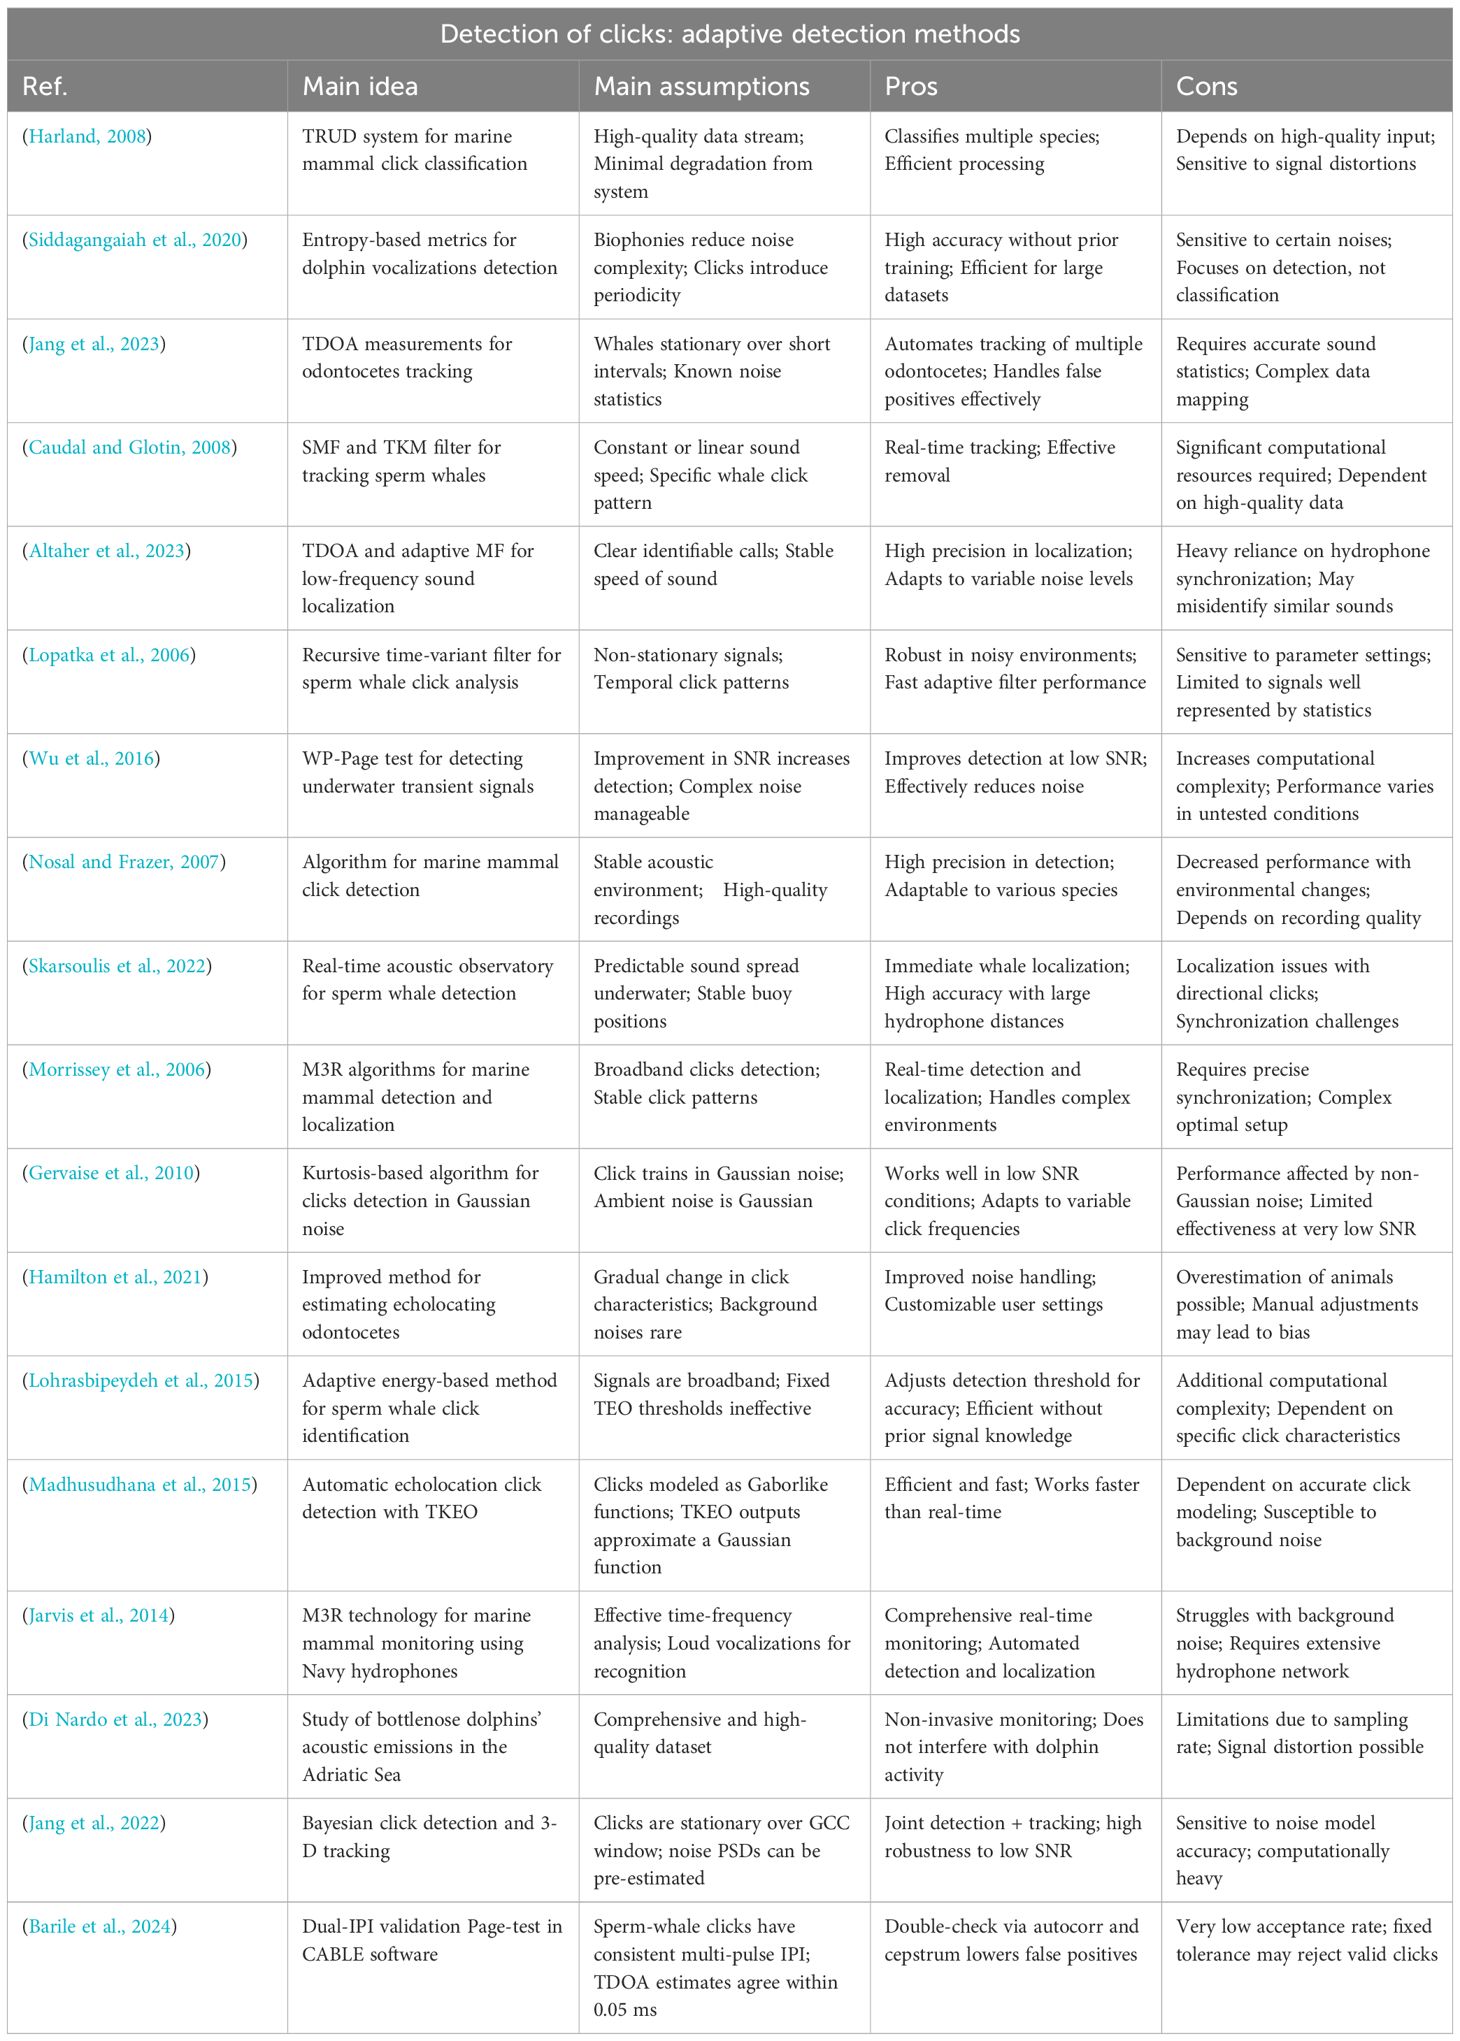
Table 3. Summary of detection techniques based on statistical analysis of databases.
We also provide a summary of the papers that share their data base (Table 3); list papers that handle which challenge in the detection task (Table 4); a division of methods by their evaluation methodology (Table 5), as well as a division by the application considered to each method (Table 6); Division of papers by the tools they use for detection (Table 7); and Division of methods by the signal characteristics considered as cues for detection (Table 8).
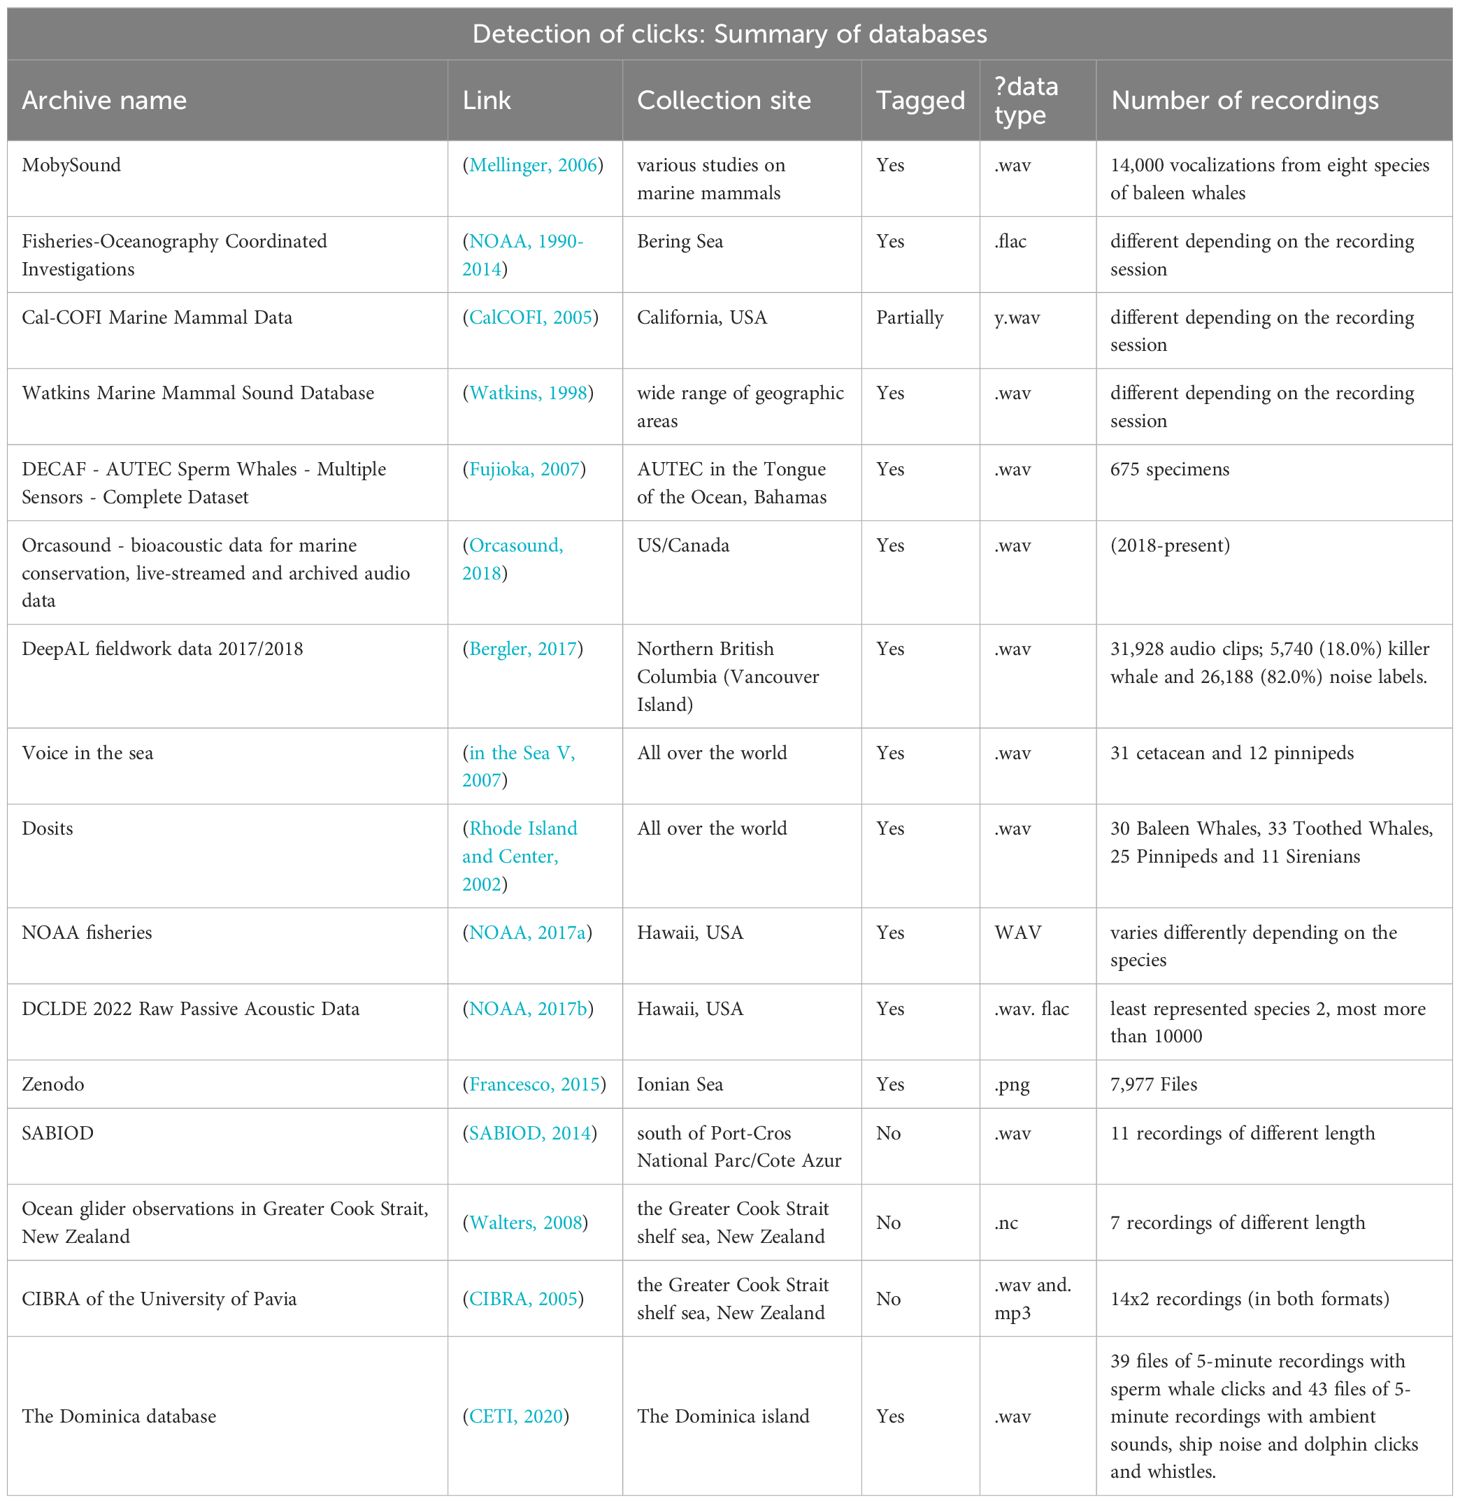
Table 4. Table of publicly available databases and key characteristics.
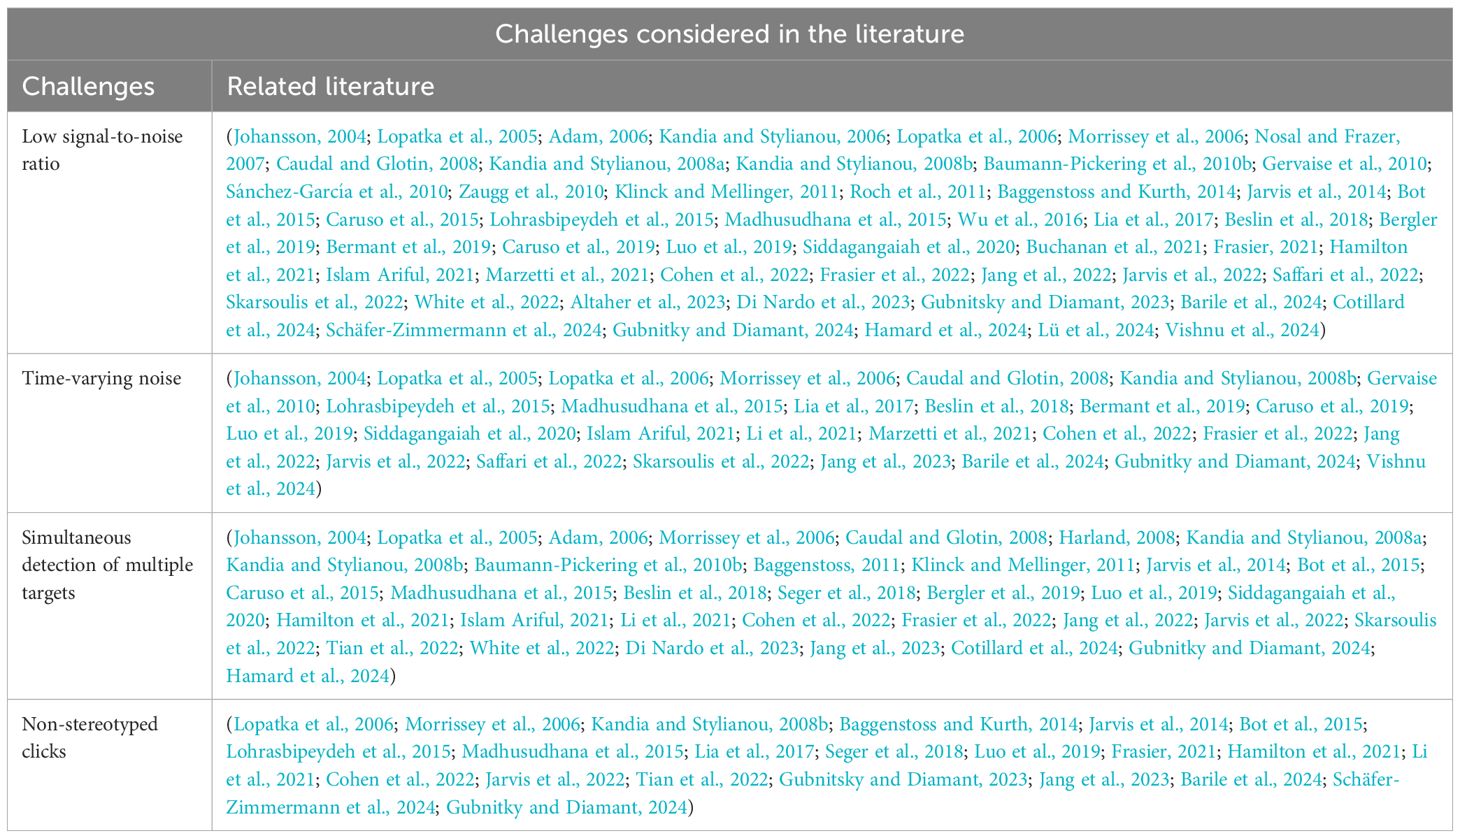
Table 5. Table of challenges the detection methods overcame.
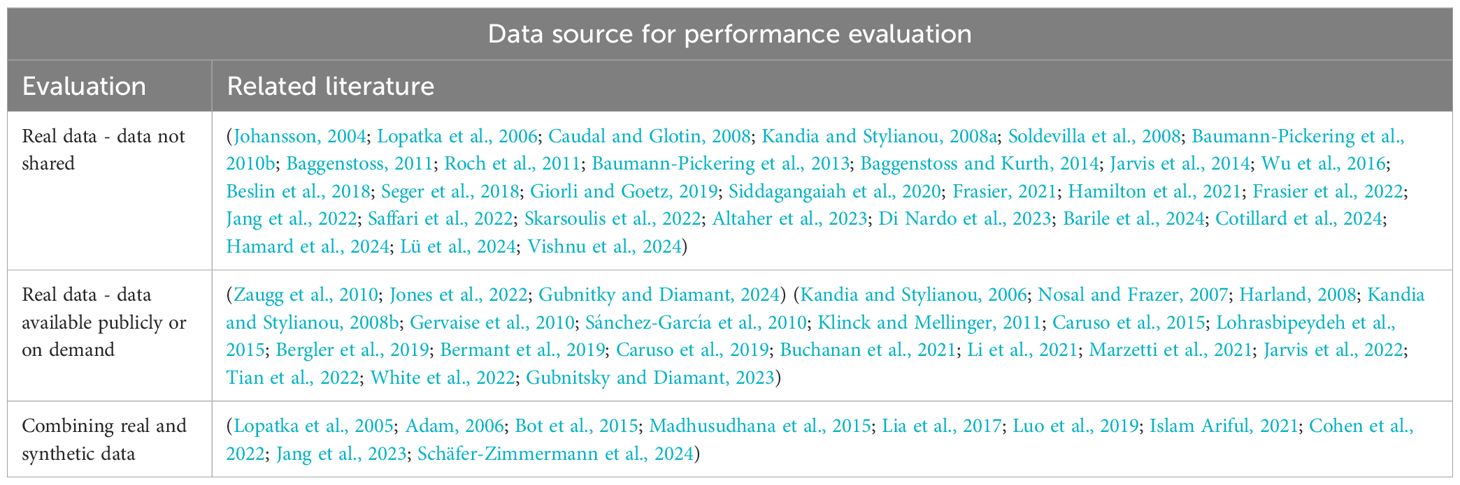
Table 6. Table of types of data the detection methods were tested on.
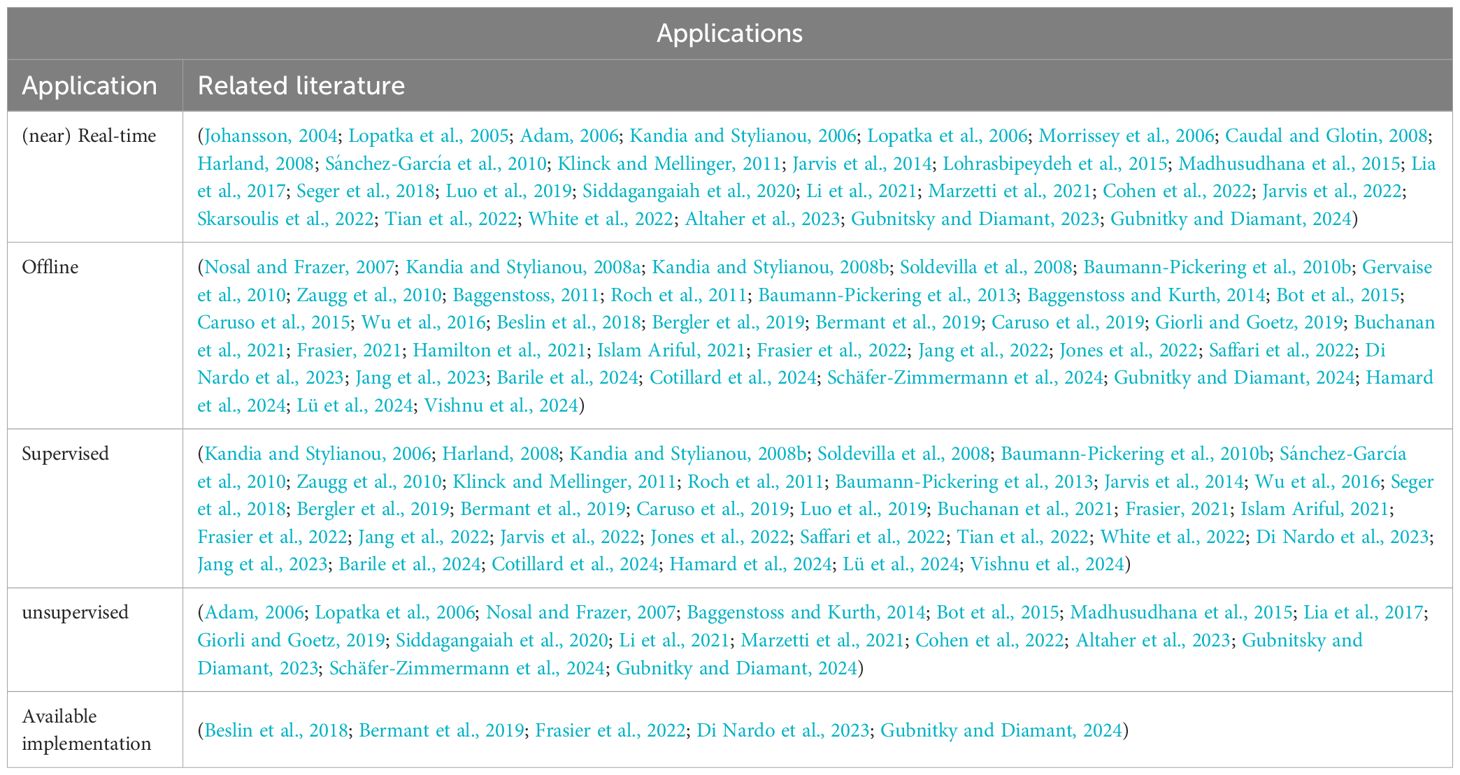
Table 7. Table of possible method applications.
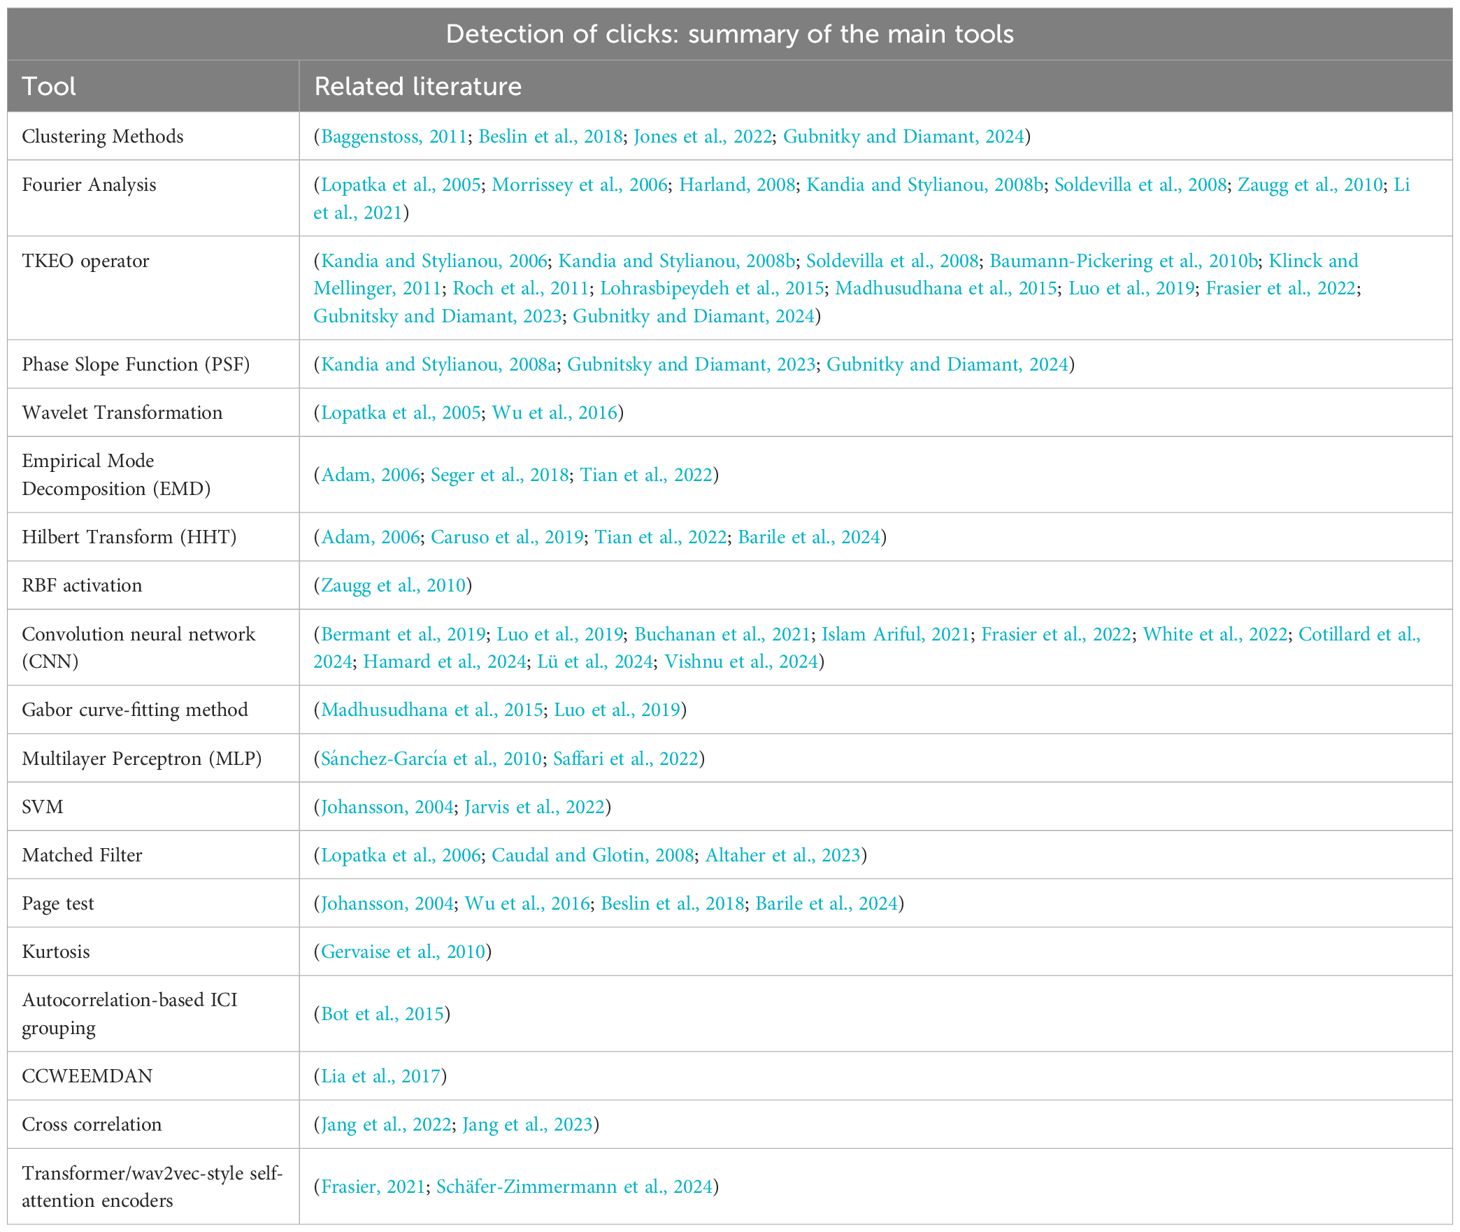
Table 8. Table of main tools utilized in click detection methods.
2 Feature analysis
The term “features” refers to characteristics and properties of a signal that can be used to recognize or classify the signal. It is a process that involves the selection, extraction and evaluation of properties of the signal that are used to represent the structure of the click. The feature analysis approach to recognition focuses on isolating relevant attributes of the data through which key features are discovered, followed by recognition and classification. Below we provide an overview of the features used for click recognition.
2.1 Duration
2.1.1 Inter-pulse interval
As previously discussed click duration alone may be ambiguous. An informative additional feature is the inter-pulse interval (IPI). The method described in (Marzetti et al., 2021) starts with an ultra-low power detector that performs an initial event analysis to significantly reduce false positives and thus increase reliability by ensuring that only probable clicks are forwarded for further analysis. A state machine analysis is then performed that integrates expert rules based on two important bioacoustic criteria: the click duration and inter-click interval. The method uses the duration of the main click peak and the time between successive clicks to confirm the likelihood of a whale source. A click counter and validation process is an integral part of the system and provides further accuracy. This mechanism increments the click counter on pulses that match acoustic emissions from whales and compares the duration between clicks to a reference interval to confirm click detection. The sensitivity of click detection is adjusted based on the observed rates of false-positive positives and true-positive clicks. The strengths of this new method lie in its energy efficiency and improved accuracy. The design also minimizes microcontroller activity, which significantly reduces power consumption. In (Gubnitsky and Diamant, 2023), the authors present a novel method that focuses on the IPI of their clicks to improve the detection and classification of sperm whale vocalizations. In addition to amplifying the signals to improve signal-to-noise ratio (SNR), the method also uses a phase-based IPI estimator to accurately recognize the inter-pulses. The method focuses on estimating the time between the major and minor pulses in a whale’s click by using the phase-slope function (PSF) to accurately indicate the pulse positions and evaluating the IPI by the time difference between positive zero crossings. The method also includes feature extraction and segmentation to assess the consistency of the clicks and to separate valid IPIs from noise. The change from waveform-based detection to a phase characteristic-centered approach provides greater resilience to noise and signal distortion, although it relies on the assumption of consistent, multi-pulsed click patterns. An extension of this method can be found in (Gubnitky and Diamant, 2024), where the stability of the multi-pulse structure of identified transients is used to indicate the presence of sperm whales’ clicks. The method starts with the transient detection phase using the TKEO. For each detection, the multi-pulse structure (MPS) is calculated by taking the time interval between prominent pulses in the millisecond range. Assuming that the MPS representing the IPI of the whales or a multipath reflection is stable in time windows of a few seconds, a clustering solution is applied to find groups of clicks that fulfill the ICI (inter-click interval) conditions and whose variance of the MPS is below a certain threshold. This approach provides a robust solution for detecting sperm whale clicks in challenging environments, such as low SNR, a variety of noise transients, and simultaneously emitting whales. In addition, the method is computationally efficient and can be used in real-time applications. On the other hand, many valid clicks are overlooked to keep the false detection rate low, making the method unsuitable for individual click detection tasks.
2.1.2 Inter-click interval
The temporal pattern of the multipulses within the click is often combined with the inter-click interval (ICI) to capture the rhythmic patterns of click trains. The time difference as a recognition criterion is presented in (Bot et al., 2015) and focuses on the rhythmic characteristics of the click trains of beluga whales. It aims at detecting rhythmic pulse trains, separating click trains from multiple simultaneously clicking odontocetes and characterizing the ICI pattern. This approach handles sub-harmonics in the autocorrelation by rhythmic analysis. The multi-step algorithm starts by converting Time of Arrivals (TOAs) into a time-ICI map, then calculates a threshold to identify peaks corresponding to click trains, and then determines the threshold of the time-ICI map to create a binary map for analysis. This process leads to a detailed understanding of the rhythmic pattern over time. The authors also present the recognizably of a click sequence and the minimum ICI ratio required to separate two interleaved click sequences. The strength of this method lies in its robustness to the overlapping and mixing of click sequences from multiple sources. It efficiently distinguishes between individual click sequences embedded in a complex underwater acoustic environment. However, it assumes a rhythmic pattern of odontocetes clicks that may not cover all variations in acoustic emissions.
We see a similar approach in (Baggenstoss and Kurth, 2014), where a method for recognizing burst pulses that resemble click-like events with a certain ICI is presented, which is the key to their identification. The method introduces the shift autocorrelation method (Shift-ACF), a novel approach that emphasizes repetitive events within an input signal to estimate the ICI, and is shown to be particularly effective in impulsive noise environments where conventional methods may struggle. The method is compared to the classic Cepstrum method, a frequency domain approach traditionally used for period estimation. While Cepstrum is effective in identifying temporal trajectories in a time-lag representation, Shift-ACF outperforms this method in impulsive noise environments and provides superior detection performance of burst pulses. Shift-ACF significantly improves detection performance in impulsive noise compared to the Cepstrum method, while Cepstrum performs better in Gaussian noise and low signal-to-noise ratio. However, the dependence of the Shift-ACF method on an accurate estimate of the ICI imposes limitations, particularly in the detection of burst pulses with highly variable ICIs. The method assumes that burst pulses consist of sequences of click-like events with a reasonably consistent repetition rate, which may not be universally applicable. Shift-ACF offers a more robust approach to background noise and reduces false positives, increasing accuracy and reliability.
The study in (Giorli and Goetz, 2019) presents a method for offline detecting and classifying sperm whale echolocation signals using ICI characteristics. The method relies on an adaptive detection threshold adjusted to the ambient noise level. For detected regions of interests, the ICI and peak frequency are calculated and grouped into click sequences. Only click sequences with more than five signals of valid ICI pattern are considered for a second filtering that determines that the detected signals are valid clicks based on the peak frequency and duration. One of the main strengths of this approach is its adaptability to different acoustic environments due to the adaptive threshold, but the method relies much on thresholds for the ICI pattern and signal duration and spectra.
2.2 Phase
Since amplitude-based cues (duration, IPI and ICI) can fail under very low SNR, we next turn to phase-derived features. The phase of the signal includes information on the temporal change of the signal. The phase is used in (Kandia and Stylianou, 2008a) to detect clicks by finding a zero crossing of the phase slope function of the signal. The phase slope function is a measure calculated by moving an analysis window over the signal and tracking the change in the slope of the phase spectrum at each shift (Kandia and Stylianou, 2008b). The derivative of the undistorted phase spectrum of the signal is calculated and indicates how the phase of the signal changes over time. By analyzing the slope of the phase spectrum, potential clicks are identified by finding the points where the function value changes from negative to positive. The authors also introduce the notion of centroid for clicks, i.e., the point at which the signal is “balanced” on the time axis, taking into account the phase or amplitude of the signal over time. This concept is valuable for tasks such as Time Difference of Arrival (TDOA) estimation, where the precise timing of these clicks is critical to determine the position of the source, and can be used as a reference point for multiple pulsed clicks, such as the regular clicks of sperm whales. Robustness to click source level and noise ratio is demonstrated using manually labeled data from regular beaked whale clicks and sperm whale clicks. The potential of phase jumps to represent a transient signal is also utilized by the wavelet transform.
2.2.1 Wavelet transformations
Wavelet transforms combine phase and amplitude in a joint time–frequency analysis. The wavelet transform involves the decomposition of a signal into its individual frequencies using small oscillatory functions that are localized in both time and frequency, the so-called wavelets - small waves that grow and decay in a limited period of time. The method in (Lopatka et al., 2005) combines the wavelet transform and a parameter called Short-Time Windowed Energy (STWE) to detect clicks. This parameter captures the unique shape of the click sounds that distinguishes them from other signals in the recordings and is calculated using the Short-Time Windowed Energy (STWE) is defined in Equation 1.
with cw the wavelet transform coefficient, sk the scale, k1 and k2 the scale range of the wavelet transform of the click, Te the sampling period and l, which defines the time resolution. First, the wavelet transform is performed over a specific buffer of potential clicks, followed by a calculation of the STWE parameter. The result is used to identify individual clicks by analyzing the peak of the STWE curves, which represents the exact time at which the sperm whale click was recorded, and the width of this peak, which correlates with the duration of the click. The ICI between identified clicks is used to verify detection and discard echoes. The results for both the simulation and the real collected data of sperm whale clicks show that the method is insensitive to noise transients. This method is then compared with a method that uses the Fourier transform instead of the wavelet transform. As demonstrated in (Lopatka et al., 2005) the Fourier version of the method is less resistant to noise, particularly at low SNR. However, the properties of STWE analysis should be adapted to the specific marine environment and are expected to be sensitive to changes in the structure of clicks due to multipath effects. Such temporal changes in the structure of the click can be tracked by temporal modeling (Lopatka et al., 2006).
2.2.2 Methods that use empirical mode decomposition
While wavelets rely on predefined kernel functions, empirical mode decomposition offers an flexible way to isolate broadband transients. EMD decomposes the signal x(t) into intrinsic mode functions as in Equation 2. Empirical mode decomposition (EMD) breaks down a signal into a series of eigenmode functions (IMFs) and is usually used to represent temporal variations in the signal (Wu and Huang, 2009).
where each Intrinsic Mode Function (IMF) IMFi(t) is defined by the property. Each IMF satisfies the zero-mean envelope condition in Equation 3.
with and representing the upper and lower envelopes obtained by interpolating the local maxima and minima of IMFi(t), respectively. This empirical and adaptive process of decomposition takes the modes and frequencies present in the signal. Each IMF represents an oscillatory mode, and their accumulation encapsulates the information contained in the original signal. This temporal and spectral representation of the signal by its IMFs enables the isolation of broadband transient components, making EMD particularly effective for detecting non-stationary signals, such as clicks. This observation is utilized in (Seger et al., 2018), where the EMD is used for blind detection of clicks in a signal. An RMS (Root-Mean-Square) window is then applied to each IMF to calculate an upper and lower envelope. The difference between these envelopes is then calculated and used to calculate the correlation coefficients between successive IMFs to assess similarity. A partial reconstruction of the signal influenced by the IMF with the highest correlation is then performed. Finally, a detection threshold is set based on a predetermined tolerance threshold and the partially reconstructed signal and any sample exceeding this threshold is identified, grouped and used for further analysis and classification. The classification algorithm calculates the strength of groups of samples that exceed a threshold and identifies the two groups with the highest strength as unique identifiers that are used to build an “EMD library” or IMF lookup table. These tables are then manually verified providing valuable ground truth. A disadvantage of this method is that it works on the basis of the local characteristics of the signal rather than on a global basis that is uniform over time and frequency. Another method proposed in (Tian et al., 2022) additionally utilizes the estimation of the direction of arrival (DOA) of signal components for monitoring. The method is applied to a mixed model containing different signals that form the basis for DOA estimation. The individual signals are then isolated based on their unique characteristics. After extraction, the method performs endpoint detection on the signal components, using a “method of average energy”. This process is crucial for identifying the exact start and end points of the signal components. SNR is also taken into account as it is critical to the clarity of the signal and the accuracy of analysis, such as DOA estimation, by measuring signal strength relative to background noise. The method uses EMD in combination with multi-layer adaptive decomposition, which increases computational complexity. The authors assume that the signals are oversampled or continuous, a condition that may not always be present in practical underwater environments. In (Lia et al., 2017) an upgrade is proposed, where a method combining the Complete Complementary Wavelet Ensemble Empirical Mode Decomposition with Adaptive Noise (CCWEEMDAN) and Power-Law Detector is presented. The method advanced beyond traditional EMD to handle modal aliasing and energy loss, which are particularly problematic for non-stationary, non-linear signals. The method includes iterative noise addition to improve scale continuity, wavelet decomposition to deal with noisy signals and EMD decomposition to extract residual components. The CCWEEMDAN method is combined with a power-law detector for transient signals, which analyzes the DFT sequence of the signal under two hypotheses - presence or absence of a signal in the midst of Gaussian noise. For this purpose, a non-parametric approach is used that analyzes the sum of squares of the power amplitudes of the DFT sequence. The method is shown to be effective in low signal-to-noise ratio scenarios, as demonstrated by simulated and real data. However, relying on iterative refinement and decomposition process, it leads to high computational complexity, which limits its application in practice. A time-frequency generalization of the EMD is the Hilbert-Huang transformation (Huang et al., 1998).
The method in (Caruso et al., 2019) offers click analysis of rough-toothed dolphins. In this method, the raw acoustic data is first pre-processed to remove irrelevant low-frequency background noise. A Hilbert transform is then performed to create an energy envelope of the signal. An automatic click detector, focusing primarily on the ICI of echolocation clicks, incorporates a strict SNR criterion and a careful peak detection algorithm, significantly reducing the number of false positives. The algorithm identifies potential click noise by looking for peaks in the energy envelope that meet certain criteria, including height and distance from other peaks, to distinguish them from random noise by checking the signal-to-noise ratio (SNR) to validate detection of echolocation clicks and not background noise. The strength of the approach lies in the rigorous assessment of the signal-to-noise ratio, which ensures the selection of potential echolocation signals. However, the method is sensitive to varying noise, since a uniformity of click characteristics is assumed. However, relying heavily on the SNR criteria can eliminate valid clicks, potentially underestimating the actual click rate. Furthermore, the assumption that clear peaks always represent single echolocation clicks may not hold true in scenarios with overlapping clicks or similarly loud sounds. For more dynamic environments, the Hilbert-Huang transformation (HHT) may be a solution.
To capture instantaneous frequency and energy, the Hilbert-Huang transform (HHT) extends EMD resulting in an adaptive time-frequency representation of a signal. The HHT process combines EMD and Hilbert spectral analysis (HSA). Specifically, the IMFs generated by EMD are used as input to HSA to obtain a time-frequency-energy representation of the signal, known as a Hilbert spectrum. Unlike the wavelet transform, the HHT does not require adjustment vectors for signal decomposition and is therefore considered more robust. By examining the Hilbert spectrum, transient echolocation clicks can be identified as components with concentrated, time-limited energy, characterized by their instantaneous frequency. In (Adam, 2006) the HHT is used to recognize sperm whale sounds. The clicks are identified by analyzing the first six modes of the Hilbert spectrum, arguably containing the key information of the click. A ‘relevance/complexity’ criterion is determined by calculating the ratio of the squared error between the original and the recovered signal (to the number of modes obtained) and used to evaluate the quality of the signal reconstruction. The paper discusses the advantages of using the HHT compared to the signal spectra. Next we discuss methods that focus on the latter analysis.
2.3 Frequency
2.3.1 Spectral analysis
The above works rely on either temporal or joint time–frequency analysis. We now turn to a set of methods that rely on spectral cues—peaks, notches and broadband energy—that distinguish species and sound sources. In spectral analysis, a signal is broken down into its fundamental frequency components in order to search for dominant features such as broadband transients. We distinguish between three feature types: spectral power, amplitude and phase spectrum. In (Soldevilla et al., 2008), the text describes a three-tiered approach to classifying dolphin echolocation clicks: the supraspecies tier distinguishes based on the presence or absence of spectral peaks and notches; the second tier, the species tier, categorizes based on the frequency values of these peaks and notches; and the subspecies tier distinguishes two unique click types within Pacific white-sided dolphins. The first step of the click detection algorithm identifies potential clicks in the frequency domain using a fast Fourier transform (FFT) with spectral mean subtraction. The candidates were selected based on specific frequency and amplitude criteria, where the ‘candidates’ refers to potential click detections. In the second step, the identified candidates were analyzed in more detail in the time domain. A high-pass filter and the TKEO (explained in 2.4.1) were used to track energy peaks indicative of clicks. The strongest click noises within a given time frame were selected for further analysis. The spectral characteristics of the click sounds are then quantified with another FFT. The noise spectra are averaged and a subtraction of the spectral averages is applied to isolate the click spectrum, followed by statistical analysis to characterize the clicks of each species. To evaluate the utility of spectral features of clicks for classifying data, long-term spectral averages were examined for distinct patterns. The method was tested for recognizing and classifying the clicks of five dolphin species. However, recordings from the surveys were only included if they were single species schools and were excluded if other species were detected within 3 km or could not be identified due to low SNR. Handling multiple sources, in (Zaugg et al., 2010), spectral analysis is used to distinguish between the clicking sounds of sperm whales and the impulsive cavitation sounds of ships. After initial energy-based thresholding, spectral features are extracted from the potential click. Five statistical measures — mean, standard deviation, skewness, kurtosis and a normalized Shannon entropy — are used to analyze the features followed by a feed-forward neural network with a hidden layer of radial basis function units. And a logistic output function is used to classify the impulses into two categories: sperm whale clicks and ship sounds.
Processing gain is expected when combining spectral and temporal analysis. A joint spectral and temporal analysis is used to classify clicks in (Roch et al., 2011). First, Fourier transforms of signal frames are observed to identify clicks with high SNR. Echolocation clicks are then identified based on their TKEO energy, with noise level estimation and region magnification techniques to determine the start and end of the click. Clicks that were too close together are considered reflections. The cepstrum of each potential click is calculated to obtain a low-dimensional representation of the signal. Only the cepstral coefficients from 1 to 14 were used for classification, as higher order coefficients did not necessarily improve classification performance. Finally, the acoustic data of each species is modeled with a 16-fold mixed Gaussian Mixture Model (GMM) for classification. The GMM is consisting of 16 different mixture components, where each component represents a different subpopulation of the data. This approach allows the modeling of complex spectra with few data points. Spectral information can also be used through long-term analysis to detect periodicities in the signal.
2.3.2 Long-term spectral average
When individual spectra vary too much, Long-Term Spectral Average (LTSA) reveal stable patterns and rare events over hours or days. LSTA is used to detect sporadic or rare biological sounds by identifying patterns, recurring events or anomalies in the frequency range of the signal. The LTSA visualization calculates the spectral average of acoustic signals over longer periods of time, identifying patterns, trends and anomalies that differ from the surrounding sounds. In the context of click detection, LTSA can help to recognize recurring patterns, such as trains of clicks.
The method in (Jones et al., 2022), uses LTSAs from averaged sound pressure levels with specific frequency bins. In this semi-automated process, energy detection criteria are used to identify impulsive signals within a sampling window centered on the peak. The inter-click intervals (ICIs) between these detections are estimated, and signals with peak frequencies at bounded intervals are considered. These are then classified using an unsupervised learning method in which similar spectral shapes and ICIs are grouped within 5-minute bins and across time using clustering. For each group member, parameters such as click duration, ICI, spectrum, peak and center frequency and bandwidth are thresholded. Click duration was estimated by fitting an envelope to the absolute value of the waveform in the sample window. A combination of manual and automated analysis is also offered in (Baumann-Pickering et al., 2013). The process involves the operation of the Triton software (Damborský et al., 2001). The signals were characterized by features such as long duration, stable interpulse intervals (IPI) and frequency modulation. The LTSAs were calculated for visual analysis. To facilitate manual analysis for the case of beaked whale type frequency-modulated (FM) echolocation pulses, the echolocation pulses were sorted by peak frequency and peak-to-peak reception level to display high-quality signals.
2.4 Energy
The energy of a signal can be used for detection based on power threshold or high order statistics.
2.4.1 Energy detection
Temporal and spectral cues are complemented by simple energy-threshold techniques that enable computationally lightweight detectors. In (Baggenstoss, 2011), an algorithm for eliminating multipath effects from sperm whale click sequences received from a single sensor is proposed. First, the clicks are detected using a moving average to find local maxima above a certain threshold. The study also included an analysis of the ICIs. The median ICI was calculated, with variations in ICI reflecting different behaviors or states of the whales. The consistency of ICIs over the entire click series was also analyzed. Next, a click separation algorithm is presented to identify and pair clicks. Potential click pairs are selected by time difference and SNR compatibility. Pairing is based on a similarity metric that uses statistical measures to determine whether or not two clicks are from the same click train. The algorithm uses Gaussian Mixture Models (GMM) for likelihood functions trained on validated click pairs for related clicks and random pairs for unrelated clicks. The similarity of the clicks is evaluated using features extracted from the clicks, including spectral and temporal information, which are categorized into three groups: spectral information, temporal information and inter-click interval (ICI) estimation. Feature selection aims to improve classification performance by adding the most informative features and reducing dimensionality. The method proceeds by finding the best subset of valid click pairs from all possible pairings. The clicks are then grouped into click trains, which are further categorized as direct path, surface path or reverberation. Gaussian Mixture Models (GMMs) were finally used to estimate the probability density function (PDF). Cross-correlation is performed to distinguish between direct and multipath click-trains at a sensor. Click trains that are assumed to originate from the same source but have different paths that show a high correlation are rejected as multipath. Click trains with a significant percentage of clicks identified as reverberation are also eliminated.
Energy is also used for characterizing the click’s structure. The method in (Caruso et al., 2015) recognizes sperm whale clicks, where an adaptive threshold based on the median value of the total signal energy within a 5-minute recording is used to select potential clicks. The next phase involves cepstrum analysis, applied to both the amplitude and squared amplitude (energy) of the potential clicks to distinguish the stable interpulse interval (IPI) from the variable IPIs within the click structure. The average of the cepstral peaks identified within the delays is then calculated from at least 50 clicks within the same 5-minute recording. Similarly, in (Li et al., 2021), the authors present a detection method that analyzes data across low, medium and high frequency bands using a short-time Fourier transform to reduce data size and align detection with expert analysis. The detection process calculates the spectral sum for each frequency band in each time window and identifies clicks as periodic peaks. By calculating the averages and standard deviations of these spectral sums over 10-minute intervals, the algorithm sets dynamic thresholds to distinguish potential sperm whale clicks from other sounds. The click detection criterion is considered to be met if the spectral sum exceeds a certain threshold in the low frequency band while remaining below the thresholds in the mid and high bands. The authors also focus on factors that influence the probability of detection, such as source level, directional loss, transmission loss and ambient noise level. An alternative way of calculating energy for transient detection is the TKEO.
2.4.2 Teager-Kaiser energy operator
The TKEO refines raw energy detection by estimating instantaneous energy, which works well even in noisy backgrounds. The TKEO estimates the “mechanical” energy of the signal, which is a representation of the energy required to generate the signal (Kaiser, 1990). This estimate of the instantaneous energy of the signal is useful for detection because it provides insight into the dynamics and variability of the acoustic signal. The TKEO is particularly useful for detecting transient events such as clicks in recordings even in noisy environments. This is the case in (Klinck and Mellinger, 2011), where detection of odontocete echolocation clicks of toothed whales is presented by developing an Energy Ratio Mapping Algorithm (ERMA). This scheme relies on species-specific features, such as increasing energy at certain frequencies. The ERMA scheme is used to create energy ratio maps for the target and non-target species. The study also describes the development of an energy ratio detector for suspected frequency bands identified by ERMA. A normalized TKEO is then applied to the series of energy ratios to detect transients. Due to the high false positive rate, it is proposed to use ERMA as the first step in a two-step detection process, with a more sophisticated classifier as the second step to reduce the computational load. For the detection of clicks, a dynamically calculated threshold adapted to the noise is used. In (Kandia and Stylianou, 2006) the TKEO is applied to analyze the given signal. The algorithm attempts to detect sperm whale clicks by identifying p0 and p1 pulses. To emphasis the click sounds, a matching filter is applied. This can prove challenging if the p0 pulse is much weaker than the p1 pulse, which can lead to detection errors as the algorithm is designed to recognize the highest peak within a click as the starting point. A skewness criterion is then applied to the output of the TKEO to help detect the presence of a click and avoid false positives. The length of the analysis window is one of the critical parts of this algorithm and a window size must be chosen that contains few click sounds, on the one hand, and is short enough to respond to rapid changes in click periodicity, on the other. A forward-backward search is then performed over the peaks of the signal, separating them from all other signal values that have exceeded the threshold, with reference to the time of the highest peak, to locate the click. The forward and backward searches start at the highest peak and move forward and backward in time, respectively, until it reaches a point where the signal value falls below a certain threshold. It is assumed that the time interval between the two points contains the click sound. It has been shown that the same TKEO also works well under low SNR conditions [cf (Kandia and Stylianou, 2006)].
A similar pre-processing is performed with the acoustic analysis software developed by JASCO in (Frouin-Mouy et al., 2017), where three classification features are calculated: the number of zero crossings, the mean time between zero crossings and the slope of the time change between zero crossings. Since clicks of different species have different frequency components, the number of zero crossings can be a discriminating feature, while the mean time between zero crossings is related to the dominant frequency of the click sound. Since different species produce clicks at different frequencies, this measure helps to distinguish between these species-specific frequencies. The third feature represents the rate at which the time between zero crossings changes, which can be related to the frequency modulation of the click. The Mahalanobis distance metric is used to compare the features to a template created from manually labeled clicks. The choice of Mahalanobis distance is explained by its ability to account for the covariance between features.
The method in (Baumann-Pickering et al., 2010b) detects echolocation pulses and buzz clicks by identifying peaks in the TKEO. The complete click sound, including the reverberation, is identified based on its energy profile. Accounting for the lower attenuation within the signal’s lower frequencies, which can potentially distort the spectral characteristics of the signals, the median signal parameters are calculated using only the signals with the highest amplitude. The strength of this method lies in the combination of the broad spectrum of cross-correlation with the precision of TKEO. However, the reliance on manual scanning after initial detection could lead to human error or bias, and the efficiency of the method may be limited by the amount of data processed.
The combined works in (Kandia and Stylianou, 2008b) uses the TKEO as a preliminary step to enhance the signal and improve the SNR; The algorithm uses the phase slope function to detect the clicks and sets the length of the analysis window based on the average interval between clicks. The click sounds are detected by localizing the positive zero crossings of the phase slope function. Surprisingly, the structure of the clicks could also be detected when the phase slope function was applied directly to the non-optimized recording. Pre-detection based on the slope of the phase spectrum with respect to the center of the potential click. This center is calculated as the mean of the group delay function and a click is detected by searching for a positive zero crossing for the slope of the phase spectrum. The method requires statistics of at least one minute of recording. If more statistics are available, the high-potential machine learning can be adopted to recognize clicks.
The summary of the feature extraction method is presented in Table 1.
2.5 Advantages and disadvantages of feature analysis methods
IPI-based approaches (Section 2.1.1) extract information from the timing between the pulses within a click train. As shown by the results of e.g., (Gubnitky and Diamant, 2024), this method is good at capturing the underlying rhythmic patterns that distinguish different species, providing useful diagnostic features. The downside is that if the inter-pulse intervals are highly variable or if multiple click trains overleap stability of the measurements series is effected leading to miss-detections in methods such as the ones presented in (Marzetti et al., 2021) and (Gubnitsky and Diamant, 2023). Detection accuracy may decrease, potentially missing valid signals.
ICI-based methods, described in Section 2.1.2, focus on the interval between successive clicks to group and confirm valid click sequences. These techniques are robust in maintaining temporal regularity and reducing false detections, which is particularly useful for structured click sequences. An example for this is evident in (Bot et al., 2015), in which the authors show that by analyzing the regularity of inter-click intervals, they can effectively segment overlapping click trains and distinguish valid click sequences from noise. Conversely, ICI-based detectors can miss legitimate clicks when the intervals between clicks become inconsistent, as in the common case of multipath arrivals when the animal’s depth is significant.
Phase-based methods (Section 2.2) use the phase properties of click signals to improve detection accuracy. Their strength lies in the ability to detect a click by rapid changes in the phase, which can be performed also in low signal to noise ratio, as the results in (Kandia and Stylianou, 2008a) imply. This ability comes at the cost of complexity as the phase calculation is performed per sample.
The wavelet transform techniques presented in Section 2.2.1 decompose signals into their time-frequency components and searches for wide band transients, which is particularly effective for impulsive signals like clicks. However, the variation on wavelet transformations as proposed in (Lopatka et al., 2005) implies that there may not be a best wavelet decomposition, thus raising the question of robustness to different click sources.
In Section 2.2.2, EMD-based methods adaptively decompose signals into intrinsic mode functions that capture various oscillatory patterns. Such an approach is highly effective in analyzing non-linear and non-stationary signals, often revealing subtle temporal details. A key drawback, however, is that EMD can suffer from mode mixing, and the interpretation of its components sometimes requires manual intervention as discussed in (Seger et al., 2018), thus limiting its overall automation and reliability.
Frequency-based methods (Section 2.3) analyze the spectral content of click signals to highlight important frequency components. They provide important insights into species-specific frequency features that are essential for effective classification. An example is the constraint on the resonant frequency in (Roch et al., 2011). On the other hand, frequency analysis can be affected by background noise, especially of transient nature such as from snapping shrimps, and miss transient signal features that are sometimes crucial for accurate detection.
Energy-based methods (Section 2.4) focus on the power or amplitude of click signals as the primary metric for detection. Their advantage lies in the fast response to significant energy changes, the fast response to. The disadvantage is their susceptibility to background noise, which can necessitate the use of adaptive thresholding techniques to avoid false detections as proposed in (Caruso et al., 2015), especially in challenging acoustic environments.
Energy detection methods (section 2.4.1) identify clicks by detecting local maxima in the energy profile of the signal. These methods are efficient and well suited for real-time detection due to their simplicity. However, in a changing environment, they can lead to false positives in case of mismatches in the assumed noise model to set the detection threshold. This is evident by the results in (Li et al., 2021) that shows high false positive in environment full of noise transients.
The TKEO, discussed in section 2.4.2, estimates the instantaneous energy of a signal by emphasizing rapid changes. This makes it particularly effective at low SNR, where transient events are subtle. This allows detection for a wide dynamic range as demonstrated in (Frouin-Mouy et al., 2017). However, performance can depend on the choice of analysis window, which leads to a non-stable tradeoff between the false positive and the detection rate, and can suffer if the structure of the signal is highly variable (Frouin-Mouy et al., 2017).
3 Machine learning-based click detection
Machine learning (ML) techniques have been proposed to capture the variability in the structure of the click by learning a model for a valid click from datasets containing such signals as well as noise and perturbation intensities. These techniques are known for their ability to process and analyze large amounts of data quickly and are useful for detecting patterns in the data. One ML technique that has proven useful for automatic click detection is the Multilayer Perceptron (MLP). The MLP approach is a type of feed forward artificial neural network (ANN) (Lek et al., 2008). An MLP consists of at least three layers, including an input layer, at least one hidden layer and an output layer. Each of these layers is are generally fully connected to the previous and subsequent layers. The weights of these connections are usually trained by backpropagation, an iterative supervised learning technique in which the differences between the given output and the desired output are calculated as an error and the calculated error is then used to determine the new weight (Portal, 2024). In the context of click detection, MLP is useful due to its low computational cost, high performance and simple structure (Saffari et al., 2022).
Convolutional neural networks (CNNs) are another type of ANN. In contrast to MLPs, the layers of the CNN are sparse. This benefits the generalization of the network, as overfitting is reduced. It also allows the network to focus on the important features of the input data while ignoring irrelevant or redundant information, which in turn leads to automatic feature learning from raw audio data without the need for manual feature extraction. A CNN is characterized by its convolutional layers and pooling layers. The former represents a set of kernels that learn and extract features from the input data and create the feature map that represents the presence or absence of a particular feature at each location in the input data. Pooling layers are often placed between the convolutional layers to reduce the spatial dimensions of the data. CNNs are considered parameter efficient and are better suited for recognizing spatial hierarchies than MLPs. This is achieved through a concept known as local connectivity, where each neuron is connected to its local region. This technique reduces the number of parameters by allowing different parts of the network to specialize in high-level features such as a texture or a repeating pattern (Kurama, 2018). For click detection, CNN offers the advantages associated with the small size of the network.
While CNNs can handle spatial hierarchies in gridded data, the Recurrent Neural Network (RNN) is better suited to the task of analyzing sequential data sets such as time series with sampling dependencies. The reason for this is the ability of RNNs to recognize patterns in sequences and learn from them. RNNs maintain a hidden state from one step in the sequence to the next. In this way, they maintain a memory for previous inputs in their internal structure. This memory is used to recognize causality within the dataset and is therefore useful for applications such as speech recognition, natural language processing, and video activity recognition. For click recognition, RNNs can use their memory to draw information from a series of clicks. One of the main problems in using RNNs is overcoming the vanishing gradient problem, a phenomenon that occurs during the network training. In this case, the gradient approaches zero, which leads to a loss of information and makes it difficult for the network to learn and update its weights. A special type of RNNs that takes this problem into account are Long Short-Term Memory (LSTM) networks. In contrast to RNNs, LSTM networks are characterized by their gating mechanisms, namely input, forget and output gates. The use of these gates enables the network to remember or forget observation inputs, making it more resilient to the vanishing and exploding gradient problem. In the context of click detection, the LSTM can be useful by adaptively distinguishing between clicks and other linear impulse noises from spectrograms.
A simple but sometimes effective learning method is the Support Vector Machine (SVM). An SVM finds a hyperplane that best separates different classes of data with the maximum margin. The margin is defined by the data points (support vectors) that are closest to the decision boundary. The so-called kernel trick allows SVMs to support high-dimensional spaces, which is why they often use kernel functions to map input data into a higher-dimensional space. The main advantage of SVMs, as opposed to deep learning models, is the lower risk of overfitting, which is especially important when the training data is limited. This is particularly important when the training data is limited. For click detection, this is relevant when there are only a few acoustic recordings on which to develop a detector.
While SVMs focus on maximizing the marginal distribution, which is limited by their ability to set constraints for classification, the Gaussian Mixture Model (GMM) learning approach is an alternative for probabilistic modeling of data distributions. Assuming that the data can be clustered into classes of Gaussian distributed samples, GMM aims to determine the distribution parameters of each class by likelihood maximization. The result can be applied to click detection by using GMMs to model the distribution of relevant extracted click features or to detect anomalies that differ from the “normal” distribution of clicks. The structure of GMMs offers a soft, probabilistic assignment of data points, allowing constraints to be set as part of the clustering process. This can be a restriction on the distribution parameters between classes, samples that must or must not be clustered together, and a minimum number of samples within the class. This proves useful for the detection of clicks by identifying and modeling background noise of the recording with GMMs, which increases the click-to-noise ratio. Another form of generalization model is the Generalized additive model (GAMs), which develops a statistical model for the relationship between the input variables to represent the probability density function of the predictor’s variables. This negates the need to create a single global model while handling non-linear relationships. For click detection, this is very handy as they can be used to find temporal patterns for the presence or absence of clicks.
In the following, we categorize the papers according to the classification into ML techniques, specifically supervised convolutional neural networks, alternative supervised neural networks and unsupervised learning models. The contributions are further categorized according to the type of input they are best suited for, the underlying architecture they use and their adaptability to click detection.
3.1 Supervised convolutional neural networks
3.1.1 CNNs with raw audio as input
Convolutional Neural Networks (CNNs) are utilized because their sparse, locally connected filters excel at learning broadband-click patterns, which makes them commonly used deep-learning detectors for marine mammals. CNNs are deep learning models that recognize a non-linear hierarchical order in the features of a valid click. CNNs use layers of convolution to learn spatial hierarchies of features from input images. In the case of click detection, the inputs are usually raw temporal acoustic data or spectrograms. When CNNs are applied to spectrograms, they can detect patterns in both the time and frequency domains. Convolutional layers allow the network to focus on localized features, ensuring that slight variations or shifts in the position of the click in the spectrogram (relative to the start of the input) do not affect recognition accuracy. By progressively abstracting information through its layers, a CNN captures both the broader context of echolocation signals and the fine-grained details of a particular click. By applying these principles, CNNs have already been successfully used for click detection.
Since clicks are short signals, using one-dimensional audio signals as a base layer offers the CNN the opportunity to learn important features of the signals that distinguish them from noise, cavitation or SSN. The work in (Luo et al., 2019) uses CNNs to automatically detect echolocation clicks of odontocetes from acoustic data recordings. The proposed method involves two-step detection in which a deep CNN is trained on both synthetic and real data to discriminate between click and non-click clips at different SNR values. Subsequently, the trained CNN is converted into a full convolutional network to minimize computation time and overcome the restriction to fixed-size inputs. This approach enables fast data processing. An energy normalization procedure allows the management of variable input lengths. In post-processing, the authors use the TKEO to search for a transient and then the Gabor curve fitting method to fit a discrete Gabor signal to the acoustic data of a click to obtain a more accurate time synchronization of the start and end points of the click. The use of CNN has been further developed using the spectral representation of the signal.
The CNN architecture is well suited to recognizing patterns in grid-like topologies such as the spectrogram of audio signals. The work in (Buchanan et al., 2021) presents a comprehensive study on the use of Deep CNNs to recognize porpoise clicks from acoustic data. The authors investigate different CNN architectures and the performance of different CNN models on this task and compare the methods in terms of their accuracy. Six CNN architectures, including LeNet, LeNet variants and ResNet-18, are developed and tested on a dataset of bottlenose dolphin clicks. “Traditional” texture feature extraction classification is also explored. Both the spectrogram pixels and the extracted LBP features are used as input. The results show that CNN outperforms these methods for echolocation clicks belonging to one species. The article concludes that ResNet-18 performs the best of all the architectures tested. This can be explained by ResNet’s ability to ignore layer connections that bypass one or more layers, ensuring low sensitivity to additional layers. Results of SVM and MLP classifiers are compared with raw pixel values of the spectrogram images to evaluate the effectiveness of CNNs. The success in recognizing the clicks is attributed to the distinct pattern that is evident in the time-frequency domain. For the manual analysis of sperm whale clicks in acoustic recordings, a customized annotation interface was used in (Frasier et al., 2022) combining with a click detector and the calculation of arrival times, IPI and background noise levels. These metrics are used in (Frasier et al., 2022) to analyze the behavior of sperm whales in the presence of anthropogenic noise. For the detection of clicks, spectrograms are used as input to the CNN to utilize the broadband characteristics of the signal as well as temporal features such as IPIs and ICIs.
3.1.2 CNNs with spectrograms as input
The spectrum of the signal enables the identification of stationary patterns in the signal. Using spectrogram images as the input to a CNN (Islam Ariful, 2021) explores these patterns to recognize sperm whale or dolphin vocalizations. These signals include clicks, whistle and whale song signals of different whale species. For performance evaluation, three types of measures are used: Original Test Data (OTD) that serves as a baseline to evaluate the effectiveness of the CNN under ideal conditions, Synthetic Test Data (STD), which tests the robustness and adaptability of the CNN model, and Practical Test Data (PTD), that evaluates the performance of the CNN in real-world conditions. The former is derived directly from the dataset; the STD is generated by artificially modifying OTD; and PTD is created to simulate real-world conditions by combining original whale sounds with oceanic ambient noise. Together with the detection accuracy, precision, recall and F1-score, these metrics demonstrate the efficiency of the CNN model in detecting and classifying signals.
A combination of CNNs with other deep learning methods is demonstrated in (Bermant et al., 2019). The clicks of sperm whales are detected and classified using deep machine learning techniques. A CNN is used for click detection while recurrent LSTMs are used for classifying clicks into categorical types and to recognize dialects of vocal clans. In addition, the principal component analysis (PCA) and t-Distributed Stochastic Neighbor Embedding (t-SNE) algorithms are used to calibrate the models parameters. Transfer learning is used for training on codas from the Eastern Tropical Pacific (ETP) dataset.
Another example of such combination of CNN and other deep learning methods can be found in (Hamard et al., 2024) for a detection method that converts raw recordings into 15-s spectrogram images and applies a faster R-CNN model with a feature pyramid network as a backbone to localize and classify marine mammal acoustic events. The model is trained using manually annotated spectrograms that identify different sound types such as dolphin click trains, hums, whistles, and porpoise vocalizations, and it outputs time-frequency bounding boxes that use adjustable confidence and non-maximum suppression thresholds to control overlapping detections. The advantages of this approach include precise localization in time and frequency, the ability to detect multiple species and sounds in a single frame, and the reduction in manual annotation workload. Disadvantages include high computational cost, sensitivity to fluctuations in the training data, and the need for careful tuning of detection thresholds to balance false positives and missed detections.
Another great example of using CNN and other neural networks can be found in (Vishnu et al., 2024). A neural network-based detection method that addresses the challenge of high ambient noise from snapping shrimp; the system, called DEVMAN (detector for vocalizations of marine-mammals using neural networks), uses a Visual Geometry Group (VGG)-based CNN architecture with six convolutional layers followed by two fully-connected layers and implements several denoising techniques, including simple non-linear denoising methods and a sophisticated ML-based denoising method trained end-to-end with the detector to maximize performance in shrimp-dominated noise. The combined denoiser-detector approach showed superior performance compared to other methods. It was successfully used to analyze ten sites. Advantages include the ability to overcome the ubiquitous noise of snapper shrimp without compromising detection performance, while disadvantages include the computational complexity of the ML-based denoiser and the need for site-specific training data.
The work in (Lü et al., 2024) present a dual-feature fusion learning method for marine mammal acoustic signal detection that extracts both Mel-Frequency Cepstral Coefficient (MFCC) features and Delay-Doppler (DD) features from acoustic signals and processes them through a user-defined convolutional neural network model with nine convolutional layers and two fully concatenated layers. The features are pre-processed by adaptive Least Mean Square (LMS) filtering, which improves the signal-to-noise ratio before extraction. This approach offers advantages such as improved detection accuracy, improved generalization ability, and robust performance under low SNR. Disadvantages include the computational complexity resulting from the simultaneous processing of two features, the dependence on precise parameter tuning in the LMS filtering phase, and the potential complexity of the model during training.
3.2 Other neural network based solutions
Architectures such as MLPs and LSTMs are additional choice for a detection pipeline. The detection of click sounds has been demonstrated using MLP, RNN and Transformers. The authors of (Cotillard et al., 2024) present an automatic method for beluga whale calls using two complementary strategies: a region-of-interest (ROI) approach and a detection transformer (DETR). The ROI method processes spectrogram images by applying a Gaussian blur followed by a double threshold algorithm to isolate high-energy regions. A minimum area constraint defined with respect to the typical call dimensions is used. In parallel, DETR, a transformer-based object detection model pre-trained on COCO and -tuned to 3-s spectrogram images, generates bounding boxes around the calls even when temporal or spectral overlap occurs. The advantages of these methods include the flexibility to adjust sensitivity and the ability of DETR to resolve overlapping calls. Disadvantages include ROI’s tendency to overestimate detections when call density is low, and DETR’s high demands on training data and computing power. The usage of MLP is more suitable when this limit is not acceptable.
The use of MLP is motivated by its success in speech recognition, environmental noise classification and seismic signal analysis. The method in (Sánchez-García et al., 2010) uses a combination of different MLPs and statistical analysis to distinguish between regular clicks, creaks or noises. The statistical features used as input are the standard deviation of the energy values within each time window and the dynamic range, which is defined by a ratio between the maximum level and the background noise level within the time window. The detection is performed over short time buffers of 2 seconds and can therefore be considered real-time, but the achievable misclassification rate is high. This could be due to the strong assumption that a large number of identical click structures exist in the time window analyzed for statistical accuracy. Another MLP-based approach can be found in (Saffari et al., 2022). The authors use the Chimp optimization Algorithm (ChOA) to train an artificial neural network and to set a fuzzy logic for parameter adjusting. The input is a pre-processed spectrogram from which the features are extracted by averaging the cepstral values and applying cepstral liftering. The control parameters of the ChOA algorithm are adjusted in three stages: Fuzzification, fuzzy inference and de-fuzzification. The method uses membership functions to convert the input into fuzzy sets. The results of the fuzzy inference are then converted into quantitative data using the defuzzification process using two membership functions. Comparison without Fuzzy logic as well as with the coronavirus optimization algorithm, Harris-Hawks optimization, the Black Widow optimization algorithm and a Kalman filter shows an advantage in both classification rate and convergence. However, the method performance depends on the quality of the input data. This can be avoided by utilizing the sequential properties of echolocation clicks to learn from high-dimensional data using the residual neural networks (ResNet).
The ResNet’s ability to effectively learn hierarchical features makes it suitable for learning from image-like representations, such as spectrograms, so that it can exploit both temporal and spatial information. The ResNet model proposed in (Bergler et al., 2019) is used for segmenting, recognizing and classifying audio segments as killer whale sounds or noise. The method used is a modification of the ResNet architecture. The data is divided by a sliding window into short segments that are used as input to the ResNet-based neural network. The network performs binary classification for presence detection to determine if the segment contains clicks. For evaluation metric, a measure for the time-based precision is offered to measure the accuracy of click detection over time. This is shown to be useful for generalization of time-dependent processes. Nevertheless, the performance is sensitive to the choice of detection threshold. To solve this robustness problem, data augmentation has been proposed.
Data augmentation is used to expand the database for training using simulated clicks. Data augmentation is used in (White et al., 2022), where the EfficientNet B0 model is used as the backbone of the CNN pipeline to distinguish between environmental noise, dolphin sounds, biological clicks and ship noise. This model scales the depth, width and resolution of the network for robust detection. The input for the CNN is a multi-channel spectrogram. Audio enhancement in the time domain includes time shifting, pitch shifting and changing the SNR. This is followed by a squeeze and excitation (SE) block to selectively emphasize informative features. A global average pooling layer is applied to the output of the SE block to generate a feature vector, which is then passed through a fully concatenated layer with four neurons per sound source category (ambient sounds, dolphin sounds, biological click sounds and ship noise). This is followed by a softmax activation function to generate a probability distribution across the sound source categories. The results show that the models should incorporate elements of the soundscape to achieve the desired results. The model is pre-trained on the ImageNet database of 1000 classes. Transfer training is performed by adapting the final layer of the CNN. Another approach for training with small data sets is the use of Support Vector Machines (SVMs) and unsupervised learning.
3.3 Support vector machine methods
Support-vector machines are effective when the labeled dataset is small or when explicit features can be extracted. The class of SVM-based classifiers is used for binary classification between clicks and noise segments. For the detection of foraging clicks with low SNR (Jarvis et al., 2022) has offered a class-specific support vector machine (CS-SVM). Results are demonstrated for the detection and classification of dolphin clicks, beaked whale clicks and sperm whale echolocations. First, an energy detector is used to recognize regions of interest (ROIs) containing possible click sounds. The ROIs are then analyzed for feature extraction, i.e., to analyze the acoustic features of the detected clicks. Extracted features are fed into the CS-SVM classifier. A noise variable threshold adapts to different noise levels, ensuring effective detection of clicks. The Auto-Grouper algorithm is used for detection verification. This algorithm groups click sequences based on their periodicity, helping to identify and classify marine mammal vocalizations (Roch et al., 2011).
Transformer-style encoders are only beginning to permeate marine-mammal acoustics, yet early results hint at substantial gains once sufficient labeled audio is available. The authors of (Frasier, 2021) fine-tuned a wav2vec-style Transformer on a large data set (24 TB) of Atlantic and Pacific odontocete clicks, cutting per-click error by 32% relative to a CNN front-end when background cavitation was strong (Frasier, 2021). Building on that idea, animal2vec—a cross-domain self-supervised Transformer originally trained on terrestrial mammals—retains good accuracy after zero-shot transfer to sperm-whale clicks, underscoring the modality-agnostic nature of self-supervised attention blocks (Schäfer-Zimmermann et al., 2024). Despite these encouraging signs, marine uptake remains sparse. We believe the main causes are: (i) public labeled underwater corpora are still orders of magnitude smaller than their terrestrial counterparts, limiting the scale at which Transformers are best utilized; (ii) real-time PAM systems impose tight energy budgets, making heavyweight attention models impractical on embedded hardware; and (iii) benchmark protocols have yet to converge, so researchers favor incremental CNN variants because of smooth integration that using legacy pipelines.
3.4 Unsupervised methods
The difficult in data labeling makes fully unsupervised clustering a method of choice to reveal recurring click types directly from long recordings. The method in (Cohen et al., 2022) is a comprehensive method for identifying and classifying odontocetes clicks. This method characterizes clicks by their spectral patterns, such as low amplitude peaks and broad main peaks. The unsupervised Chinese Whispers (Biemann, 2006) clustering algorithm is used to identify dominant signal types based on spectral distances. The clusters are manually inspected and compared across sites to identify recurring signal types, focusing on spectral shape, inter-click interval (ICI) distribution and self-similarity. The method also includes parameter tuning for clustering to balance temporal resolution with data manageability. The main assumption in developing this method is the constancy of the click’s spectral features.
The summary of the machine learning-based click detection method is presented in Table 2.
3.5 Advantages and disadvantages of machine learning-based methods
Supervised CNN methods (Section 3.1) use large annotated datasets to automatically learn features, making them suitable for pattern recognition. Their strength for click detection lies in their ability to learn of the important characterization of the click and to generalize. An example is the results in (Luo et al., 2019), which provides good results for whale clicks from the deep-water environments and coastal regions, illustrating the diversity of the methods. However, this robustness comes at the need for a large training dataset.
Approaches based on other neural network architectures (section 3.2), such as MLPs (Sánchez-García et al., 2010) and ResNet (Bergler et al., 2019) are designed to process sequential and non-linear data effectively. These models are capable of capturing long-term dependencies and complex patterns. However, they also face challenges such as vanishing gradients and the need for careful tuning of the architecture, making them more sensitive to training conditions.
Support Vector Machines (SVMs) as proposed in (Jarvis et al., 2022) (Section 3.3) achieve robust classification even with limited data due to their controlled model complexity. Their main advantage is the low risk of overfitting. However, they often require manual feature extraction, which can limit their effectiveness compared to fully automated deep learning methods.
Unsupervised methods (Section 3.4) use e.g., clustering as in (Cohen et al., 2022) to detect intrinsic patterns without prior labeling. These techniques are valuable for exploratory analysis and discovery of underlying data structures, but their performance is strongly influenced by the choice of distance metrics and clustering parameters, which can lead to inconsistent results.
4 Adaptive detection
We call data-dependent methods a family of approaches that derive their processes from the data itself, similar to machine learning algorithms, but do not include a learning phase. One such approach is the template matching approach, which identifies patterns or features in the data and matches them to a template of the target signal. Other data-driven approaches use adaptive filters and the page test. The following is an overview of such approaches for click detection.
4.1 Template matching
In template matching species-specific click waveforms are cross-correlated with the data to reject noise transients without previous training. In (Harland, 2008) details of the Transient Research Underwater Detector (TRUD), algorithms are presented. This scheme detects and classifies echolocation clicks through the spectrogram correlation. The correlation is based on templates of click patterns of different species. TRUDs based on a General Wideband Pulse Detector (GWPD), which uses narrowband energy accumulation and compares it across different time samples to detect potential whale-like clicks. The detected clicks are then organized into pulse trains and their statistical properties are evaluated. The method combines single click analysis with pulse train, thereby overcoming noise transients.
The method presented in (Siddagangaiah et al., 2020) is a probabilistic approach that uses the concept of sampling entropy (SE). The method starts with the selection of an embedded dimension and constructs an embedding vector for each point in the time series that is comprised of consecutive samples. The correlation sum is a normalized count reflecting how many pairs of states (represented as vectors in the reconstructed phase space) are similar to each other within a certain level of tolerance (distance), excluding comparisons of a state with itself. The detection metric of SE is based on the natural logarithm of the conditional probability that a data set that has repeated for d samples within a tolerance r will also repeat for d+1 samples. Since clicks increase the standard deviation of the ambient noise such that the SE approaches to zero, the conditional probability is a good metric to separate signals from noise. Since no assumption on the noise distribution is required, the method is robust for different types of noise, including overlapping dolphin whistles and ship engine noise, and does not require prior training. However, it is difficult to distinguish clicks from noise 8transients, such as those which originate from snapping shrimp.
Another method that relies on a priori information about the signal is presented in (Jang et al., 2023). The method is geared for tracking odontocetes (toothed whales) using a refined generalized cross-correlation (GCC) to adapt to noise environments and detect echolocation clicks while estimating the TDOA. Noise suppression is achieved by accumulating echolocation clicks over longer intervals. This, in turn, requires a clustering procedure to manage multiple TDOAs. The latter involves clustering of parameters such as location and speed using a factor graph-based multi-target tracking (MTT). The sum-product algorithm is used for tracking in the TDOA range, with a second MTT for 3D tracking by combining TDOAs from different hydrophone pairs. The method assumes that the clicks are stationary over a time interval longer than the GCC length. This, however, may limit its applicability in complex marine environments.
4.2 Adaptive filters
When pre-defined templates fail under drifting noise, adaptive filters reshape themselves in real time, maximizing the SNR of transient clicks without prior training phase. In a matched filter, a given signal is correlated with a known waveform (the template) of the target signal in order to obtain the energy of the signal and the gain during processing for noise cancellation. In (Caudal and Glotin, 2008), the detection of sperm whale clicks is achieved by a stochastic matched filter (SMF), which correlates the incoming signal with a template signal, taking into account the statistical properties of the noise and echoes. In the SMF, the SNR is maximized by identifying the eigenvector associated with the largest eigenvalue in a given matrix equation. The detection function uses the linear filter applied to a typically small data window that matches the average length of a sperm whale click to determine whether the sound in that segment is likely to be a whale click or just random sea noise. The template is created from an average of 1,000 whale clicks. In (Altaher et al., 2023) a method for localizing individual pulse-like underwater sounds using an array of hydrophones is offered. The localization involves a matched filter with an adaptive threshold. For each detected pulse, a dynamic window is applied using the call itself as a template. This dual MF approach proves to be more accurate than using a single MF. However, the signal is assumed to be stationary, which may not be true in all underwater environments.
The method in (Lopatka et al., 2006) detects sperm whale clicks using a recursive time-varying grid filter. At the heart of the method is the normalized recursive exact least-square time-variant lattice filter, which dynamically adapts to the signal’s changing properties. This filter projects the signal onto a subspace defined by its past values. This approach accounts for changes in the second-order statistics of the signal captured by time-varying Schur coefficients, rather than relying on amplitude alone. The method does not require prior knowledge of the arrival time, amplitude or shape of the click. The algorithm also includes a forgetting factor that helps it adapt to the non-stationary nature of whale clicks by controlling the influence of past signal values, making it particularly effective in noisy environments. However, need for precise parameter calibration, such as the forgetting factor, could be challenging. An alternative to clicks correlation is detection by examining deviations from the expected values of the matched filter using the Page test.
The authors of (Jang et al., 2022) propose a detection method that uses generalized cross-correlation with noise whitening (GCC-WIN) to extract TDOA measurements from echolocation clicks recorded by hydrophone arrays. The data is pre-filtered to isolate the frequency range of the clicks, then weighting the cross-power spectral density with a factor derived from pre-calculated noise power spectral densities is applied, highlighting click-related peaks. Peaks that exceed a preset threshold (PTDOA) are identified over short observation intervals and then accumulated over a longer time window to increase the probability of detection. To avoid false detections, a clustering algorithm is used to group similar TDOA measurements and ensure that only stable estimates are retained. The approach improves detection under low SNR conditions through effective noise suppression, but depends on accurate noise modeling and precise threshold selection, and its performance is sensitive to parameters such as the length of the accumulation window and the clustering criteria.
4.3 Page test
To catch subtle — abrupt changes that elude correlation filters — the Page Test can flag cumulative points in energy or variance. The authors in (Wu et al., 2016) offer a modification of the Page test for low SNR environments. The approach performs wavelet analysis to remove noise transients prior to the page test. The Page test, also known as the cumulative sum test, is a sequential analysis method that detects changes in a data sequence. The test is based on comparing the variance and sample mean of a set of data with the expected mean and variance of a normal distribution. If the difference between the sample values and the expected values is significant, the test rejects the null hypothesis that the data is normally distributed and concludes that a signal is present. The Page test can also be adapted to detect transients corresponding to a click sound. The method in (Beslin et al., 2018) uses the Page test for detecting sperm whale clicks. In this method, the signal is modeled as a state series and a distinction is made between ‘noise’ (absence of a click) and ‘signal’ (presence of a click) states. The transition between these states is determined by a signal strength statistic relative to two predefined thresholds. A constraint forces a ‘noise’ state if it remains longer than expected in the ‘signal’ state. Signal strength statistics are derived from estimates of instantaneous signal and noise power. These are calculated from the envelope of the waveform, which in turn is calculated using the Hilbert transform. After identifying potential clicks using the Page test, these clicks are categorized using an SVM with a quadratic kernel. The system verifies the decision by measuring the IPI between successive pulses. However, setting the detection threshold proves to be a challenge for robust detection as noise conditions vary in different marine environments. This is where threshold adjustment can help.
The click detection in (Johansson, 2004) is based on the Page test. Once a potential click is identified, the algorithm analyzes the waveform, frequency spectrum and its resonance frequency to verify detection. A set of features is then extracted for each potential click, including the click duration, peak/centroid frequency, bandwidths, pulse zero crossing rate (ZCR) variance and exponential fit quality. These features are fed into an SVM for discrimination of near-axis sperm whale clicks from off-axis clicks and other transient noises.
In (Nosal and Frazer, 2007) a multi-stage method for detecting sperm whale clicks is presented. The method starts with a page test for transient detection. This is followed by envelope detection using the Hilbert transform. Thresholds are adapted by the noise level estimation. The method also demonstrates the ability to separate between direct and reflected click pairs based on amplitude variations and time intervals, which is further used in the localization part of the method. The method has proven robust to background noise and is insensitive to subtle variations in click amplitude and interval. However, it assumes a structure for the patterns of clicks, which imposes potential limitations.
A method from (Barile et al., 2024) describe uses the CABLE software to extract the click sounds of sperm whales from passive acoustic recordings. The method begins with a band-pass filter, followed by a modified Page test to identify candidate click sounds that exhibit the multipulse structure. For each candidate, the IPI is calculated using autocorrelation and cepstrum analyzes, and a candidate is accepted only if the two IPI estimates agree within ±0.05 ms. The accepted clicks are then further processed. This method provides robust detection of on-axis clicks, improved reliability through double IPI estimation, and effective noise reduction through clustering. However, it suffers from an extremely low overall acceptance rate and requires precise parameter tuning with a fixed IPI tolerance that can exclude valid clicks when natural variability is high.
4.4 Adaptive threshold
In this section, we focus on a group of detectors that adjust their thresholds to balance sensitivity and false alarms based on ambient noise and instantaneous SNR. Adaptive threshold allows adjusting the detector to temporal characteristics of the data. This is particularly useful when dealing with data that changes spatially or temporally, such as directional whale clicks. In the context of click sound recognition, an adaptive threshold was used in (Skarsoulis et al., 2022) by coupling energy and frequency features. The clicks are characterized by repetitive arrivals with constant or slowly varying repetition periods within an assumed boundary for the ICI for sperm whale clicks. The detector analyzes the peaks of the histogram of arrival time differences at each hydrophone in search for dominant separations within the ICI range. Detection is declared if the corresponding arrival times show a regularity within a certain tolerance and their number exceeds a minimum time-varying threshold. A “detection event” is confirmed if either at least two detection flags are triggered in the current 1-minute recording or if one detection flag is triggered in the current recording and at least one more in one of the two previous 1-minute recordings. The real-time operation of the system is designed to process multiple hydrophones in parallel.
In (Morrissey et al., 2006) an energy detector is applied for identifying frequency bins that exceed a predetermined, time-averaged power threshold. The threshold is empirically set above the noise floor. Detection is declared by requiring parallel detection in a number of bins. This approach is particularly useful to detect broadband, impulsive signals such as clicks of sperm whales. In (Gervaise et al., 2010), a detection scheme based on the signal’s kurtosis is offered to identify the expected sharpness in the samples’ distribution in the case of a transient. The threshold is adapted to a sliding window to manage temporal heavy tail distributions when noise transients occur. However, the scheme is sensitive to scenarios with overlapping clicks. To handle such cases, another option for adjusting the threshold is spectral analysis.
For separating overlapping groups of echolocation clicks the frequency spectra, peak-to-peak amplitude, and IPI levels are used. In (Hamilton et al., 2021) the correlation of frequency spectra between clicks is used as a grouping metric while assuming that the characteristics of clicks from the same animal change gradually. To address the challenge of incorrectly classifying background noise as echolocation clicks, the algorithm uses the Low Percentage Removal Limit (LPRL) parameter, which is a critical component in the Click Group Separation algorithm, addressing the issue of background noise misclassification. Operating under the premise that falsely classified noise peaks constitute only a minor fraction of detected click groups due to their inconsistent Inter-Click Interval (ICI), amplitude, and frequency spectra, LPRL begins with a 0% setting. During the initial phase, an operator manually discerns and adjusts the LPRL to 1% above the percentage of total clicks identified as noise-related false positives. Subsequently, the algorithm is re-run, discounting “clicks” from groups below the set LPRL threshold. This procedure ensures the retention of authentic ICI values and amplitude thresholds, pivotal for precise click grouping. The introduction of LPRL significantly enhances the CGS algorithm’s accuracy by effectively filtering out noise and reducing misclassification of echolocation clicks, particularly beneficial in noisy environments. Furthermore, the provision for manual adjustment of LPRL imparts flexibility to the algorithm, allowing it to be tailored to the unique noise characteristics of different datasets, thereby extending the CGS algorithm’s applicability and robustness across diverse research settings. The algorithm adapts to the characteristics of the detected clicks.
Another form of adaptive processing is for the spectral energy. In (Lohrasbipeydeh et al., 2015) the adaptive Teager-Kaiser energy operator (A-TKEO) is combined with an adaptive matched filter. The authors use adaptive windowing to account for the time-varying characteristics of the signals, and smoothing windowing to remove signal peaks that arise due to interference. The threshold is adjusted based on the mean and variance of the signal. In comparison with the TEO, the rainbow click detector and the spectral density (SD) detector shows an advantage attributed mostly to the smoothing processing. The proposed method relies on an accurate estimation of the ICI, which can be challenging at low SNR. A similar approach is used in (Madhusudhana et al., 2015), where the application of TKEO is used in combination with moving average filters. The TKEO output is further processed by two short moving average filters, a scaled Gaussian function and a rectangular averaging filter, to provide near instantaneous spike detection. The filter difference ratio (FDR), a normalized measure derived from the outputs of the Gaussian function and the filter, is critical for identifying spikes corresponding to clicks. This approach was developed to amplify the energy peaks corresponding to clicks while suppressing the harmonic components. The method has low computational complexity and can be used in real time.
The method in (Jarvis et al., 2014) uses spectrogram analysis. The algorithm uses a per-frequency bin, a dynamic threshold, which tests the multiplicative factor k over the exponential average of the power in the frequency bin. The result is a binary-valued spectrogram, where each bin exceeding the threshold is marked. As the algorithm processes the full bandwidth, it is able to capture a wide range of vocalization frequencies. In (Di Nardo et al., 2023), a method for analyzing dolphin vocalizations in the presence of background noise such as boat propellers and engines is presented. The method for detecting peaks involves thresholding the SNR for suspected clicks. Detected peaks are classified based on their ICI to distinguish click sequences from noise transients. The classification filters out reverberation and overlapping clicks and focuses on identifying different click sequences by an adaptive ICI threshold.
The summary of the Adaptive detection methods are presented in Table 3.
4.5 Advantages and disadvantages of adaptive detection methods
Template matching methods (section 4.1) are based on the comparison of incoming signals with predefined click templates. As an example, method described in (Harland, 2008) uses spectrogram correlation techniques with templates derived from known click patterns of different odontocete species. Template matching can achieve high precision if the pattern is well described, but their rigidity means that they are less adaptable to variations in signal characteristics, often leading to missed detections if the incoming signals deviate from the template.
Adaptive filtering methods (section 4.2) dynamically adjust the filter parameters to track the evolving signal characteristics. This flexibility allows them to work well under changing noise conditions. The drawback is that they require precise parameter tuning and can require significant computational effort in rapidly changing acoustic environments. For example, the approach described in (Lopatka et al., 2006) requires adjustment of two non-binary parameters—the forgetting factor and the adaptation gain.
The Page test method (Section 4.3) uses statistical techniques to detect abrupt changes in the signal, making it useful for identifying transient click events. Its main advantage is the ability to confirm the presence of signals by statistical means such as the cumulative sum (CUSUM) approach implemented in (Wu et al., 2016). However, the reliance on certain statistical assumptions can cause the method to falter under conditions that deviate from these expectations.
Adaptive thresholding methods (Section 4.4) change the detection thresholds to adapt to noise fluctuations and signal variations. Their flexibility makes them particularly effective in environments with variable noise levels. However, determining the optimal adaptation strategy like choosing between the ATKEO approach described in (Lohrasbipeydeh et al., 2015), and the TKEO method combined with moving average filters and a filter difference ratio (FDR) outlined in (Madhusudhana et al., 2015) can be a challenge.
5 Remaining challenges
Our discussion about the advantages and disadvantages of each group of methods reveals some common advantages. First, most methods rely deeply on real recordings which adds to their reliability. Second, the current methods are aware of the problem of changing signal and noise characteristics and aim for a robust detector. Third, the surveyed works are aware of the need to perform detection either in real time or over large data volume, and thus aim for low complexity applications. However, we argue that some fundamental challenges still exist and the problem of click detection and annotation is not solved. This can lead to future research directions.
The first challenge is the detection of clicks when multiple whales vocalize simultaneously. This overlap disrupts the stability of the click series and affects methods that depend on the regularity of inter-click and inter-pulse intervals, which extract spectral and temporal features from structured click sequences. Addressing this issue may require integration of source separation techniques within the detector, similar to a “track-before-detect” approach.
The second challenge lies in accounting for the effects of the channel impulse response, particularly multipath arrivals and Doppler shifts. The former can affect the calculation of ICI or IPI, thus impairing the performance of methods that rely on temporal metrics. The latter distorts the signal’s spectral content and reduces the accuracy of frequency-based detection methods. However, the channel can serve for diversity gain using its feature analysis for stability test, especially since the whale swims relatively smoothly in the water. The channel can also enhance the signal-to-noise ratio if using focusing techniques such as beamforming.
The final challenge is the standardization of datasets. We have observed that nearly every study uses its own data collection methods, with only a few works [e.g., (Mellinger, 2006), and (Orcasound, 2018)] sharing their datasets. This lack of standardization hinders the direct comparison of method performance. In this paper, we have attempted to address this issue by implementing key benchmarks and comparing different methods on the same dataset. The publication of standardized datasets would enable future researchers to compare the performance of new methods across various marine environments and differing signal characteristics.
Despite the progress that has been made in the detection of sperm whale’s or dolphin’s echolocation clicks, we identify remaining challenges. These are listed in the following along with potential topics for future research.
5.1 Remaining challenges for feature analysis
The variability of signal characteristics due to individual differences between marine mammals, such as different click patterns and vocalization types, poses a major challenge for research. The algorithms must be adaptable enough to accurately analyze a wide range of signal types under different environmental conditions. Additionally, the presence of background noise, including natural and anthropogenic sources, complicates signal processing and feature extraction. The dynamic nature of underwater environments, characterized by changing temperature and salinity, affects the sound propagation. This variability requires algorithms that can adapt to such fluctuations. Another aspect is real-time processing, which is required for many applications, such as monitoring shipping traffic and identifying species for nature conservation. The development of algorithms that are accurate and efficient in real-time data processing remains a major challenge.
As for future research directions, the development of integrated solutions combining acoustic properties with oceanography information and acknowledge of the animal’s activity (e.g., vocalizing only upon surfacing) could provide better detection results. Another potential research avenue could be the exploration of advanced signal processing techniques such as the Hilbert-Huang transform, which offers advantages in analyzing non-linear and non-stationary data prevalent in marine mammal acoustics.
5.2 Remaining challenges for machine learning detection
One of the biggest challenges we see in the application of machine learning algorithms for acoustic detection of bio-fauna transient signals is the robustness for different underwater environments and for noise instances such as from snapping shrimps and vessel cavitation radiated noises (Renilson Marine Consulting Pty Ltd., 2009). Proposed solutions are usually only suitable for certain contexts and often struggle with the variability and unpredictability of different marine soundscapes. These include the presence of similar-sounding species that are not part of the target objects, anthropogenic noise and different acoustic properties of the ocean. Another challenge is that only a limited amount of labeled data is available for training many of these algorithms. This is critical for supervised learning approaches and is exacerbated when dealing with rare or less studied species.
Future research could explore several promising avenues to fill these gaps. One approach is to improve feature extraction techniques to better capture the unique acoustic characteristics of different species, even in noisy environments. This could involve attention networks for the application of deep learning which have shown potential for dealing with limited data in other areas. In addition, the development of semi-supervised or unsupervised learning models could alleviate the problem of scarce labeled data by exploiting the abundant but unlabeled acoustic recordings. Research could also focus on developing more robust algorithms that can adapt to different ocean conditions and different noise profiles. Collaborative efforts to share and annotate data by researchers around the world could significantly enrich the datasets available for training and testing and improve the accuracy and reliability of the models.
5.3 Remaining challenges for adaptive detection methods
A main challenge that we observe for data-driven techniques is in the effective processing of time-varying signals. Strong background noise, complex oceanic soundscapes and varying SNR can significantly affect the accuracy of species identification and detection performance. Another critical issue is to measure the IPI and ICI. Signal reverberations and overlapping sources can easily be mistaken as noise transients leading to misdetections. This will also occur when the animal’s clicks are directional, causing time-variation in the SNR, which is often neglected when searching for constant sequences of pulses. A formal representation of the problem as a constraint optimization problem can assist in the rigorous analysis of the signals.
6 Publicly available resources
6.1 Available databases of clicks
An important part of our survey is a list of databases including echolocations that are openly available for testing. Several projects have kindly released their collected data. These datasets can serve as benchmarks to compare detection performance on a common basis, and to train in case of learning schemes. Publicly accessible and free databases we found are cataloged in Table 4. The name of the dataset and a link to access it are given in the first two columns. We also list the location where the data was collected. The data type and the data size are listed, as well as an indication whether the data is labeled or not. There are additional available datasets that were not used in surveyed papers, collection of which can be found on (Kloepper, 2018) or (Portal, 2018).
6.2 Open source click detection methods
As most of the methods we surveyed are complex to implement, several papers as well as software platforms share their implementation code. This is very useful for users or as benchmark schemes. PAMGUARD (Gillespie et al., 2009) is a semi-automated open-source software framework for passive acoustic detection and classification of sperm whales or dolphins. PAMGUARD serves as a platform passive acoustic detection techniques and tools that were previously available to provide a solution for researchers and users in the field. The platform is flexibly designed to process data from multiple sensors in any configuration. The software is highly modular, meaning it can be customized for different sensing platforms, e.g., offline processing of audio files or work in a real time mode. The supported vocalizations range from low-frequency moans to ultrasonic echolocation clicks. The user can choose between detection methods. In particular, the software uses a combination of pre-filters and trigger filters for click detection, optimizing the detection in the frequency band of interest and creating short sound clips for further analysis. Several parameters are required for system operation. These include the frequency, pattern, and intensity of the clicks produced by the target species. Performance of PAMGUARD is often used as an benchmark e.g., (Baumann-Pickering et al., 2010b; Madhusudhana et al., 2015; Vachon et al., 2022).
Another popular open source solution is Ishmael (Mellinger, 2002). Ishmael offers several methods for marine bifauna passive detection, including energy detection, matched filtering and spectrogram correlation. The processing is performed over the signal’s spectrogram. Detection thresholds are adaptively set such that fewer parameters are required from the user. Detection of signal sequences is also offered, which increases its usefulness for monitoring biological or mechanical sources with cyclostationary patterns. Both real time and offline modes of operations are possible. However, the method assumes a certain level of user knowledge in interpreting and customizing the detection function, which could be a limitation for less experienced individuals. Research papers that compare performance with Ishmael are (Reyes Reyes et al., 2015) and (Küsel et al., 2016).
The Triton software package (Frasier, 2018) serves as a platform for analyzing acoustic data. It offers the user a choice between click and whistle detection, and uses detection features such as power spectra, spectrograms and Long Term Spectral Averages (LTSA). The latter is efficient in condensing large data sets for display and analysis. Triton operates via MATLAB and offers a user-friendly graphical user interface that enables efficient review of large data sets. It offers functions such as reading raw data from the High-Frequency Acoustic Recording Package (HARP) and converting it into .xwav or .wav files. Users can interactively navigate through time series, spectrograms and spectra of single and multi-channel files. It also provides the ability to create and interact with LTSAs from a collection of files, facilitating long-term monitoring and detailed investigation of specific acoustic events. In addition, Triton supports data management by decimating high sample rate files for easier analysis of low-frequency sounds and saving data in different formats. An important aspect of Triton is its extensibility through remoras, which are user-developed MATLAB routines that can be integrated into Triton. This allows users to customize the software to their specific needs without changing the core functionality. Triton is used as benchmark in (Baumann-Pickering et al., 2014).
6.3 Comparison of key algorithms
As part of our review, we implemented a number of methods and compared their performance. The methods were selected as representatives to the categories presented in the survey. Results are shown for the openly available PAMGUARD (the “click detector” module) and Triton (the “SPICE detector” remora) platforms, the method in (Madhusudhana et al., 2015) that applies an adaptive threshold, the detection scheme in (Sánchez-García et al., 2010) that employs a neural network, and the method in (Lohrasbipeydeh et al., 2015) for another representation of the adaptive threshold approach.
The detection method in (Madhusudhana et al., 2015), referred to as Gabor, applies the TKEO over Gabor-transformed signals. Low complexity makes the approach suitable for online scenarios. The method was cited by 23 papers, and offers an effective usage of the TKEO for transient detection.
The detection method in (Sánchez-García et al., 2010), referred to as statistical, introduces a statistics-based approach for the identification of sperm whale clicks, primarily echolocation clicks and creaks. This method comprises statistical analysis of features, presence detection via a neural network, and classification of individual echolocation clicks and creaks. The paper has been cited so far by 7 papers, and its network architecture is well described, making it easy to implement.
The method presented in (Lohrasbipeydeh et al., 2015), termed ATEO, employs an adaptive energy-detector using the ATKEO, which utilizes a windowing technique to accommodate the time-varying characteristics of acoustic signals. The adaptive detection threshold offers robustness in different marine environments with little parameter calibration. The method was cited by 7 papers so far.
We implemented the above schemes and tested their performance on the AUTEC dataset (Fujioka, 2007). This dataset includes 1364 manually annotated clicks, and was collected in the Tongue of the Ocean (Bahamas) using a single hydrophone deployed for 44 days. We chose this dataset since it provides low noise recordings, on top of which more noise can be synthetically added to test performance in varying SNR. The results are shown in Figure 3 in terms of detection vs. false positive rates. The figure highlights that methods such as Triton and PamGuard achieve higher detection probabilities at lower false positive rates. This illustrates the trade-off between sensitivity and noise rejection. The results shown in Figure 4 are in terms of the detection rate as a function of the SNR. We observe that the best results are obtained with the statistical method in (Gubnitky and Diamant, 2024), but only at high SNR values. The schema of this method is show in Figure 5. We report that the method is also easy to implement and only a few parameters need to be adjusted. The adaptive threshold method ATEO in (Lohrasbipeydeh et al., 2015) also requires only a few parameters for calibration. This method can work well at low SNR, but can only detect the presence of a single whale. The detection method implemented in the Triton platform provides good results at high SNR. Its advantage lies in its ease of use with a user-friendly GUI, but it requires many parameters for calibration and is more suitable for processing large files. Compared to the other methods, the Gabor method in (Madhusudhana et al., 2015) provides low results. However, it is easy to implement and relatively robust. Finally, PAMGUARD, with its “click detector” module, achieves good results even at low SNR, but is not robust based on the trade-off between detection and false positive. Nevertheless, it provides a simple analysis platform that can operate in real-time, and its main advantage is the ability to process arrays of hydrophones to provide an angle of arrival estimate using a phased array.
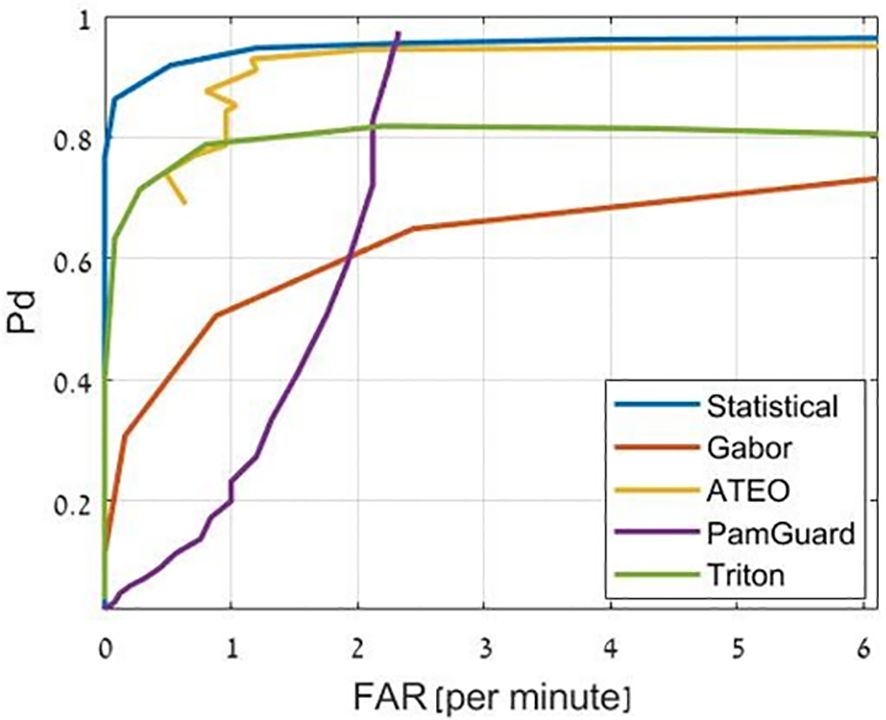
Figure 3. Detection rate (Pd) vs. false positive rate (FAR) for 5 click detection schemes over the AUTEC dataset (Fujioka, 2007).
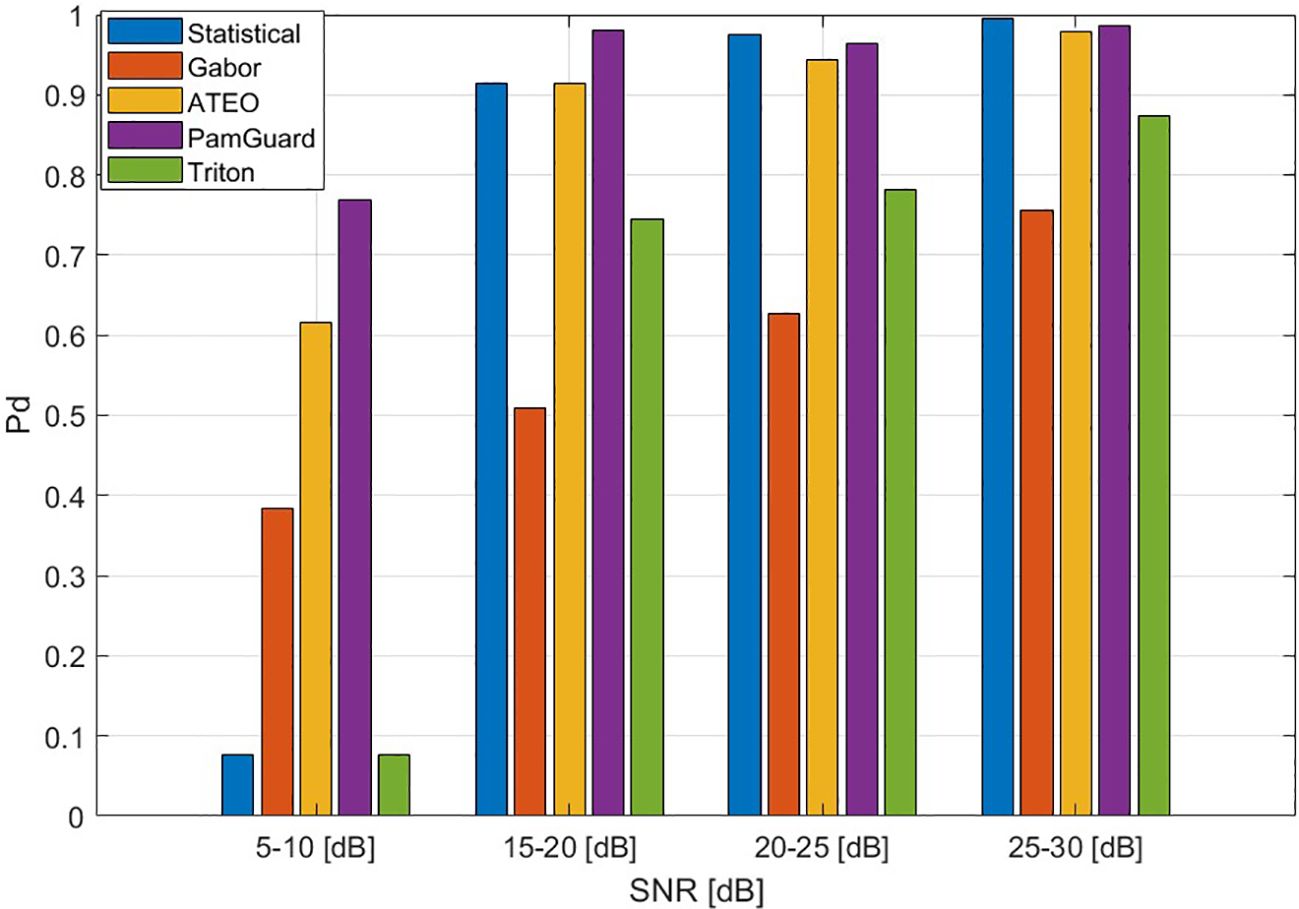
Figure 4. Detection rate (Pd) vs. frequency component of the signal (fsignal) to noise ratio (SNR) for 5 click detection schemes over the AUTEC dataset (Fujioka, 2007).
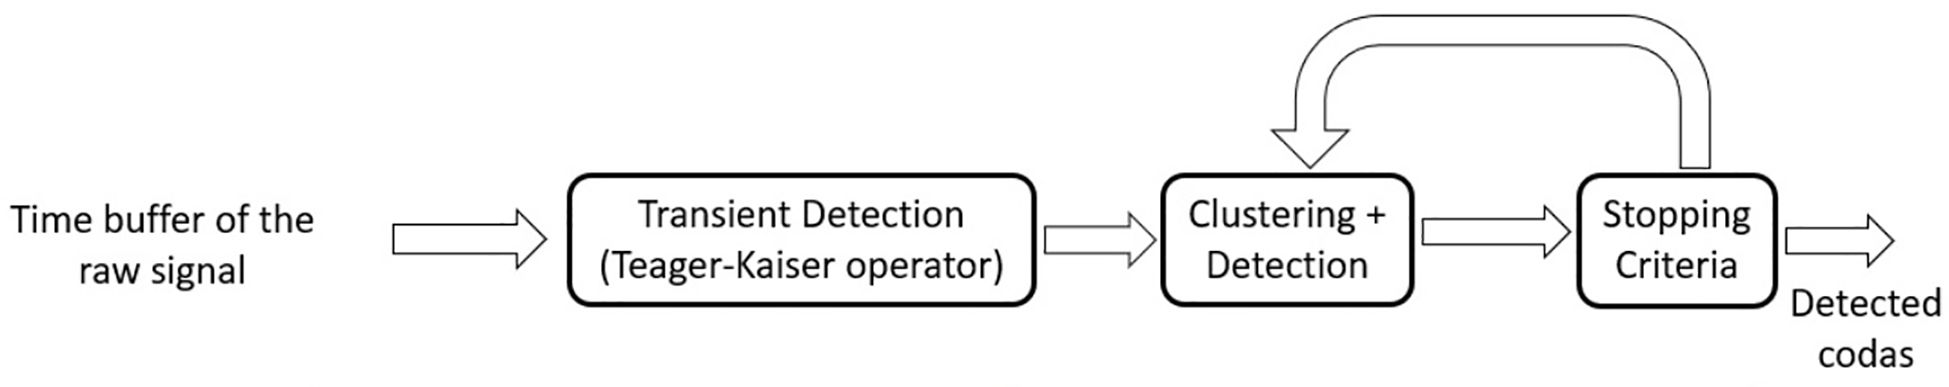
Figure 5. Schema of the statistical code detector. Figure used from (Gubnitsky et al., 2024).
6.4 Details of the AUTEC database
The dataset used for comparison of several methods was collected by the AUTEC Center. The observatory is located in the Bahamas. This is a deep-sea acoustic site that is equipped with bottom-mounted hydrophones deployed over an area of approximately 1,200km2 at a water depth of 1630 meters. The acoustic data in the shared dataset was collected over a 6-day period (April 26 to May 2, 2005) using a network of 81 broadband hydrophones. The sampling rate for each hydrophone was 96 kHz. The dataset includes tens of thousands of clicks. The signal-to-noise ratio (SNR) of the clicks ranged from 5 dB (were the detection threshold was set) to over 30 dB. An automatic detector confirmed by manual verification was used.
The dataset also contains detailed metadata (timestamps, hydrophone IDs, species assignment), curated detection logs and publicly available tag records. The dataset is distributed through the OBIS-SEAMAP and DECAF project repositories and has become a reference resource for passive acoustic monitoring of marine mammals in low-noise deep-sea environments.
6.5 Summary of click detection algorithms
In this subsection we summarize the detection schemes surveyed in this paper. Table 4 presents four main challenges that were considered in the development of click detection methods, and lists the papers that directly handle these challenges. This table can support future research by directing authors to papers most relevant to their focus field. In Table 5 we group detection methods based on the type of data that was used for performance evaluation. Since most of the methods used a real dataset, the table further shows the public availability of the data. While half of the researched literature embraces openness, offering access to their data, the other half withholds their datasets from the public. This disparity not only hinders the validation and reproducibility of scientific findings but also stifles innovation. The absence of shared data curtails the potential for collective advancement, as researchers are deprived of the opportunity to build upon existing work, explore new hypotheses, or apply advanced analytical techniques to rich, pre-existing datasets. In this scenario the scientific community, and ultimately the research itself, loses the most. In Table 8 we identify common processing tools used by the detection methods. The tools are also divided by the approaches selected as subsections in our survey, and allow the reader to identify the type of analysis required when coming to detect clicks. In Table 7, methods are grouped by their application. This division can assist the choice of benchmark based on the considered scenario, e.g., real time analysis or offline processing of many files. The supervised and unsupervised labels used in this table refer to the need for manual labeling. In Table 9, we divide the detectors by the detection features that are used. Some of the features are used more frequently, while other features are used in only one research study. This list reflects the commonalities of clicks’ attributes.
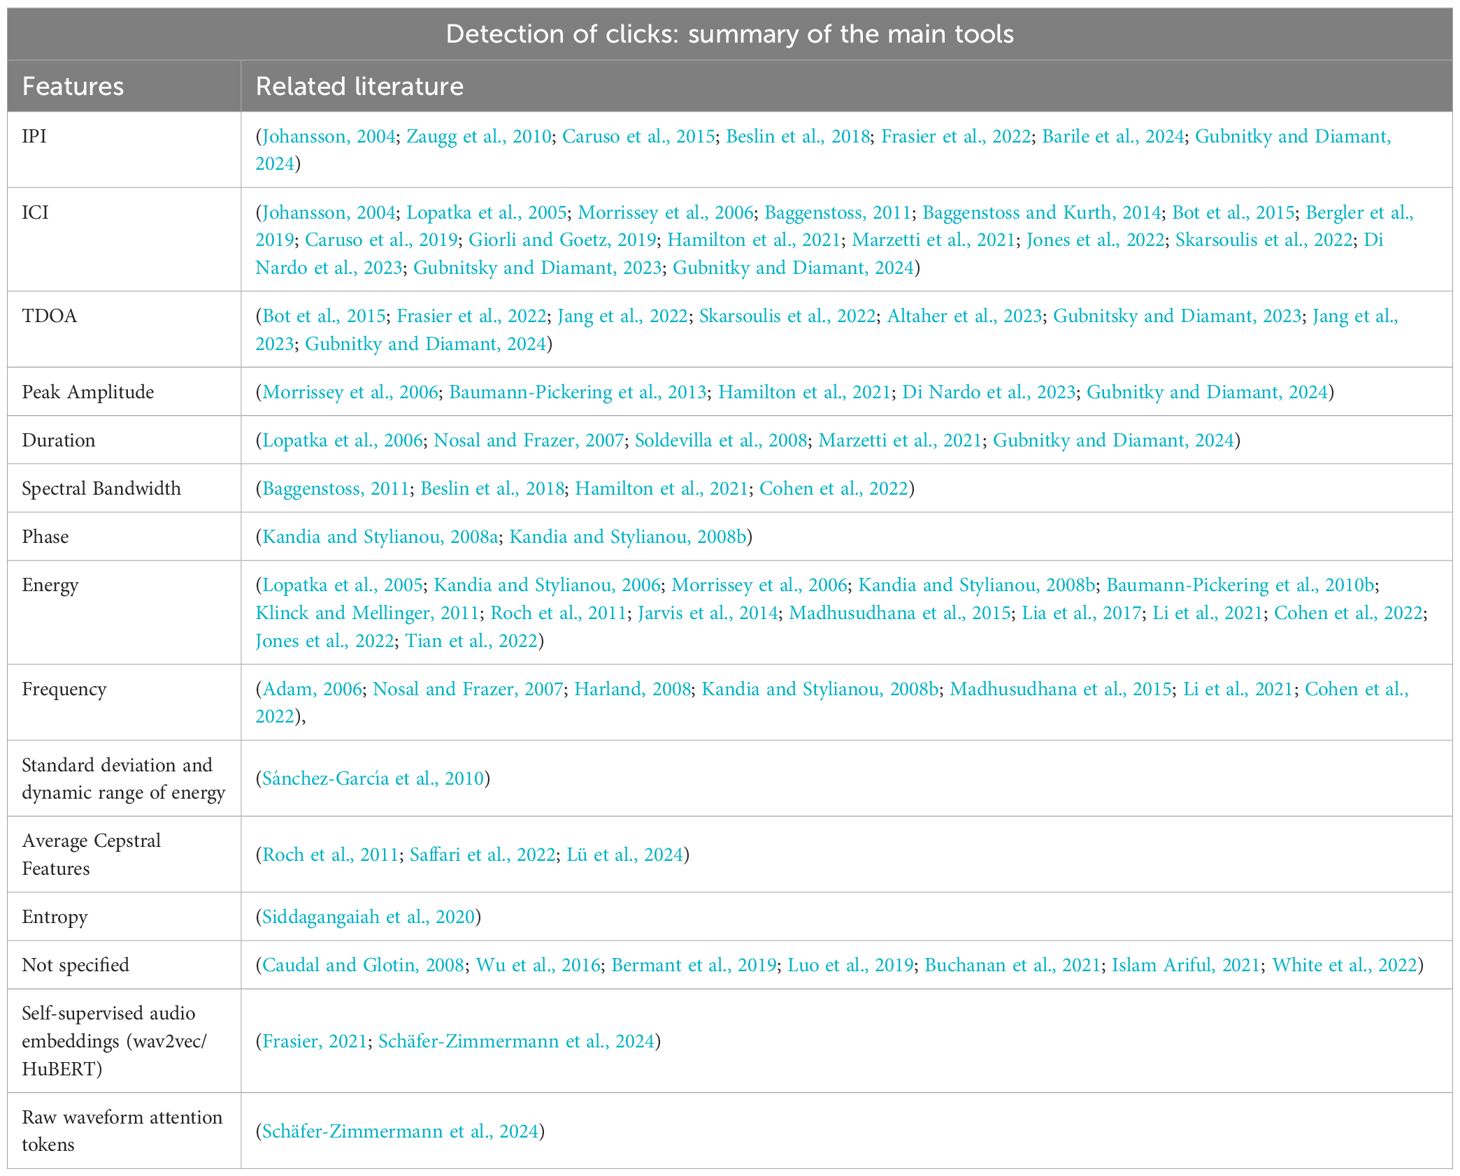
Table 9. Table of features used for click detection.
7 Conclusion
The importance of monitoring echolocation clicks is demonstrated by the need to analyze behavior changes, explore population changes, and evaluate environmental impacts of anthropogenic activities. In this survey we aimed to systematically categorize and evaluate a broad spectrum of methodologies for detecting cetacean echolocation clicks. We provided an overview of feature analysis, machine learning-based detection, and data-dependent methods. Feature analysis techniques delved into the intricate characteristics of clicks, such as duration, phase, frequency and energy, employing signal processing tools to separate clicks from the ambient noise. Machine learning-based detection emerged as a promising frontier, with methods like convolutional neural networks (CNNs) and recurrent neural networks (RNNs) offering pattern recognition capabilities. Data-dependent methods provided a structured approach to comparing signals against predefined templates, harnessing specific characteristics of the target clicks for detection. Advanced signal processing techniques such as adaptive filtering and wavelet transforms should be further explored to improve feature extraction from noisy underwater environments. The development of semi-supervised and unsupervised learning models could address the lack of labeled datasets and take advantage of the vast amounts of unlabeled acoustic data collected during ocean monitoring. Exploring methods of transfer learning and domain adaptation may provide opportunities to adapt models trained for well-studied cetacean species for lesser known or newly discovered species. We have also surveyed datasets openly shared for performance evaluation, and open software platforms. Collaboration between researchers, biologist and policy makers should establish standardized protocols for data collection, sharing and analysis that facilitate the development of universally applicable detection algorithms. To comment on the suitability of the different approaches, we implemented representative schemes and tested their detection performance over a single dataset. Despite the advancements and the diversity of approaches reviewed, it is imperative to recognize that no single technique currently suffices to detect and classify the vocalizations of all known cetacean species in a robust manner. This reality underscores some of the remaining challenges in the field. These challenges include dealing with the variability and unpredictability of marine soundscapes, the scarcity of labeled data for algorithm training, and the need for algorithms that are robust against environmental noise, shipping cavitation noise and interference from other marine fauna. Addressing these limitations calls for a multifaceted approach: enhancing feature extraction techniques, embracing the potential of deep learning while ensuring adaptability to limited data. A particular challenge lies in the separation of clicks from simultaneously emitting animals. Finally, we divided the works surveyed by their application, tools used, and application to serve for future development of click detection techniques.
Author contributions
MG: Conceptualization, Formal analysis, Investigation, Methodology, Visualization, Writing – original draft. RD: Conceptualization, Data curation, Funding acquisition, Investigation, Methodology, Supervision, Validation, Writing – review & editing. GG: Formal analysis, Software, Writing – original draft.
Funding
The author(s) declare financial support was received for the research, and/or publication of this article. This work was sponsored in part by the European Union’s Horizon Europe programme under UWIN-LABUST project (project number 101086340), and by Project CETI via grants from Dalio Philanthropies and Ocean X; Sea Grape Foundation; Rosamund Zander/Hansjorg Wyss, Chris Anderson/Jacqueline Novogratz through The Audacious Project: a collaborative funding initiative housed at TED.
Conflict of interest
The authors declare that the research was conducted in the absence of any commercial or financial relationships that could be construed as a potential conflict of interest.
Generative AI statement
The author(s) declare that no Generative AI was used in the creation of this manuscript.
Any alternative text (alt text) provided alongside figures in this article has been generated by Frontiers with the support of artificial intelligence and reasonable efforts have been made to ensure accuracy, including review by the authors wherever possible. If you identify any issues, please contact us.
Publisher’s note
All claims expressed in this article are solely those of the authors and do not necessarily represent those of their affiliated organizations, or those of the publisher, the editors and the reviewers. Any product that may be evaluated in this article, or claim that may be made by its manufacturer, is not guaranteed or endorsed by the publisher.
References
Adam O. (2006). The use of the hilbert-huang transform to analyze transient signals emitted by sperm whales. Appl. Acoustics 67, 1134–1143. doi: 10.1016/j.apacoust.2006.04.001
Allen T., Palagyi T., Rice A. N., and Palmquist K. (2024). Use of passive-acoustic monitoring to track marine mammals at spill sites. Int. Oil Spill Conf. Proc. 2024-1, 329s3–339s3. doi: 10.7901/2169-3358-2024.1.329
Altaher A. S., Zhuang H., Ibrahim A. K., Ali A. M., Altaher A., Locascio J., et al. (2023). Detection and localization of goliath grouper using their low-frequency pulse sounds. J. Acoustical Soc. America 153, 2190. doi: 10.1121/10.0017804
André M., Schaar M., Zaugg S., Houegnigan L., Sánchez Marrero A., and Castell J. (2011). Listening to the deep: Live monitoring of ocean noise and cetacean acoustic signals. Mar. pollut. Bull. 63, 18–26. doi: 10.1016/j.marpolbul.2011.04.038
Andreas J., Beguš G., Bronstein M. M., Diamant R., Delaney D., Gero S., et al. (2022). Toward understanding the communication in sperm whales. iScience 25, 104393. doi: 10.1016/j.isci.2022.104393
Au W. W. L. and Hastie G. D. (2007). Broadband echolocation signals of odontocetes. Deep-Sea Res. Part II 54, 251–258. doi: 10.1016/j.dsr2.2006.11.005
Au W. W. L., Lammers M. O., and Banks K. (1998). Shallow-water ambient noise from snapping shrimp and dolphins. J. Acoustical Soc. America 104, 1825–1826. doi: 10.1121/1.423471
Baggenstoss P. M. (2011). Separation of sperm whale click-trains for multipath rejection. J. Acoustical Soc. America 129, 3598–3609. doi: 10.1121/1.3578454
Baggenstoss P. M. and Kurth F. (2014). Comparing shift-autocorrelation with cepstrum for detection of burst pulses in impulsive noise. J. Acoustical Soc. America 136, 1574–1582. doi: 10.1121/1.4894734
Barile C., Berrow S., and O’Brien J. (2024). Click-click, who’s there? acoustically derived estimates of sperm whale size distribution off western Ireland. Front. Mar. Sci. 10. doi: 10.3389/fmars.2023.1264783
Barkley Y. M., Merkens K. P. B., Wood M., Oleson E. M., and Marques T. A. (2024). Click-detection rate variability of central north pacific sperm whales from passive acoustic towed arrays. J. Acoustical Soc. America 155, 2027–2041. doi: 10.1121/10.0025540
Baumann-Pickering S., McDonald M. A., Simonis A. E., Solsona Berga A., Merkens K. P. B., Oleson E. M., et al. (2013). Species-specific beaked whale echolocation signals. J. Acoustical Soc. America 134, 2293–2301. doi: 10.1121/1.4817832
Baumann-Pickering S., Roch M. A., Brownell J Robert L., Simonis A. E., McDonald M. A., Solsona-Berga A., et al. (2014). Spatio-temporal patterns of beaked whale echolocation signals in the north pacific. PloS One 9, e86072. doi: 10.1371/journal.pone.0086072
Baumann-Pickering S., Wiggins S. M., Hildebrand J. A., Roch M. A., and Schnitzler H. U. (2010a). Discriminating features of echolocation clicks of melon-headed whales (peponocephala electra), bottlenose dolphins (tursiops truncatus), and gray’s spinner dolphins (stenella longirostris longirostris). J. Acoustical Soc. America 128, 2212–2224. doi: 10.1121/1.3479549
Baumann-Pickering S., Wiggins S. M., Roth E. H., Roch M. A., Schnitzler H. U., and Hildebrand J. A. (2010b). Echolocation signals of a beaked whale at palmyra atoll. J. Acoustical Soc. America 127, 3790–3799. doi: 10.1121/1.3409478
Bergler C. (2017). Deepal fieldwork data 2017/2018 (dlfd) - pattern recognition lab. Available online at: https://lme.tf.fau.de/dataset/deepal-fieldwork-data-2017-2018-dlfd/ (Accessed January 22, 2024).
Bergler C., Schröter H., Cheng R. X., Barth V., Weber M., Noeth E., et al. (2019). Orca-spot: An automatic killer whale sound detection toolkit using deep learning. Sci. Rep. 9, 10997. doi: 10.1038/s41598-019-47335-w
Bermant P., Bronstein M., Wood R., Gero S., and Gruber D. (2019). Deep machine learning techniques for the detection and classification of sperm whale bioacoustics. Sci. Rep. 9, 1–10. doi: 10.1038/s41598-019-48909-4
Beslin W., Whitehead H., and Gero S. (2018). Automatic acoustic estimation of sperm whale size distributions achieved through machine recognition of on-axis clicks. J. Acoustical Soc. America 144, 3485–3495. doi: 10.1121/1.5082291
Biemann C. (2006). “Chinese whispers: An efficient graph clustering algorithm and its application to natural language processing problems.” in Proceedings of TextGraphs: the First Workshop on Graph Based Methods for Natural Language Processing. eds. Mihalcea R. and Radev D. (New York City: Association for Computational Linguistics), 73–80. Available online at: https://aclanthology.org/W06-3812/ (Accessed May 28, 2025).
Bittle M. and Duncan A. (2013). “A review of current marine mammal detection and classification algorithms for use in automated passive acoustic monitoring,” in Annual Conference of the Australian Acoustical Society 2013, Acoustics 2013: Science, Technology and Amenity. (Victor Harbor: Australian Acoustical Society), 208–215.
Bot O. L., Mars J., Gervaise C., and Simard Y. (2015). Rhythmic analysis for click train detection and source separation with examples on beluga whales. Appl. Acoustics 95, 37–49. doi: 10.1016/j.apacoust.2015.02.005
Buchanan C., Bi Y., Xue B., Vennell R., Childerhouse S., Pine M. K., et al. (2021). “Deep convolutional neural networks for detecting dolphin echolocation clicks,” in 2021 36th International Conference on Image and Vision Computing New Zealand (IVCNZ), Tauranga, New Zealand. 1–6. doi: 10.1109/IVCNZ54163.2021.9653250
CalCOFI (2005). Data – calcofi. Available online at: https://calcofi.org/data/ (Accessed January 22, 2024).
Cantor M., Shoemaker L., Cabral R., Flores C., Varga M., and Whitehead H. (2015). Multilevel animal societies can emerge from cultural transmission. Nat. Commun. 6, 8091. doi: 10.1038/ncomms9091
Caruso F., Sciacca V., Bellia G., Domenico E. D., Larosa G., Papale E., et al. (2015). Size distribution of sperm whales acoustically identified during long term deep-sea monitoring in the ionian sea. PloS One 10, e0144503. doi: 10.1371/journal.pone.0144503
Caruso F., Sciacca V., Parisi I., Viola S., de Vincenzi G., Bocconcelli A., et al. (2019). Acoustic recordings of rough-toothed dolphin (steno bredanensis) offshore eastern sicily (mediterranean sea). J. Acoustical Soc. America 146, EL286–EL292. doi: 10.1121/1.5126118
Caudal F. and Glotin H. (2008). “Stochastic matched filter outperforms teager-kaiser-mallat for tracking a plurality of sperm whales,” in 2008 New Trends for Environmental Monitoring Using Passive Systems, Hyeres, France, 1–9. doi: 10.1109/PASSIVE.2008.4786976
CETI P. (2020). Link to implementation code and database. (New York City, NY, USA (HQ): Project CETI).
CIBRA (2005). Cibra - marine mammals voices. Available online at: http://www-9.unipv.it/cibra/edu_medsounds_uk.html (Accessed January 24, 2024).
Cohen R. E., Frasier K. E., Baumann-Pickering S., Wiggins S. M., Rafter M. A., Baggett L. M., et al. (2022). Identification of western north atlantic odontocete echolocation click types using machine learning and spatiotemporal correlates. PloS One 17, 1–37. doi: 10.1371/journal.pone.0264988
Cotillard T., Sécheresse X., Aubin J., Mikus M. A., Vergara V., Gambs S., et al. (2024). Automatic detection and classification of beluga whale calls in the st. lawrence estuary. J. Acoust. Soc Am. 156, 3723–3740. doi: 10.1121/10.0030472
Damborský J., Prokop M., and Koča J. (2001). Triton: graphic software for rational engineering of enzymes. Trends Biochem. Sci. 26, 71–73. doi: 10.1016/S0968-0004(00)01708-4
Di Nardo F., De Marco R., Lucchetti A., and Scaradozzi D. (2023). A wav file dataset of bottlenose dolphin whistles, clicks, and pulse sounds during trawling interactions. Sci. Data 10, 650. doi: 10.1038/s41597-023-02547-8
Falk S. and Williams R. (2022). Ethical standards for research on marine mammals. Mar. Policy 138, 105045. doi: 10.1016/j.marpol.2022.105045
Fleishman E., Cholewiak D., Gillespie D., Helble T., Klinck H., Nosal E. M., et al (2023). Ecological inferences about marine mammals from passive acoustic data. Biol. Rev. 98, 1633–1647. doi: 10.1111/brv.12969
Francesco C. (2015). Dataset from ‘size distribution of sperm whales acoustically identified during long term deep-sea monitoring in the ionian sea’. Available online at: https://zenodo.org/records/33202 (Accessed January 22, 2024).
Frasier K. (2018). Marinebioacousticsrc/triton::whale: Scripps whale acoustics lab scripps acoustic ecology lab - triton with remoras in development. Available online at: https://github.com/MarineBioAcousticsRC/Triton (Accessed December 30, 2023).
Frasier K. E. (2021). A machine learning pipeline for classification of cetacean echolocation clicks. PloS Comput. Biol. 17, e1009613. doi: 10.1371/journal.pcbi.1009613
Frasier K. E., Poupard M., Ferrari M., Best P., and Glotin H. (2022). Passive-acoustic monitoring of sperm whales and anthropogenic noise using stereophonic recordings in the mediterranean sea, north west pelagos sanctuary. Sci. Rep. 12, 595. doi: 10.1038/s41598-022-05917-1
Frouin-Mouy H., Kowarski K., Martin B., and Broker K. (2017). Seasonal trends in acoustic detection of marine 1389 mammals in baffin bay and melville bay, northwest Greenland + supplementary appendix 1 (see article tools). ARCTIC 70, 59. doi: 10.14430/arctic4632
Fujioka E. (2007). Obis-seamap dataset - decaf - autec sperm whales - multiple sensors – complete dataset. Available online at: https://seamap.env.duke.edu/dataset/682/html (Accessed January 22, 2024).
Gervaise C., Barazzutti A., Busson S., Simard Y., and Roy N. (2010). Automatic detection of bioacoustics impulses based on kurtosis under weak signal to noise ratio. Appl. Acoustics 71, 1020–1026. doi: 10.1016/j.apacoust.2010.05.009
Gillespie D., Mellinger D., Gordon J., Mclaren D., Redmond P., McHugh R., et al. (2009). Pamguard: Semiautomated, open source software for real-time acoustic detection and localization of cetaceans. J. Acoustical Soc. America 125, 2547. doi: 10.1121/1.4808713
Giorli G. and Goetz K. T. (2019). Foraging activity of sperm whales (Physeter macrocephalus) off the east coast of New Zealand. Sci. Rep. 9, 12182. doi: 10.1038/s41598-019-48417-5
Goold J. C. and Jones S. E. (1995). Time and frequency domain characteristics of sperm whale clicks. J. Acoustical Soc. America 98, 1279–1291. doi: 10.1121/1.413465
Gubnitky G. and Diamant R. (2024). Detecting the presence of sperm whales’ echolocation clicks in noisy environments. IEEE/ACM Trans. Audio Speech Lang. Process. 32, 2050–2061. doi: 10.1109/TASLP.2024.3379899
Gubnitsky G. and Diamant R. (2023). “Inter-pulse estimation for sperm whale click detection,” in ICASSP 2023–2023 IEEE International Conference on Acoustics, Speech and Signal Processing (ICASSP), Rhodes Island, Greece. 1–5. doi: 10.1109/ICASSP49357.2023.10096004
Gubnitsky G., Mevorach Y., Gero S., DF G., and Diamant R. (2024). Automatic detection and annotation of sperm whale codas. doi: 10.48550/arXiv.2407.17119
Hamard Q., Pham M. T., Cazau D., and Heerah K. (2024). A deep learning model for detecting and classifying multiple marine mammal species from passive acoustic data. Ecol. Inf. 84, 102906. doi: 10.1016/j.ecoinf.2024.102906
Hamilton R. A., Starkhammar J., Gazda S. K., and Connor R. C. (2021). Separating overlapping echolocation: An updated method for estimating the number of echolocating animals in high background noise levels. J. Acoustical Soc. America 150, 709. doi: 10.1121/10.0005756
Harland E. (2008). Processing the workshop datasets using the trud algorithm. Can. Acoustics 36, 27–33. Available online at: https://jcaa.caa-aca.ca/index.php/jcaa/article/view/1987 (Accessed May 28, 2025).
Huang N. E., Shen Z., Long S. R., Wu M. C., Shih H. H., Zheng Q., et al. (1998). The empirical mode decomposition and the hilbert spectrum for nonlinear and non-stationary time series analysis. Proc. R. Soc. London. Ser. A: Mathematical Phys. Eng. Sci. 454, 903–995. doi: 10.1098/rspa.1998.0193
in the Sea V. (2007) Voices in the sea. Available online at: https://voicesinthesea.ucsd.edu/index.html (Accessed January 22, 2024).
Islam Ariful S. T. A. (2021). Convolutional neural network based marine cetaceans detection around the swatch of no ground in the bay of bengal. J. Acoustical Soc. America 145, EL7–EL12. doi: 10.12785/ijcds/120173
Jang J., Meyer F., Snyder E. R., Wiggins S. M., Baumann-Pickering S., and Hildebrand J. A. (2022). Bayesian detection and tracking of odontocetes in 3D from their echolocation clicks. J. Acoust. Soc. Am. 1553, 1520–8524. doi: 10.1121/10.0018572
Jang J., Meyer F., Snyder E. R., Wiggins S. M., Baumann-Pickering S., and Hildebrand J. A. (2023). Bayesian detection and tracking of odontocetes in 3-d from their echolocation clicks. J. Acoustical Soc. America 153, 2690. doi: 10.1121/10.0017888
Jarvis S. M., DiMarzio N., Watwood S., Dolan K., and Morrissey R. (2022). Automated detection and classification of beaked whale buzzes on bottom-mounted hydrophones. Front. Remote Sens. 3. doi: 10.3389/frsen.2022.941838
Jarvis S., Morrissey R., Moretti D., Dimarzio N., and Shaffer J. (2014). Marine mammal monitoring on navy ranges (m3r): A toolset for automated detection, localization, and monitoring of marine mammals in open ocean environments. Mar. Technol. Soc. J. 48, 5–20. doi: 10.4031/MTSJ.48.1.1
Johansson T. (2004). Parametric modelling of cetacean calls. UNIVERSITY OF SOUT HAMPTON FACULTY OF ENGINEERING, SCIENCE AND MATHEMATICS Institute of Sound and Vibration Research 113–118
Johnson M., Hickmott L., Aguilar Soto N., and Madsen P. (2008). Echolocation behaviour adapted to prey in foraging blainville’s beaked whale (mesoplodon densirostris). Proc. R. Soc. B: Biol. Sci. 275, 133–139. doi: 10.1098/rspb.2007.1190
Jones J., Frasier K., Westdal K., Ootoowak A., Wiggins S., and Hildebrand J. (2022). Beluga (delphinapterus leucas) and narwhal (monodon monoceros) echolocation click detection and differentiation from long-term arctic acoustic recordings. Polar Biol. 45, 449–463. doi: 10.1007/s00300-022-03008-5
Kaiser J. F. (1990). “On a simple algorithm to calculate the ‘energy’ of a signal,” in International Conference on Acoustics, Speech, and Signal Processing, Albuquerque, NM, USA. vol. 1, 381–384. doi: 10.1109/ICASSP.1990.115702
Kandia V. and Stylianou Y. (2006). Detection of sperm whale clicks based on the teager–kaiser energy operator. Appl. Acoustics 67, 1144–1163. doi: 10.1016/j.apacoust.2006.05.007
Kandia V. and Stylianou Y. (2008a). Detection of clicks based on group delay. 36, 48–54. Available online at: https://jcaa.caa-aca.ca/index.php/jcaa/article/view/1990 (Accessed May 28, 2025).
Kandia V. and Stylianou Y. (2008b). Detection of clicks based on group delay. Can. Acoustics 36, 48–54.
Klinck H. and Mellinger D. K. (2011). The energy ratio mapping algorithm: a tool to improve the energy-based detection of odontocete echolocation clicks. J. Acoustical Soc. America 129, 1807–1812. doi: 10.1121/1.3531924
Kloepper L. N. (2018). Bioacoustics links | technical committee on animal bioacoustics. Available online at: https://tcabasa.org/?page_id=2484 (Accessed January 24, 2024).
Knuth D. E. (2021). The Art of Computer Programming, Volume 4, Fascicle 6: Satisfiability (Boston, MA, USA: Springer International Publishing).
Koblitz J. C., Stilz P., Rasmussen M. H., and Laidre K. L. (2016). Highly directional sonar beam of narwhals (monodon monoceros) measured with a vertical 16 hydrophone array. PloS One 11, 1–17. doi: 10.1371/journal.pone.0162069
Koschinski S., Diederichs A., and Amundin M. (2023). Click train patterns of free-ranging harbour porpoises acquired using t-pods may be useful as indicators of their behaviour. J. Cetacean Res. Manage. 10, 147–155. doi: 10.47536/jcrm.v10i2.649
Kurama V. (2018). Convolutional neural networks explained | built in. Available online at: https://builtin.com/data-science/convolutional-neural-networks-explained (Accessed July 30, 2023).
Küsel E., Siderius M., and Mellinger D. (2016). Single-sensor, cue-counting population density estimation: Average probability of detection of broadband clicks. J. Acoustical Soc. America 140, 1894–1903. doi: 10.1121/1.4962753
Lek S., Park Y., Jørgensen S. E., and Fath B. D. (2008). “Multilayer perceptron,” in Encyclopedia of Ecology (Academic Press, Oxford), 2455–2462. doi: 10.1016/B978-008045405-4.00162-2
Leu A. A., Hildebrand J. A., Rice A., Baumann-Pickering S., and Frasier K. E. (2022). Echolocation click discrimination for three killer whale ecotypes in the northeastern pacific. J. Acoustical Soc. America 151, 3197–3206. doi: 10.1121/10.0010450
Li K., Sidorovskaia N. A., Guilment T., Tang T., and Tiemann C. O. (2021). Decadal assessment of sperm whale site-specific abundance trends in the northern gulf of Mexico using passive acoustic data. J. Mar. Sci. Eng. 9, 454. doi: 10.3390/jmse9050454
Lia J., Pana Y., Huangfua L., and Zhanga X. (2017). “Underwater acoustic transient noise measurement based on ccweemdan and power-law detector.” in Proc. of the 4th Underwater Acoustics Conference and Exhibition (UACE), Skiathos, Greece, Sept 2017. 516–522.
Lohrasbipeydeh H., Dakin D. T., Gulliver T. A., Amindavar H., and Zielinski A. (2015). Adaptive energy-based acoustic sperm whale echolocation click detection. IEEE J. Oceanic Eng. 40, 957–968. doi: 10.1109/JOE.2014.2366351
Lopatka M., Adam O., Laplanche C., Motsch J. F., and Zarzycki J. (2006). Sperm whale click analysis using a recursive time-variant lattice filter. Appl. Acoustics 67, 1118–1133. doi: 10.1016/j.apacoust.2006.05.011
Lopatka M., Adam O., Laplanche C., Zarzycki J., and Motsch J. F. (2005). An attractive alternative for sperm whale click detection using the wavelet transform in comparison to the fourier spectrogram. Aquat. Mammals 31, 463–467. doi: 10.1578/AM.31.4.2005.463
Lü Z., Shi Y., Lü L., Han D., Wang Z., and Yu F. (2024). Dual-feature fusion learning: An acoustic signal recognition method for marine mammals. Remote Sens. 16, 3823. doi: 10.3390/rs16203823
Luo W., Yang W., and Zhang Y. (2019). Convolutional neural network for detecting odontocete echolocation clicks. J. Acoustical Soc. America 145, EL7–EL12. doi: 10.1121/1.5085647
Madhusudhana S., Gavrilov A., and Erbe C. (2015). Automatic detection of echolocation clicks based on gabor model of their waveform. J. Acoustical Soc. America 137, 3077. doi: 10.1121/1.4921609
Madsen P. T., Kerr I., and Payne R. (2004). Source parameter estimates of echolocation clicks from wild pygmykiller whales (feresa attenuata) (l). J. Acoustical Soc. America 116, 1909–1912. doi: 10.1121/1.1788726
Marzetti S., Gies V., Best P., Barchasz V., Paris S., Barthélémy H., et al. (2021). A 30 µw embedded real-time cetacean smart detector. Electronics 10, 819. doi: 10.3390/electronics10070819
Mellinger D. K. (2002). Ishmael: 1.0 User’s Guide; ishmael: integrated system for holistic multi-channel acoustic exploration and localization. Pacific Mar. Environ. Lab. (U.S.).
Mellinger D. (2006). Welcome mobysound.org. Available online at: http://www.mobysound.org/ (Accessed January 31, 2024).
Morrissey R., Ward J., DiMarzio N., Jarvis S., and Moretti D. (2006). Passive acoustic detection and localization of sperm whales (physeter macrocephalus) in the tongue of the ocean. Appl. Acoustics 67, 1091–1105. doi: 10.1016/j.apacoust.2006.05.014
NOAA (1990-2014). Data links | (ecofoci) ecosystems & fisheries-oceanography coordinated investigations. Available online at: https://www.ecofoci.noaa.gov/data-links (Accessed January 22, 2024).
NOAA (2017a). Welcome to NOAA (NOAA Fisheries). (Silver Spring, MD, USA: NOAA Fisheries HQ). Available online at: https://www.fisheries.noaa.gov/ (Accessed May 28, 2025).
NOAA (2017b). Passive acoustic data viewer. Available online at: https://www.ncei.noaa.gov/maps/passive-acoustic-data/ (Accessed January 22, 2024).
Nosal E. M. and Frazer L. N. (2007). Sperm whale three-dimensional track, swim orientation, beam pattern, and click levels observed on bottom-mounted hydrophones. J. Acoustical Soc. America 122, 1969–1978. doi: 10.1121/1.2775423
Oliveira C., Wahlberg M., Johnson M., Miller P., and Madsen P. (2013). The function of male sperm whale slow clicks in a high latitude habitat: Communication, echolocation, or prey debilitation? J. Acoustical Soc. America 133, 3135–3144. doi: 10.1121/1.4795798
Orcasound (2018). Orcasound - bioacoustic data for marine conservation - registry of open data on aws. Available online at: https://registry.opendata.aws/orcasound/ (Accessed January 22, 2024).
Portal A. D. (2018). Acoustic data portal | international quiet ocean experiment (iqoe). Available online at: https://www.iqoe.org/acoustic-data-portal (Accessed January 24, 2024).
Portal S. H. (2024). Multilayer perceptron | sap help portal. Available online at: https://help.sap.com/docs/hana-cloud-database/sap-hana-cloud-sap-hana-database-predictive-analysis-library/multilayer-perceptron?version=2023_1_QRC (Accessed July 30, 2023).
Renilson Marine Consulting Pty Ltd. (2009). Reducing underwater noise pollution from large commercial vessels. international fund for animal welfare, Australia. {Commissioned by the International Fund for Animal Welfare (IFAW)}.
Reyes Reyes M., Iñiguez M., Hevia M., Hildebrand J., and Melcón M. (2015). Description and clustering of echolocation signals of commerson’s dolphins (cephalorhynchus commersonii) in bahía san julián, Argentina. J. Acoustical Soc. America 138, 2046. doi: 10.1121/1.4929899
Rhode Island U. and Center I. S. (2002). Marine mammals – discovery of sound in the sea. Available online at: https://dosits.org/galleries/audio-gallery/marine-mammals/ (Accessed January 22, 2024).
Rideout B. (2022). A review of passive acoustic marine mammal call detection techniques. Scientific Report DRDC-RDDC-2022-R018, Defence Research and Development Canada. Atlantic Res. Centre.
Roch M., Klinck H., Baumann-Pickering S., Mellinger D., Qui S., Soldevilla M., et al. (2011). Classification of echolocation clicks from odontocetes in the southern california bight. J. Acoustical Soc. America 129, 467–475. doi: 10.1121/1.3514383
SABIOD (2014). [sabiod] data samples. Available online at: https://sabiod.lis-lab.fr/data_samples (Accessed January 22, 2024).
Saffari A., Khishe M., and Zahiri S. H. (2022). Fuzzy-choa: an improved chimp optimization algorithm for marine mammal classification using artificial neural network. Analog Integrated Circuits Signal Process. 111, 403–417. doi: 10.1007/s10470-022-02014-1
Sánchez-García A., Bueno-Crespo A., and Sancho-Gómez J. (2010). An efficient statistics-based method for the automated detection of sperm whale clicks. Appl. Acoustics 71, 451–459. doi: 10.1016/j.apacoust.2009.11.005
Schäfer-Zimmermann J. C., Demartsev V., Averly B., Dhanjal-Adams K., Duteil M., Gall G., et al (2024). animal2vec and MeerKAT: A self-supervised transformer for rare-event raw audio input and a large-scale reference dataset for bioacoustics. arXiv. doi: 10.48550/arXiv.2406.01253
Seger K., Al-Badrawi M., Miksis-Olds J., Kirsch N., and Lyons A. (2018). An empirical mode decomposition-based detection and classification approach for marine mammal vocal signals. J. Acoustical Soc. America 144, 3181–3190. doi: 10.1121/1.5067389
Siddagangaiah S., Chen C. F., Hu W. C., Akamatsu T., McElligott M., Lammers M. O., et al. (2020). Automatic detection of dolphin whistles and clicks based on entropy approach. Ecol. Indic. 117, 106559. doi: 10.1016/j.ecolind.2020.106559
Simard P., Hibbard A. L., McCallister K. A., Frankel A. S., Zeddies D. G., Sisson G. M., et al. (2010). Depth dependent variation of the echolocation pulse rate of bottlenose dolphins (tursiops truncatus). J. Acoustical Soc. America 127, 568–578. doi: 10.1121/1.3257202
Skarsoulis E. K., Piperakis G. S., Orfanakis E., Papadakis P., Pavlidi D., Kalogerakis M. A., et al. (2022). A real-time acoustic observatory for sperm-whale localization in the eastern mediterranean sea. Front. Mar. Sci. 9. doi: 10.3389/fmars.2022.873888
Soldevilla M., Henderson E., Campbell G., Wiggins S., Hildebrand J., and Roch M. (2008). Classification of risso’s and pacific white-sided dolphins using spectral properties of echolocation clicks. J. Acoustical Soc. America 124, 609–624. doi: 10.1121/1.2932059
Tian Y., Liu M., Zhang S., and Zhou T. (2022). Underwater multi-target passive detection based on transient signals using adaptive empirical mode decomposition. Appl. Acoustics 190, 108641. doi: 10.1016/j.apacoust.2022.108641
Tyack P. L. and Janik V. M. (2013). Effects of Noise on Acoustic Signal Production Marine Mammals (Berlin, Heidelberg: Springer Berlin Heidelberg), 251–271. doi: 10.1007/978-3-642-41494-7\_9
Usman A. M., Ogundile O. O., and Versfeld D. J. J. (2020). Review of automatic detection and classification techniques for cetacean vocalization. IEEE Access 8, 105181–105206. doi: 10.1109/ACCESS.2020.3000477
Vachon F., Eguiguren A., Rendell L., Gero S., and Whitehead H. (2022). Distinctive, fine-scale distribution of eastern caribbean sperm whale vocal clans reflects island fidelity rather than environmental variables. R. Soc. Open Sci. 9, 211737. doi: 10.1002/ece3.9449
Versluis M., von der Heydt A., Lohse D., and Schmitz B. (2000). On the sound of snapping shrimp: The collapse of a cavitation bubble. J. Acoustical Soc. America 108, 2541–2542. doi: 10.1121/1.4743418
Vishnu H., Soorya V. R., Chitre M., Too Y. M., Koay T. B., and Ho A. (2024). Machine-learning based detection of marine mammal vocalizations in snapping-shrimp dominated ambient noise. Mar. Environ. Res. 199, 106571. doi: 10.1016/j.marenvres.2024.106571
Walters R. (2008). Ocean glider observations in greater cook strait (New Zealand: SEANOE). doi: 10.17882/76530
Watkins W. A. (1998). Watkins marine mammal sound database. Available online at: https://whoicf2.whoi.edu/science/B/whalesounds/fullCuts.cfm?SP=BG2A&YR=56 (Accessed January 22, 2024).
White E. L., White P. R., Bull J. M., Risch D., Beck S., and Edwards E. W. J. (2022). More than a whistle: Automated detection of marine sound sources with a convolutional neural network. Front. Mar. Sci. 9. doi: 10.3389/fmars.2022.879145
Wu Z. and Huang N. E. (2009). Ensemble empirical mode decomposition: A noise assisted data analysis method. Tech. report Center Ocean-Land-Atmosphere Studies Calverton MD 1, 1–14. doi: 10.1142/S1793536909000047
Wu B., Li S., Yang J., Wang L., and Liang R. (2016). “Wp-page test detection of underwater acoustic transient signal,” in 2016 IEEE/OES CHINA Ocean Acoustics (COA), Harbin, China, 1–5. doi: 10.1109/COA.2016.7535756
Zapetis M. and Szesciorka A. (2022).Cetacean navigation, in Encyclopedia of Animal Cognition and Behavior, Vonk J. and Shackelford T. (eds). (Cham: Springer), 1–7. doi: 10.1007/978-3-319-47829-6_986-1
Zaugg S., (van der Schaar) M., Houégnigan L., Gervaise C., and André M. (2010). Real-time acoustic classification of sperm whale clicks and shipping impulses from deep-sea observatories. Appl. Acoustics 71, 1011–1019. doi: 10.1016/j.apacoust.2010.05.005
Zhang Pl and Lin Sy. (2019). Study on bubble cavitation in liquids for bubbles arranged in a columnar bubble group. Appl. Sci. 9, 5292. doi: 10.3390/app9245292
Ziegenhorn M. A., Frasier K. E., Hildebrand J. A., Oleson E. M., Baird R. W., Wiggins S. M., et al. (2022). Discriminating and classifying odontocete echolocation clicks in the hawaiian islands using machine learning methods. PloS One 17, 1–24. doi: 10.1371/journal.pone.0266424
Zimmer W. M. X. (2011). Passive Acoustic Monitoring of Cetaceans (Cambridge: Cambridge University Press, Cambridge, UK). doi: 10.1017/CBO9780511977107
Keywords: sperm whale clicks, bioacoustics, passive acoustic monitoring, acoustic detection, acoustic database
Citation: Gracic M, Gubnitsky G and Diamant R (2025) A survey of detection techniques for sperm whale and dolphin echolocation clicks. Front. Mar. Sci. 12:1567001. doi: 10.3389/fmars.2025.1567001
Received: 26 January 2025; Accepted: 01 September 2025;
Published: 29 October 2025.
Edited by:
Yimian Dai, Nanjing University of Science and Technology, ChinaReviewed by:
Charlotte Dunn, Bahamas Marine Mammal Research Organisation (BMMRO), BahamasGerardo Soto, Universidad Austral de Chile, Chile
Todor Ganchev, Technical University of Varna, Bulgaria
Copyright © 2025 Gracic, Gubnitsky and Diamant. This is an open-access article distributed under the terms of the Creative Commons Attribution License (CC BY). The use, distribution or reproduction in other forums is permitted, provided the original author(s) and the copyright owner(s) are credited and that the original publication in this journal is cited, in accordance with accepted academic practice. No use, distribution or reproduction is permitted which does not comply with these terms.
*Correspondence: Roee Diamant, cm9lZS5kQHVuaXYuaGFpZmEuYWMuaWw=