 Jiancong Fan
 Miaoxin Guo1
 Yang Li
- 1College of Computer Science and Engineering, Shandong University of Science and Technology, Qingdao, China
- 2Provincial Key Laboratory for Information Technology of Wisdom Mining of Shandong Province, Shandong University of Science and Technology, Qingdao, China
Synthetic aperture radar (SAR) images have all-weather observation capabilities and are crucial in ocean surveillance and maritime ship detection. However, their inherent low resolution, scattered noise, and complex background interference severely limit the accuracy of target detection. This paper proposes an innovative framework that integrates super-resolution reconstruction and multi-scale maritime ship detection to improve the accuracy of marine ship detection. Firstly, a TaylorGAN super-resolution network is designed, and the TaylorShift attention mechanism is introduced to enhance the generator’s ability to restore the edge and texture details of the ship. The Taylor series approximation is combined to optimize the attention calculation, and a multi-scale discriminator module is designed to improve global consistency. Secondly, a hierarchical multi-scale Mask R-CNN (HMS-MRCNN) detection method is proposed, which significantly improves the multi-scale maritime ship detection problem through the cross-layer fusion of shallow features (small targets) and deep features (large targets). Experiments on SAR datasets show that TaylorGAN has achieved significant improvements in both peak signal-to-noise ratio and structural similarity indicators, outperforming the baseline model. After adding super-resolution reconstruction, the average precision and recall of HMS-MRCNN are also greatly improved.
1 Introduction
Synthetic aperture radar (SAR) as an active microwave remote sensing imaging technology, with its all-weather, all-day capability, and low dependence on weather and lighting conditions, has important applications in the fields of marine surveillance, ship detection, etc (Gao et al., 2024; Meng et al., 2024; Wu et al., 2024). SAR imagery is able to provide high-resolution data under complex weather conditions, which makes it an ideal tool for monitoring ship activities at sea. However, low-resolution SAR images can have an adverse effect on the identification of marine vessels. Due to the low resolution of the equipment and the complex imaging environment, low-resolution images often lack sufficient details, especially in complex backgrounds, and are often affected by scattering noise, background clutter, etc (Li et al., 2023; Cao et al., 2024). Using super-resolution reconstruction technology, more image details can be restored without increasing the hardware costs. Therefore, the development of a method that combines image super-resolution reconstruction with target detection can not only improve the utilization value of SAR images but also provide more efficient technical support for ensuring maritime safety and monitoring maritime traffic (Tang et al., 2024).
Super-resolution (SR) technology, as an effective means to improve image quality, has received widespread attention in SAR image processing (Jiang et al., 2024). SR algorithms for images are mainly categorized into two types: traditional methods and methods of deep learning. In traditional methods, interpolation methods predict unknown pixel information based on known pixel points to improve image resolution. Common interpolation methods include nearest neighbor interpolation (Blu et al., 2004), bilinear interpolation (Tong and Leung, 2007), and bicubic interpolation (Chang et al., 2004). Although the interpolation method is faster in reconstruction, it does not utilize a priori knowledge in the low-resolution image, so the reconstructed high-resolution image lacks the main texture information, whereas in reconstruction-based methods a priori information is introduced as constraints to reconstruct the image. The main reconstruction-based methods are the convex set projection method (Tom and Katsaggelos, 1996), the iterative inverse projection method (Irani and Peleg, 1991), and the maximum a posteriori probability estimation method (Liu and Sun, 2013). Reconstruction-based methods have limited utilization of prior knowledge, and learning-based methods, in order to improve this problem, introduce external datasets for training in order to learn more information about the image so that the reconstruction results contain more high-frequency details. Learning-based methods can be categorized into shallow learning methods and deep learning methods. Shallow learning methods mainly include based sample learning (Freeman et al., 2002), based neighborhood embedding (Chang et al., 2004), and based sparse representation methods (Xu et al., 2019). Shallow learning methods can achieve better results when trained on small-scale datasets, but the learning ability of the model needs to be improved. In recent years, deep learning-based methods have made great breakthroughs in the work of super-resolution reconstruction of images, and the deep learning methods are mainly based on three types of baseline networks: convolutional neural networks, generative adversarial networks, and attention mechanism networks. In 2014, Dong et al. proposed a super-resolution convolutional neural network (SRCNN), which is firstly applied to SR reconstruction, and the network convolves the input image through three layers (feature extraction and representation layer, nonlinear mapping layer, and reconstruction layer), it realizes the mapping from low resolution to high resolution, and the reconstruction effect on image resolution is better than the traditional reconstruction methods (Dong et al., 2014). In 2017, Legid et al. proposed the super-resolution generative adversarial network (SRGAN), which is the first time that generative adversarial networks (GANs) have been applied to the field of SR reconstruction. The network makes good use of the generative-adversarial properties of GAN networks, the generator and discriminator are trained alternately until convergence, the output shows more realistic texture details compared to traditional reconstruction methods, and the resolution is significantly improved visually (Ledig et al., 2017). In 2018, Zhang et al. proposed the residual channel attention network (RCAN), introduced the channel attention mechanism into the SR reconstruction task, and designed a deep residual channel convolutional network (Zhang et al., 2018). The network can learn the information of different channels of the feature map, set different weights for each channel, and finally reconstruct a high-resolution image. In recent years, with the excellent performance of Transformer in other image processing fields, scholars have begun to pay attention to the combination of Transformer and SR tasks. In 2020, Yang et al. proposed a texture transformation network (TTSR) for image super-resolution, which can combine low-frequency and high-frequency information to learn the deep correspondence of images, thereby stacking texture details in high-resolution images across scales and enhancing the reconstruction results (Yang et al., 2020). Due to the excellent performance of deep learning in optical image super-resolution, deep learning-based methods have been applied to SAR image super-resolution reconstruction in recent years. In 2018, Wang et al. directly applied the SRGAN network to the Terra-SAR dataset and achieved excellent results in reconstruction accuracy and computational efficiency (Wang et al., 2018). In 2019, Gu et al. proposed a DGAN network for the super-resolution reconstruction of pseudo-high-resolution SAR images, which effectively removed noise from SAR images and improved the resolution of SAR images (Gu et al., 2019). In 2020, Shen et al. used residual convolutional neural networks to improve the spatial resolution of polarimetric SAR images, which was superior to traditional methods in terms of image detail preservation (Shen et al., 2020). In 2022, Smith et al. proposed a SAR image super-resolution reconstruction method based on residual convolutional neural networks, which was superior to traditional methods in terms of reconstruction accuracy and computational efficiency. This method combines ViT with CNN for the super-resolution reconstruction of near-field SAR images, enhancing the details of the generated images (Smith et al., 2022). In 2023, Zhang et al. proposed a learnable probabilistic degradation model, which introduces SAR noise before the cycle-GAN framework, learns the relationship between low-resolution and high-resolution SAR images, and improves the resolution of SAR images (Zhang et al., 2023a). In 2024, Jiang et al. proposed a lightweight super-resolution generative adversarial network (LSRGAN), which improved the resolution of SAR images by introducing deep separable convolution (DSConv) and SeLU activation function, and constructed a lightweight residual module (LRM) to optimize the GAN network for SAR images (Jiang et al., 2024). In addition, the feature learning capability of the model is significantly improved by combining the optimized coordinated attention (CA) module.
The biggest feature of the traditional SAR image ship detection algorithm is manual extraction. The manual extraction process first preprocesses the image to reduce the image noise; secondly, sea and land segmentation is performed to prevent the near-coastal land area from interfering with the ship detection; finally, the ship is detected. The constant false alarm rate (CFAR) algorithm (Baldygo et al., 1993) is one of the most classical methods in traditional SAR target detection. The algorithm models the ocean background clutter and distinguishes between target ships and background noise. CFAR algorithm does not apply to complex ocean backgrounds or ship targets with different directions, lengths, and widths, and its generalization performance is poor. With the development of artificial intelligence technology, target detection methods based on deep learning are applied by researchers in the field of SAR ship detection, which can be divided into one-stage and two-stage methods. One-stage methods treat all regions of the image as potential target regions and use only one deep convolutional network to recognize the target, which is faster, such as the YOLO series (Redmon, 2016; Ge, 2021). Two-stage methods use region suggestion module or selective search method to localize and recognize targets with higher accuracy (Su et al., 2022), such as R-CNN (Girshick et al., 2014), Faster R-CNN (Ren, 2015), Cascade R-CNN (Cai and Vasconcelos, 2018), Grid R-CNN (Lu et al., 2019), etc. Girshick et al. applied a convolutional neural network (CNN) for the first time to the target detection task and built an R-CNN network, thus achieving good results. Faster R-CNN extracts candidate frames by regional recommendation networks (RPN) and introduces a multi-task loss function, which shows good performance in target detection. In addition, researchers have proposed a large number of methods for the problem of target detection in SAR images. In the same year, Sun et al. (2021) proposed an anchor-free ship detection framework named CP-FCOS, which employs a category-position module to improve localization accuracy by guiding the position regression branch using semantic classification features. Zhang et al. (2021) proposed a novel quadruple pyramid network consisting of four FPNs and conducted experiments on five common SAR datasets, achieving good results. The authors also verified that Quad-FPN has good transferability. In 2022, Tang et al. proposed an algorithm based on Faster R-CNN for target detection in SAR images by using the Bhattacharyya distance (BD) instead of intersection over union (IoU) to avoid the limitations of the commonly used intersection over union ratio in target detection networks for small target recognition, which was evaluated on the LS-SSDD-v1.0 dataset and achieved significant detection results (Tang et al., 2022). In 2023, Zhang et al. proposed the SCSA-Net to address the effects of complex noise and land background interference on target detection in SAR images and also proposed the global average precision loss (GAP loss) to solve the “fractional bias” problem (Zhang et al., 2023b). In 2024, Yasir et al. (2024a) proposed the lightweight YOLOShipTracker model, which was optimized for YOLOv8n via the HGNetv2 reconciliation header and combined with a novel multi-target tracking technique (C-BIoU) to enable efficient, real-time tracking of ships in short-duration SAR image sequences. In the same year, Yasir et al. (2024b) also developed SwinYOLOv7, which combines YOLOv7 with the Swin Transformer and the CBAM Attention Module to demonstrate excellent performance in a variety of SAR datasets, especially in cluttered and near-shore environments. In addition, MGSFA-Net, a multi-scale global scattering feature association network for SAR ship identification, is introduced by Zhang et al. (2024). Their method can effectively capture the intrinsic physical scattering features and significantly improve the identification performance even with limited training data. However, the SAR image itself has limited resolution, which makes it difficult to present key details such as ship contours and deck structures, which will affect the detection algorithm’s complete identification of targets. At the same time, the existing target detection methods still have the problem of lack of balance when facing multi-scale targets, which makes it difficult to take into account the small and large targets, resulting in some scale targets being missed.
In order to solve the abovementioned problems, this paper proposes a hierarchical multi-scale marine ship detection method based on Mask R-CNN to accurately detect ships and combines the TaylorGAN super-resolution reconstruction algorithm to enhance the resolution of SAR images.
The main contributions of this paper are as follows:
1. The TaylorGAN super-resolution reconstruction algorithm is proposed by introducing the TaylorShift attention mechanism in the GAN network to improve the resolution of ship image details, especially to enhance the sharpness of ship edges;
2. A hierarchical multi-scale marine ship detection method based on Mask R-CNN is proposed. Different convolutional layers are used to extract the large and small target features of SAR images, respectively. The extracted features are introduced into the RoI Align layer. The multi-scale features are balanced through L2 normalization to improve the detection accuracy.
3. The problem of insufficient detection of small targets is solved by fusing multi-scale feature information to avoid the degradation of detection accuracy due to low resolution.
The subsequent sections of the paper are organized as follows: Section 2 presents a detailed description of the proposed framework, including the TaylorGAN-based super-resolution reconstruction method and the HMS-MRCNN multi-scale ship detection architecture. Section 3 introduces the SAR datasets used in this study, elaborates on the experimental setup, outlines the evaluation metrics, analyzes the detection performance across various models, and reports results from comprehensive ablation studies. Section 4 concludes the paper by summarizing the major findings and highlighting potential directions for future research.
2 Methodology
This section first describes the TaylorGAN super-resolution reconstruction network. Secondly, the hierarchical multi-scale Mask R-CNN architecture proposed in this study is described in detail.
2.1 Super-resolution reconstruction network architecture
Existing super-resolution reconstruction algorithms are often faced with the problems of blurred edges and degraded structures when directly applied to SAR images, which make it difficult to meet the needs of fine reconstruction. For this reason, this paper proposes a network structure called TaylorGAN to improve the super-resolution quality of SAR images, and the overall architecture is shown in Figure 1, including a generator and a discriminator.
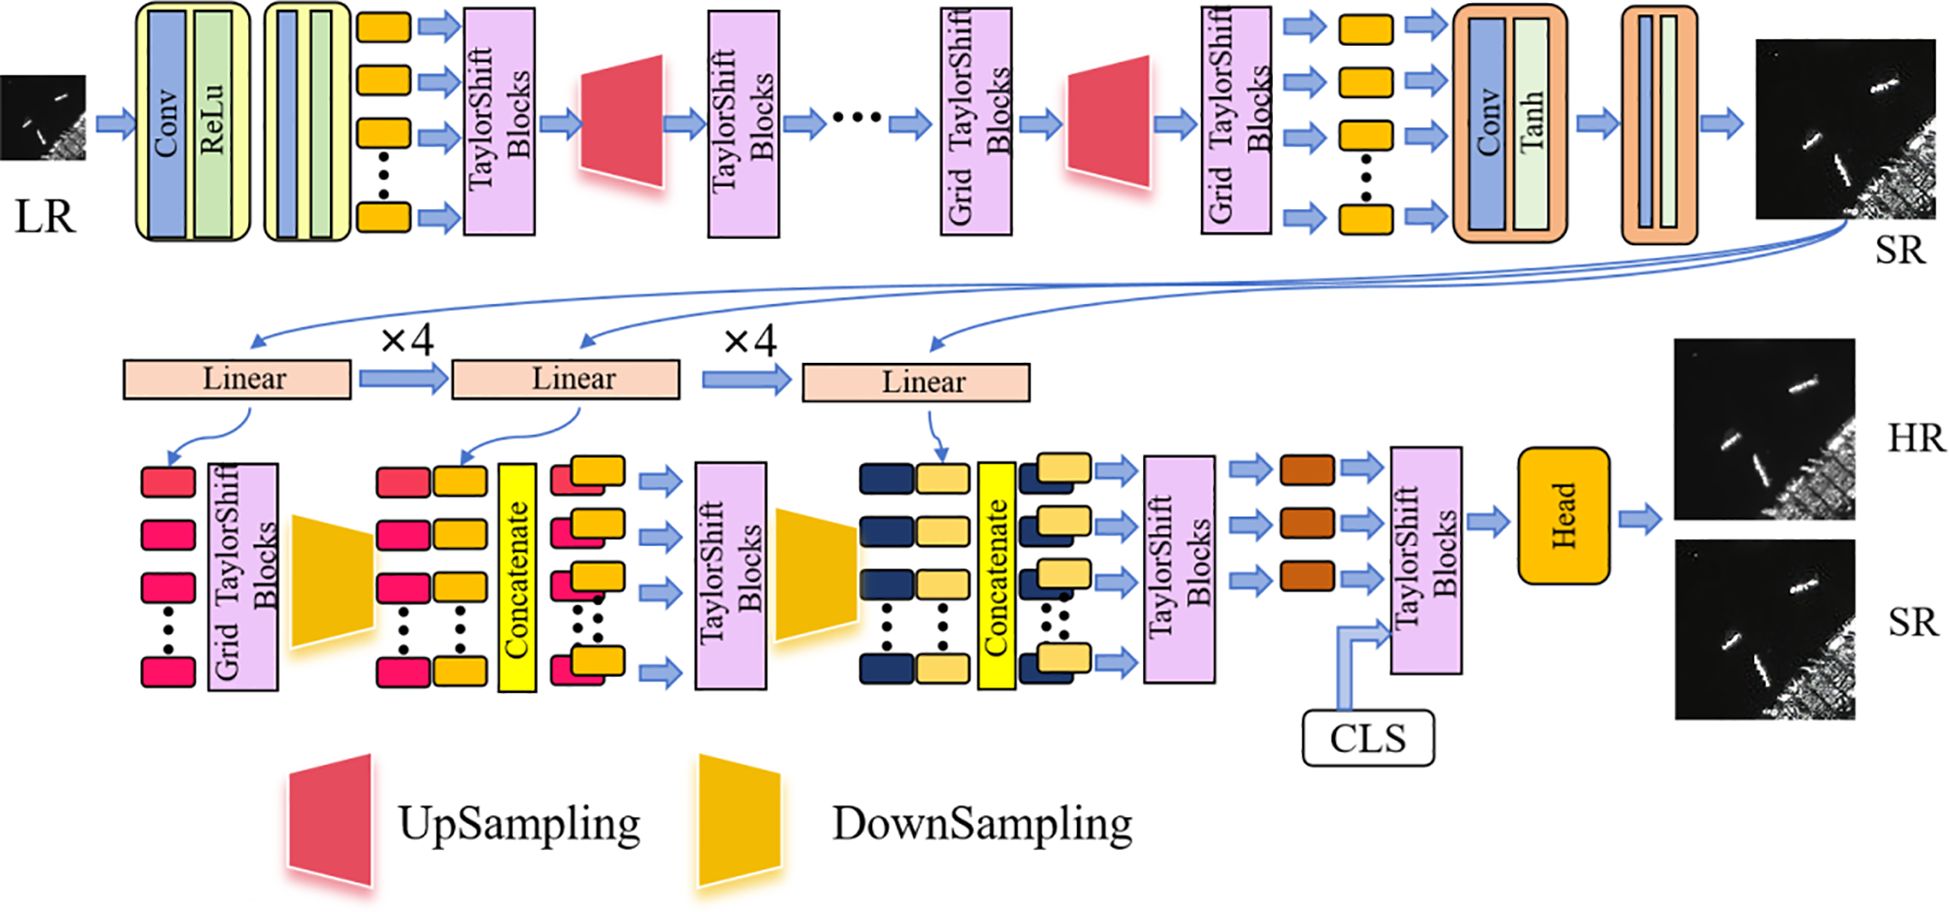
Figure 1. TaylorGAN network architecture.
The generator takes a low-resolution SAR image as inputs and gradually restores the resolution of the image through the multilayer TaylorShift attentional module and the step-by-step upsampling structure while enhancing the ability to model the global structure and local details of the image. Although the TaylorShift mechanism itself does not directly enhance the image details, the model can effectively capture the high-frequency regions such as hull contours and edges with the help of the hierarchical upsampling and feature fusion structure so as to realize high-quality detail reproduction.
The discriminator adopts a multi-scale structure design, combined with the TaylorShift attention module, to extract features at multiple spatial resolutions, perceive the differences between local details and the global structure of the image, and ultimately output the true/false prediction results through the classification header and to effectively optimize the training direction of the generator.
2.1.1 Generator
The upper part of Figure 1 is the generator of TaylorGAN, which can be divided into three main modules: input module, feature extraction module, and image reconstruction module. The low-resolution SAR image is used as input, denoted as , where C represents the number of image channels, and H and W represent the height and width of the image, respectively. First, the initial features are extracted by the embedding module composed of convolutional layers and ReLU activation function, and it is represented as . Subsequently, the embedded features are processed by the layer Grid TaylorShift Block, and the attention mechanism is used to capture the long-distance dependencies in the image and model the local semantic information. The TaylorShift attention mechanism replaces the Softmax function by Taylor series expansion, greatly reducing the computational complexity until the resolution is increased to . In order to gradually improve the image resolution, the generator designs multiple upsampling modules to improve the reconstruction accuracy by gradually expanding the spatial scale. After each level of upsampling, the TaylorShift attention module is stacked to further enhance the feature representation ability, especially the modeling ability of high-frequency details such as edges and contours, thereby improving the clarity and structural consistency of the generated image. Finally, through a set of convolutional layers and Tanh activation functions, the feature map is mapped to the output image at the target resolution , and r is the magnification factor.
2.1.2 Discriminator
The lower part of Figure 1 shows the discriminator of TaylorGAN, whose input is the super-resolution SAR image generated by the generator. To achieve multi-scale discrimination, the image is divided into three blocks of different scales (P, 2P, and 4P), corresponding to the feature sequences of , and , respectively. Each set of sequences is sent to the corresponding TaylorShift block through linear mapping to extract semantic features at different scales. Finally, the discriminator uses a downsampling module to reduce the resolution of the feature map, and the connection block fuses features of different scales so that the model can perceive the global structure and local details of the image at the same time. To evaluate the overall authenticity of the image, a [CLS] tag is added at the end of the discriminator. This tag interacts with all image tokens through a multi-layer attention mechanism, and only the output features of this tag are used as the classifier input so that the discriminator can comprehensively judge the global consistency and detail rationality of the image. Finally, the real/generated discrimination result is output through the classification head to assist the generator in optimizing the image quality.
2.1.3 TaylorShift attention mechanism
The traditional self-attention mechanism has a computational bottleneck, and its time and space complexity are both , where N is the length of the token sequence (that is, the number of patches in the image). When processing high-resolution images (such as 256 × 256), the memory usage and inference time increase dramatically, which seriously restricts the scalability of the model. TaylorShift (Nauen et al., 2025) Attention Mechanisms is a variant of Transformer that approximates the exponential operations in a Softmax function by Taylor series expansion. The TaylorShift attention mechanisms are categorized into direct TaylorShift and efficient TaylorShift.
1. Direct-TaylorShift
The Taylor approximation is applied to Softmax in Taylor-Softmax to avoid the computation of the exponential function, and the k-order (kth) Taylor expansion formula is Equation 1:
The Taylor-Softmax formula is Equation 2:
In Direct-TaylorShift, Taylor-Softmax is used directly instead of Softmax to compute the attention weights and multiply the computed result with the value matrix V. The formula is Equation 3:
is the outputs, and is the same Taylor expansion operation performed on each line of , and normalization is performed on each line. The denominator ensures that the output is normalized across tokens, making the weights valid for each token. This expression is suitable for scenarios with a small number of tokens (such as 32 × 32 and below). It significantly reduces the reliance on exponential functions and is faster to calculate, but the computational complexity is .
2. Efficient-TaylorShift
For further optimization, TaylorShift introduced an efficient implementation form Efficient-TaylorShift. If the length of the feature sequence exceeds a certain threshold, it is more appropriate to use Efficient-TaylorShift. It is performed by assigning Taylor-Softmax values to the matrices Q and K and moving the normalization operation after multiplying it with the value matrix V. The formula for normalization is Equations 4–6:
denotes Hadamard multiplication (element-level multiplication), denotes a vector of length N with all ones. denotes the weighted attention score, and denotes the value used for normalization.
By changing the calculation order, Efficient-TaylorShift reduces the computational complexity of traditional attention from to , which is suitable for processing tens of thousands of tokens in high-resolution images. The reduction in computational complexity enables the model to better capture global dependencies and improve the integrity and consistency of image structure.
In this paper, the TaylorShift attention mechanism is integrated into two different module structures: TaylorShift Block and Grid TaylorShift Block, which correspond to two application scenarios of sequence modeling and spatial modeling, respectively. TaylorShift Block is suitable for processing flattened image patch token sequences. The input is a one-dimensional token sequence. The module calculates the long-distance dependencies between different tokens through TaylorShift attention to model the overall semantic information of the image. In contrast, Grid TaylorShift Block is designed for feature map input that retains the spatial structure of two-dimensional images. The module calculates self-attention along the row and column directions of the image, respectively, to more efficiently capture local spatial relationships in the image, such as edge and texture information.
2.2 HMS-MRCNN
The paper proposed a hierarchical multi-scale SAR image marine ship detection method based on Mask R-CNN as shown in Figure 2, which is mainly divided into three parts, i.e., the feature extraction module, the region suggestion network, and the prediction module. The feature extraction and fusion module is used to extract the multiscale features of the ship in the SAR image and fuse the different features. The region suggestion network is used to identify potential regions of interest. The prediction module classifies and regresses the candidate boxes and outputs the final bounding box.
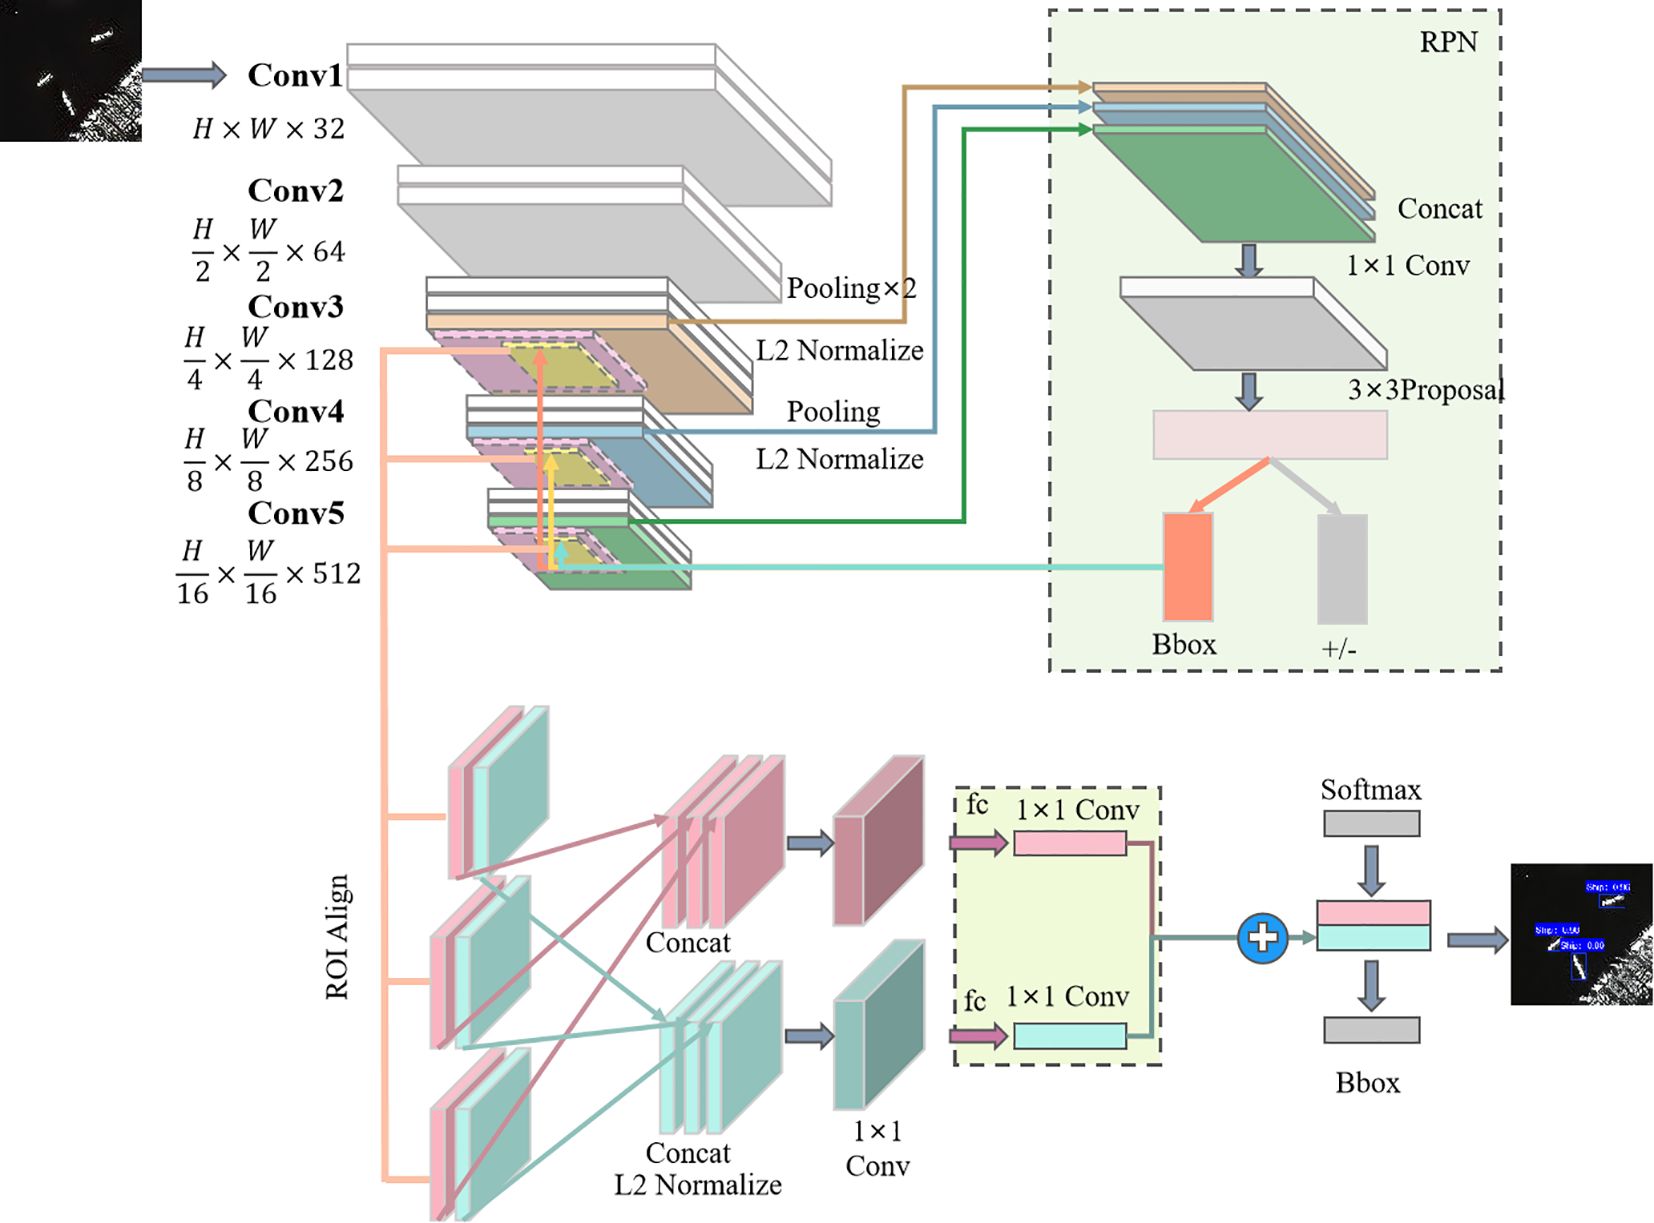
Figure 2. HMS-MRCNN network architecture.
2.2.1 Feature extraction module
In the feature extraction module, the SAR images are fed into the network, and the features are first extracted by a backbone network consisting of five convolutional layers that capture the multi-scale features of the ship. Conv1 and Conv2 are feature preprocessing modules in the initial stage of the model. They are mainly used for preliminary feature encoding and spatial downsampling of the input SAR images, helping the model to extract clearer local structural information from the original images. The two middle layers are shallow convolution layers (Conv3–Conv4), which mainly capture the local structural information of small-scale ships. The last layer is a deep convolution layer (Conv5) used to obtain high-level semantic features and contextual relationships of the image. The output feature maps of Conv3 and Conv4 are subjected to 2 × 2 maximum pooling operations to reduce their spatial size so that they maintain the same spatial resolution as the large-scale ship feature maps (such as the feature maps of Conv5). In order to eliminate the numerical differences between feature maps of different layers, the spliced feature maps need to be L2-normalized to ensure that the numerical range of each feature is consistent.
The pooled small-scale feature map, together with the deep feature map (Conv5 output), is input into RoI Align for further processing.
2.2.2 Regional recommended networks—RPNs
The feature maps extracted by the convolutional layers are fed into the RPN, where the small ship feature maps are sequentially passed through cascading convolutional layers of sizes 1 and 3 to ensure that the feature maps can be matched with the output features of the backbone network. The RPN recognizes the ship features of the SAR image for bounding box regression and generates a set of RoI that are considered as possible ship locations, which include the ship regions in the SAR image of the SAR image for the bounding box regression values. In addition, the RPN needs to determine whether each RoI contains a ship and the precise location of the ship.
RPN uses a 3 × 3 convolutional filter to scan the entire feature map. At each ship location in the feature map, RPN generates multiple anchor boxes with different aspect ratios, which are used to capture ship targets of different sizes and shapes. After generating the anchor boxes, RPN performs two steps: target discrimination and bounding box regression. In the target discrimination task, RPN determines whether the anchor box contains a ship target or not and applies a binary classification method to marine ship detection, i.e., whether the anchor box contains a ship or not, and scores it. RPN performs an accurate bounding box regression task (Bbox) on the anchor boxes that are judged to be ships, adjusting the sizes and shapes of the boxes to better fit the ship targets.
2.2.3 Forecasting module
The low-level feature map and the output results of the five-layer convolution are fused through RoI Align. RoI Align first divides each RoI into a fixed number of sub-regions. In each sub-region, RoI Align uses bilinear interpolation to extract image features. These feature blocks are spliced together to form a unified feature map. On this basis, L2 normalization is performed to ensure that the features between different RoI are numerically consistent. The spliced and normalized feature maps are further processed through a 1 × 1 convolution layer. The processed feature maps will be used for target classification (Softmax) and bounding box regression (Bbox) tasks. The classification task is responsible for determining whether each RoI contains a target, and the bounding box regression further accurately adjusts the position of the candidate box to ensure that the final output bounding box is more accurate.
2.3 Loss function
2.3.1 Super-resolution reconstruction loss function
The generated network loss function can be divided into three parts: the traditional pixel-by-pixel difference MSE-based loss , the content-aware loss , and the adversarial loss based on the VGG (Mateen et al., 2018) network.
Define the low-resolution image as , the corresponding high-resolution image as , and the super-resolution reconstructed image as ; the super-resolution magnification is , and W×H and are used to denote the size of the and images, respectively, while G denotes the super-resolution reconstruction process of the generator, and D denotes the authenticity process of the discriminator.
The formula for the MSE pixel loss is Equation 7:
The formula for perceived loss is Equation 8:
where denotes the feature mapping map between the i-th largest pooling layer and the j-th convolutional layer in the VGG model, and (i,j) is the corresponding feature map dimension. and denote the dimensions of the current layers of the VGG19 network, respectively.
Against loss The formula is Equation 9:
Because GAN needs to play a game between the generative network and the adversarial network in training, the reconstruction results are prone to the “artifacts” phenomenon because of the poor stability of its network training and the difficulty of convergence of the model. To address the abovementioned problems, this paper combines the reconstruction quality evaluation index Structural Similarity Index (SSIM) to introduce the structural loss function , whose formula is Equation 10:
where is the structural similarity between the i-th batch of reconstructed super-resolution image of the generative network and the reference high-resolution image .
Therefore, the loss function of TaylorGAN is Equation 11:
, , and represent the weights of adversarial loss, pixel-level loss, and structural similarity loss, respectively.
2.3.2 Marine ship detection loss function
The marine ship detection loss function is Equation 12:
where and denote the classifier loss and the bounding box regression loss, respectively, and is the weight parameter. The focal loss function is used for the classification loss, and the formula is Equation 13:
is used to control the weights of easily categorized samples, and is used to solve the problem of category imbalance.
For the bounding box regression loss function, we use the CIoU (complete intersection over union) loss function. CIoU is an extension of IOU, which takes the center offset of the bounding box as well as the aspect ratio into account, and it is suitable for high-precision marine ship detection with Equation 14:
where IoU is used to compute the intersection and concurrency ratio between the prediction frame and the real frame , is the Euclidean distance between the prediction frame and the center point of the real frame, is the length of the diagonal of the smallest outer rectangle, denotes the consistency of the aspect ratio, and , and are used to regulate the hyperparameters of the loss.
3 Experimental results
This section first introduces the SAR image dataset used in this study, then describes the evaluation indicators used in the experiment, and finally gives a comprehensive analysis of the experimental results.
3.1 Datasets
The SSDD dataset (SAR Ship Detection Dataset) was originally proposed by Li et al. (2017) and contains 1,160 SAR image slices, each with a resolution of 500 × 500 pixels. The dataset uses data from multiple satellite sources such as Sentinel-1, TerraSAR-X, and RadarSat-2. In order to improve the computational efficiency, these image slices are resized to 256 × 256 pixels. The selected data is divided into three subsets: training set (70%), validation set (10%), and test set (20%).
The SAR-Ship dataset (Wang et al., 2019) contains 102 images from China’s Gaofen-3 satellite and 108 images from Sentinel-1. The dataset contains 43,819 ship slices, each with a resolution of 256 × 256 pixels. This paper selects 3,000 data slices for super-resolution and target detection experiments and divides these slices into three subsets: training set (70%), validation set (10%), and test set (20%).
3.2 Evaluation metrics
In the super-resolution experiment, this paper uses peak signal-to-noise ratio (PSNR), structural similarity index (SSIM), and MSE to evaluate the experimental effect of super-resolution reconstruction. This paper takes the original image of each dataset as a high-resolution image and obtains the corresponding low-resolution image through bicubic interpolation.
PSNR is defined by MSE, which is calculated as shown in Equation 15:
and are high-resolution SAR images and super-resolution SAR images, respectively, both of which have the dimensions .
The formula for PSNR is Equation 16:
SSIM is based on three evaluation metrics: brightness, contrast, and structure, with Equations 17–20:
, , are used to adjust the brightness, contrast, and structure of the weight look; when it is 1, SSIM can be simplified as shown in Equation 21:
where and denote the means, and denote the variances. denotes the covariance between x and y, and and are used to ensure the stability of SSIM.
In marine ship detection experiments, this paper uses accuracy, recall, and mean average precision mean (mAP) as evaluation metrics. Recall is defined as shown in Equation 22:
TP is true positives, which denotes the number of correct positive samples, and FN is false negatives, which denotes the number of incorrect negative samples. Recall is used to measure the detection model’s rate of checking completeness. Precision is defined as shown in Equation 23:
FP stands for false positives and denotes the number of false positive samples. Precision is used to measure the model’s checking accuracy, which is related to the false alarm probability Pf. mAP is defined as shown in Equation 24:
denotes recall, P denotes precision, and denotes the precision–recall curve (P–R curve). The computational process of mAP is essentially to find the area under the PRC curve. Because mAP considers both recall and precision, it has been chosen as the sole core measure of detection accuracy.
3.3 Experimental details
In this paper, NVIDIA GTX 4090 GPU is used to train the network model. The training process parameters for the super-resolution reconstruction experiments are set as follows: the initial learning rate is 2e-4, and the learning rate decays by half after 50 iterations. The optimizer is Adam, the batch size is 8, and the total number of epochs is 100. The training process parameters for the marine ship detection experiment are set as follows: the initial learning rate is 0.01, and the final learning rate is reduced to 1e-3. The input image size is 256×256, the optimizer is Adam, and the batch size is 8, with 150 iterations. The software applications used included Pytorch version 1.12.0 with CUDA 12.4 and Python 3.9.
3.4 Experimental results of super-resolution reconstruction of SAR images
In order to evaluate the excellent performance of TaylorGAN in the super-resolution reconstruction of SAR images, we compare it with other super-resolution reconstruction models, and the results of the comparison are analyzed by evaluating the metrics and visual effects. The comparison methods include bicubic, SRCNN, SRGAN, LSRGAN, and cycle-GAN.
3.4.1 Quantitative results
As shown in Table 1, the performance of six super-resolution methods is evaluated across two SAR datasets, SSDD and Ship-SAR, under an amplification factor of 4. The results indicate that TaylorGAN achieves consistent improvements across all evaluation metrics, outperforming both GAN-based and non-GAN-based baselines.
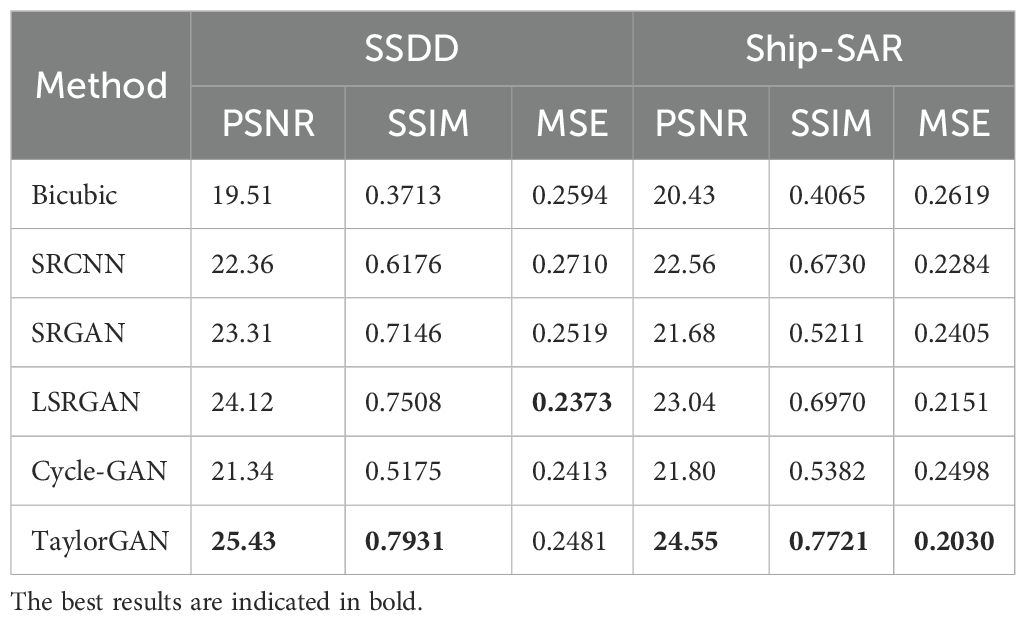
Table 1. Comparison of the metrics of different methods at an amplification factor of 4.
On the SSDD dataset, TaylorGAN attains the highest PSNR (25.43 dB) and SSIM (0.7931), alongside the lowest MSE (0.2481). Among GAN-based models, it surpasses LSRGAN—the second best performer—by 1.31 dB in PSNR, 0.0423 in SSIM, and a 0.0102 reduction in MSE. Compared to Cycle-GAN, TaylorGAN shows more pronounced enhancements, with a 4.09-dB gain in PSNR, 0.2766 in SSIM, and 0.0072 lower MSE. Notably, when benchmarked against non-GAN approaches such as SRCNN, TaylorGAN yields an increase of 3.07 dB in PSNR, 0.1765 in SSIM, and 0.0229 decrease in MSE, reflecting its superior capability in structure preservation and noise suppression.
On the Ship-SAR dataset, similar trends are observed. TaylorGAN has a PSNR of 24.55 dB, a SSIM of 0.7721, and an MSE of 0.2030, outperforming other methods in all indicators. Compared with GAN-based models, TaylorGAN surpasses LSRGAN by 1.51 dB, 0.0754, and 0.0121 in PSNR, SSIM, and MSE, respectively. In addition, compared with Cycle-GAN, TaylorGAN improves by 2.75 dB, 0.2339, and 0.0468 in the three indicators, respectively. Compared with the non-GAN baseline SRCNN, its improvement is also very significant, with a PSNR increase of 2.00 dB, a SSIM increase of 0.0991, and an MSE reduction of 0.0254.
3.4.2 Qualitative results
Figures 3 and 4 qualitatively compare the super-resolution reconstruction results on the SSDD and SAR-Ship datasets, respectively. These figures show the visual effects of different models on improving the resolution of SAR images. As shown in the figure, TaylorGAN is able to consistently generate images with clearer textures and higher visual fidelity than other methods. In particular, TaylorGAN is able to effectively recover the structural details of the ship and suppress background noise, showing its advantage in recovering fine-grained features. In contrast, non-GAN-based models such as bicubic interpolation and SRCNN produce significantly blurred results. Although SRCNN was originally proposed for the super-resolution reconstruction of natural images, it does not generalize well on SAR data due to its simple structure and limited ability to model high-frequency components. GAN-based models, such as SRGAN, LSRGAN, and cycle-GAN, provide better performance than non-GAN baselines by generating clearer contours and richer textures. However, these methods often suffer from artifacts or excessive noise. Overall, the visual results in Figures 3 and 4 demonstrate the superior perceptual quality of TaylorGAN across different SAR image scenarios, further confirming its effectiveness in high-fidelity SAR image reconstruction tasks.
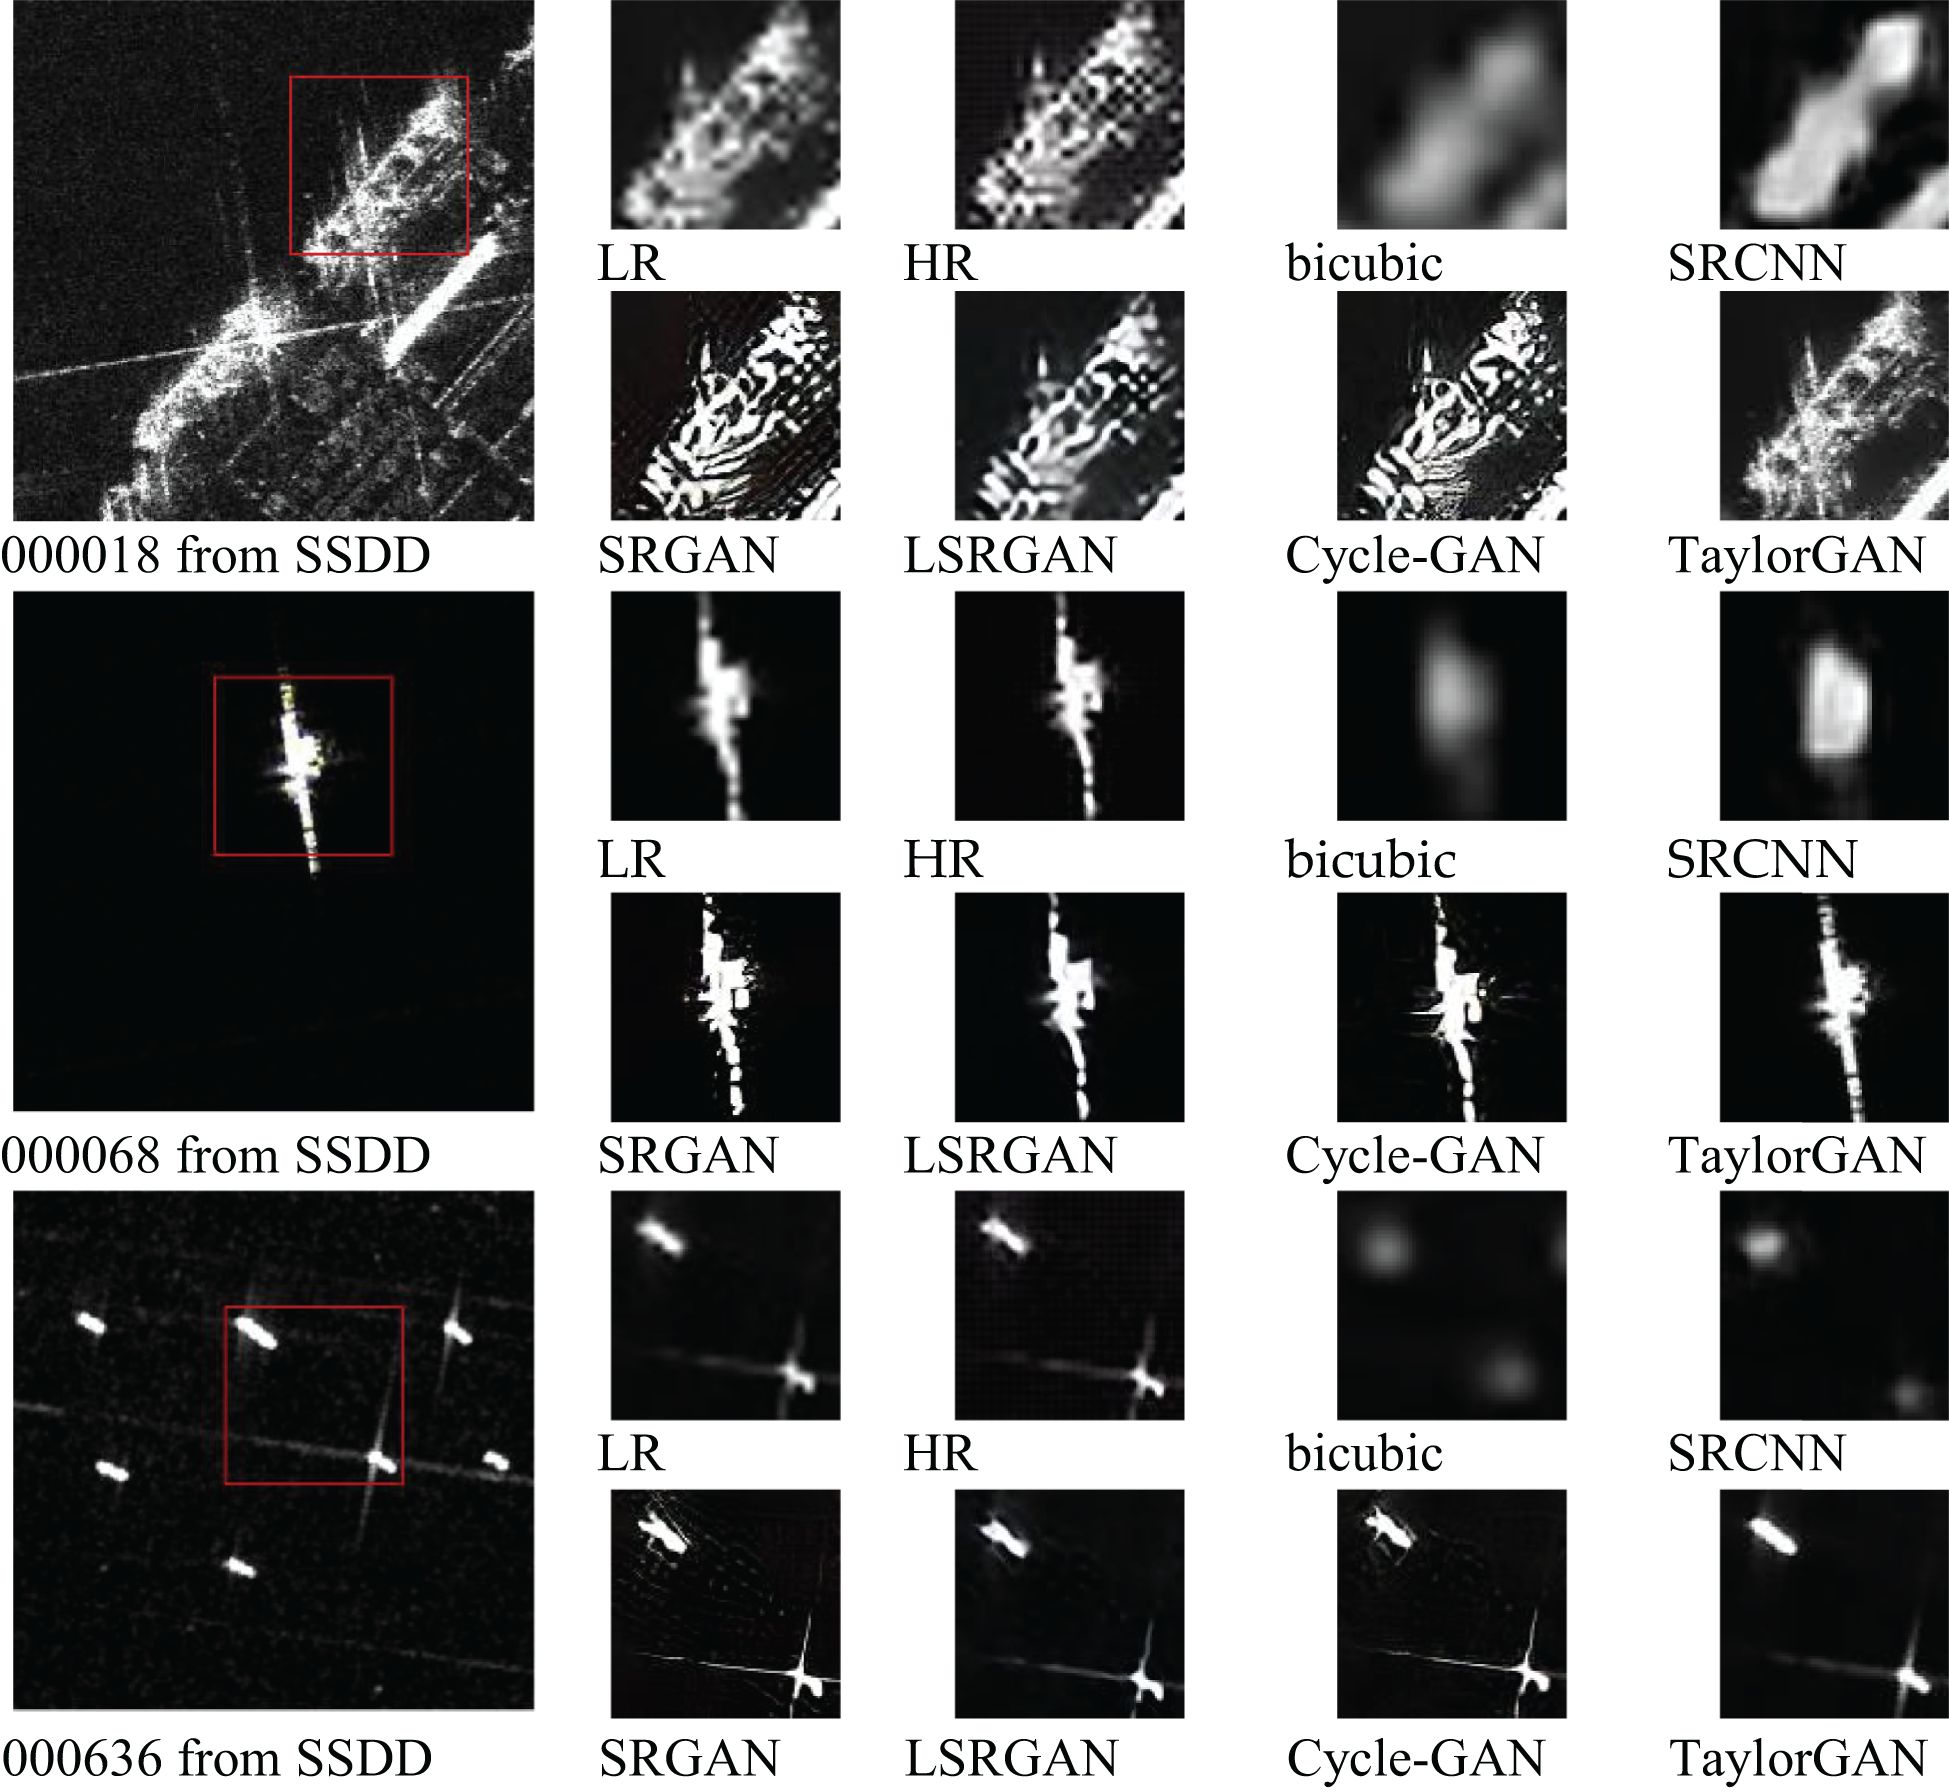
Figure 3. Comparison results of the super-resolution reconstruction of the SSDD dataset.
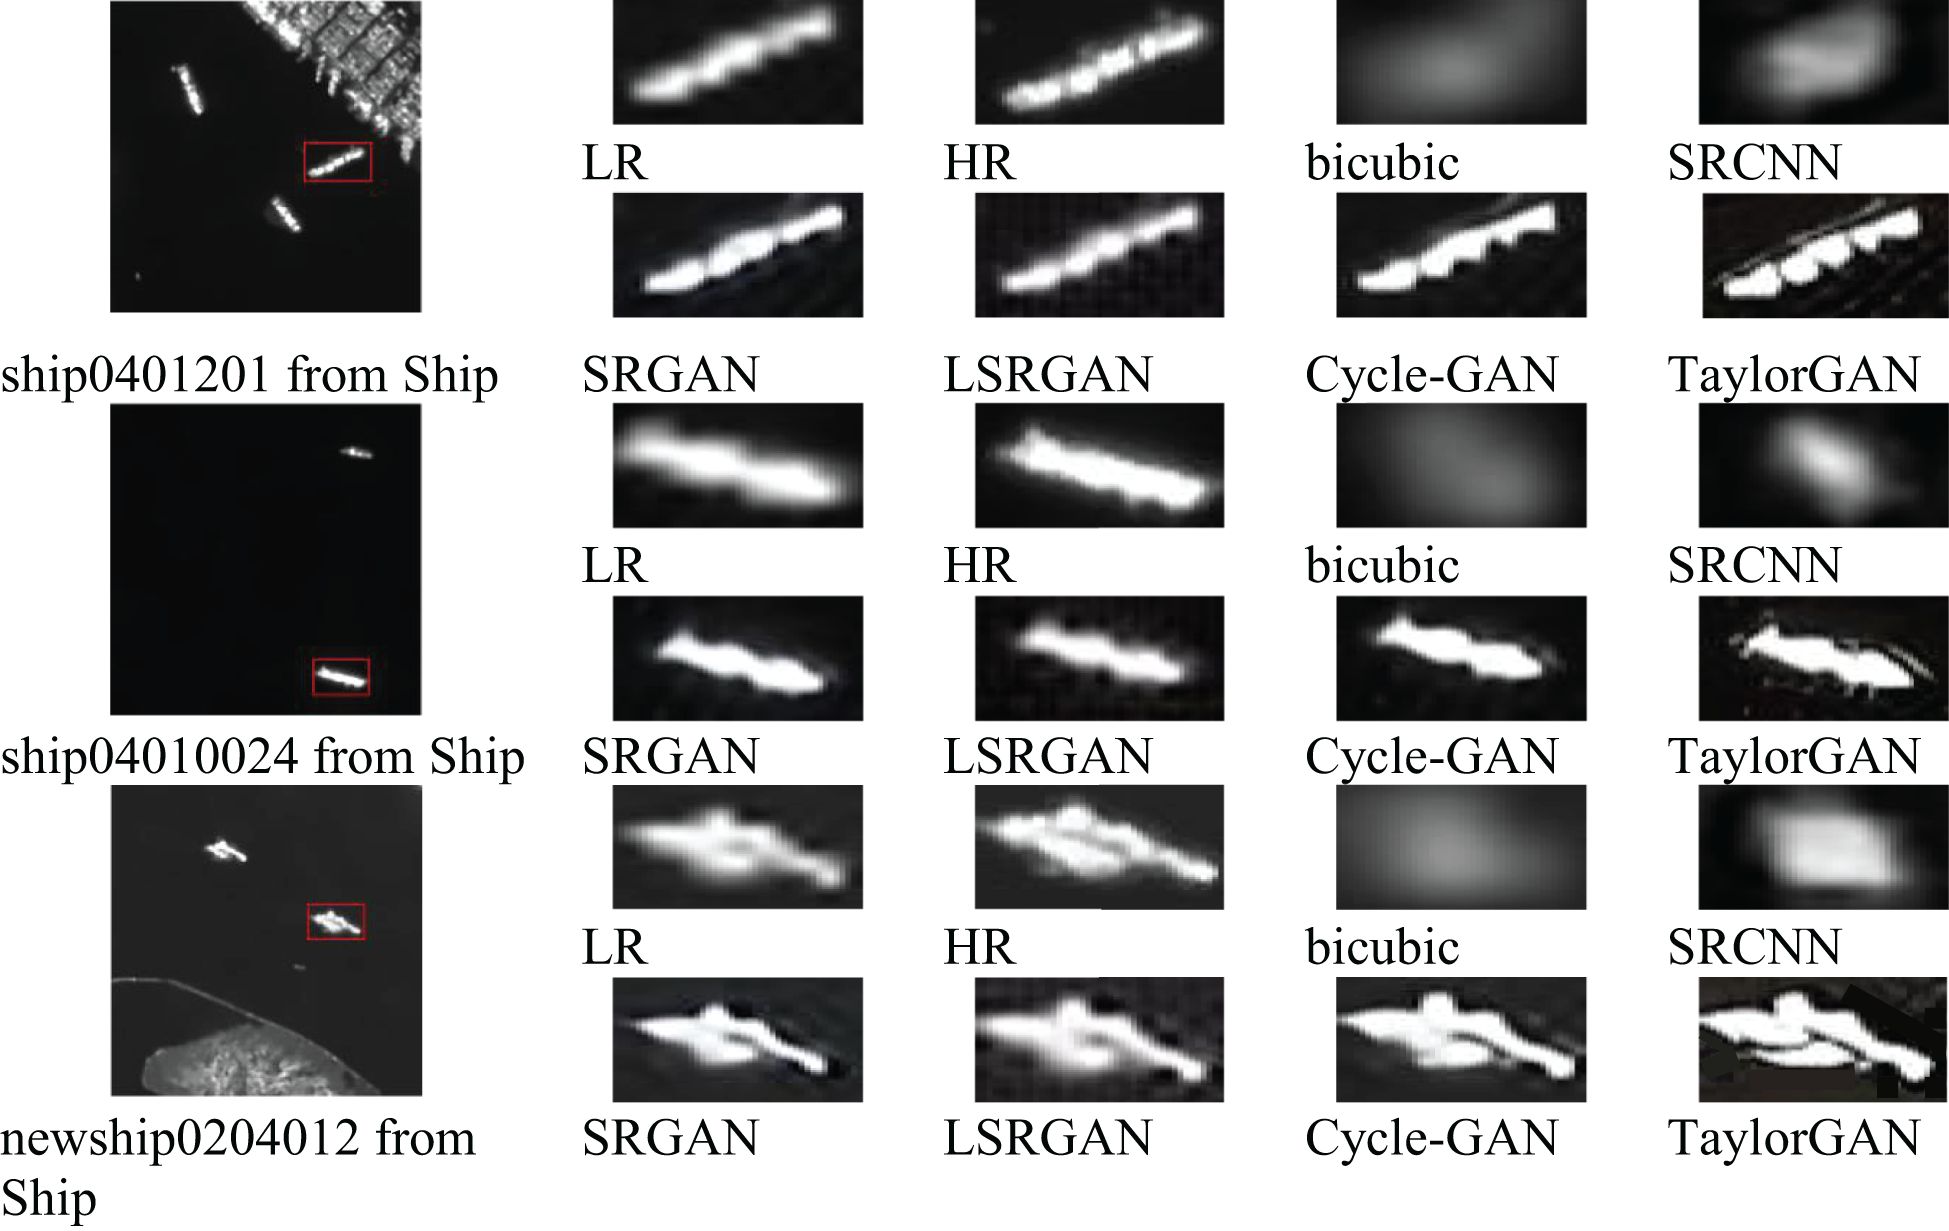
Figure 4. Comparison results of the super-resolution reconstruction of the SAR-Ship dataset.
3.5 Experimental results of marine ship detection for SAR images
To verify the effectiveness of the proposed HMS-MRCNN method, this paper compares it with several representative object detection algorithms, including YOLO v8, Quad-FPN (Zhang et al., 2021), Faster R-CNN, Cascade R-CNN, and Grid R-CNN. In addition, this paper also tests high-resolution images without super-resolution reconstruction methods to evaluate the contribution of SR methods.
3.5.1 Quantitative results
Table 2 presents the quantitative comparison of the proposed HMS-MRCNN framework against several object detection models on the SSDD and Ship-SAR datasets. The evaluation metrics include precision, recall, and mAP50, which comprehensively reflect the accuracy and robustness of each method.
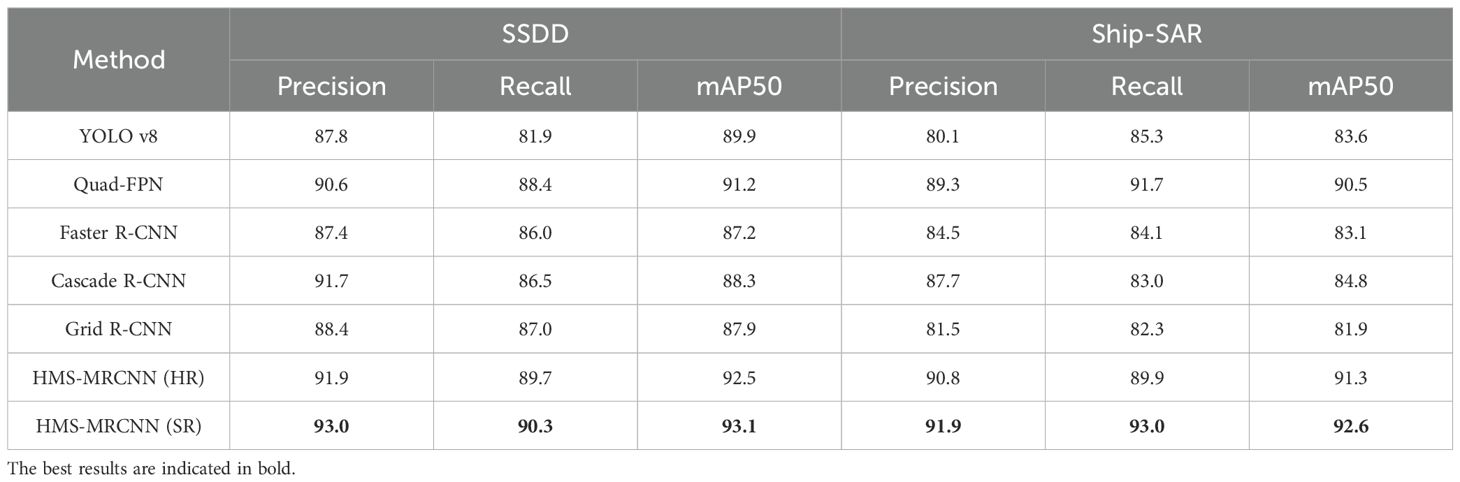
Table 2. Comparative experimental results.
On the SSDD dataset, the proposed HMS-MRCNN (SR) achieves the highest performance in all metrics, with accuracy of 93.0%, recall of 90.3%, and mAP50 of 93.1%. These values exceed those of the high-resolution input version (HMS-MRCNN (HR)) as well as other traditional detectors. Notably, the mAP50 of HMS-MRCNN (SR) is improved by 1.9% compared to Quad-FPN, demonstrating the effectiveness of integrated super-resolution reconstruction in enhancing detection results.
On the Ship-SAR dataset, the proposed method maintains its leading position, achieving an accuracy level of 91.9%, recall of 93.0%, and mAP50 of 92.6%. This performance exceeds that of Quad-FPN and other classic detectors.
Overall, the experimental results verify that the proposed HMS-MRCNN (SR) not only improves the average detection accuracy but also enhances its stability at different scales and scene complexity, making it very suitable for practical SAR-based ship detection tasks.
3.5.2 Qualitative results
Figures 5 and 6 qualitatively compare the detection results of different target detection algorithms on the SSDD and SAR-Ship datasets. The methods include YOLO v8, Quad-FPN (Zhang et al., 2021), Faster R-CNN, Cascade R-CNN, Grid R-CNN, and HMS-MRCNN. Red circles indicate missed detections, and yellow circles indicate incorrectly detected target objects.
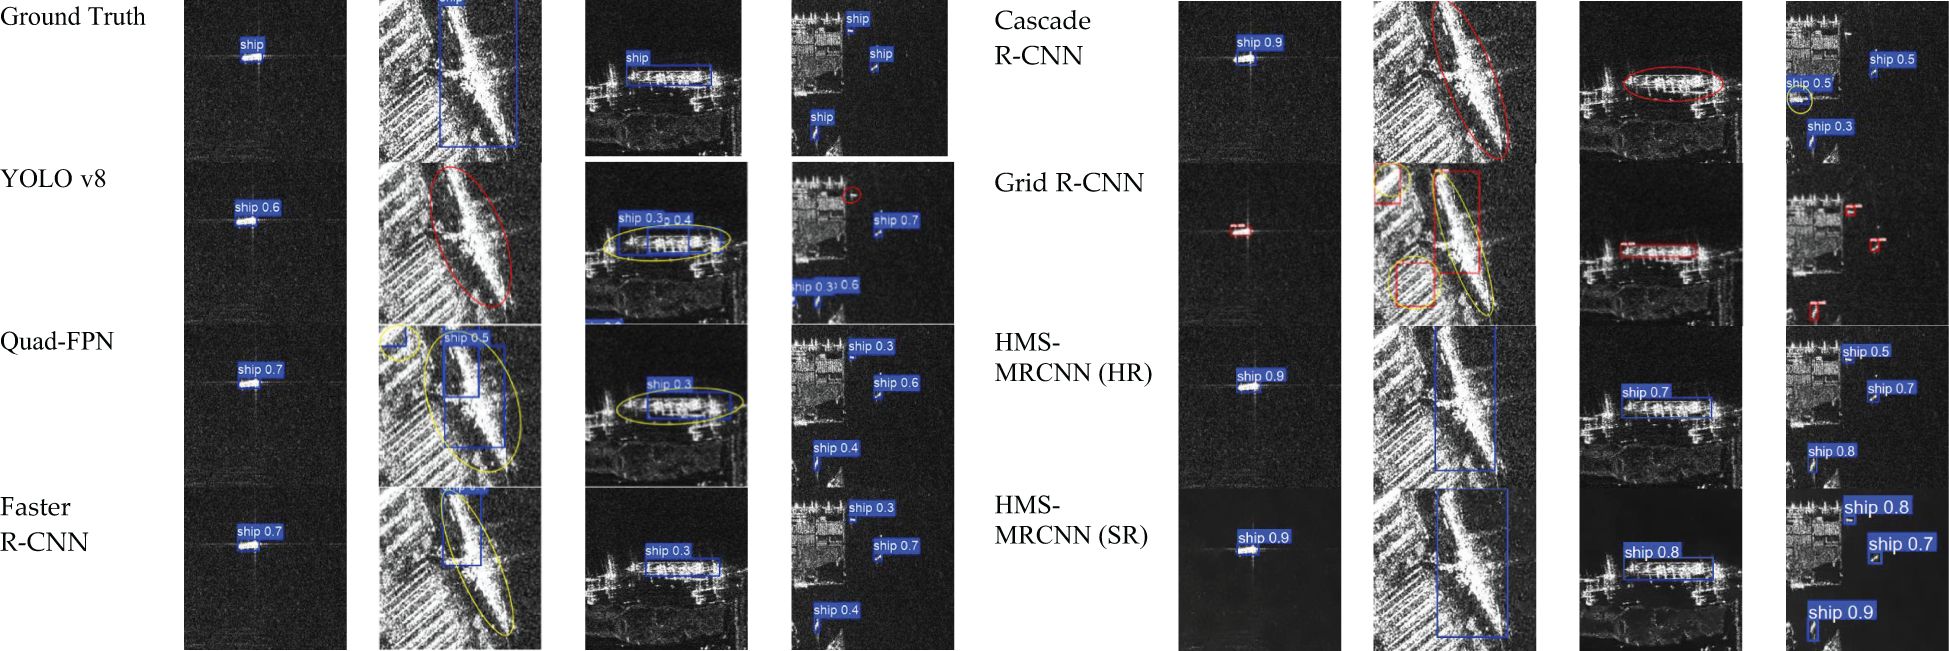
Figure 5. Comparison of the detection results of each model for the SSDD dataset.
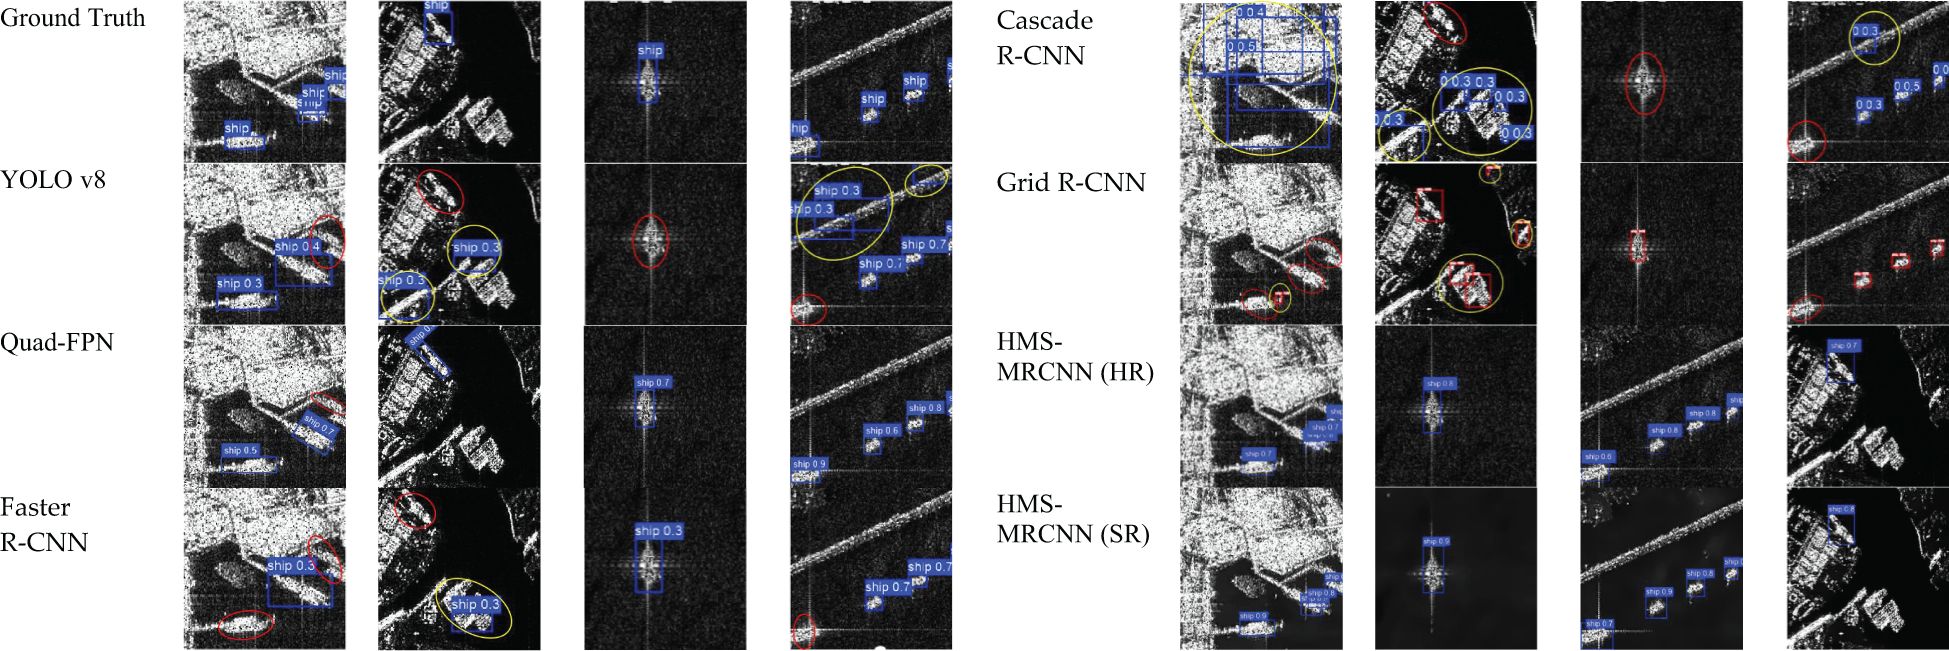
Figure 6. Comparison of the detection results of each model for the SAR-Ship dataset.
As can be seen from the figure, YOLO v8 and Faster R-CNN are prone to more false positives or missed detections, especially when detecting small or low-contrast ships. Quad-FPN shows higher positioning accuracy and recall rate than traditional models, but it occasionally produces false detections in complex near-shore scenes or cluttered wave backgrounds. Cascade R-CNN and Grid R-CNN also have more missed detections and false detections.
In contrast, HMS-MRCNN, proposed in this paper, shows obvious advantages in detection results. In particular, after using TaylorGAN to reconstruct the image for super-resolution, HMS-MRCNN can better detect the target ship.
3.6 Ablation experiments
To evaluate the contribution of key structural components in the proposed TaylorGAN, this paper conducts ablation experiments focusing on two core modules: the TaylorShift Attention (TSA) module and the feature fusion (FF) module. The TSA module is designed to enhance the network’s global and local modeling capability through a position-aware attention mechanism, while the FF module facilitates the integration of multi-scale features to recover high-frequency structures such as ship contours and edges.
As shown in Table 3, this paper begins with a baseline configuration that excludes both TSA and FF modules. This version achieves relatively low performance (20.89 dB PSNR and 0.5852 SSIM on SSDD), indicating its limited capability in recovering structural and fine-grained details. Introducing the TSA module alone yields a noticeable improvement, increasing PSNR by 1.51 dB and SSIM by 0.0177 on SSDD. This again demonstrates the effectiveness of TaylorShift attention in enhancing feature representation, even without structural fusion.
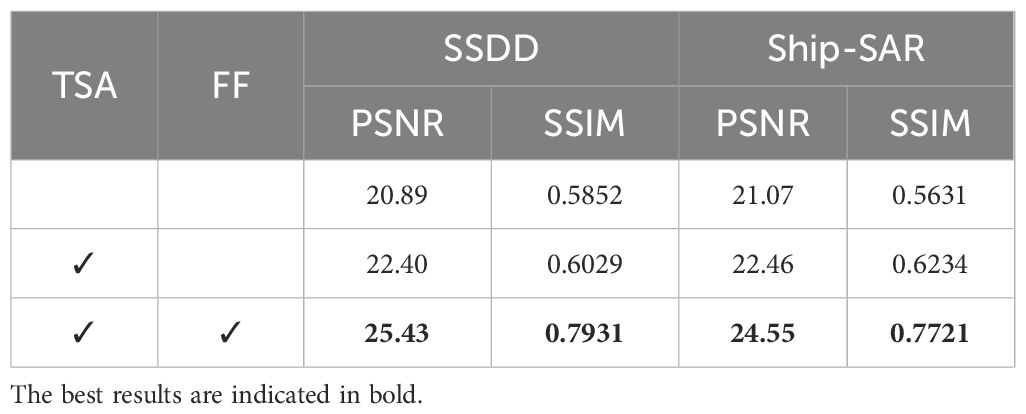
Table 3. Ablation experiment results of different blocks of TaylorGAN.
When both modules are integrated, the model achieves its highest performance, with 25.43 dB PSNR and 0.7931 SSIM on SSDD and 24.55 dB PSNR and 0.7721 SSIM on Ship-SAR. This final configuration outperforms all ablated variants, confirming that the combination of attention-based modeling and feature fusion significantly improves image quality, especially in restoring high-frequency textures under complex SAR imaging conditions.
To evaluate the contribution of each module to detection performance, this paper conducts a controlled ablation study analyzing the impact of the DCR (feature imitation) and DCN (deformable convolution) modules within the HMS-MRCNN framework. The DCR module enhances semantic-level feature representation, while the DCN module improves spatial adaptability. The performance metrics of each module configuration are detailed in Table 4.
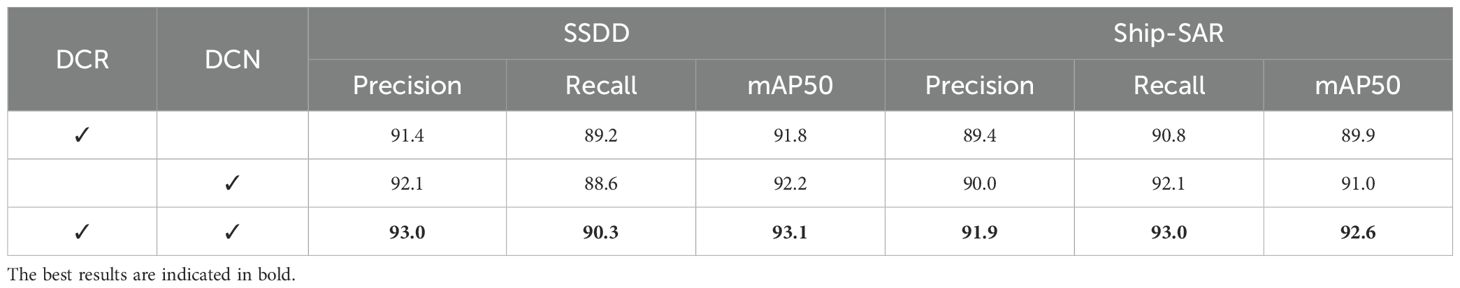
Table 4. Ablation experiment results of different blocks of HMS-MRCNN.
As shown in Table 4, the DCR module alone yields notable improvements in recall, while the DCN module contributes more to precision and localization. However, the combination of DCR and DCN achieves higher overall performance than either module individually, demonstrating their complementary strengths. The full model, integrating both modules, significantly enhances detection accuracy on both SSDD and Ship-SAR datasets.
These results indicate that fusing semantic feature imitation with spatially adaptive convolution can effectively enhance network robustness and accuracy under complex SAR imaging conditions.
4 Conclusion
Given the challenges of low resolution of SAR images and the susceptibility of marine ship detection to noise and multi-scale target interference, this paper proposes a “super-resolution reconstruction-multi-scale detection” collaborative optimization solution. The main contributions are as follows:
TaylorGAN super-resolution network: It aims to recover high-frequency detail information from low-resolution SAR images. The method works by feeding the low-resolution image into the generator taking the corresponding high-resolution image as the target of discriminator learning and continuously optimizing the generator through adversarial training so that its output image is closer to the real high-resolution image in terms of structural clarity and detail restoration. In order to enhance the detail modeling ability, TaylorGAN introduces the TaylorShift attention mechanism, replacing the traditional Softmax operation with Taylor series expansion, which improves the ability to recover high-frequency details (e.g., ship contours, deck structures). Experiments prove that TaylorGAN significantly outperforms mainstream models such as SRGAN and cycle-GAN in terms of PSNR, SSIM, and subjective visual quality.
HMS-MRCNN multi-scale detection framework: HMS-MRCNN is designed for marine ship detection, extracting small target details from shallow layers (Conv3-4) and capturing global semantic context from deep layers (Conv5). Through feature map downsampling and L2 normalization, the model achieves accurate cross-scale feature alignment. Experiments show that HMS-MRCNN (SR) achieves 93.1% mAP50 accuracy on SSDD and 92.6% mAP50 accuracy on Ship-SAR, outperforming traditional detectors such as Faster R-CNN and Grid R-CNN.
End-to-end performance verification: The combination of super-resolution reconstruction and marine ship detection improves the mAP50 of ship image detection by 0.6% and 1.3% on the SSDD and Ship-SAR datasets, indicating that the resolution improvement directly improves the performance of downstream tasks.
Data availability statement
The datasets SSDD and SAR-Ship for this study can be found in the https://github.com/TianwenZhang0825/Official-SSDD/blob/main/README.md and https://radars.ac.cn/web/data/getData?dataType=SDD-SAR.
Author contributions
JF: Funding acquisition, Writing – review & editing. MG: Methodology, Visualization, Writing – original draft. LZ: Data curation, Software, Writing – original draft. JL: Supervision, Validation, Writing – review & editing. YL: Methodology, Writing – original draft.
Funding
The author(s) declare that financial support was received for the research and/or publication of this article. This work was supported by Shandong Provincial Natural Science Foundation of China under Grant ZR2018MF009, the State Key Research Development Program of China under Grant 2017YFC0804406, National Natural Science Foundation of China under Grant 42472324, the Special Funds of Taishan Scholars Construction Project, and the foundation of Key Laboratory of Mining Disaster Prevention and Control (Shandong University of Science and Technology).
Acknowledgments
The authors would like to thank the editors and reviewers for their valuable comments and suggestions.
Conflict of interest
The authors declare that the research was conducted in the absence of any commercial or financial relationships that could be construed as a potential conflict of interest.
Generative AI statement
The author(s) declare that no Generative AI was used in the creation of this manuscript.
Publisher’s note
All claims expressed in this article are solely those of the authors and do not necessarily represent those of their affiliated organizations, or those of the publisher, the editors and the reviewers. Any product that may be evaluated in this article, or claim that may be made by its manufacturer, is not guaranteed or endorsed by the publisher.
References
Baldygo W., Brown R., Wicks M., Antonik P., Capraro G., and Hennington L. (1993). “Artificial intelligence applications to constant false alarm rate (CFAR) processing,” in The record of the 1993 IEEE national radar conference (United States: IEEE), 275–280.
Blu T., Thévenaz P., and Unser M. (2004). Linear interpolation revitalized. IEEE Trans. Image Process. 13, 710–719. doi: 10.1109/tip.2004.826093
Cai Z. and Vasconcelos N. (2018). “Cascade r-cnn: Delving into high quality object detection,” in Proceedings of the IEEE conference on computer vision and pattern recognition, (United States: IEEE Press) 6154–6162.
Cao Q., Chen H., Wang S., Wang Y., Fu H., Chen Z., et al. (2024). LH-YOLO: A lightweight and high-precision SAR ship detection model based on the improved YOLOv8n. Remote Sensing 16, 4340. doi: 10.3390/rs16224340
Chang H., Yeung D.-Y., and Xiong Y. (2004). “Super-resolution through neighbor embedding,” in Proceedings of the 2004 IEEE computer society conference on computer vision and pattern recognition 2004. CVPR 2004 (United States: IEEE), I–I.
Dong C., Loy C. C., He K., and Tang X. (2014). “Learning a deep convolutional network for image super-resolution,” in Computer vision–ECCV 2014: 13th european conference (Springer, Zurich, Switzerland), 184–199. Proceedings, Part IV 13.
Freeman W. T., Jones T. R., and Pasztor E. C. (2002). Example-based super-resolution. IEEE Comput. Graphics Appl. 22, 56–65. doi: 10.1109/38.988747
Gao G., Chen Y., Feng Z., Zhang C., Duan D., Li H., et al. (2024). R-LRBPNet: A lightweight SAR image oriented ship detection and classification method. Remote Sensing 16, 1533. doi: 10.3390/rs16091533
Girshick R., Donahue J., Darrell T., and Malik J. (2014). “Rich feature hierarchies for accurate object detection and semantic segmentation,” in Proceedings of the IEEE conference on computer vision and pattern recognition, (United States: IEEE Press) 580–587.
Gu F., Zhang H., Wang C., and Wu F. (2019). “SAR image super-resolution based on noise-free generative adversarial network,” in IGARSS 2019–2019 IEEE international geoscience and remote sensing symposium (Yokohama, Japan: IEEE), 2575–2578.
Irani M. and Peleg S. (1991). Improving resolution by image registration. CVGIP: Graphical Models Image Process. 53, 231–239. doi: 10.1016/1049-9652(91)90045-l
Jiang N., Zhao W., Wang H., Luo H., Chen Z., and Zhu J. J. R. S. (2024). Lightweight super-resolution generative adversarial network for SAR images. Remote Sensing 16, 1788. doi: 10.3390/rs16101788
Ledig C., Theis L., Huszár F., Caballero J., Cunningham A., Acosta A., et al. (2017). “Photo-realistic single image super-resolution using a generative adversarial network,” in Proceedings of the IEEE conference on computer vision and pattern recognition, (United States: IEEE Press) 4681–4690.
Li J., Qu C., and Shao J. (2017). “Ship detection in SAR images based on an improved faster R-CNN,” in 2017 SAR in big data era: models, methods and applications (BIGSARDATA) (United States: IEEE), 1–6.
Li X., Chen P., Yang J., An W., Zheng G., Luo D., et al. (2023). TKP-net: A three keypoint detection network for ships using SAR imagery. doi: 10.1109/JSTARS.2023.3329252
Liu C. and Sun D. (2013). On Bayesian adaptive video super resolution. 14th European Conference Comput. Vision. 36, 364–376. doi: 10.1109/TPAMI.2013.127
Lu X., Li B., Yue Y., Li Q., and Yan J. (2019). “Grid r-cnn,” in Proceedings of the IEEE/CVF conference on computer vision and pattern recognition, 7363–7372.
Mateen M., Wen J., Nasrullah, Song S., and Huang Z. (2018). Fundus image classification using VGG-19 architecture with PCA and SVD. Symmetry 11, 1. doi: 10.3390/sym11010001
Meng F., Qi X., and Fan H. (2024). LSR-det: A lightweight detector for ship detection in SAR images based on oriented bounding box. Remote Sensing 16, 3251. doi: 10.3390/rs16173251
Nauen T. C., Palacio S., and Dengel A. (2025). “Taylorshift: Shifting the complexity of self-attention from squared to linear (and back) using taylor-softmax,” in International conference on pattern recognition (Cham, Switzerland: Springer), 1–16.
Redmon J. (2016). “You only look once: Unified, real-time object detection,” in Proceedings of the IEEE conference on computer vision and pattern recognition. (United States: IEEE Press)
Ren S. (2015). Faster r-cnn: Towards real-time object detection with region proposal networks. IEEE Transactions on Pattern Analysis and Machine Intelligence. 39:1137–1149. doi: 10.1109/TPAMI.2016.2577031
Shen H., Lin L., Li J., Yuan Q., and Zhao L. (2020). A residual convolutional neural network for polarimetric SAR image super-resolution. ISPRS J. Photogrammetry Remote Sens. 161, 90–108. doi: 10.1016/j.isprsjprs.2020.01.006
Smith J. W., Alimam Y., Vedula G., and Torlak M. (2022). “A vision transformer approach for efficient near-field SAR super-resolution under array perturbation,” in 2022 IEEE texas symposium on wireless and microwave circuits and systems (WMCS) (United States: IEEE), 1–6.
Su L., Sun Y., and Yuan S. (2022). A survey of instance segmentation research based on deep learning. CAAI Trans. Intell. Syst. 17, 16–31. doi: 10.11992/tis.202109043
Sun Z., Dai M., Leng X., Lei Y., Xiong B., Ji K., et al. (2021). An anchor-free detection method for ship targets in high-resolution SAR images. IEEE J. Sel. Top. Appl. Earth Obs. Remote Sens. 14, 7799–7816. doi: 10.1109/jstars.2021.3099483
Tang J., Cheng J., Xiang D., and Hu C. (2022). Large-difference-scale target detection using a revised Bhattacharyya distance in SAR images. IEEE Geosci. Remote Sens. Lett. 19, 1–5. doi: 10.1109/lgrs.2022.3161931
Tang Y., Zhang Y., Xiao J., Cao Y., and Yu Z. (2024). An enhanced shuffle attention with context decoupling head with wise ioU loss for SAR ship detection. Remote Sensing 16, 4128. doi: 10.3390/rs16224128
Tom B. C. and Katsaggelos A. K. (1996). “Iterative algorithm for improving the resolution of video sequences,” in Visual communications and image processing’96 (United States: SPIE), 1430–1438.
Tong C. and Leung K. (2007). Super-resolution reconstruction based on linear interpolation of wavelet coefficients. Multidimens. Syst. Signal Process.18, 153–171. doi: 10.1007/s11045-007-0023-2
Wang Y., Wang C., Zhang H., Dong Y., and Wei S. (2019). A SAR dataset of ship detection for deep learning under complex backgrounds. IGARSS 2019–2019 IEEE Int. Geosci. Remote Sens. Symposium 11, 765. doi: 10.3390/rs11070765
Wang L., Zheng M., Du W., Wei M., and Li L. (2018). “Super-resolution SAR image reconstruction via generative adversarial network,” in 2018 12th international symposium on antennas, propagation and EM theory (ISAPE) (China: IEEE), 1–4.
Wu F., Hu T., Xia Y., Ma B., Sarwar S., and Zhang C. (2024). WDFA-YOLOX: A wavelet-driven and feature-enhanced attention YOLOX network for ship detection in SAR images. Remote Sensing 16, 1760. doi: 10.3390/rs16101760
Xu Y., Wu Z., Chanussot J., and Wei Z. (2019). Nonlocal patch tensor sparse representation for hyperspectral image super-resolution. IEEE Trans. Image Process. 28, 3034–3047. doi: 10.1109/tip.2019.2893530
Yang F., Yang H., Fu J., Lu H., and Guo B. (2020). “Learning texture transformer network for image super-resolution,” in Proceedings of the IEEE/CVF conference on computer vision and pattern recognition, (United States: IEEE Press) 5791–5800.
Yasir M., Liu S., Pirasteh S., Xu M., Sheng H., Wan J., et al. (2024a). YOLOShipTracker: Tracking ships in SAR images using lightweight YOLOv8. Int. J. Appl. Earth Obs. Geoinf. 134, 104137. doi: 10.1016/j.jag.2024.104137
Yasir M., Shanwei L., Mingming X., Jianhua W., Nazir S., Islam Q. U., et al. (2024b). SwinYOLOv7: Robust ship detection in complex synthetic aperture radar images. Appl. Soft Comput. 160, 111704. doi: 10.1016/j.asoc.2024.111704
Zhang X., Feng S., Zhao C., Sun Z., Zhang S., Ji K., et al. (2024). MGSFA-Net: Multiscale global scattering feature association network for SAR ship target recognition. IEEE J. Sel. Top. Appl. Earth Obs. Remote Sens. 17, 4611–4625. doi: 10.1109/jstars.2024.3357171
Zhang Y., Li K., Li K., Wang L., Zhong B., and Fu Y. (2018). “Image super-resolution using very deep residual channel attention networks,” in Proceedings of the European conference on computer vision (ECCV), (Heidelberg, Germany: Springer-Verlag GmbH) 286–301.
Zhang L., Liu Y., Qu L., Cai J., and Fang J. (2023b). A spatial cross-scale attention network and global average accuracy loss for SAR ship detection. Remote Sensing 15, 350. doi: 10.3390/rs15020350
Zhang C., Zhang Z., Deng Y., Zhang Y., Chong M., Tan Y., et al. (2023a). Blind super-resolution for SAR images with speckle noise based on deep learning probabilistic degradation model and SAR priors. Remote Sensing 15, 330. doi: 10.3390/rs15020330
Keywords: synthetic aperture radar (SAR), super-resolution reconstruction, marine ship detection, multiscale feature fusion, Mask R-CNN, TaylorShift attention mechanism
Citation: Fan J, Guo M, Zhang L, Liu J and Li Y (2025) A marine ship detection method for super-resolution SAR images based on hierarchical multi-scale Mask R-CNN. Front. Mar. Sci. 12:1574991. doi: 10.3389/fmars.2025.1574991
Received: 11 February 2025; Accepted: 27 June 2025;
Published: 29 July 2025.
Edited by:
Muhammad Yasir, China University of Petroleum (East China), ChinaReviewed by:
Yonggang Ji, China University of Petroleum (East China), ChinaXiaoting Sun, Tongji University, China
Fulong Yao, Newcastle University, United Kingdom
Copyright © 2025 Fan, Guo, Zhang, Liu and Li. This is an open-access article distributed under the terms of the Creative Commons Attribution License (CC BY). The use, distribution or reproduction in other forums is permitted, provided the original author(s) and the copyright owner(s) are credited and that the original publication in this journal is cited, in accordance with accepted academic practice. No use, distribution or reproduction is permitted which does not comply with these terms.
*Correspondence: Yang Li, ZHJleWFuZ0AxNjMuY29t