 Zhenlin Liu1,2,3*
 Maosheng Gao2,4*
 Liangqing Wang1Qiming Sun3,5Xinyue Chang6Guohua Hou2,4Mengyao Wang2,4
- 1Faculty of Engineering, China University of Geosciences, Wuhan, Hubei, China
- 2Qingdao Institute of Marine Geology, China Geological Survey, Qingdao, Shandong, China
- 3Chinese Academy of Geological Sciences, Beijing, China
- 4Northern Observation and Research Station of Coastal Salt Marshes, Ministry of Natural Resources, Qingdao, China
- 5Hubei Key Laboratory of Yangtze Catchment Environmental Aquatic Science, School of Environmental Studies, China University of Geosciences, Wuhan, China
- 6No. Eight Geological Brigade, Hebei Geological Prospecting Bureau, Qinhuangdao, China
The muddy coastal region of North Shandong, China, including Laizhou Bay and the Huanghe River (Yellow River) Delta, is a complex depositional environment where land and sea intersect, creating diverse water types and intricate coastal groundwater formation and evolution. This study focuses on the shallow Holocene aquifer (SHA) and the deep Pleistocene aquifer (DPA) groundwater, using hydrogeochemical, isotope analysis and numerical simulation methods to infer the source of water and salt and hydrogeological chemical processes. The results reveal that the groundwater is a mix of seawater, freshwater, and brine, with significant differences in hydrochemical types and isotopic signatures between the SHA and DPA aquifers. The SHA groundwater is dominated by low salinity (TDS ≈ 8 g/L), with the freshwater dominated by Cl-Na and Cl-Na·Mg hydrochemical types. In contrast, the DPA groundwater is characterised primarily by high salinity (TDS ≈ 72 g/L) and the Cl-Na type. δ18O-δ2H deviates from the precipitation line and is close to the seawater evaporation line, indicating stronger seawater intrusion and salt accumulation processes. Interestingly, δ18O and δ2H stable isotopes' relative abundance in the DPA brine samples from the Huanghe River Delta (at a burial depth of ~260 m) and Huanghe River water samples bear a resemblance, suggesting a strong correlation between the river water and the subsurface brine water source in the EPA. The Hydrochemical Facies Evolution Diagram (HFE–Diagram) analysis shows 63.77% of SHA samples underwent desalination, while 79.31% of DPA samples experienced seawater intrusion, this was restricted by structural constraints and rock salt dissolution. This study provides new insights into the hydrogeochemical evolution of coastal aquifers.
Highlights
1. Groundwater in the south coast of Laizhou Bay and the Huanghe River delta area exhibits considerable variability across different layers.
2. There is a strong correlation between the water of the Huanghe River and the underground brine sources in the Early Pleistocene strata.
3. The rates of seawater intrusion of the SHA and Na–Cl were 36.23% and 55.07%, respectively, whereas the rates of seawater intrusion of the DPA were significantly higher than those of the SHA, at 79.31% and 89.66%.
1 Introduction
Coastal groundwater environments, characterized by their fragility and sensitivity, possess limited resistance and self-repair ability against external environmental disturbances, a challenge faced globally (Michael et al., 2013; Jiao and Post, 2019). They also stand as zones of significant interaction between sea and land, under the dual impact of intense human activities and global climate change (He and Silliman, 2019). Similar issues are observed in coastal regions worldwide, such as North Shandong of China, highlighting the global relevance of understanding these environments. Fresh groundwater within China’s eastern coastal, a critical water resource, is affected by sedimentary environments, geological historical incidents, and human activities, instigating constraints on economic development (Foster and Chilton, 2003). This has led to continental groundwater salinization, a major global change event. Its resultant freshwater salinization and brine desalination have emerged as unified concerns within the international community (Cary et al., 2015; Jayathunga et al., 2020; Han and Currell, 2022).
Groundwater’s chemical elements derive from long–term hydrogeochemical interactions between groundwater and geological bodies. The complex muddy coastal contains diverse groundwater types as per total dissolved solids (TDS) contents classifiable into freshwater (<1 g/L), brackish water (1~3 g/L), saline water (3~50 g/L), and brine (≥50 g/L) (China Geological Survey, 2012; Gao et al., 2015). It has been found that the seawater mixture ratio in coastal aquifers spatially and temporally varies, stimulating various hydrogeochemical responses (Kwon et al., 2020). The chemical components and isotopic characteristics within groundwater environments provide an ideal framework for examining water quality’s spatio–temporal evolution. Prior studies typically focused on natural state groundwater environments, identifying their controlling factors before anthropogenic action significantly impacted them (Lambrakis, 2006; Mastrocicco et al., 2021). Recent global attention has been given to seawater intrusion due to sea–level rise triggered by global warming, causing considerable changes to coastal groundwater quality (Werner, 2010; Van Pham et al., 2019; Befus et al., 2020). Groundwater cycling processes are shaped by natural influences like climate change and hydrogeochemistry (Michael et al., 2005; Gonneea et al., 2013; Han et al., 2014; Han and Currell, 2022), along with human activities (Chen et al., 2016; Sun et al., 2023a). Such interplays lead to the evolution or even mutation of groundwater quality. Groundwater exploitation critically impacts the hydrodynamic and hydrochemical properties of groundwater systems (Liu et al., 2015; MacDonald et al., 2016) and introduces considerable uncertainty into groundwater environment evolution (Flaux et al., 2013; Liu et al., 2022). Hence, coastal face common challenges, including aquifer depletion, groundwater quality degradation, and seawater intrusion, regardless of whether they arise from irrational groundwater resource exploitation or natural causes.
The salinization of coastal groundwater by seawater intrusion has been of great interest. And with the application of disciplines such as marine sedimentation, hydrogeochemistry, isotope hydrology and numerical modelling in the study of coastal zone groundwater (Clark and Fritz, 2013; Han et al., 2014; Eissa et al., 2016; Cao et al., 2020). In recent years, coastal subsurface brine research has flourished in many countries (Van Engelen et al., 2018; Hussain et al., 2020; Saeed et al., 2021), and there are conflicting views on its sources and evolutionary processes. On the Mediterranean coast, for instance, brine salinity results predominantly from the evaporative concentration of seawater, influenced by hydrogeochemistry (Sola et al., 2014). Meanwhile, a considerable amount of brine at a depth of 400–600 m in the Nile Delta is attributed to the uplift of deep brine and the evaporative concentration of seawater and surface water (Nofal et al., 2015; Van Engelen et al., 2018; Van Engelen et al., 2019). Frank and Gui (2010) theory of freezing into brine provides an explanation for subsurface brine in Antarctica’s high–latitude cold region of McMurdo Sound. In addition, high–salt wastewater from desalination plants has emerged as a new salinity source for coastal subsurface brine (Jahnke et al., 2019). Groundwater salinization along China’s densely populated Bohai Sea coast necessitates clarification of salinity origin in subsurface saline and brine, invoking a genesis mechanism. This will inform effective prevention and management of groundwater salinization and address related environmental and geological issues in the region.
The Bohai Sea is a semi-enclosed marginal sea located in the north of China (Zhang et al., 2024), and the shallow and deep groundwater in the coastal zone have significant differences in chemical characteristics (Cao et al., 2022). Both geographically and socio-economically, the Shandong Peninsula is an important part of the Bohai Economic Circle, and there are obvious spatial and temporal variations in the distribution of its water resources (Gao et al., 2021). The Bohai Sea coast of China has been severely affected by seawater intrusion, leading to groundwater salinization, water quality degradation and resource depletion (Xue et al., 1997; Han et al., 2014). Since the Pleistocene, these areas have experienced multiple climate fluctuations and sea–level changes. Most of the environmental problems in the coastal areas of northern Shandong originate from groundwater issues and the complex problems they cause (Chen et al., 2021). This paper aims to address two main scientific questions: 1) to investigate how evaporation, mixing, dissolution, filtration and metamorphism control groundwater chemistry under different depositional environments in these coastal regions, using SHA and DPA groundwater in the muddy coastal zone of northern Shandong; and 2) to elucidate the hydrochemical evolution of the Huanghe River delta and the south coast of Laizhou Bay along different groundwater pathways and their aqueous geochemical process similarities and differences.
2 Background of the study area and sample analysis methods
2.1 Sample point collection and distribution
The muddy coastal zone in northern Shandong is a typical chalky-gravelly coastal plain with a unique geographic location and geologic-historical background (Chen et al., 2019; Sun et al., 2023a), and its multilayered groundwater aquifer structure and endowed with a variety of hydrochemical types indicate an ideal location for studying the groundwater environment of the coastal zone. The study area, located in the coastal plain of northern Shandong, China, bordering the Bohai Sea, represents a typical coastal region. Coastal environments in the coastal aquifer of Israel and Spain (Sivan et al., 2005; Martínez-Pérez et al., 2022) use similar groundwater sampling methods (Sheng et al., 2023). The study area encompasses the alluvial plain of the Huanghe River Delta and the coastal alluvial seafloor in Laizhou Bay, characterized by a semi-humid monsoon climate with an annual average temperature of 12.1°C, 599 mm of precipitation, and 1,400 mm of evaporation. Major rivers, including the Weihe, Yuhe, Bailang, Mihe, Xiaoqing, and Huanghe Rivers, traverse the study area, providing freshwater and coarse-grained sediment to the coastal groundwater (Sun et al., 2006).
The Xiaoqing River delineates the hydrogeological unit, separating the region into the southern coast of Laizhou Bay and the Yellow River Delta. The coastal zones on either side of the Xiaoqing River show different topography, geomorphology, depositional environments and erosion levels due to riverine and oceanic influences (Chen et al., 2002; Ren et al., 2023). The southern coast of Laizhou Bay, bordered by the Bohai Sea and the Shandong Peninsula, features a multi-source, short-river deltaic depositional system with Quaternary subsurface brines predominantly concentrated in the Mahe-Weichang River basin, exhibiting a distinctive ‘dumbbell–shaped’ distribution (Gao et al., 2015). The Huanghe River, originating from the Tibetan Plateau, has formed a fan-shaped delta with an area of about 6,000 km² (Zheng et al., 2005), with sediment accumulation in the estuary creating favorable conditions for groundwater storage (Xue, 1993).
The study area’s stratigraphy consists of four layers: Early Pleistocene (burial depth: 309~172 m), Middle Pleistocene (172~45 m), Pleistocene (45~20 m), and Holocene (<20 m) (Xin and He, 1991; Guo et al., 2016) (Table 1). Since the Late Pleistocene, three sea-invasion-recession events have occurred, forming three marine stratigraphic layers: Middle Holocene Huanghua (Qh2, 7–2.5 ka B.P.), Late Pleistocene Xianxian (Qp33, 40–21 ka B.P.), and early Late Pleistocene Cangzhou (Qp31, 110–70 ka B.P.) (Gao et al., 2015; Gao et al., 2016). The Quaternary stratigraphy, influenced by sea-land interactions, comprises numerous weakly permeable layers and aquifers with varying hydraulic properties (Xue et al., 2000). The brine aquifer, with a multi-layered structure (Figure 1b), is primarily developed in three marine strata within Quaternary loose sediments (Zheng et al., 2014; Liu et al., 2017).
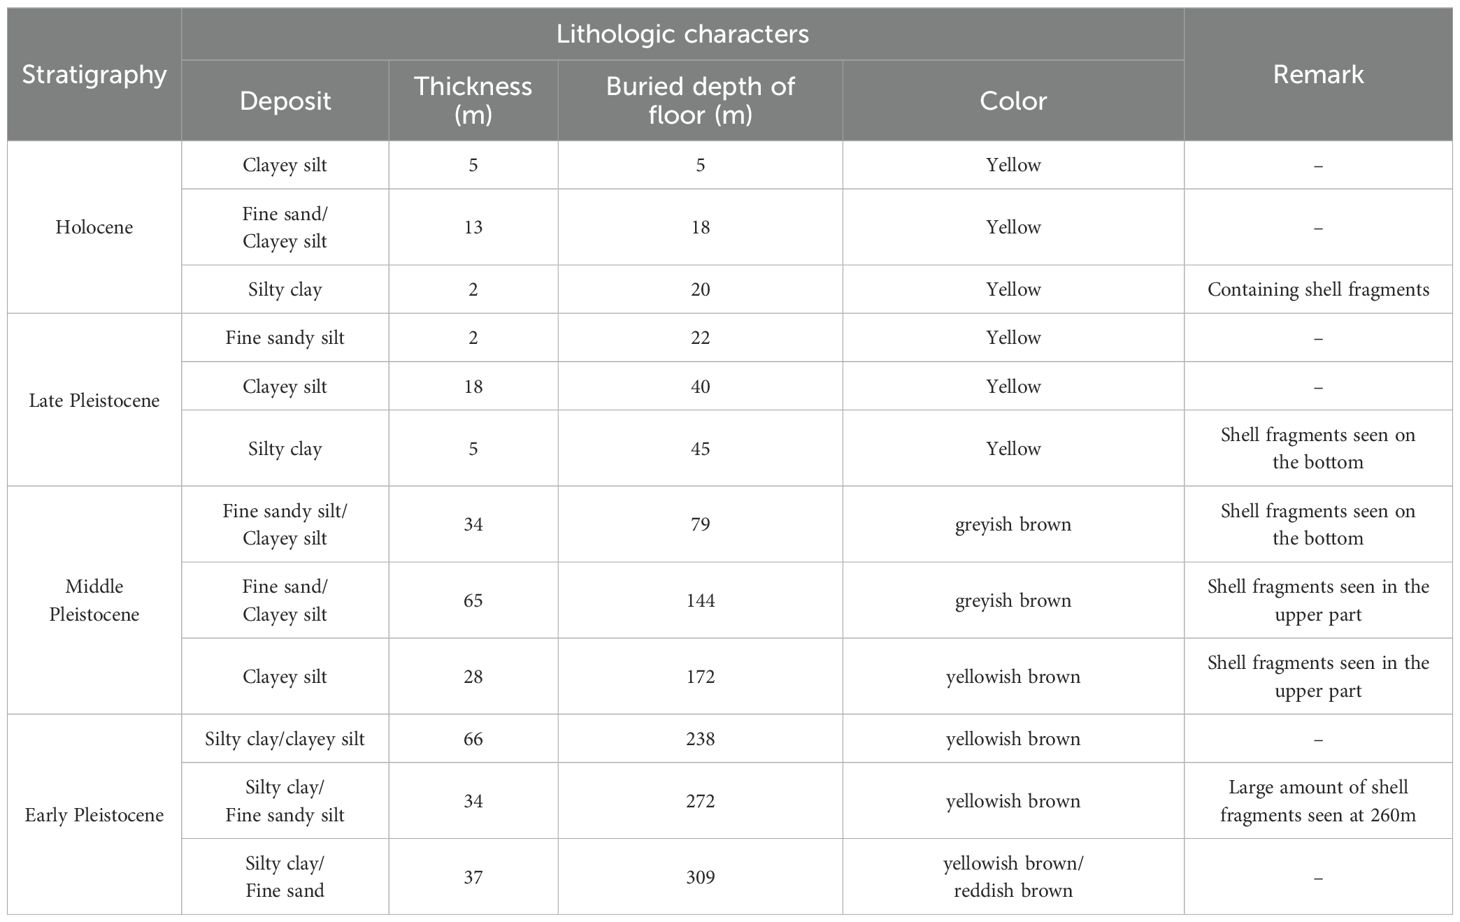
Table 1. Stratigraphic and lithological characteristics of offshore drill cores (Sample BH1 in Figure 1a) in the Huanghe River Delta (cited in Xin and Yin, 1999).
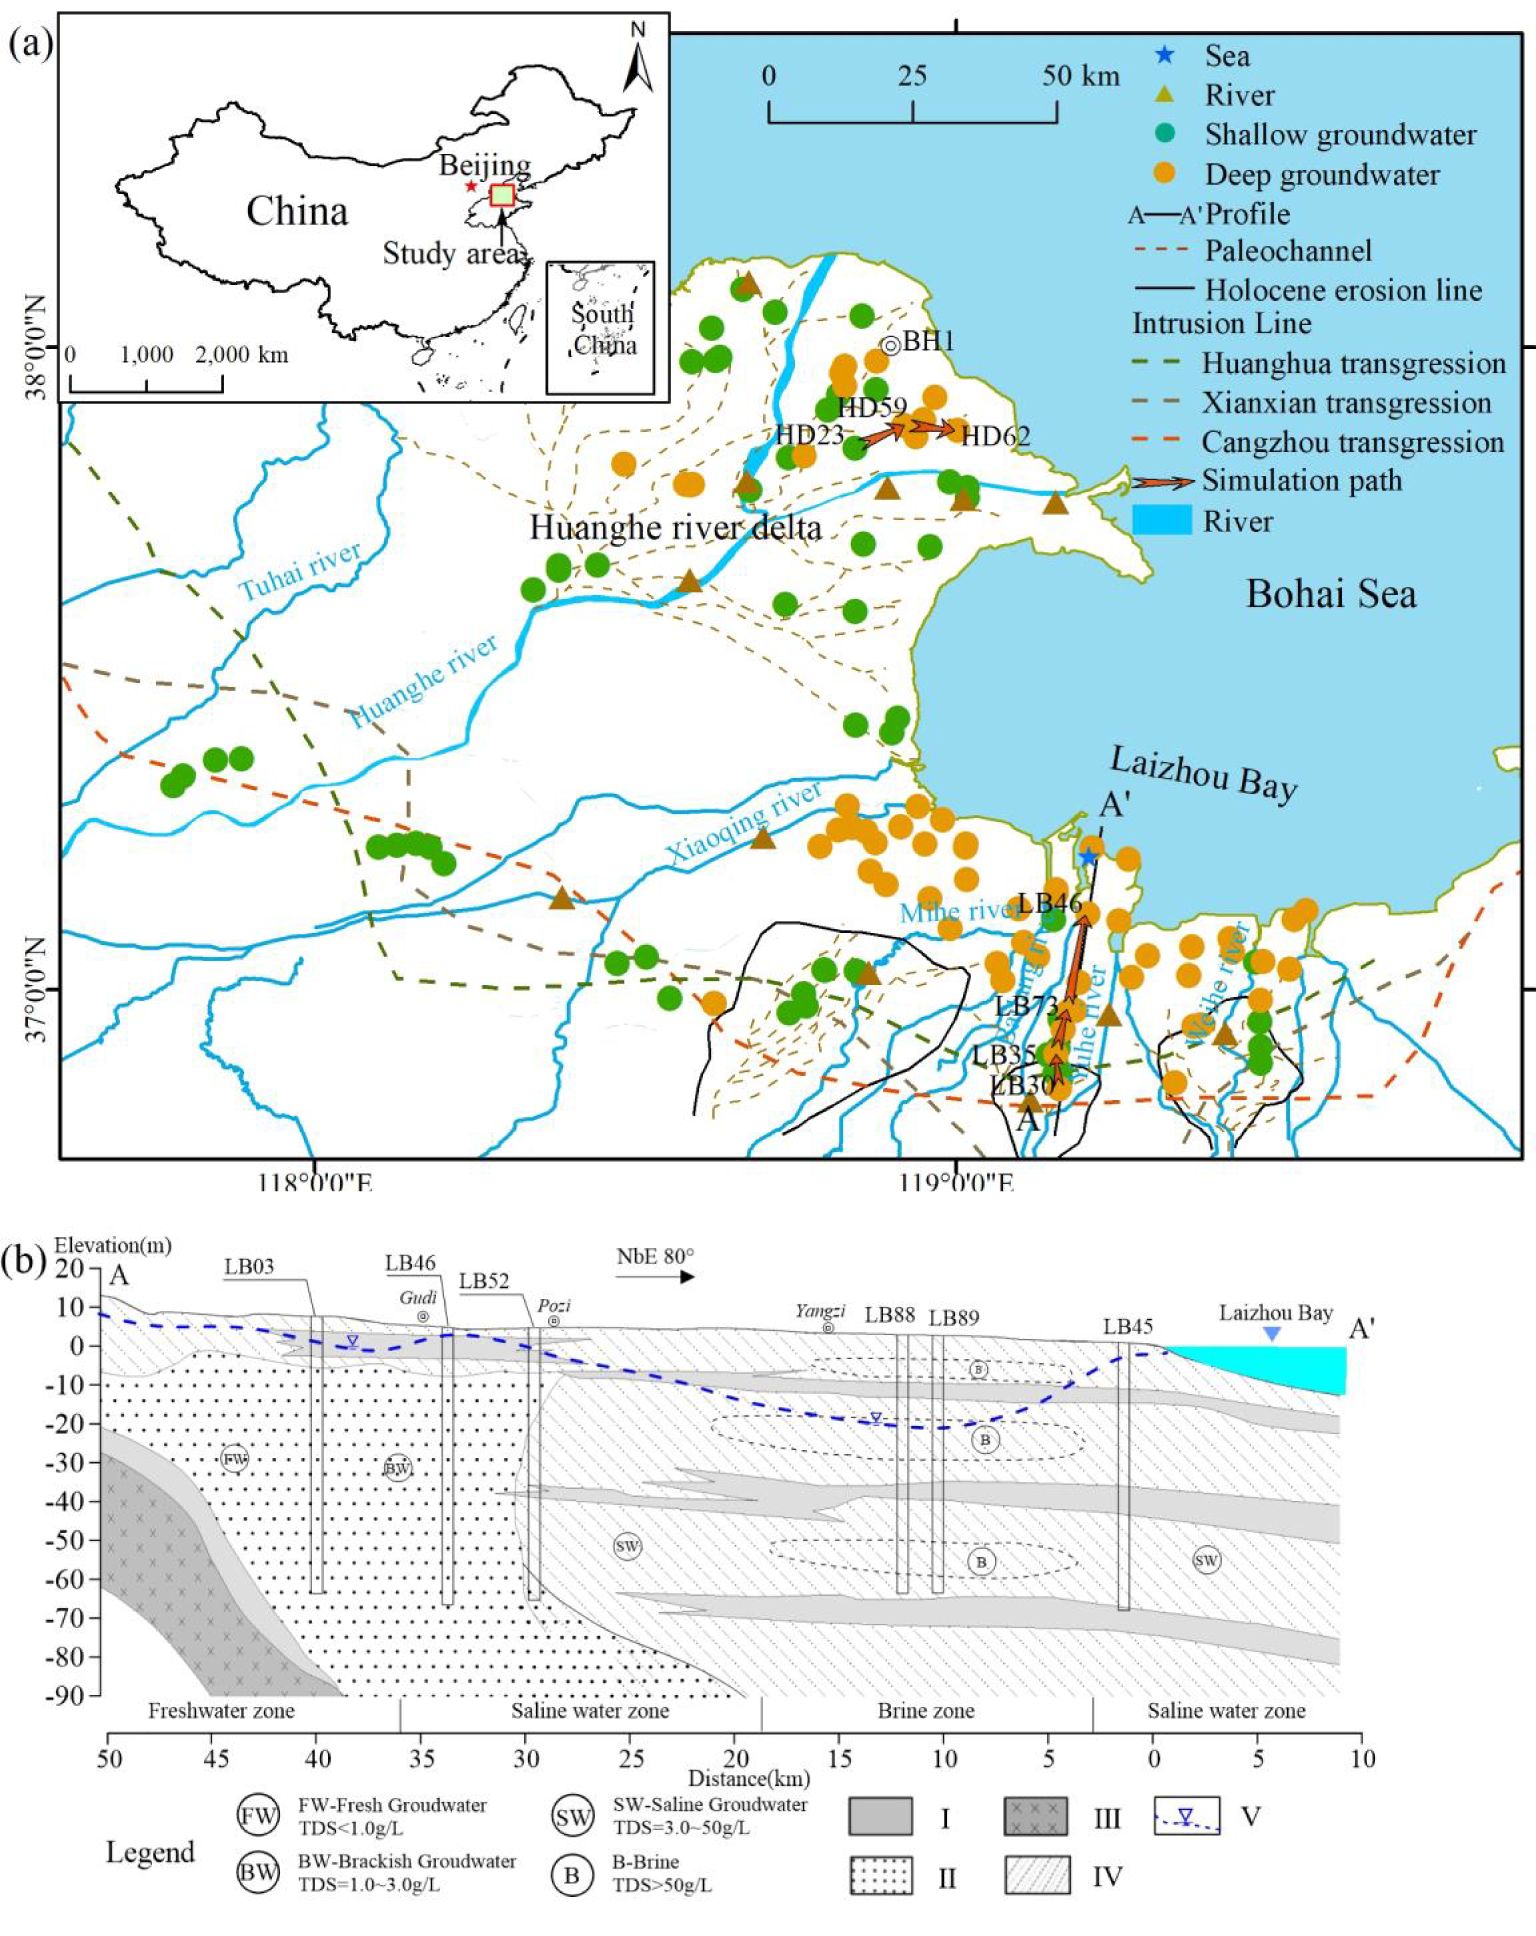
Figure 1. Location map of the study area. (a) Distribution of groundwater sample sites. Extent of palaeochannels and alluvial fans in Laizhou Bay from (Han et al., 2002). Sea invasion line is from (Gao et al., 2023). Palaeochannels of the Huanghe River Delta modified from (Xue, 1994; Fan et al., 2006). (b) Geological background of Laizhou Bay (modified from Liu et al., 2017; Sun et al., 2023b). Legend: I– Silty Clay; II– Fine Sand; III– Basalt and andesite of Neogene; IV– Clayey Sand; V– Groundwater level (2021).
2.2 Sample point collection and distribution
This study, supported by the 2023 Joint Fund ‘Mechanism of Underground Brine Resources Formation and Evolution in Shandong’s Coastal’, collected water samples from various water bodies in the study area. Our collection totaled 152 samples, compiled from 138 groundwater samples, 12 surface river samples, a single Bohai Sea sample, and a local rainfall sample, with the sea encroachment line encompassing most sample locations (Figure 1a). Primarily, the groundwater sampling was accomplished by utilizing local civil wells, machine wells, and monitoring wells to gather shallow (from SHA) and deep groundwater samples (from DPA). For detailed analysis of brine variances, deep brines in Laizhou Bay were categorized into Deep-upper brine (Late Pleistocene) and Deep-lower brine (Early Pleistocene). All samples were immediately filtered on-site using a 0.22 µm membrane. Analytic cation samples were acidified to a pH below 2 with 6 mmol/L nitric acid and stored in 500 mL plastic sampling bottles for water chemistry analysis. Additionally, hydrogen and oxygen isotope testing was conducted on 141 samples using 10 mL brown glass sampling bottles.
2.3 Sample testing
In situ measurements of groundwater’s redox potential, pH, conductivity, and temperature were performed using a Manta+ water quality multi–parameter analyzer produced by Eureka, U.S.A. The concentrations of various ions namely K+, Na+, Ca2+, Mg2+, and Br– were tested using an Inductively Coupled Plasma analyzer (ICAP–7400). The evaluation of SO42– and Cl– ions was done using Chromatographic Analysis (ICS–600), while the HCO3– ion concentration were established via titration. The Marine Geological Testing Centre of China’s Ministry of Natural Resources employed High Temperature Pyrolysis–Isotope Ratio Mass Spectrometry (HTP–IRMS) to measure the water samples’ stable isotope contents (δ2H, δ18O), using the Vienna Standard Marine Water (V–SMOW) as the calculating index. The isotopic uncertainties of δ2H and δ18O were ±1.0‰ and ±0.2‰, respectively. Additionally, Beta Laboratory performed tests and analysis on the stable isotopes (δ2H, δ18O) of the groundwater samples.
2.4 Methods of analysis
2.4.1 Saturation index analysis
The Saturation Index (SI) serves as an indicator, reflecting whether a solution is in equilibrium, unsaturated, or supersaturated vis–à–vis the solid phase (Aghazadeh et al., 2017). Expressed as the logarithm of the ratio between the Ionic Activity Product (IAP) and the Solubility Product (LP), it utilizes a base–10 logarithmic scale (Equation 1). Realistically, SI values ranging from –0.5 to +0.5 convey quasi–equilibrium, values less than –0.5 signify unsaturation and therefore a dissolved state in relation to given minerals. Meanwhile, values surpassing +0.5 indicate supersaturation, with the relevant minerals in the solution manifesting in a precipitated state (Han et al., 2014). PHREEQC software was implemented in the execution of hydrogeochemical modelling for this study.
Where IAP signifies the ions’ activity product participating in the mineral dissolution reaction. LP denotes the temperature–dependent maximum solubility of the mineral.
2.4.2 Mass balance model
In the section of our mass balance model, Cl– in groundwater forms an ideal sensitivity indicator, owing to its wide distribution, difficulty in adsorption, and significantly minor participation in geochemical reactions, thereby reflecting seawater mixing and serving as an extensively utilized environmental tracer in hydrogeology. Utilizing ion vs. Cl– molar ratios and the correlational ion distribution, insights into the water–rock interactions during weakly permeable layers’ pore water formation are divulged.
Assuming that groundwater evolution solely incorporates seawater salts with no other water chemistry involvement, the contribution of seawater ions to groundwater salinity can be calculated using the conservation of mass theorem, i.e., the major seawater ion mixing ratio (Giambastiani et al., 2013; Han et al., 2014). Given the chloride ions’ chemical stability and the observed unsaturation of salt rock minerals in groundwater samples’ saturation index, this study calculated seawater’s mixing ratio using Cl– as a tracer via the following formula:
Where is the mixing ratio of seawater. is the concentration of chloride ions in the groundwater sample (mg/L). is the concentration of chloride ions in seawater (mg/L). is the concentration of chloride ions in the freshwater end element (mg/L).
Based on the computed f for the chloride ion, the theoretical concentration for each of the major ions present in groundwater can be calculated further (Equation 3).
where is the theoretical concentration of ions in groundwater. and are the concentrations of ions in seawater and freshwater end elements, respectively.
The difference between the actual measured sample ion concentration and the theoretical ion concentration is the aqueous chemical reaction value of the ion (Equation 4). Thus, we can express it as follows:
This result reflects the occurrence of certain hydrogeochemical processes within groundwater that induce variations in the concentration of i ions, as asserted by De Montety et al. (2008). Such alterations underscore the dynamic nature of groundwater composition and its susceptibility to environmental and geochemical changes.
2.4.3 HFE–diagram
The HFE–Diagram as proposed by (Giménez–Forcada, 2010, Giménez–Forcada, 2014), serves as a tool for recognizing and comprehending the temporal and spatial intrusion of seawater into coastal aquifers. It provides crucial insights into the hydrochemical variability within these areas. Primarily, the HFE–Diagram is employed to evaluate the mixing processes occurring between fresh and saline waters. It is considered particularly efficacious for assessing the intrusion processes of fresh and sea (saline) water within the groundwater of coastal, and identify by the distribution of positive and negative ion percentages (Giménez–Forcada, 2014). This method largely centers around the distribution and behavior of anions and cations.
3 Results
3.1 Groundwater chemical characteristics
In the study region, TDS contents in SHA and DPA groundwater ranged from 0.38–34.20 g/L and 0.46–156.96 g/L, respectively, with average values of 8.06 g/L and 72.07 g/L. The dominant hydrochemical compositions were Cl–Na and Cl–Na·Mg (Figure 2). Major ions indicated a transition from freshwater to brine, with cations evolving from Ca2+ and Mg2+ to Na+, and anions from Bicarbonate and Sulfate to Chloride. The hydrochemistry of freshwater in SHA is mainly HCO3–Ca and Cl·SO4–Ca·Mg, while in DPA, it’s predominantly HCO3–Ca, HCO3–Ca·Na. The brackish water mainly comprises of Cl·SO4–Na and Cl·SO4–Ca·Mg, while Cl–Na characterizes both saline and brine waters. DPA groundwater exhibited a larger range of TDS contents and more complex hydrochemical types. Most brines were similar to local seawater, suggesting a seawater origin.

Figure 2. Piper’s trilinear plot of multiple water samples (black curve indicates the evolutionary path from freshwater to brine; black dotted circles indicate the main distributions of SHA freshwater, DPA freshwater, brackish water, saline water and brine, respectively).
From a regional perspective, Cl–Na type groundwater in the offshore DPA of the Huanghe River Delta is more homogeneous, likely due to the extensive marine layer. In contrast, groundwater along the southern coast of Laizhou Bay shows more diverse hydrochemical types, indicating potential mixing with other aquifers.
TDS contents of groundwater samples generally decreased with increasing distance from the coastline (Figure 3). Within the coastal (<20 km) area, DPA groundwater had higher TDS contents, often exceeding local seawater (24.1 g/L). Beyond 20 km, SHA groundwater TDS significantly lowered to freshwater levels. Near the sea, SHA groundwater was mainly saline, with some brine levels within 10 km. In the 20~30 km range, only DPA groundwater had relatively higher TDS, similar to seawater, suggesting past seawater intrusion influence. The fitted curve showed DPA groundwater had higher TDS than SHA groundwater, with greater change near the coastline. SHA groundwater near the coast had TDS equivalent to local seawater, indicating significant seawater mixing and intrusion influence in near-coastal Holocene strata.
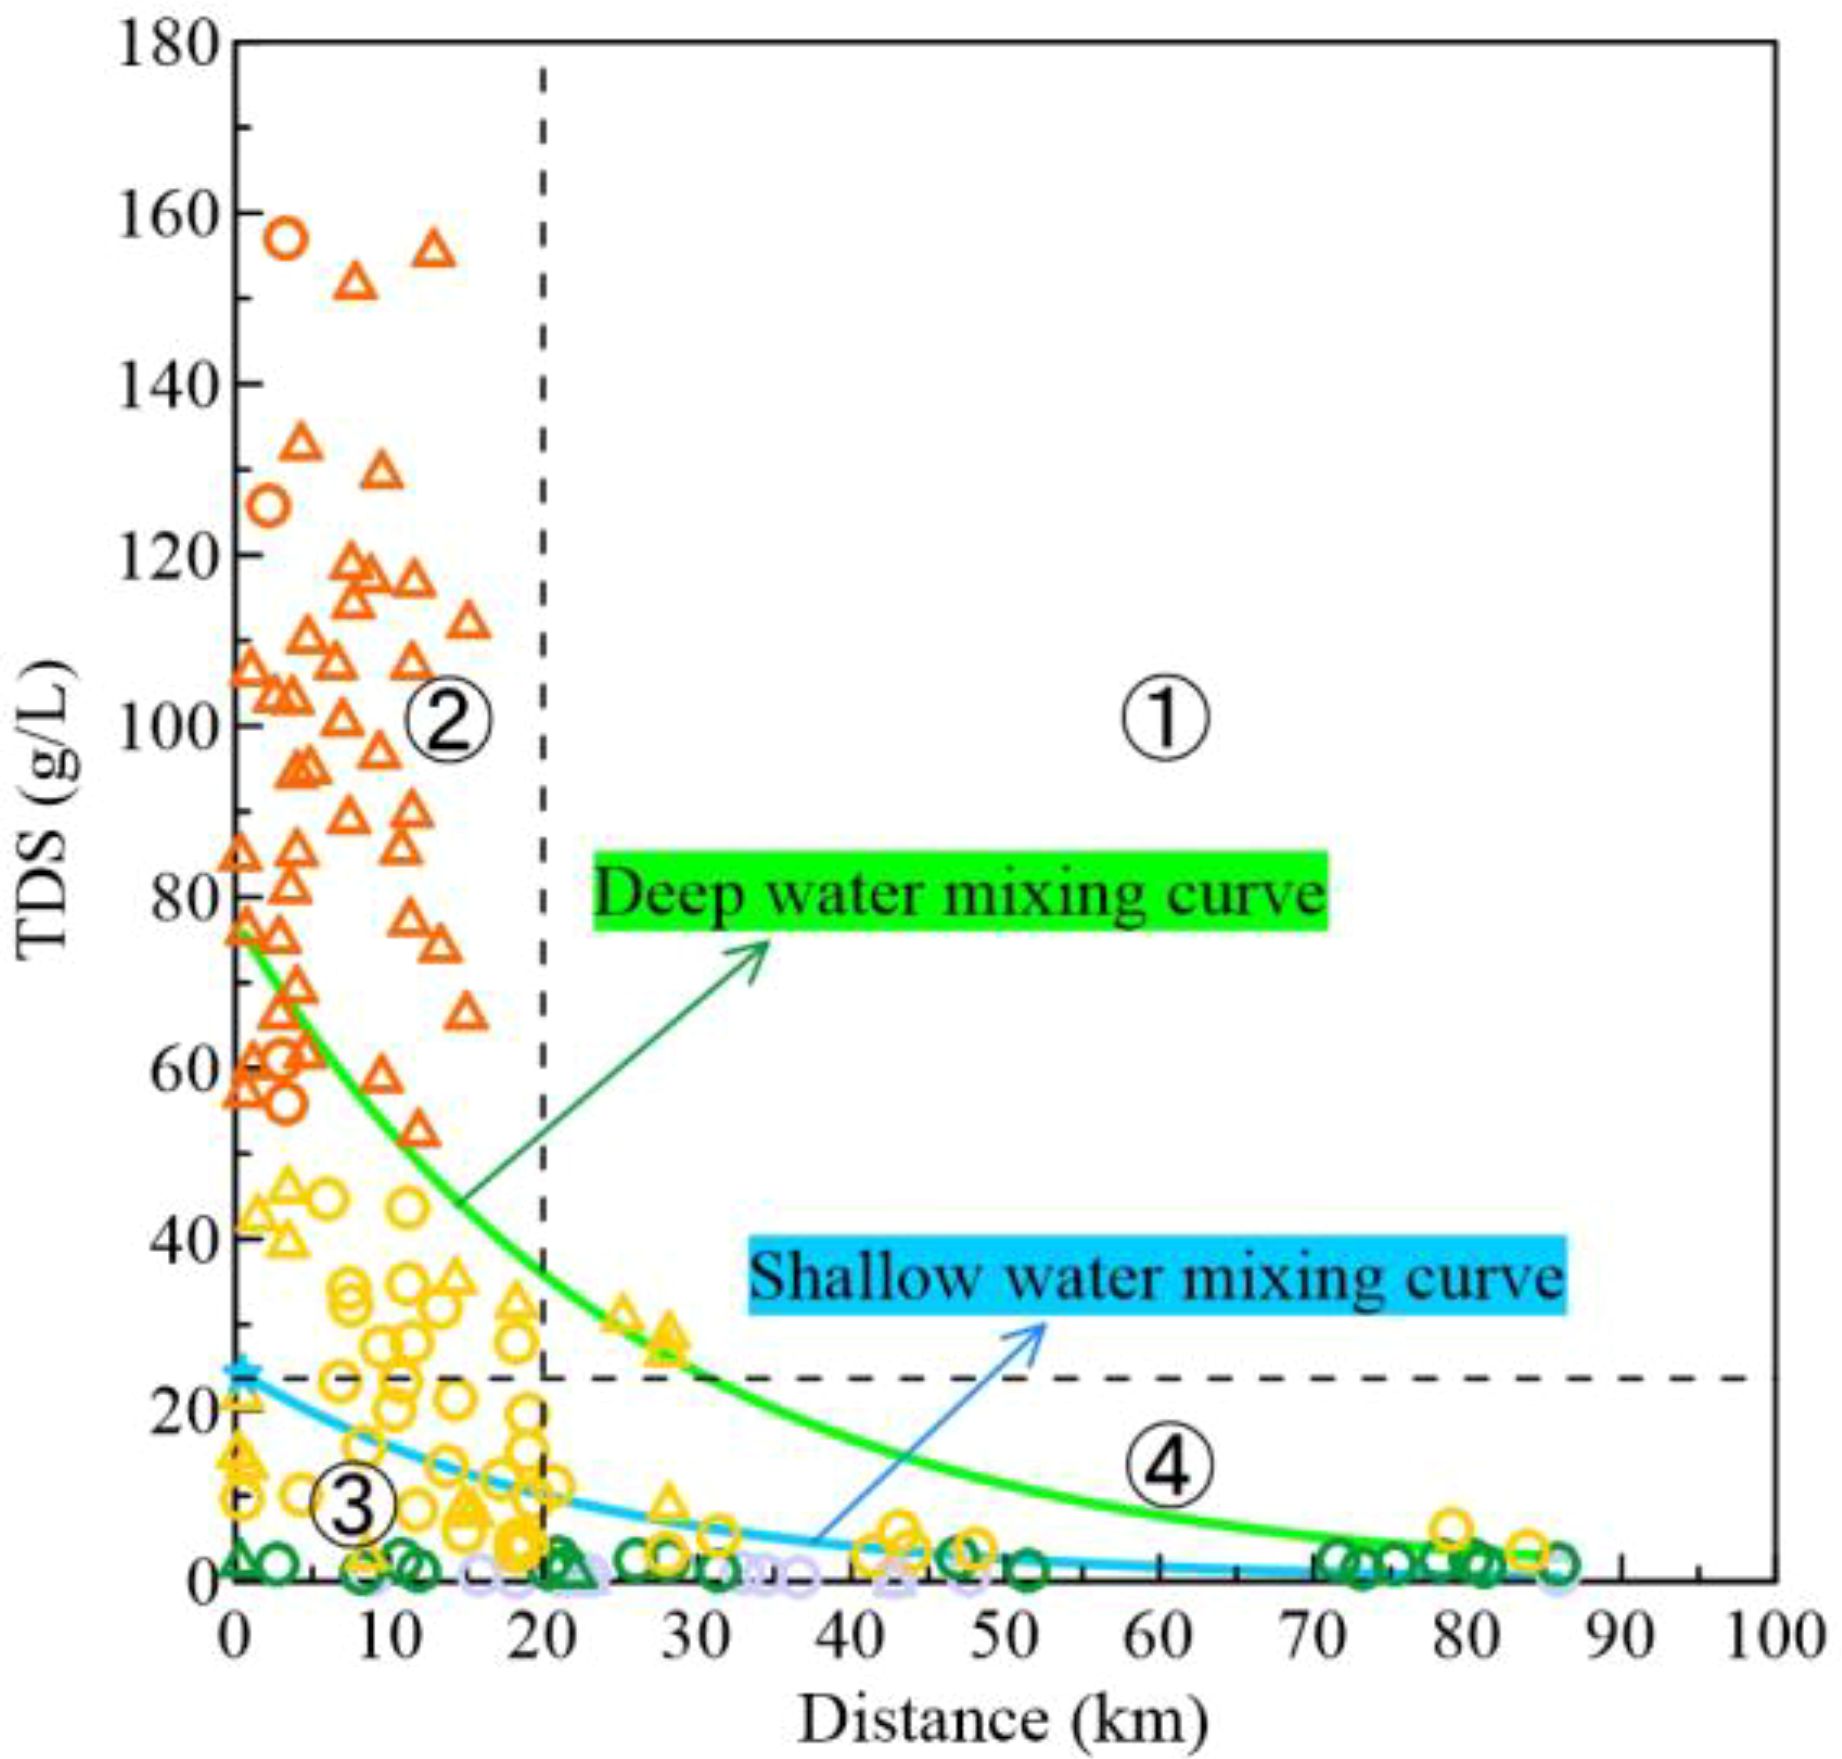
Figure 3. Characteristics of TDS contents distribution in groundwater from land to sea (symbols are the same as in Figure 2), green solid line is the fitted curve for deep water and blue solid line is the fitted curve for SHA water.
3.2 Major ion trends
The relationship between ions and Cl- can indicate the source of groundwater salinity (e.g. Edmunds et al., 2006). In ion vs. Cl- plots (Figure 4), most water samples, particularly saline and brine waters, align closely with the seawater ratio line, as seen in Na+ vs. Cl- (Figure 4a), Mg²+ vs. Cl- (Figure 4b), SO4²- vs. Cl- (Figure 4c), and Br- vs. Cl- relationships (Figure 5a). Fresh and brackish water samples, however, are scattered and shifted upward. Lower salinity groundwater is likely influenced by mineral weathering, which dissolves certain ions and increases total solutes. In high-salinity conditions, re-dissolving mineral ions is difficult. Using the mass balance model (Equation 2), the mixing line between end-element samples was calculated and plotted across water chemistry indicators (Figure 7). Most ions align with seawater and brine end-members, but Ca²+ vs. Cl- shows a scattered distribution for groundwater samples (Figure 4d), with significant blending of SHA and DPA freshwater end-members.

Figure 4. Hydrochemical relationships between some ions in groundwater and mean seawater constituents in the study area (a) Cl– vs. Na+ relationship plot (b) Cl– vs. Mg2+ relationship plot (c) Cl– vs. SO42– relationship plot (d) Cl– vs. Ca2+relationships (black dashed line is the freshwater and seawater mixing line, and red dashed line is the freshwater and brine mixing line) (SW, G, H, E, S, C, and B represent the standard seawater values, gypsum saturation point, rock salt saturation point, lagoonal salt saturation point, and the saturation points of potash rock, carnallite, and magnesium hydromagnesite, respectively (refer to Chen, 1983)) (symbols are the same as in Figure 2).
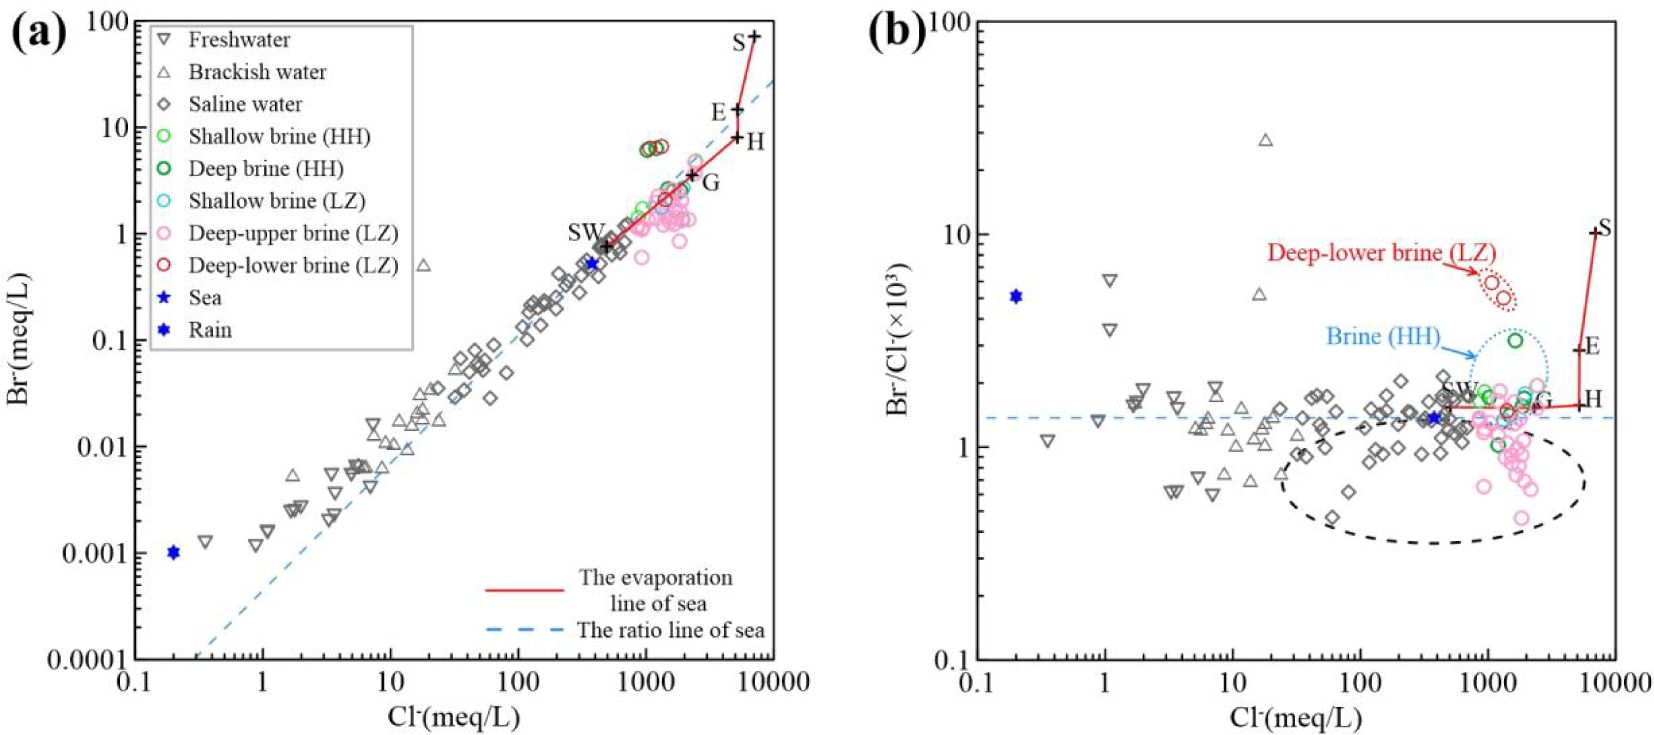
Figure 5. Cl– vs. Br– relations (a) Br– vs. Cl– relations. (b) Br–/Cl– vs. Cl– relations. Deep–upper brine (LZ) and some saline waters in the black dashed line, mostly Huanghe River Delta brine in the blue dashed line, and Deep–lower brine (LZ) in the orange dashed line on the south coast of Laizhou Bay.
Saline water with TDS contents exceeding seawater and brine is closely distributed near the seawater evaporation line, indicating groundwater salinity may be linked to seawater or concentrated saline water. Na+, Mg²+, and SO4²- contents in Northern Shandong’s coastal groundwater generally correlate positively with Cl- concentration. Cl-, Na+, and Mg²+ are key seawater components. Groundwater salts could originate from seawater intrusion, marine aerosols, or dissolution of salt rocks by precipitation (see Figures 4a–c). Most fresh, brackish, and saline water lies below the mixing line (Figure 4a), showing Na+ depletion and possible cation exchange. Brackish and saline waters deviating from the mixing line may exhibit SO4²- enrichment (Figure 4c), suggesting sulfate mineral dissolution. Further hydrogeochemical analyses are needed to confirm these observations and the groundwater formation evolution due to aquifer sediment contact.
3.3 δ18O–δ2H stable isotopes
Located in a temperate semi-humid monsoon climate zone, the study area is a transitional region between land and sea with high evaporation rates. Using the global atmospheric precipitation line equation (δ2H = 8δ18O + 10, Craig, 1961), the local meteorological water line (LMWL) was determined as δ2H = 7.8δ18O + 6.3, based on monthly average rainfall data in Yantai from 1986–1990. The δ18O and δ2H values for average monthly rainfall were obtained from the IAEA Global Network of Isotopes in Precipitation (GNIP) (IAEA/WMO, 2006). The regression equation for water samples had a slope of 5.8 (R2 = 0.91) (Figure 7), lower than global and local atmospheric precipitation lines. The Bohai Coastal Plain, affected by past climatic conditions and sea intrusion-recession events, shows distinct shifts in δ18O and δ2H values in groundwater (–78.07 ‰ to –19.17 ‰ for δ2H, –11.26 ‰ to –2.09 ‰ for δ18O). Most groundwater samples are isotopically below global and local atmospheric precipitation lines, especially those with δ18O > –8 ‰. Isotopes in saline and brine water are enriched, while fresh and brackish water samples align with river water.

Figure 6. Saturation index of calcite, dolomite, gypsum and rock salt plotted against Cl–.
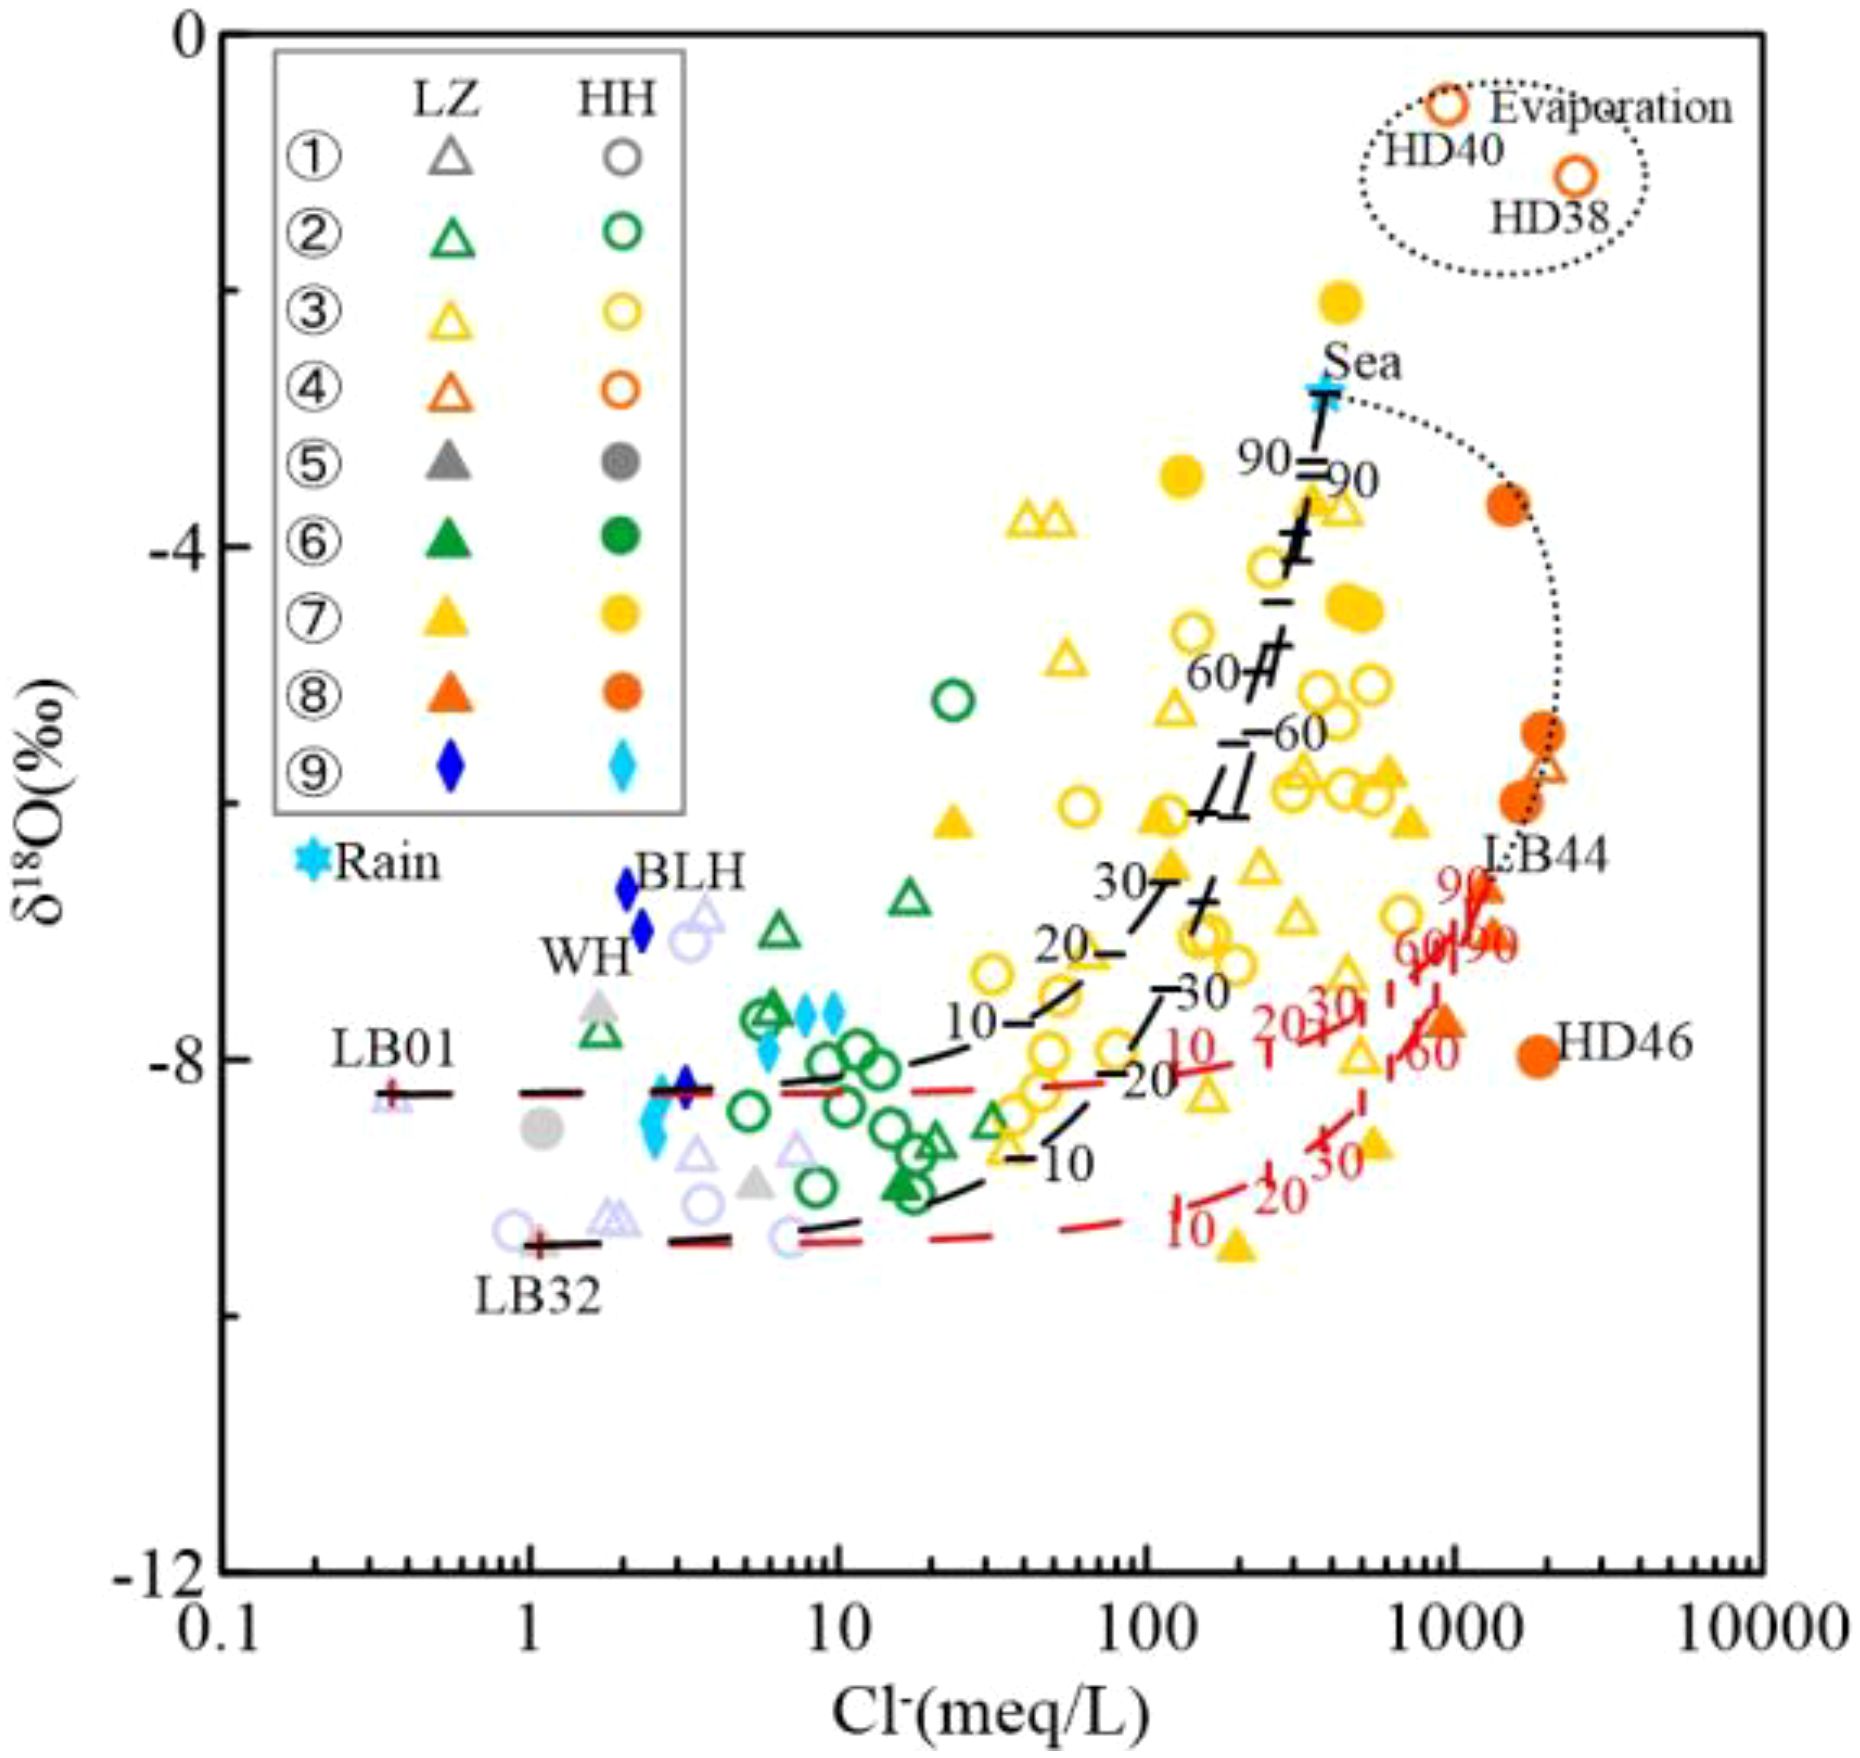
Figure 7. Plot of stable isotope δ18O versus Cl– in groundwater and surface water in the study area, with the black dashed circle showing the underground brine subject to strong evaporation. (The water types represented by each serial number in the figure are ①–Shallow freshwater; ②–Shallow brackish water; ③–Shallow saline water; ④–Shallow brine; ⑤–Deep freshwater; ⑥–Deep brackish water; ⑦–Deep saline water; ⑧–Deep brine; ⑨–River).
Most groundwater samples experience evapotranspiration, resulting in smaller regression equation slopes and intercepts, as depicted by the green dashed line in Figure 8. This is evident in saline and brine waters with significantly depleted δ18O and δ2H values. Fresh, brackish, and partially saline waters are near the atmospheric precipitation line, indicating minimal evapotranspiration impact. While saline/brine water from seawater evaporation typically has δ18O and δ2H values above standard seawater (δ2H = 0 ‰, δ18O = 0 ‰) (Horita, 2005), study area groundwater has lower values, suggesting alternative recharge sources. Subsurface brine samples, particularly SHA brine, are depleted in δ18O and δ2H, indicating freshwater mixing with terrestrial isotopes during brine formation. SHA groundwater samples (HD38 and HD40) near the Xiaoqing River’s offshore zone have high δ18O and δ2H values, suggesting post-evaporation seawater origin within SHA, similar to standard seawater. Climate factors cause isotopic depletion in most DPA brines. Notably, δ18O and δ2H in the Huanghe River Delta DPA brine sample (HD46, ~260 m) closely match the Huanghe River water sample, indicating a strong link between river water and Early Pleistocene strata brine moisture sources.
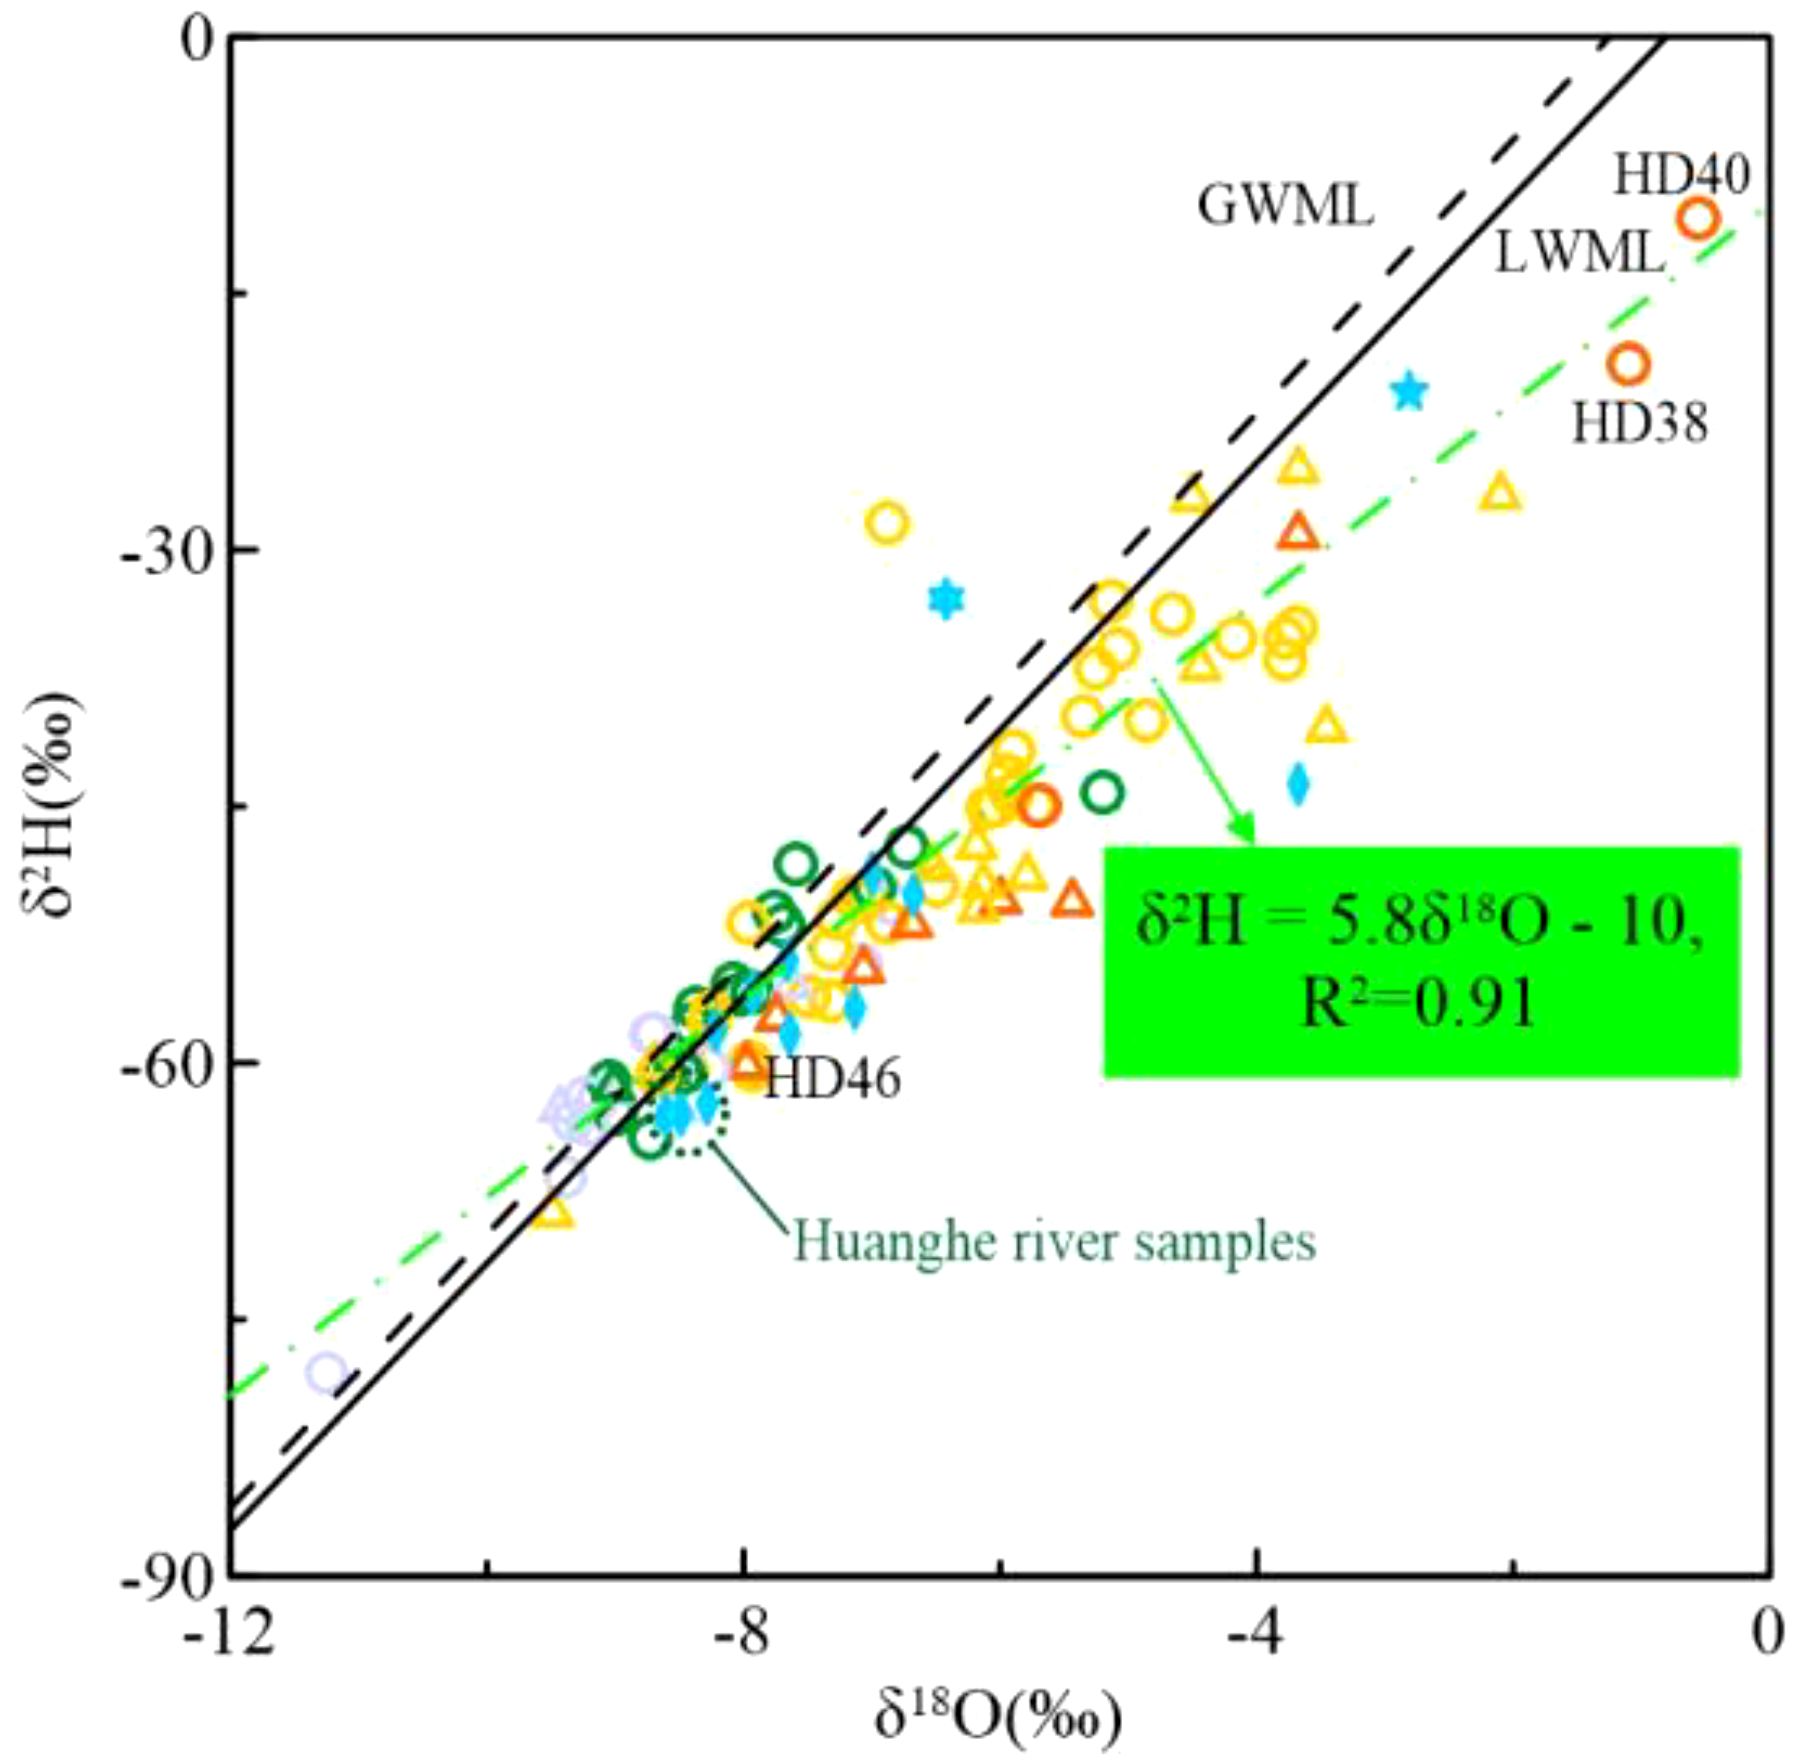
Figure 8. Stable isotopes in groundwater and surface water (symbols are the same as in Figure 2), black solid line is LWML, black dashed line is GWML, green dashed line indicates the fitted curve of groundwater samples, and the green dashed line is the Huanghe River water sample.
4 Discussion
4.1 Mixing process
As previously discussed, groundwater in the study area results from the mixing of seawater, freshwater, and brine. A three-end-member mixing model (SHA freshwater (LB01) and DPA freshwater (LB32) as freshwater end–members, seawater (Sea) as the seawater end–member, and DPA brine (LB44) as the brine end–member) using Cl– concentration and δ18O values was applied to trace mixing trajectories and quantify variations in water types (Figure 7). The model shows a correlation between Cl– concentration and δ18O values, with δ18O increasing as Cl– concentration rises, indicating the model’s validity. Most samples are above the DPA fresh-brine mixing line, with freshwater samples between the two mixing lines, having δ18O values from –9.5 to –8.2 ‰. The mass balance model (Equation 2) can estimate the contributions of freshwater, seawater, and brine to the mixed samples.
River water from the Bailang River (BLH) and Weihe River (WH) has high δ18O values due to upstream reservoir mixing and evaporation. SHA groundwater, recharged by these rivers, shows enriched δ18O values near the river basins. Post-sea recession interaction between rivers and groundwater is a key process for flushing saline water and reducing groundwater salinity (Kwong and Jiao, 2016). Atmospheric precipitation also contributes to high δ18O in SHA water. Most Huanghe River Delta groundwater is in the mixing zone. SHA brines (HD38, HD40) near the Xiaoqing River have high Cl– –δ18O values, suggesting a blend of evaporated seawater or modern precipitation. This differs from the Laizhou Bay south coast groundwater origin, hypothesizing brine from Holocene seawater via strong evaporation. DPA brine (HD46) at 260m depth has δ18O values similar to the Huanghe River, indicating Early Pleistocene brine recharge by river water. Other DPA brines at 100m depth mix with desalinated groundwater and seawater, clustering within the mixing line.
4.2 Water–rock action
4.2.1 Dissolution–filtration action
Saturation indices (Figure 6) indicate Rock Salt is mainly dissolved, Gypsum is mostly dissolved or in equilibrium in SHA groundwater, only supersaturated in high-salinity DPA groundwater. Calcite and Dolomite precipitate significantly when Cl– exceed 10,000 mg/L.
As salinity increases, ion vs. Cl– relationships tighten towards the mixing line (Figure 9). Na+ experiences cation exchange, resulting in ratios below the mixing line (Figure 10). Most saline and brine samples have Na+ vs. Cl– ratios similar to seawater (Figure 9a). Mg2+ vs. Cl– ratios are minimal (Figure 9b) due to dolomite saturation (Figure 8), which induces saturation and precipitation even at lower salinities. Fresh and brackish waters show a wider range of SO42– vs. Cl– ratios, indicating sulphate enrichment and depletion processes (Figure 8c). Decreasing SO42– vs. Cl– ratios with increasing mineralization suggest brine saturation with gypsum (Andersen et al., 2005). Some Ca2+ vs. SO42– ratios are minimal (Figure 9d), especially in DPA groundwater, suggesting influence from gypsum dissolution or another SO42– source. SPA groundwater samples with high Ca2+/SO42– ratios suggest Ca2+ originates from cation exchange at lower salinities. As salinity rises, dolomite and calcite precipitation (Figure 8) results in decreasing Ca2+ vs. SO42– ratios.
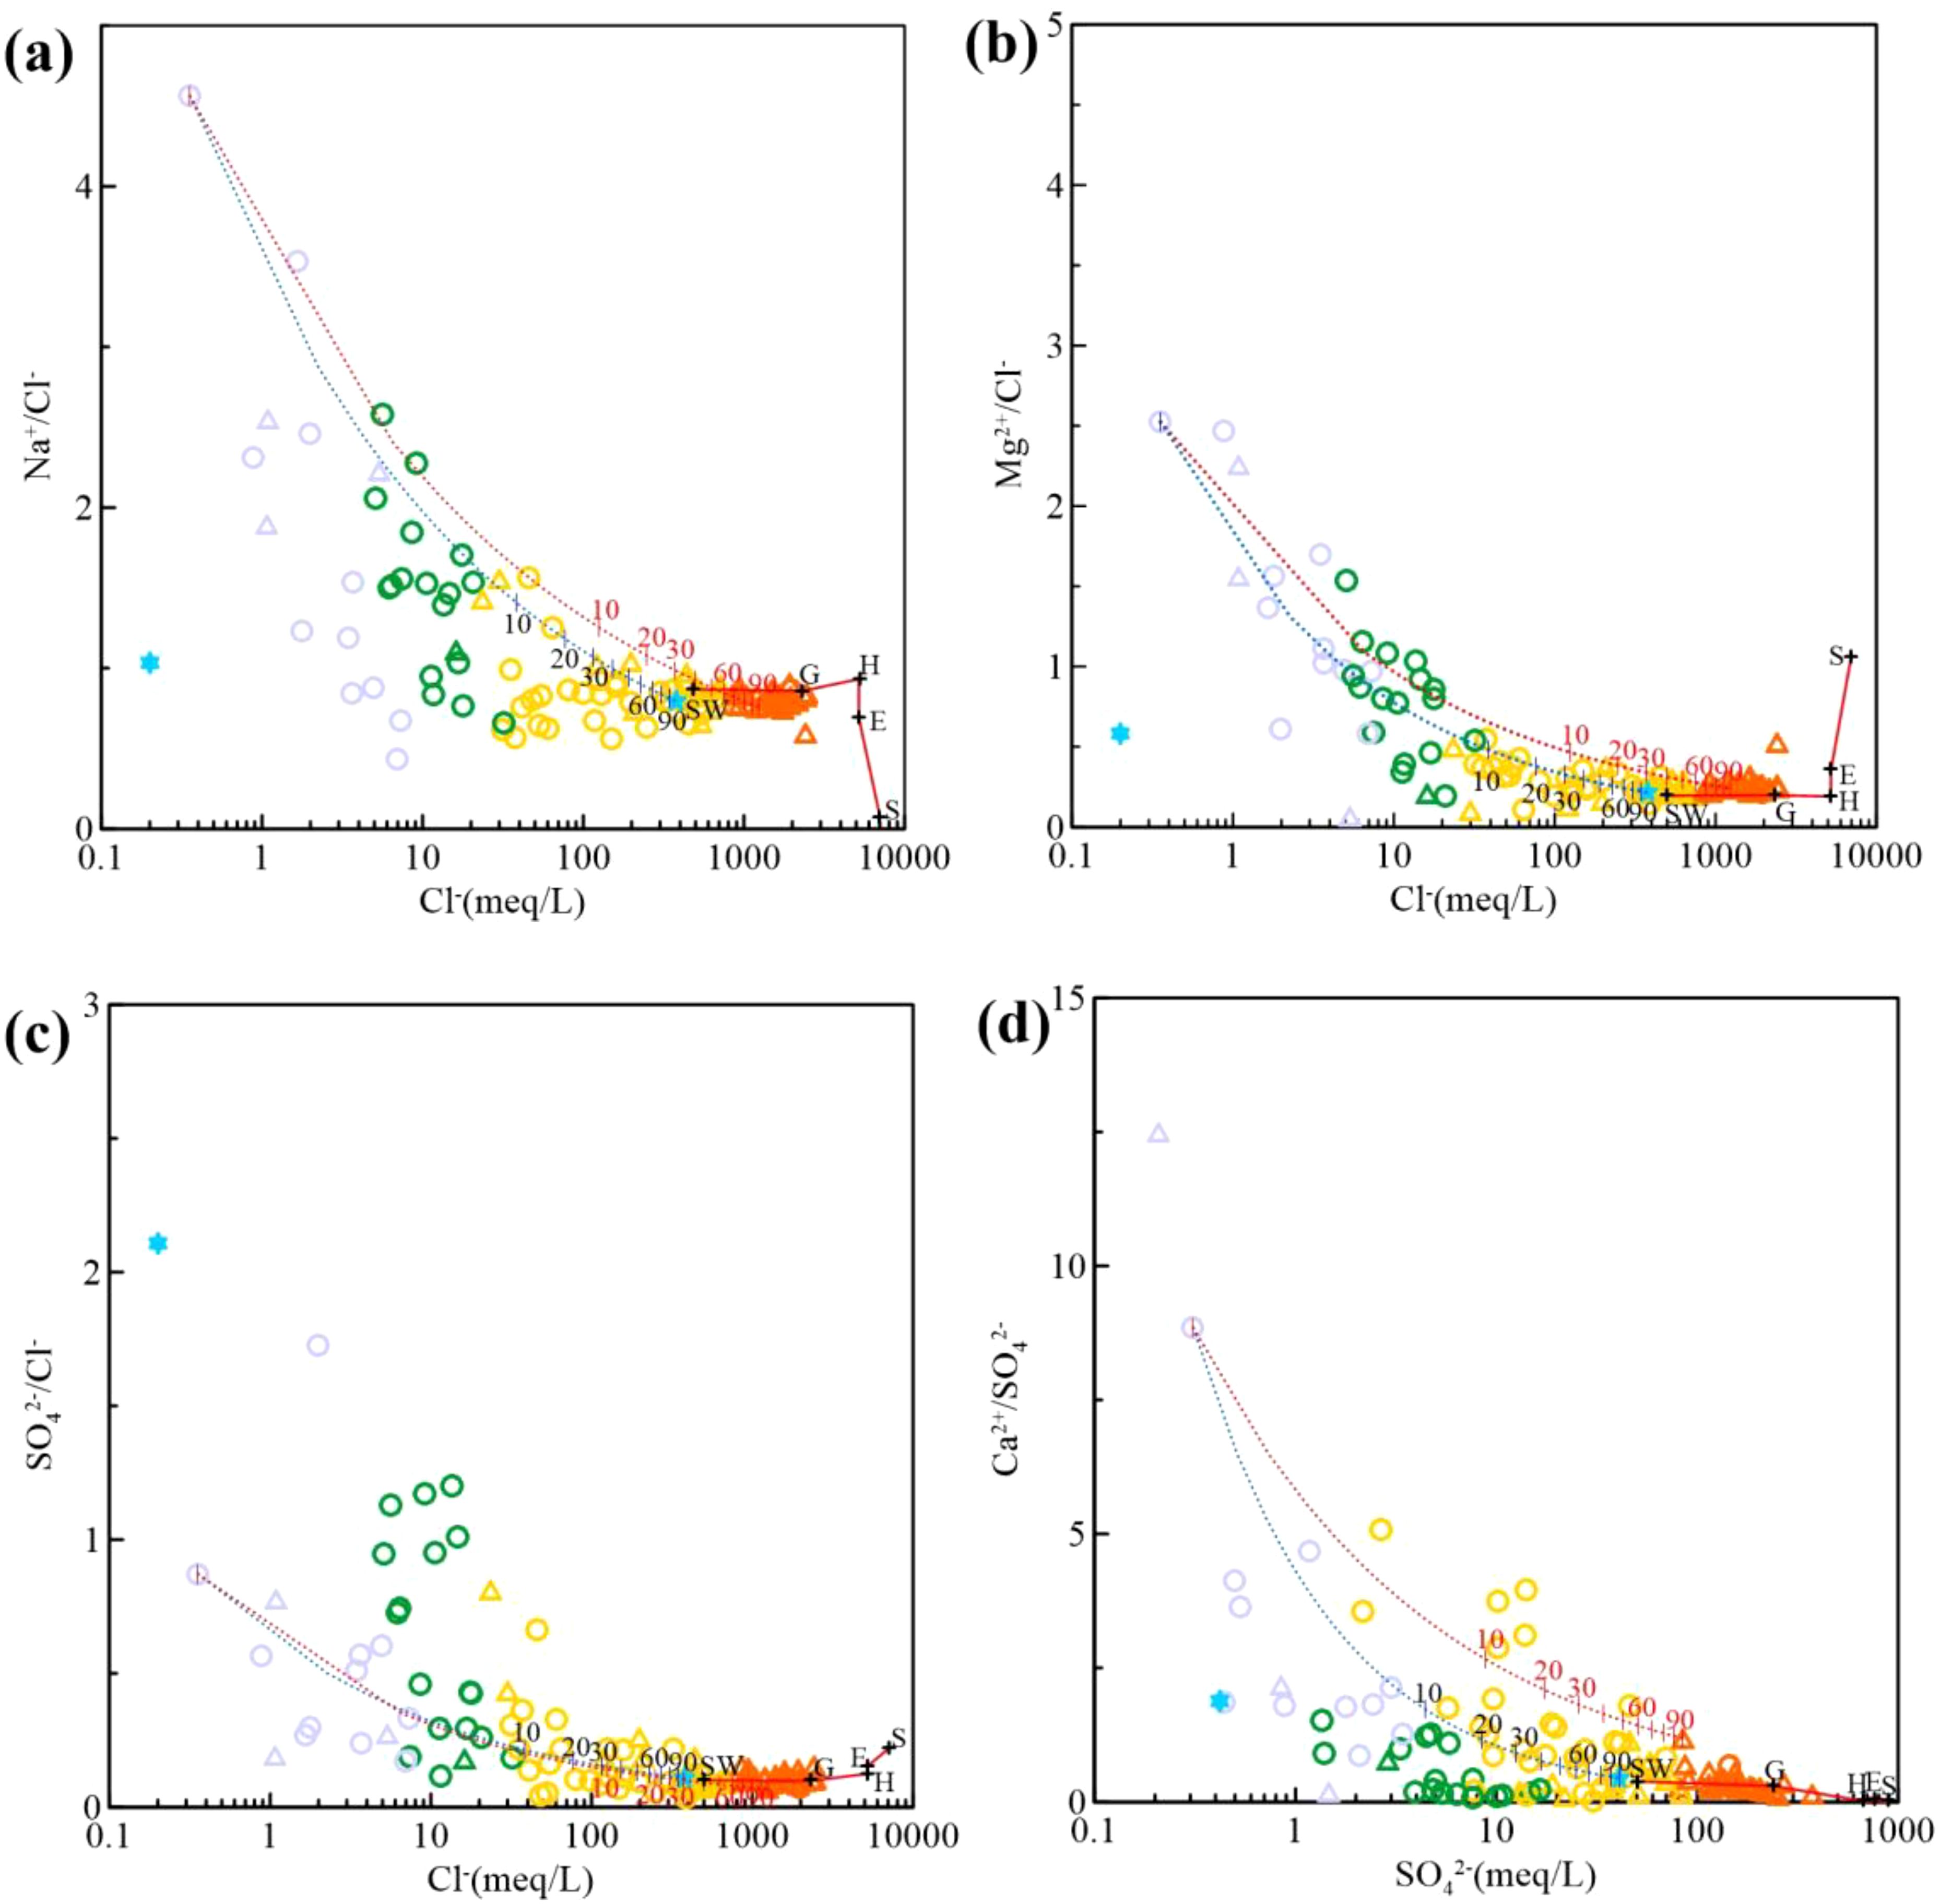
Figure 9. Variation of ion/Cl– with increasing salinity and correspondence with seawater and brine composition. (a) Na+/Cl– vs. Cl– relationship. (b) Mg2+/Cl– vs. Mg2+ relationship. (c) SO42–/Cl– vs. SO42– relationship. (d) Ca2+/SO42– vs. Ca2+ relationship. (same symbols as in Figure 2).
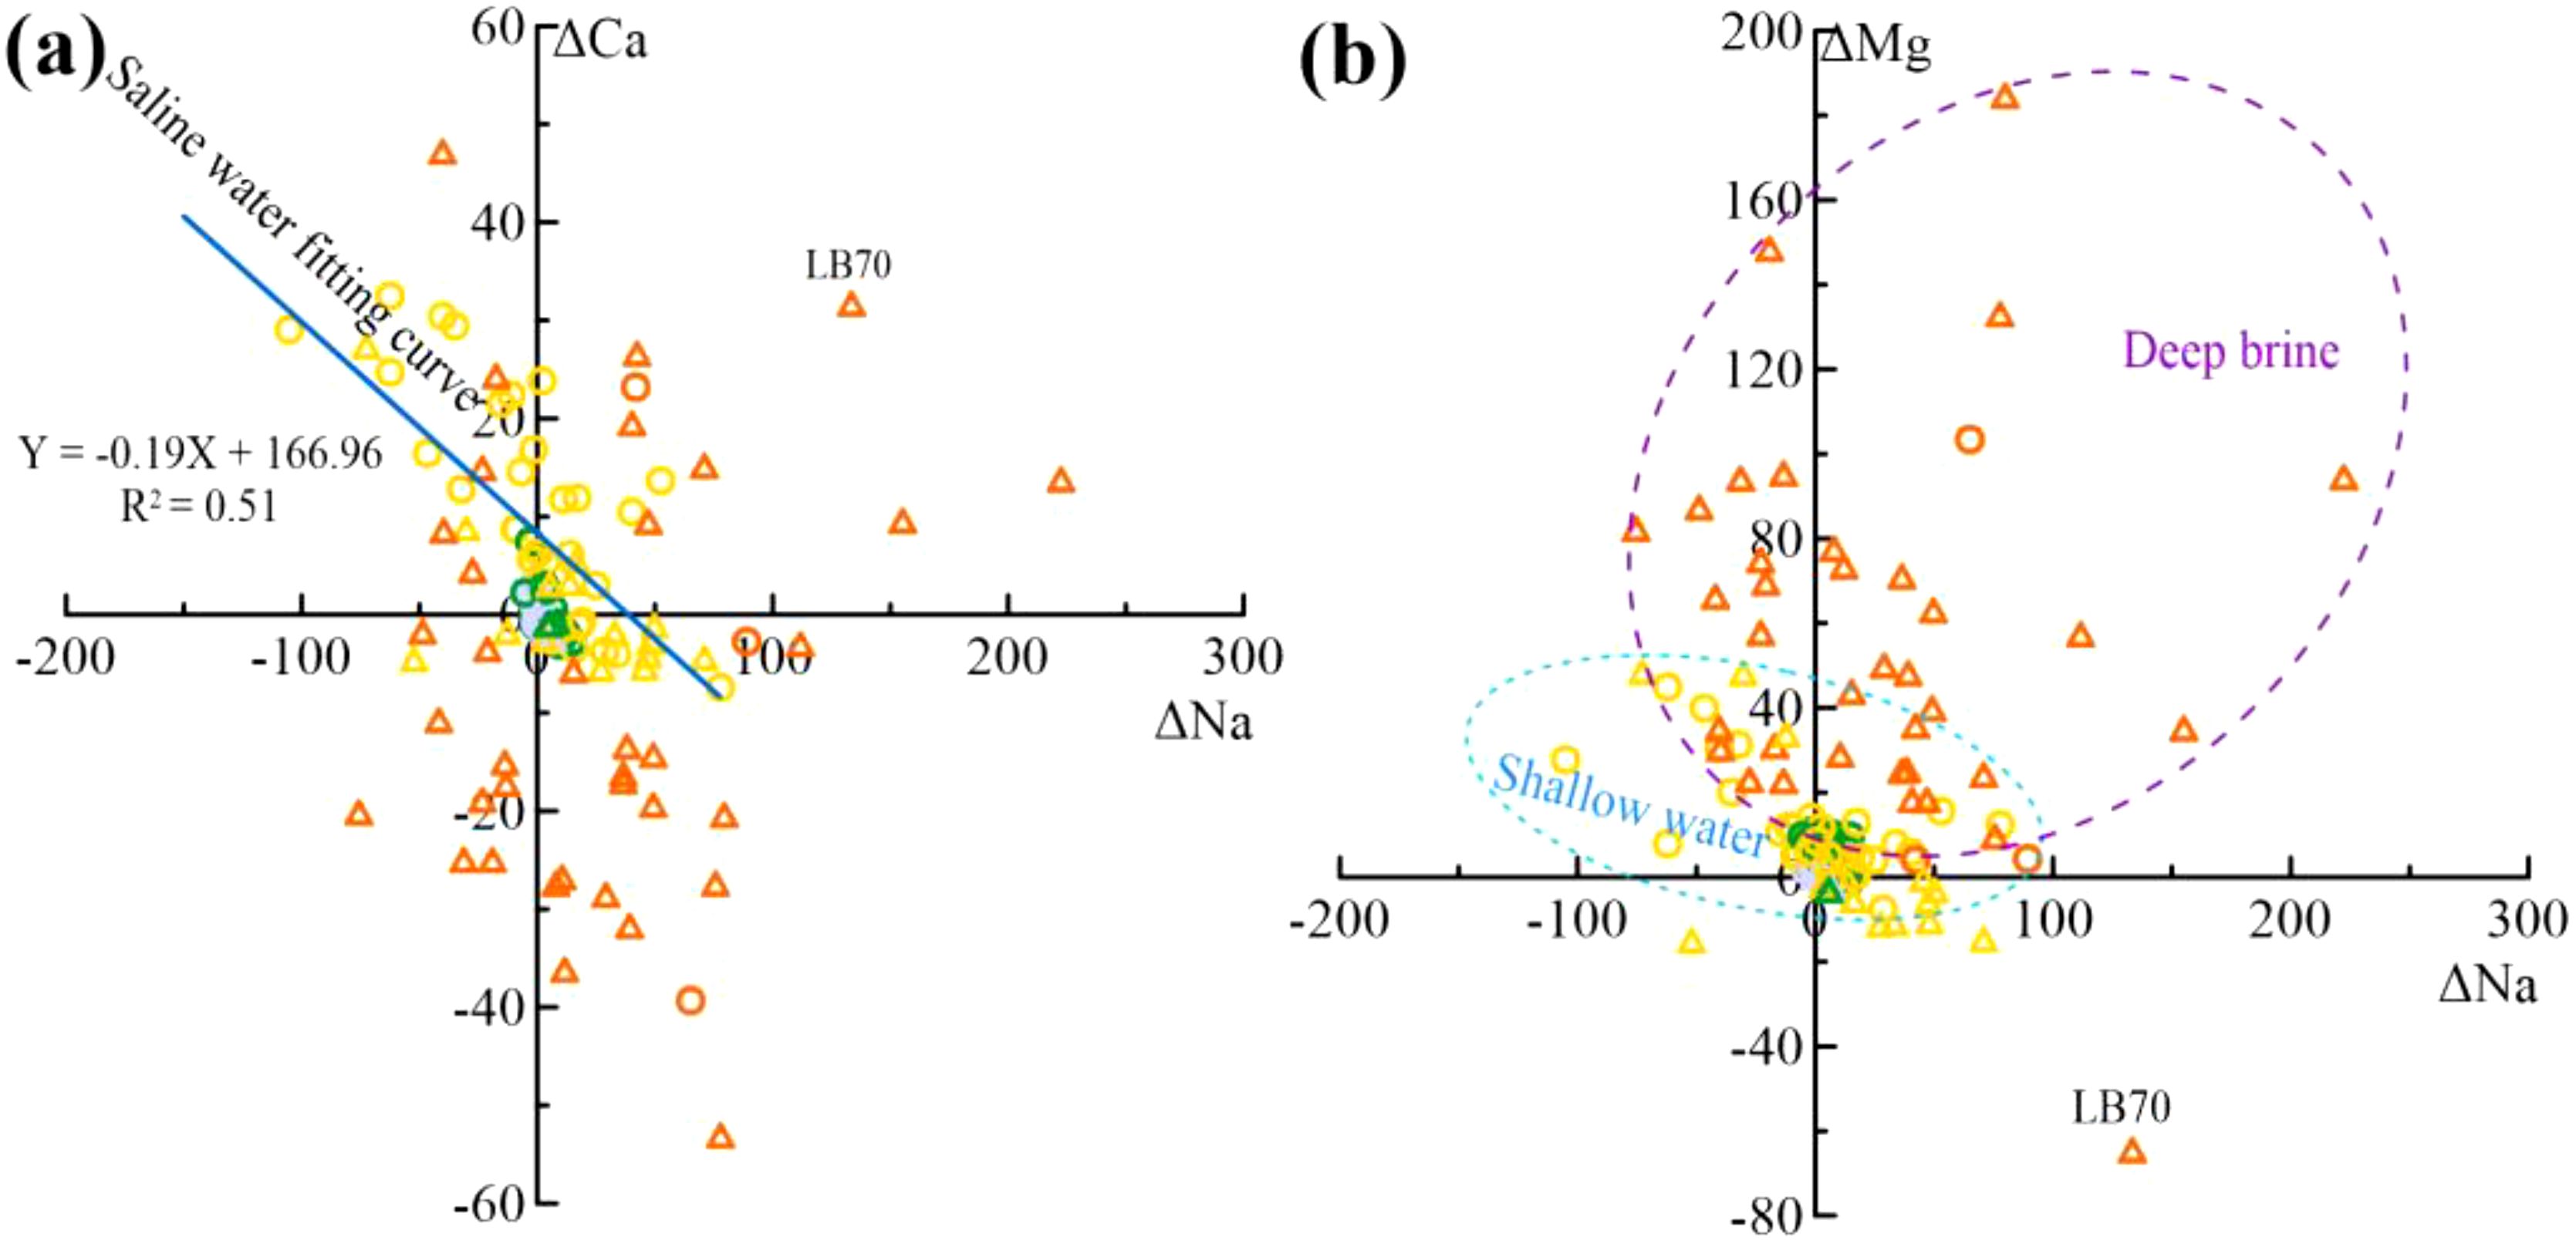
Figure 10. Cation exchange processes (a) Plot of ΔNa vs. ΔCa, (b) Plot of ΔNa vs. ΔMg (symbols are the same as in Figure 2).
4.2.2 Cation exchange
Water–rock interactions involve more than just dissolution and precipitation. Δ values of Na+, Ca2+, and Mg2+ were calculated using the mass balance model.
From Figure 10a, Ca2+ is replaced by Na+ in SHA groundwaters(Equation 5), while DPA groundwaters show the reverse (the reverse of Equation 5). ΔCa< 0 in most brines and DPA saline waters is due to calcite and dolomite precipitation (Figure 8). The fitted curve for the saline water samples was y = –0.19x+166.96 (R2 = 0.51), showing a good correlation between Na+ and Ca2+ ion exchange in saline water. The correlation between Na+ and Ca2+ ion exchange is evident, but Mg2+ also participates (Figure 10b).Most groundwater samples show Mg2+ enrichment (Figure 10b), with Na+ displacing Mg2+ in SHA groundwater (Equation 6). In both SHA and DPA brines, Ca2+ displacing Mg2+ (Equation 7), explaining the low ΔCa in Figure 10a. One sample (LB70) shows Mg2+ is swapped for Na+ (the reverse of Equation 6), leading to elevated Na+ concentrations (Figure 10b).
4.2.3 Sulphate reduction reactions
SHA freshwater and most brackish water show positive ΔSO4 values, indicating sulphate enrichment, while saline and brine water show both enrichment and depletion (Figure 11a). Gypsum dissolution contributes to SO42– enrichment in fresh and brackish water, while gypsum saturation and CaSO4 precipitation lead to SO42– reduction in brines. Most samples diverge from the 1:1 line, suggesting additional processes result in SO42– depletion. The reductive environment due to limited permeability and organic matter in marine sediments favors sulphate reduction reactions (Dang, 2022). The reaction could be represented by the forthcoming (Equation 8):
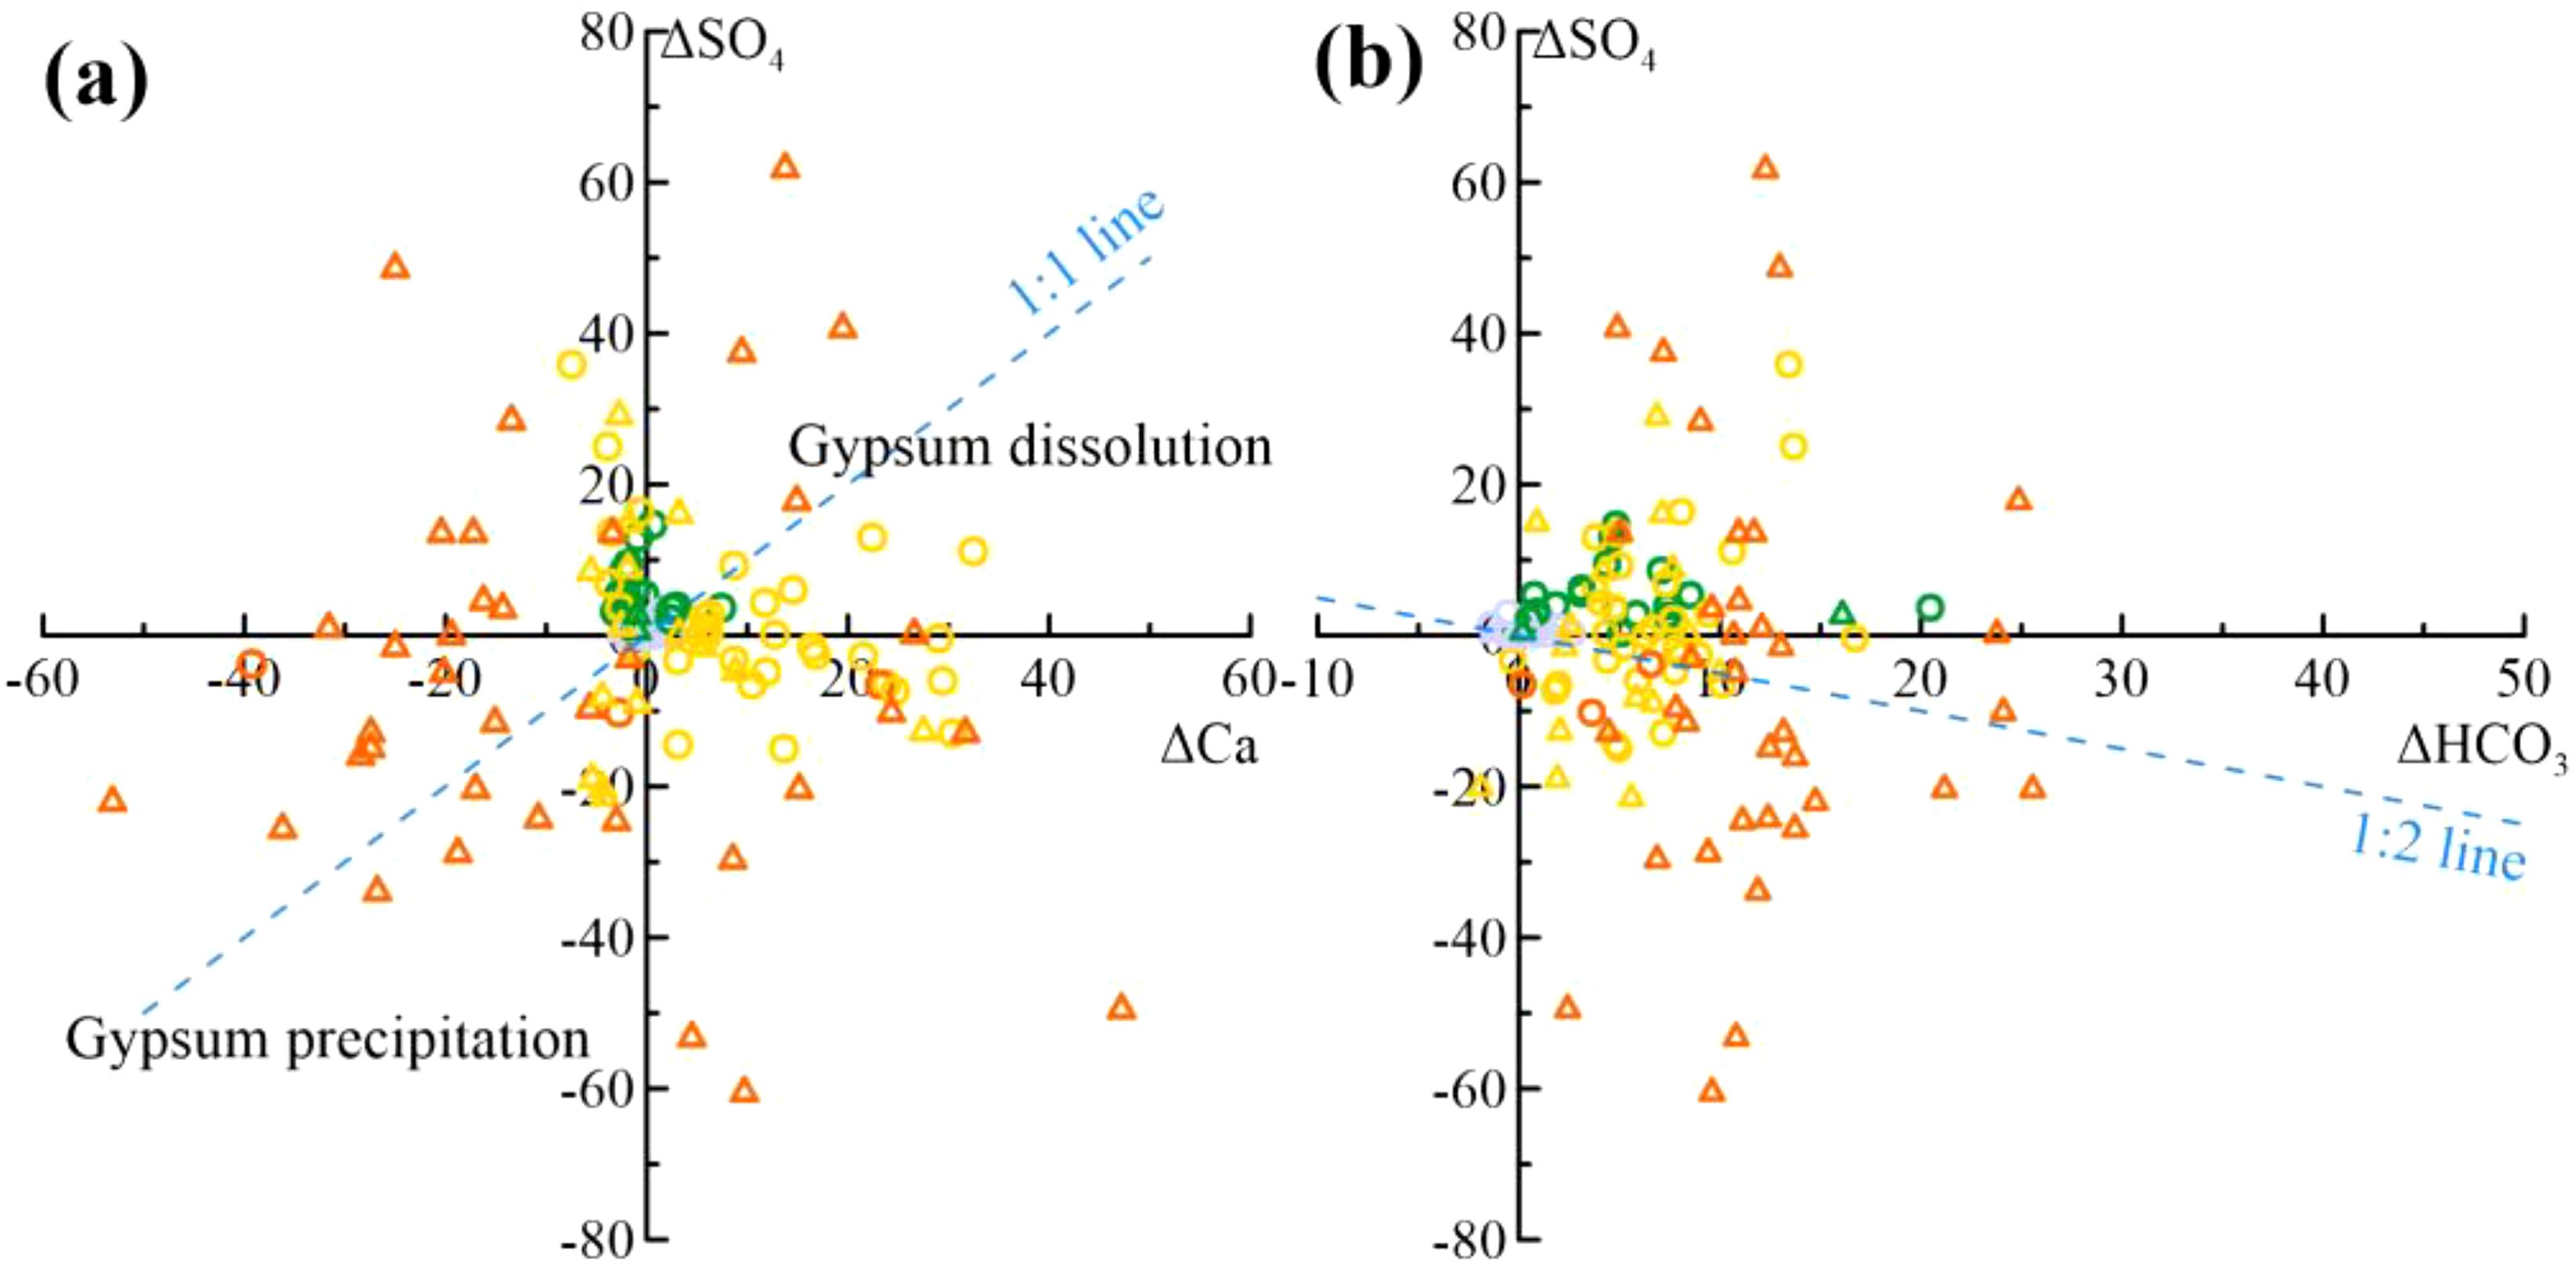
Figure 11. Sulphate Reaction Processes (a) Plot of ΔCa vs. ΔSO4 Relationship (b) Plot of ΔHCO3 vs. ΔSO4 Relationship (Symbols are the same as in Figure 2).
Positive ΔHCO3 values in nearly all samples indicate an excess of HCO3– (Figure 11a). Calcite and dolomite dissolution at lower salinities (Figure 8) explains elevated ΔHCO3 in fresh and brackish waters. High ΔHCO3 in saline and brine waters, especially in DPA brines, supports sulphate reduction reactions. ΔSO4 shows pronounced depletion when superimposed on gypsum precipitation. Moreover, owing to the copious presence of HCO3– in the groundwater, further depletion transpires through precipitation with Ca2+ in the groundwater. This phenomenon sheds light on why most brines in Figure 10a display ΔCa<0. The deviation of samples from the 1:2 line results from the interplay of these processes.
4.3 Hydrogeochemical modelling
In Section 4.2, we discussed the water–rock interactions of groundwater. To further understand these interactions, we conducted inversion simulations to identify hydrochemical reactions and changes in ion concentrations.
We selected three paths along the groundwater flow direction to simulate the south bank of Laizhou Bay and the Huanghe River Delta. The paths in the Laizhou Bay area are Path I (LB30 → LB35), Path II (LB35 → LB73), and Path III (LB73 → LB46). In the Huanghe River Delta, we considered Path IV (HD23 → HD59) and Path V (HD59 → HD62) (Table 2). Given the selected pathways and the hydrogeological background of the study area, we finally selected dolomite, calcite, gypsum, rock salt, quartz, sodium feldspar, potassium feldspar, and cation exchange as the ‘probable mineral phases’ in the Huanghe River delta (Tian et al., 2021), with the additional presence of hematite and pyrite in the Laizhou Bay area (Wang et al., 2023; Li et al., 2021) (Table 3). Dolomite was set to only precipitate, while gypsum and calcite were set to only dissolve. Simulations accounted for cation exchange between Ca2+, Mg2+, and Na+ under seawater intrusion or aquifer renewal conditions. The outcomes were used to analyze CO2 dissolution and release, identifying inorganic carbon sources and sinks. The analysis focused on seven elements: Na+, K+, Ca2+, Mg2+, Cl–, HCO3–, and SO42–.
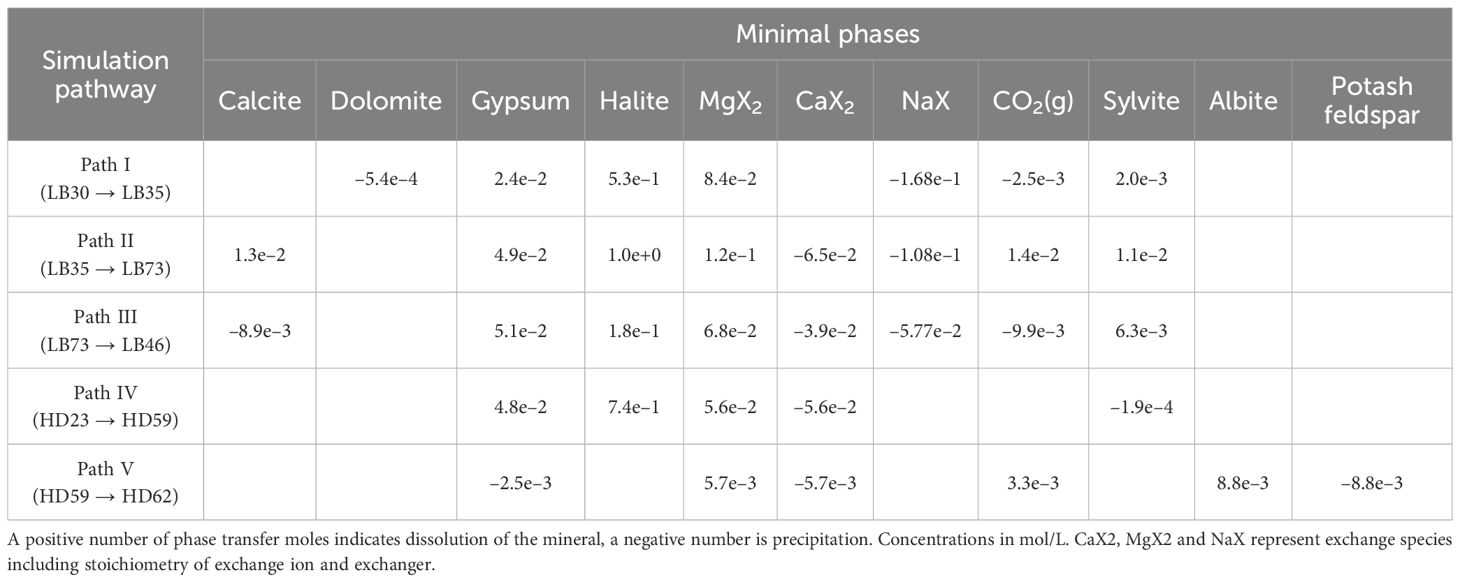
Table 2. Inverse modelling scenarios for mineral assemblage and molar transfer.
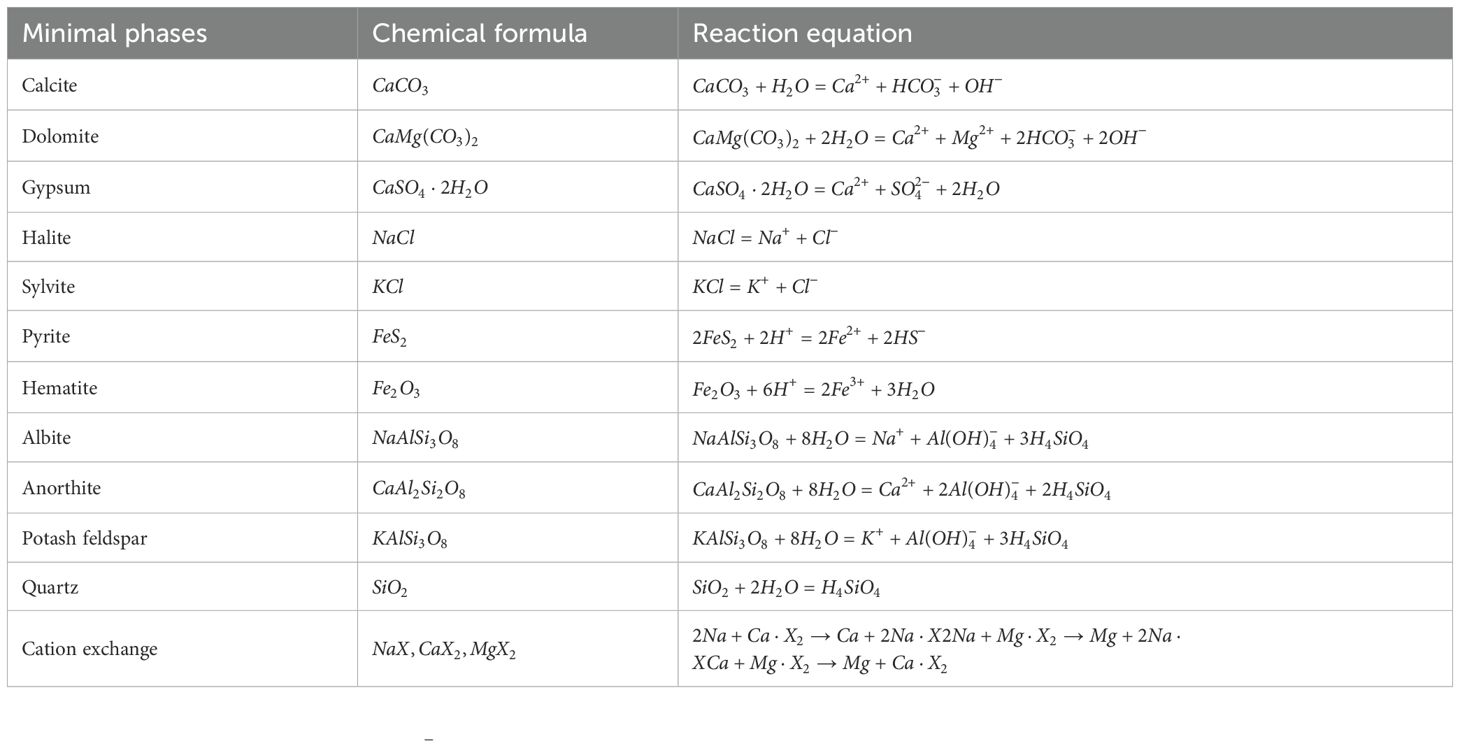
Table 3. Chemical formulae and reaction equations for mineral phases.
The cation exchange involving Na+ replacing Ca2+ or Mg2+, and Ca2+ replacing Mg2+ in all pathways along the south coast of Laizhou Bay aligns with the findings in Section 4.2.2, suggesting active seawater intrusion. In Path I, the transition from freshwater to saltwater involves the dissolution of gypsum, rock salt, and potassium salt, leading to increased ion content, dolomite precipitation, and CO2 release. Despite Ca2+ consumption by dolomite precipitation, Ca2+ concentration in groundwater slightly rises due to gypsum dissolution and Na+ exchange. Path II (from saltwater to brine) and Path III (from brine to brine) exhibit similar patterns, with calcite, gypsum, rock salt, and potassium salt dissolution and CO2 absorption. High Na+ concentration in coastal groundwater triggers Na+ replacement reactions with Ca2+ and Mg2+ in the aquifer. Extensive gypsum dissolution increases calcium ions, enhancing calcite solubility and leading to calcite dissolution.
The Huanghe River Delta includes Path IV (from brackish water to brine) and Path V (from high concentration (TDS content: 121 g/L) brine to low concentration (TDS content: 92 g/L) brine). Path IV involves gypsum dissolution and potassium salt precipitation. Path V involves the dissolution of albite and the precipitation of potassium feldspar, with CO2 absorption. Seawater intrusion at the HD62 sample site leads to albite dissolution and potassium feldspar precipitation, indicating significant interaction between seawater and subsurface brine. Both paths show equal cation exchange between Ca2+ and Mg2+, due to the ionic radius and adsorption energy of Ca2+ in the coastal aquifer, facilitating exchange with clay minerals (Capuano and Jones, 2020). In the saline environment, Na+ and Mg2+ concentrations are elevated, with Na+ being predominant (Qin et al., 2023).
4.4 Cl– vs. Br– relationship
Significant fluctuations in the Br– vs. Cl– ratio in freshwater and brackish water with lower Cl– concentration are noted, influenced by atmospheric precipitation or anthropogenic factors (Figure 5b). Offshore groundwater samples are close to the seawater ratio line, indicating predominant seawater mixing as the source of salinity. The Br–/Cl– ratio is unreliable for identifying salinity sources when TDS is less than 2 g/L (Han et al., 2011). SHA brine and certain brackish waters show lower Br–/Cl– values compared to seawater, enclosed within the black dashed line of the study region, which is due to the significant increase in Cl– concentration from the dissolution of rock salt. Highly mineralized SHA brine and Deep–upper brine (LZ) show a linear decrease in Br–/Cl– with increasing Cl–.
Typically, the Br–/Cl– ratio stays consistent during seawater evaporation, that is, as groundwater salinity intensifies (Bottomley et al., 1994; Vengosh and Hendry, 2001), until it reaches rock salt saturation. Underground brine samples from the Huanghe River Delta, particularly the DPA brine, exhibit larger Br–/Cl– ratios, exceeding those of the seawater ratio line. This suggests that they may have passed the rock salt saturation stage, advancing towards the lagoonal salt saturation phase, which could have prompted Cl– precipitation in water, followed by mixing with freshwater, subsequently reducing salinity. Deep–lower brine (LZ) samples within the red dotted line, located along the river–adjacent coastal, with a burial depth of 80~200m, possess higher Br–/Cl–. This could be attributed to the decomposition of organic matter within the marine layer of the DPA groundwater.
4.5 HFE–diagram analysis
The HFE–Diagram analysis confirms that groundwater salinity is high (within a 20 km radius from the coastline), with significant seawater intrusion. The mineralization of SHA and DPA groundwater decreases with desalination and increases with seawater intrusion inFigure 12. Brine samples cluster near the end stages of intrusion. The desalination endpoints in SHA align with LB01 (Figure 12a), and in DPA with LB32 (Figure 12b), consistent with previous mixing process findings in Figure 6. In SHA, 63.77% of samples undergo desalination and 36.23% intrusion, with Na–Cl as the predominant phase (55.07%). This reflects the influence of shallow water controlled by hydrologic cycle processes and surface water recharge. In DPA, 79.31% of samples experience intrusion and 20.69% desalination, with Na–Cl being most abundant (89.66%). The DPA groundwater, on the other hand, is predominantly saline, which is controlled by tectonic conditions of confinement and rock salt dissolution. Extensive groundwater extraction has impacted both quantity and quality (Currell et al., 2012), but most samples show a trend towards seawater intrusion, reflecting global coastal aquifer trends (Ri et al., 2022; Azari and Tabari, 2024).
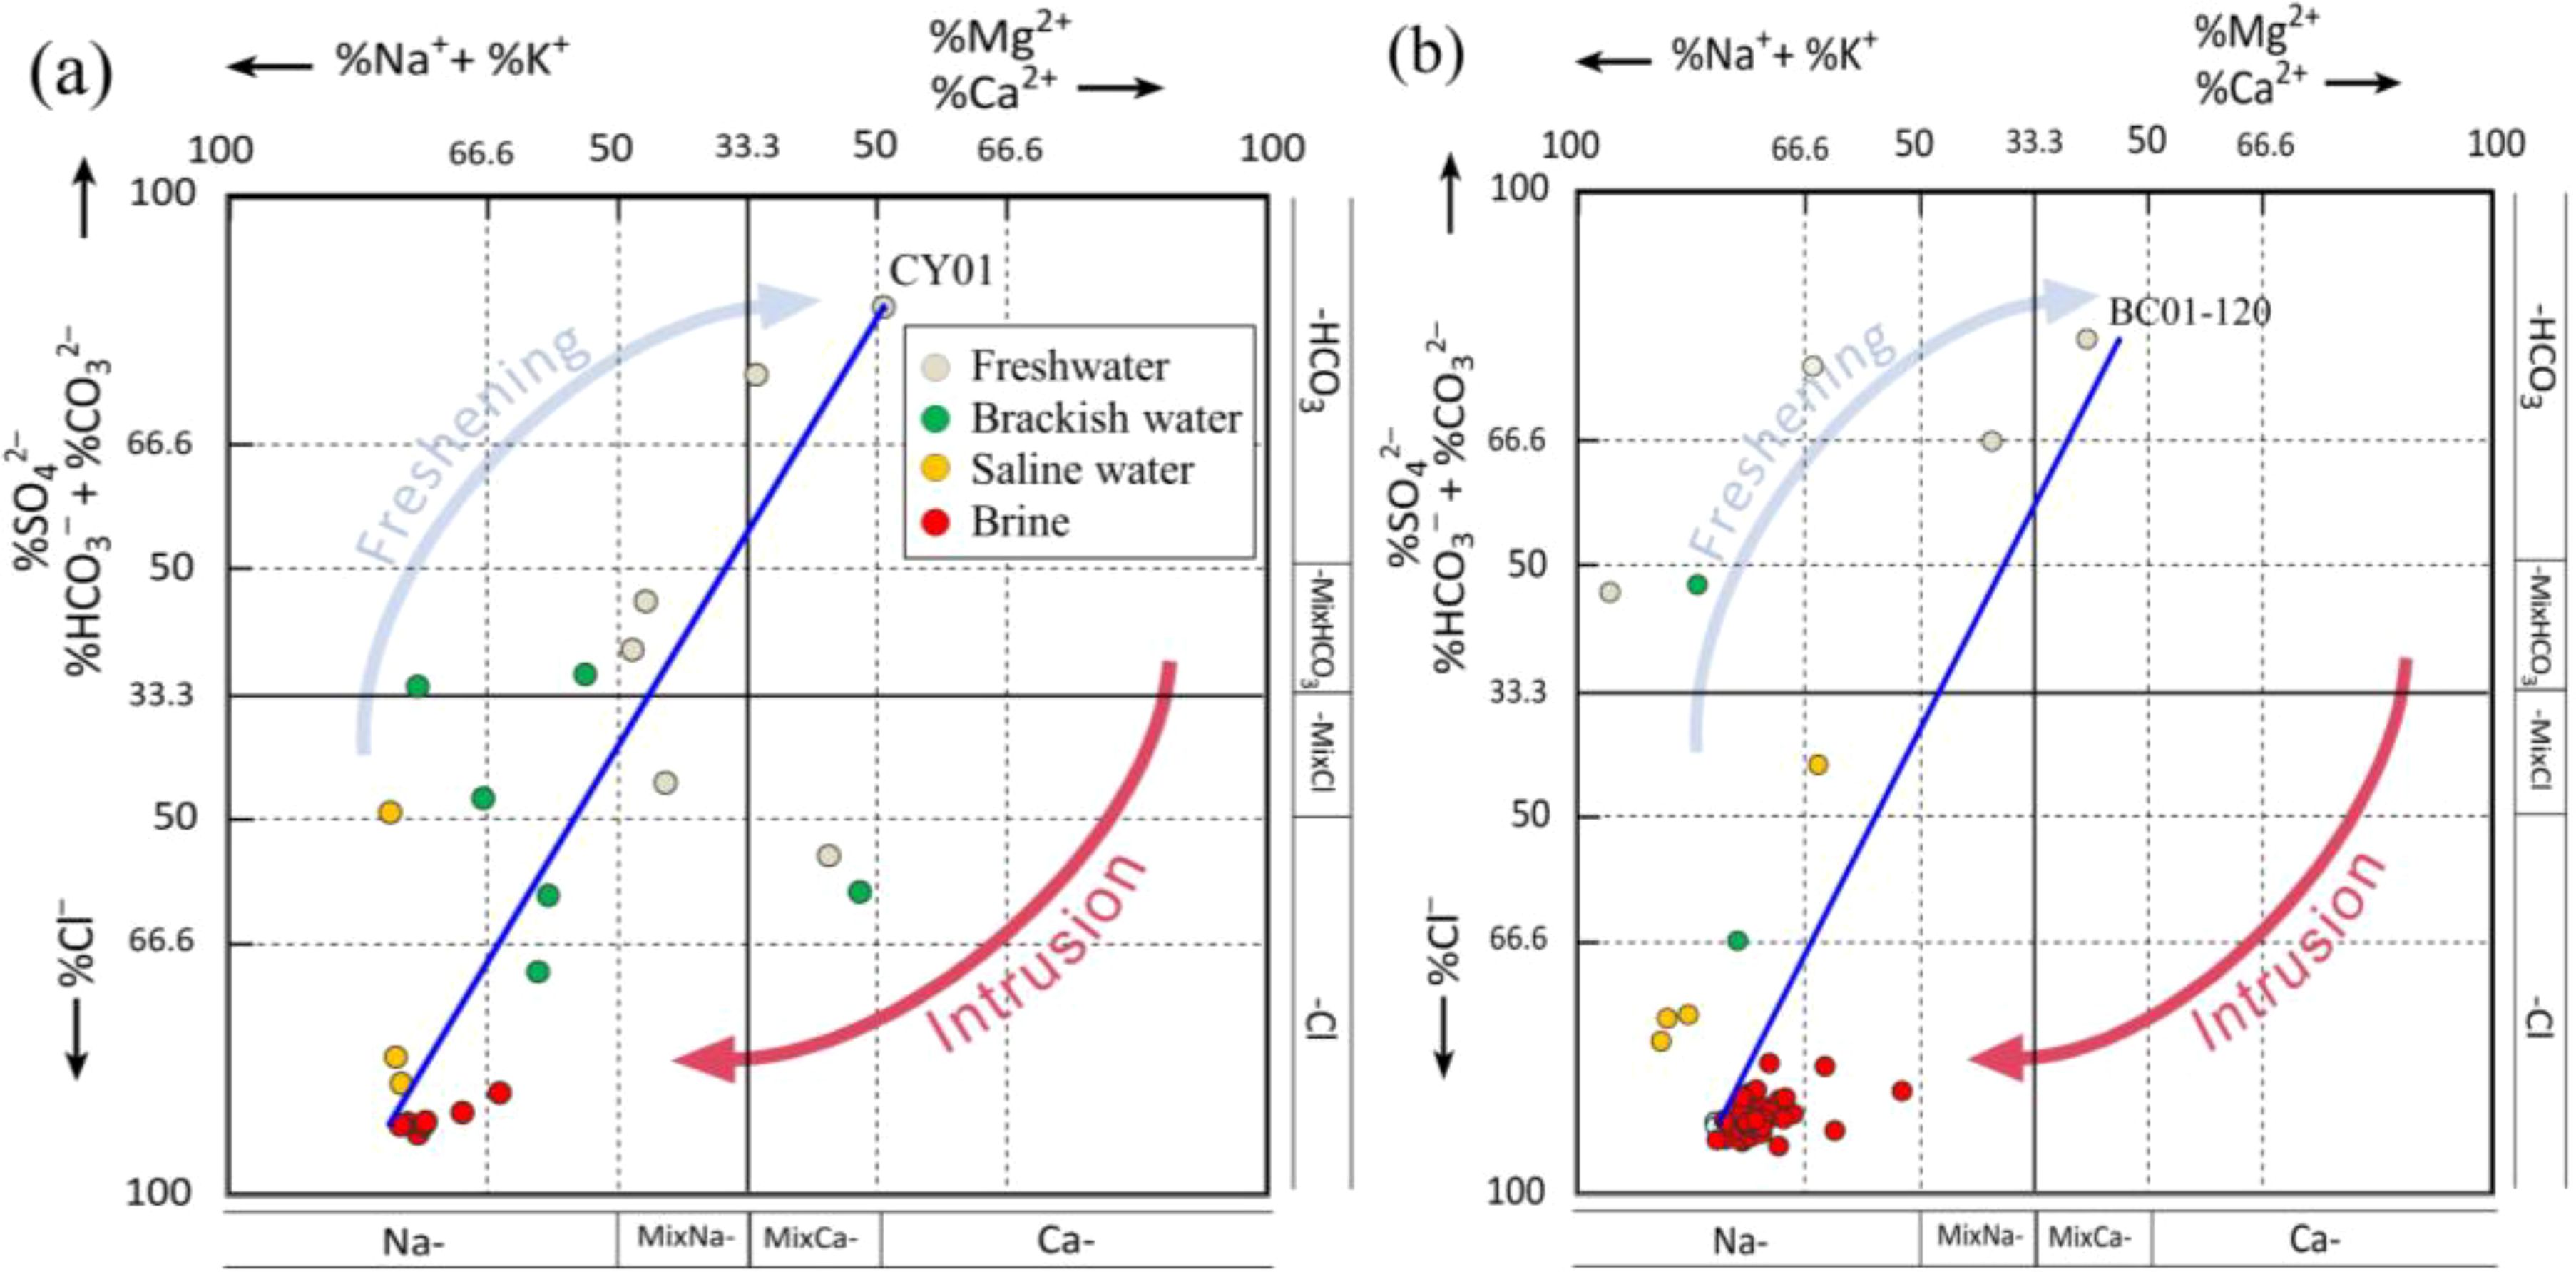
Figure 12. Groundwater hydrochemical phase evolution (a) SHA groundwater hydrochemical phase evolution (b) DPA hydrochemical phase evolution.
5 Conclusions
This study uses hydrogeochemical and environmental isotope methods to examine the mixing processes of groundwater in the muddy coastal region of northern Shandong. We integrated a mass balance model with hydrogeochemical simulations to explore processes such as mineral dissolution, precipitation, ion exchange, and reduction reactions. The research enhances understanding of salinization and desalination in coastal aquifers, contributing to global coastal aquifer management.
1. The study area’s groundwater shows diverse quality types: freshwater, brackish water, saline water, and brine. Freshwater chemistry stems from mineral dissolution, brackish water from rock weathering and seawater mixing, and brine water from early evaporation and concentration. Both SHA and DPA aquifers are affected by seawater intrusion, with high Cl- and Na+ concentrations, especially in DPA.
2. A three-component mixing model of freshwater, brine, and seawater was identified, estimating their relative contributions. This model offers a new reference for studying coastal groundwater formation. SHA groundwater mixing is complex, with recent formation and short-lived processes, making it susceptible to quality changes. Isotope analyses show that the SHA and DPA groundwater is recharged by precipitation and river infiltration. Concentrated brines originate from low-isotopic-abundance atmospheric water, which leads to δ¹8O and δ²H depletion in the brines.
3. There are significant differences in groundwater hydrochemistry, ion composition, isotopic characteristics and environmental impacts between Laizhou Bay’s south coast and the Huanghe River Delta. Laizhou Bay’s SHA aquifer shows HCO3–Ca and Cl–SO4–Ca–Mg types, while its DPA aquifer is dominated by HCO3–Ca and HCO3–Ca–Na types. The Huanghe River Delta’s SHA aquifer is primarily Cl–Na, and its DPA aquifer contains Cl–Na and Cl–Na–Mg types. Laizhou Bay’s SHA aquifer has higher calcium and magnesium, while the Huanghe River Delta’s DPA aquifer has significant sodium. The isotopic signatures of Laizhou Bay’s SHA aquifer show high variability, indicating diverse water sources and processes, while the Huanghe River Delta’s DPA aquifer shows stable signatures similar to Huanghe River water, indicating riverine contribution. These differences highlight the distinct hydrogeological conditions and evolution histories of the two regions.
4. The study also investigated the distribution and genesis of groundwater brines. The brine layer along Laizhou Bay’s south coast shows clear stratification, divided into SPA brine, DPA shallow brine, and DPA deep brine. The Br- vs. Cl- ratio in DPA deep–upper brine decreases linearly with Cl- concentration, indicating salinity from evaporated seawater salt dissolution. The Huanghe River Delta’s brines are divided into two layers: SHA brine in the Xiaoqing River estuary’s north and DPA brine associated with the Huanghe River channel aquifer, strongly mixed by early river recharge. Data support that brine formation relates to seawater evaporation and sedimentation, providing a basis for understanding regional groundwater brine distribution and mechanisms. Future studies should focus on isotopic and hydrogeochemical processes to elucidate the groundwater system’s evolutionary history.
5. Most groundwater shows a seawater intrusion trend. Mineralization decreases with desalination and increases with intrusion. The highest HFE–diagram for SHA groundwater is Na–Cl (55.07%), with 63.77% undergoing desalination and 36.23% intrusion. For DPA groundwater, the highest HFE–diagram is also Na–Cl (89.66%), with 79.31% intrusion and 20.69% desalination, which is controlled by tectonic conditions of confinement and rock salt dissolution.
Data availability statement
The raw data supporting the conclusions of this article will be made available by the authors, without undue reservation.
Author contributions
ZL: Formal Analysis, Writing – original draft, Data curation, Methodology, Writing – review & editing, Investigation, Conceptualization, Software. MG: Supervision, Writing – review & editing, Methodology, Funding acquisition, Investigation, Visualization, Validation, Resources, Project administration. LW: Writing – review & editing, Validation, Methodology, Visualization. QS: Investigation, Writing – review & editing, Software, Formal Analysis. XC: Investigation, Software, Methodology, Writing – review & editing. GH: Methodology, Investigation, Writing – review & editing, Visualization. MW: Investigation, Visualization, Writing – review & editing, Supervision.
Funding
The author(s) declare that financial support was received for the research and/or publication of this article. National Natural Science Foundation of China (U2106203,41977173) National Geological Survey Project of China Geology Survey (No. DD20221775, DD20211401)China-ASEAN maritime cooperation fund (Cooperative researches on the marine geo-environments and geo-hazards in the Yangtze River and the Red River deltas)
Conflict of interest
The authors declare that the research was conducted in the absence of any commercial or financial relationships that could be construed as a potential conflict of interest.
Generative AI statement
The author(s) declare that no Generative AI was used in the creation of this manuscript.
Publisher’s note
All claims expressed in this article are solely those of the authors and do not necessarily represent those of their affiliated organizations, or those of the publisher, the editors and the reviewers. Any product that may be evaluated in this article, or claim that may be made by its manufacturer, is not guaranteed or endorsed by the publisher.
References
Aghazadeh N., Chitsazan M., and Golestan Y. (2017). Hydrochemistry and quality assessment of groundwater in the Ardabil area, Iran. Appl. Water Sci. 7, 3599–3616. doi: 10.1007/s13201–016–0498–9
Andersen M. S., Jakobsen V. N. R., and Postma D. (2005). Geochemical processes and solute transport at the seawater/freshwater interface of a sandy aquifer. Geochimica Cosmochimica Acta 69, 3979–3994. doi: 10.1016/j.gca.2005.03.017
Azari T. and Tabari M. M. R. (2024). An integrated approach based on HFE-D, GIS techniques, GQI SWI, and statistical analysis for the assessment of potential seawater intrusion: coastal multilayered aquifer of Ghaemshahr-Juybar (Mazandaran, Iran). Environ. Sci. pollut. Res. 31, 13335–13371. doi: 10.1007/s11356-024-31967-1
Befus K. M., Barnard P. L., Hoover D. J., Finzi Hart J. A., and Voss ,. C. I. (2020). Increasing threat of coastal groundwater hazards from sea–level rise in California. Nat. Climate Change 10, 946–952. doi: 10.1038/s41558–020–0874–1
Bottomley D. J., Gregoire D. C., and Raven K. G. (1994). Saline ground waters and brines in the Canadian Shield: geochemical and isotopic evidence for a residual evaporite brine component. Geochimica Cosmochimica Acta 58, 1483–1498. doi: 10.1016/0016–7037(94)90551–7
Cao T., Han D., Song X., and Trolle D. (2020). Subsurface hydrological processes and groundwater residence time in a coastal alluvium aquifer: Evidence from environmental tracers (δ18O, δ2H, CFCs, 3H) combined with hydrochemistry. Sci. Total Environ. 743, 140684. doi: 10.1016/j.scitotenv.2020.140684
Cao W., Zhang Z., Guo H., Fu Y., Gao Z., Nan T., et al. (2022). Spatial distribution and controlling mechanisms of high fluoride groundwater in the coastal plain of Bohai Rim, North China. J. Hydrology 617, 128952. doi: 10.1016/j.jhydrol.2022.128952
Capuano R. M. and Jones C. R. (2020). Cation exchange in groundwater-chemical evolution and prediction of paleo-groundwater flow: A natural-system study. Water Resour. Res. 56, e2019WR026318. doi: 10.1029/2019WR026318
Cary L., Petelet–Giraud E., Bertrand G., Kloppmann W., Aquilina L., Martins V., et al. (2015). Origins and processes of groundwater salinization in the urban coastal aquifers of Recife (Pernambuco, Brazil): A multi–isotope approach. Sci. Total Environ. 530, 411–429. doi: 10.21203/rs.3.rs–681419/v1
Chen Y. (1983). Sequence of salt separation and regularity of some trace elements distribution during isothermal evaporation (25°C) of the Huanghai sea water. Acta Geologica Sin. 4, 379–390. doi: 10.19762/j.cnki.dizhixuebao.1983.04.006
Chen Y., Li W., Deng H., Fang G., and Li Z. (2016). Changes in Central Asia’s water tower: past, present and future. Sci. Rep. 6, 35458. doi: 10.1201/b10801–6
Chen Q., Liu C., Lu H., Wang G., and Li G. (2002). Character of sedimentary sequence and structural settlement of shallow layers in the Yellow River Delta. Geotectonica Metallogenia 04), 386–389. doi: 10.16539/j.ddgzyckx.2002.04.007
Chen Q., Wei J. C., Jia C. P., Wang H. M., Shi L. Q., Liu S. L., et al. (2019). Groundwater selenium level and its enrichment dynamics in seawater intrusion area along the northern coastal zones of Shandong Province, China. Geochemistry Int. 57, 1236–1242. doi: 10.1134/S0016702919110065
Chen G., Xiong G., Lin J., Xu X., Yu H., Liu W., et al. (2021). Elucidating the pollution sources and groundwater evolution in typical seawater intrusion areas using hydrochemical and environmental sta ble isotope technique: A case study for Shandong Province, China. Lithosphere 2021, 4227303. doi: 10.2113/2021/4227303
Clark I. D. and Fritz P. (2013). Environmental isotopes in hydrogeology (CRC press). doi: 10.1201/9781482242911
Craig H. (1961). Standard for reporting concentration of deuterium and oxygen–18 in natural water. Science 133, 1833–1834. doi: 10.1126/science.133.3467.1833
Currell M. J., Han D., Chen Z., and Cartwright I. (2012). Sustainability of groundwater extraction in northern China: dependence on palaeowaters and effects on water quality, quantity and ecosystem health. Hydrological Processes 26, 4050–4066. doi: 10.1016/j.gca.2005.03.017
Dang X. (2022). The formationandevolutionmechanismofsalinegroundwatersince Holocene inLuanheRiverDelta,China.Doctordissertation. China University of Geosciences (Wuhan). doi: 10.27492/d.cnki.gzdzu.2022.000142
De Montety V., Radakovitch O., Vallet–Coulomb C., Blavoux B., Hermitte D., and Valles V. (2008). Origin of groundwater salinity and hydrogeochemical processes in a confined coastal aquifer: case of the Rhône delta (Southern France). Appl. Geochemistry 23, 2337–2349. doi: 10.1016/j.apgeochem.2008.03.011
Edmunds W. M., Ma J., Aeschbach-Hertig W., Kipfer R., and Darbyshire D. P. F.. (2006). Groundwater recharge history and hydrogeochemical evolution in the Minqin Basin, North West China. Applied geochemistry. 2112, 2148–2170. doi: 10.1016/j.apgeochem.2006.07.01
Eissa M. A., Thomas J. M., Pohll G., Shouakar–Stash O., Hershey R. L., and Dawoud M. (2016). Groundwater recharge and salinization in the arid coastal plain aquifer of the Wadi Watir delta, Sinai, Egypt. Appl. geochemistry 71, 48–62. doi: 10.1016/j.apgeochem.2016.05.017
Fan H., Huang H., Zeng T., and Wang K. (2006). River mouth bar formation, riverbed aggradation and channel migration in the modern Huanghe (Yellow) River delta, China. Geomorphology 74, 124–136. doi: 10.1016/j.geomorph.2005.08.015
Flaux C., Claude C., Marriner N., and Morhange C. (2013). A 7500–year strontium isotope record from the northwestern Nile delta (Maryut lagoon, Egypt). Quaternary Sci. Rev. 78, 22–33. doi: 10.1016/j.quascirev.2013.06.018
Foster S. S. D. and Chilton P. J. (2003). Groundwater: the processes and global significance of aquifer degradation. Philosophical Transactions of the Royal Society of London. Ser. B: Biol. Sci. 358, 1957–1972. doi: 10.1098/rstb.2003.1380
Frank T. D. and Gui Z. (2010). ANDRILL SMS Science Team., Cryogenic origin for brine in the subsurface of southern McMurdo Sound, Antarctica. Geology 38, 587–590. doi: 10.1130/g30849.1
Gao Z., Han C., Xu Y., Zhao Z., Luo Z., and Liu J. (2021). Assessment of the water quality of groundwater in Bohai Rim and the controlling factors—a case study of northern Shandong Peninsula, north China. Environ. pollut. 285, 117482. doi: 10.1016/j.envpol.2021.117482
Gao M., Hou G., and Guo F. (2016). Conceptual model of underground brine formation in the silty coast of Laizhou Bay, Bohai Sea, China. J. Coast. Res. 74), 157–165. doi: 10.2112/si74–015.1
Gao M., Sun Q., Dang X., Hou G., Guo F., Liu Z., et al. (2023). Hydrogeochemical characteristic and recognization of saline groundwater formation and evolution in silty coast of the Yellow Sea and Bohai Sea, Eastern China. Front. Earth Sci. 11. doi: 10.3389/feart.2023.1186661
Gao M., Zheng Y., Liu S., Wang S., Kong X., Zhao J., et al. (2015). Palaeogeographic condition for origin of underground brine in southern coast of Laizhou bay, Bohai sea. Geological Rev. 02), 393–400. doi: 10.16509/j.georeview.2015.02.015
Giambastiani B. M. S., Colombani N., Mastrocicco M., and Fidelibus M. D. (2013). Characterization of the lowland coastal aquifer of Comacchio (Ferrara, Italy): hydrology, hydrochemistry and evolution of the system. J. Hydrology 501, 35–44. doi: 10.1016/j.jhydrol.2013.07.037
Giménez–Forcada E. (2010). Dynamic of sea water interface using hydrochemical facies evolution diagram. Groundwater 48, 212–216. doi: 10.1111/j.1745–6584.2009.00649.x
Giménez–Forcada E. (2014). Space/time development of seawater intrusion: A study case in Vinaroz coastal plain (Eastern Spain) using HFE–Diagram, and spatial distribution of hydrochemical facies. J. Hydrology 517, 617–627. doi: 10.1016/j.jhydrol.2014.05.056
Gonneea M. E., Mulligan A. E., and Charette M. A. (2013). Climate-driven sea level anomalies modulate coastal groundwater dynamics and discharge. Geophysical Res. Lett. 40, 2701–2706. doi: 10.2112/si74–015.1
Guo F., Gao M., Hou G., Kong X., Zhao J., and Zheng Y. (2016). Zhao, G.: Geochemical characteristics of sediment in Core 07 since the late Pleistocene in Laizhou Bay. HaiyangXuebao 38 , 144–155. doi: 10.3969/j.issn.0253-4193.2016.03.014
Han D. and Currell M. J. (2022). Review of drivers and threats to coastal groundwater quality in China. Sci. Total Environ. 806, 150913. doi: 10.1016/j.scitotenv.2021.150913
Han D., Kohfahl C., Song X., Xiao G., and Yang J. (2011). Geochemical and isotopic evidence for palaeo–seawater intrusion into the south coast aquifer of Laizhou Bay, China. Appl. Geochemistry 26, 863–883. doi: 10.1016/j.apgeochem.2011.02.007
Han D., Song X., Currell M. J., Yang J., and Xiao G. (2014). Chemical and isotopic constraints on evolution of groundwater salinization in the coastal plain aquifer of Laizhou Bay, China. J. Hydrology 508, 12–27. doi: 10.1016/j.jhydrol.2013.10.040
Han M., Zhang W., Li Y., and Zhang L. (2002). Formation and change of ancientlake on south coast plain of laizhou bay. Scientia Geographica Sin. 22, 430–435. doi: 10.1080/10042857.2005.10677436
He Q. and Silliman B. R. (2019). Climate change, human impacts, and coastal ecosystems in the Anthropocene. Curr. Biol. 29, R1021–R1035. doi: 10.1016/j.cub.2019.08.042
Horita J. (2005). Some perspectives on isotope biosignatures for early life. Chem. Geology 218, 171–186. doi: 10.1016/j.chemgeo.2005.01.017
Hussain M., Al–Shaibani A., Al–Ramadan K., and Wood W. W. (2020). Geochemistry and isotopic analysis of brines in the coastal sabkhas, Eastern region, Kingdom of Saudi Arabia. J. arid environments 178, 104142. doi: 10.1016/j.jaridenv.2020.104142
IAEA/WMO (2006). Statistical treatment of isotope data in precipitation. International Atomic Energy Agency. IAEA. Available at: https://www.iaea.org/services/networks/gnip.
Jahnke C., Wannous M., Troeger U., Falk M., and Struck U. (2019). Impact of seawater intrusion and disposal of desalinization brines on groundwater quality in El Gouna, Egypt, Red Sea Area. Process analyses by means of chemical and isotopic signatures. Appl. geochemistry 100, 64–76. doi: 10.1016/j.apgeochem.2018.11.001
Jayathunga K., Diyabalanage S., Frank A. H., Chandrajith R., and Barth J. A. (2020). Influences of seawater intrusion and anthropogenic activities on shallow coastal aquifers in Sri Lanka: evidence from hydrogeochemical and sta ble isotope data. Environ. Sci. pollut. Res. 27, 23002–23014. doi: 10.1007/s11356–020–08759–4
Jiao J. and Post V. (2019). Coastal hydrogeology (Cambridge University Press). doi: 10.1017/9781139344142
Kwon E., Park J., Lee J. M., Kim Y. T., and Woo N. C. (2020). Spatiotemporal changes in hydrogeochemistry of coastal groundwater through the construction of underground disposal facility for low and intermediate level radioactive wastes in Korea. J. hydrology 584, 124750. doi: 10.1016/j.jhydrol.2020.124750
Kwong H. T. and Jiao J. (2016). Hydrochemical reactions and origin of offshore relatively fresh pore water from core samples in Hong Kong. J. hydrology 537, 283–296. doi: 10.1016/j.jhydrol.2016.03.050
Lambrakis N. (2006). Multicomponent heterovalent chromatography in aquifers. Modelling salinization and freshening phenomena in field conditions. J. Hydrology 323, 230–243. doi: 10.1016/j.jhydrol.2005.09.002
Li J., Gong X., Liang X., Liu Y., Yang J., Meng X., et al. (2021). Salinity evolution of aquitard porewater associated with transgression and regression in the coastal plain of Eastern China. J. Hydrology 603, 127050. doi: 10.1016/j.jhydrol.2021.127050
Liu F., Song X., Yang L., Han D., Zhang Y., Ma Y., et al. (2015). The role of anthropogenic and natural factors in shaping the geochemical evolution of groundwater in the Subei Lake basin, Ordos energy base, Northwestern China. Sci. Total Environ. 538, 327–340. doi: 10.1016/j.scitotenv.2015.08.057
Liu S., Tang Z., and Gao M. (2017). Hou, G.: Evolutionary process of saline–water intrusion in Holocene and Late Pleistocene groundwater in southern Laizhou Bay (586–599: Science of the Total Environment 607). doi: 10.1016/j.scitotenv.2017.06.262
Liu F., Zou J., Liu J., Zhang J., and Zhen P. (2022). Factors controlling groundwater chemical evolution with the impact of reduced exploitation. Catena 214, 106261. doi: 10.1016/j.catena.2022.106261
MacDonald A. M., Bonsor H. C., Ahmed K. M., Burgess W. G., Basharat M., Calow R. C., et al. (2016). Groundwater quality and depletion in the Indo–Gangetic Basin mapped from in situ observations. Nat. Geosci. 9, 762–766. doi: 10.1038/ngeo2791
Martínez-Pérez L., Luquot L., Carrera J., Marazuela M. A., Goyetche T., Pool M., et al. (2022). A.: multidisciplinary approach to characterizing coastal alluvial aquifers to improve understanding of seawater intrusion and submarine groundwater discharge. J. Hydrology 607, 127510. doi: 10.1016/j.jhydrol.2022.127510
Mastrocicco M., Gervasio M. P., Busico G., and Colombani N. (2021). Natural and anthropogenic factors driving groundwater resources salinization for agriculture use in the Campania plains (Southern Italy). Sci. Total Environ. 758, 144033. doi: 10.1016/j.scitotenv.2020.144033
Michael H. A., Mulligan A. E., and Harvey C. F. (2005). Seasonal oscillations in water exchange between aquifers and the coastal ocean. Nature 436, 1145–1148. doi: 10.1038/nature03935
Michael H. A., Russoniello C. J., and Byron L. A. (2013). Global assessment of vulnerability to sea-level rise in topography-limited and recharge-limited coastal groundwater systems. Water Resour. Res. 49, 2228–2240. doi: 10.1002/wrcr.20213
Nofal E. R., Amer M. A., El–Didy S. M., and Fekry A. M. (2015). Sea water intrusion in Nile Delta in perspective of new configuration of the aquifer heterogeneity using the recent stratigraphy data. J. Am. Sci. 11, 281–292. doi: 10.1016/j.wsj.2015.11.003
Qin Z., Li Q., Li W., Fan Q., Chen T., Wu C., et al. (2023). Elemental variations and mechanisms of brines in the context of large–scale exploitation: A case study of xitaijnar salt lake, qaidam basin. Aquat. Geochemistry 30 (3), 121–141. doi: 10.1007/s10498–023–09419–y
Ren Z., Yu J., Wang Q., Zhan C., Geng W., Cao Y., et al. (2023). On the change of coastline and underwater terrain of the southern Laizhou Bay since 1958. Mar. Geology Front. 11), 1–12. doi: 10.16028/j.1009-2722.2022.207
Ri M., Guo H., Kim P., Ri K., and Ri G. (2022). Influence of seawater intrusion on the hot springs in a coastal area: The case of the Anak-Sinchon Uplift, Korean Peninsula. J. Hydrology 607, 127509. doi: 10.1016/j.jhydrol.2022.127509
Saeed W., Shouakar-Stash O., Wood W. W., and Frape S. (2021). Isotopically enriched geogenic δ81Br and δ37Cl: primary evidence for the ascending brine model. Groundwater 59, 671–676. doi: 10.1111/gwat.13096
Sheng D., Meng X., Wen X., Wu J., Yu H., Wu M., et al. (2023). Hydrochemical characteristics, quality and health risk assessment of nitrate enriched coastal groundwater in northern China. J. Cleaner Production 403, 136872. doi: 10.1016/j.jclepro.2023.136872
Sivan O., Yechieli Y., Herut B., and Lazar B. (2005). Geochemical evolution and timescale of seawater intrusion into the coastal aquifer of Israel. Geochimica Cosmochimica Acta 69, 579–592. doi: 10.1016/j.gca.2004.07.023
Sola F., Vallejos A., Daniele L., and Pulido–Bosch A. (2014). Identification of a Holocene aquifer–lagoon system using hydrogeochemical data. Quaternary Res. 82, 121–131. doi: 10.1016/j.yqres.2014.04.012
Sun Q., Gao M., Wen Z., Guo F., Hou G., Liu Z., et al. (2023a). Reactive transport modeling for the effect of pumping activities on the groundwater environment in muddy coasts. J. Hydrology 621, 129614. doi: 10.1016/j.jhydrol.2023.129614
Sun Q., Gao M., Wen Z., Hou G., Dang X., Liu S., et al. (2023b). Hydrochemical evolution processes of multiple–water quality interfaces (fresh/saline water, saline water/brine) on muddy coast under pumping conditions. Sci. Total Environ. 857, 159297. doi: 10.1016/j.scitotenv.2022.159297
Sun X., Xu J., Yang Q., Shi P., Zhong X., Zhang S., et al. (2006). Character and prevention strategies of sea(Saline) water invasion in circum–bohai–sea region. Geological Survey Res. 29 , 203–210. doi: 10.3969/j.issn.1672-4135.2006.03.006
Tian J., Ge F., Zhang D., Deng S., and Liu X.. (2021). Roles of phosphate solubilizing microorganisms from managing soil phosphorus deficiency to mediating biogeochemical P cycle. Biology. 10 (2), 158. doi: 10.3390/biology10020158
Van Engelen J., Essink G. H. O., Kooi H., and Bierkens M. F. (2018). On the origins of hypersaline groundwater in the Nile Delta aquifer. J. Hydrology 560, 301–317. doi: 10.1016/j.jhydrol.2018.03.029
Van Engelen J., Verkaik J., King J., Nofal E. R., Bierkens M. F., and Oude Essink G. H. :. (2019). A three–dimensional palaeohydrogeological reconstruction of the groundwater salinity distribution in the Nile Delta Aquifer. Hydrology Earth System Sci. 23, 5175–5198. doi: 10.5194/hess–23–5175–2019
Van Pham H., Van Geer F. C., Tran V. B., Dubelaar W., and Essink G. H. O. (2019). Paleo–hydrogeological reconstruction of the fresh–saline groundwater distribution in the Vietnamese Mekong Delta since the late Pleistocene. J. Hydrology: Regional Stud. 23, 100594. doi: 10.1016/j.ejrh.2019.100594
Vengosh A. and Hendry M. J. (2001). Chloride-bromide-δ11B systematics of a thick clay-rich aquitard system. Water Resour. Res. 37, 1437–1444. doi: 10.1029/2000wr900379
Wang W. X., Zhao X. L., Li S. J., Zhang L., Wang X. L., and Zhang X. Y. (2023). Palynoflora and climatic dynamics of the Laizhou Bay of Bohai Sea, North China Plain, since the late middle Pleistocene. Journal of Palaeogeography 12 (2), 278–295. doi: 10.1016/j.jop.2023.03.001
Werner A. D. (2010). A review of seawater intrusion and its management in Australia. Hydrogeology J. 1, 281–285. doi: 10.1007/s10040–009–0465–8
Xin C. and He L. (1991). Depositional process in the Huanghe Delta since Late Pliocene. J. oceanography Huanghai Bohai seas 9, 33–41. in Chinese
Xin C. and Yin Y. (1999). Stratigraphic characteristics and developmental evolution of the huanghe river delta region. Mar. Geological Developments 1), 4–6.
Xue C. (1993). Historical changes in the Yellow River delta, China. Mar. geology 113, 321–330. doi: 10.1016/0025–3227(93)90025–q
Xue C. (1994). Division and recognition of modern Yellow River delta lobes. Geographical Res. 13, 59–66. doi: 10.1016/0025–3227(93)90025–Q
Xue Y., Wu J., Xie C., and Zhang Y. (1997). Study on seawater intrusion and saltwater intrusion along the coast of Laizhou Bay. Chin. Sci. Bull. 42 , 2360–2368. doi: 10.1360/csb1997-42-22-2360
Xue Y., Wu J., Ye S., and Zhang Y. (2000). Hydrogeological and hydrogeochemical studies for salt water intrusion on the south coast of Laizhou Bay, China. Groundwater 38, 38–45. doi: 10.1111/j.1745–6584.2000.tb00200.x
Zhang X., Li H., Wang X., Kuang X., Zhang Y., Xiao K., et al. (2024). A comprehensive analysis of submarine groundwater discharge and nutrient fluxes in the Bohai Sea, China. Water Res. 253, 121320. doi: 10.1016/j.watres.2024.121320
Zheng Y., Gao M., Liu S., Wang S., and Zhao J. (2014). Wang, C.: Distribution characteristics of subsurface brine resources on thesouthern coast of laizhou bay sincelate pleistocene. Hydrol. Eng. Geol 41, 11–18. doi: 10.16030/j.cnki.issn.1000-3665.2014.05.030
Keywords: groundwater chemistry, hydrological mixing phenomena, geological aquifer dynamics, HFE-Diagram, hydrochemical evolution
Citation: Liu Z, Gao M, Wang L, Sun Q, Chang X, Hou G and Wang M (2025) Unraveling hydrogeochemical dynamics and mixing mechanisms in North Shandong coastal aquifers: insights from isotopic and geochemical tracers. Front. Mar. Sci. 12:1600851. doi: 10.3389/fmars.2025.1600851
Received: 27 March 2025; Accepted: 09 June 2025;
Published: 26 June 2025.
Edited by:
Qinsheng Wei, Ministry of Natural Resources, ChinaReviewed by:
Kai Xiao, Southern University of Science and Technology, ChinaYong Xiao, Southwest Jiaotong University, China
Zongjun Gao, Shandong University of Science and Technology, China
Copyright © 2025 Liu, Gao, Wang, Sun, Chang, Hou and Wang. This is an open-access article distributed under the terms of the Creative Commons Attribution License (CC BY). The use, distribution or reproduction in other forums is permitted, provided the original author(s) and the copyright owner(s) are credited and that the original publication in this journal is cited, in accordance with accepted academic practice. No use, distribution or reproduction is permitted which does not comply with these terms.
*Correspondence: Zhenlin Liu, bHpsMTM0MTE0NDEwMEBjdWcuZWR1LmNu; Maosheng Gao, Z2FvbXNoNjZAc29odS5jb20=