 Chang He1
 Alessandro Stocchino
 Francesco De Leo
 Yin-Fu Jin
 Xiang-Sheng Chen
- 1College of Civil and Transportation Engineering, Shenzhen University, Shenzhen, Guangdong, China
- 2Department of Civil and Environmental Engineering, Hong Kong Polytechnic University, Hong Kong, Hong Kong SAR, China
- 3Research Institute for Land and Space (RILS), The Hong Kong Polytechnic University, Hong Kong, Hong Kong SAR, China
- 4Department of Civil, Chemical and Environmental Engineering, University of Genoa, Genoa, Italy
The Pearl River Estuary (PRE) and Hong Kong (HK) Waters are identified as two of the most important habitats worldwide for Indo-Pacific humpback dolphin (Sousa chinensis). However, the extremely rapid growth of coastal cities and near-shore reclamation lands posed great threats to delicate marine ecosystems and protected species. Dredging operations can exert non-negligible negative impacts on humpback dolphins, with high sediment concentrations standing out as a particularly significant threat. This study aims to apply a new risk assessment approach based on computational fluid dynamics (CFD) and unsupervised machine learning technique for quantitatively estimating the risk of high turbidity to marine mammals. As an extension, the risk to the natural habitat in PRE was statistically compared among five possible dredging locations according to HK reclamation projects. The results showed that sediment plumes could be enlarged quickly if dredging sites are close to places with high density of macro-vortices, such as the north corner of Lantau Island. In terms of temporal effects, dredging under scenarios with northeast wind has a higher probability of posing significant risks to dolphin habitats. In accordance with this strategy, reliable suggestions on the choice of construction location or period could be provided to the decision-makers before or during the coastal projects. The proposed strategy can also be flexibly extended to any coastal environment, serving as a valuable example for coastal and environmental management.
1 Introduction
Indo-Pacific humpback dolphins (Sousa chinensis) are mainly distributed along the shallow, coastal waters from tropical to warm temperate zones, such as the Indian and western Pacific Oceans, from South Africa in the west to northern Australia, and southern China in the east, with depths of no more than 30 m (Jefferson, 2000; Karczmarski et al., 2016; Jefferson and Smith, 2016; Guo et al., 2022). At least eight areas of humpback dolphins’ habitats are distributed along the coast of southern China, among which the Pearl River Estuary (PRE) and its adjacent waters have been considered as the largest habitat of humpback dolphins with a population of approximately 2,600 (Chen et al., 2010; Zhang et al., 2022; Liu et al., 2023). As one of the apex predators in the PRE ecosystem, the Indo-Pacific humpback dolphin has been classified as vulnerable (VU) on the International Union for Conservation of Nature Red Species List currently (Jefferson and Smith, 2016; Chan and Karczmarski, 2019; Lin et al., 2021). A recent demographic study conducted by Huang et al. (2012) suggested that around 74% of the current population in the PRE is projected to be lost after three generations, even reaching 95% as predicted by a population viability analysis reported by Guo et al. (2020).
As the second largest estuarine system in China in terms of water and sediment discharge, the PRE also serves as one of the densely populated and rapidly developing metropolitan areas. Consequently, human activities pose great threats on the Indo-Pacific humpback dolphins and their habitats. Coastal constructions, especially dredging and land reclamation, can raise multi-dimensional threats, such as underwater noise, turbidity increase, pollutants’ re-suspension from seabed, and habitat loss (Hoffman, 2012; Todd et al., 2015; Piwetz et al., 2021; Karczmarski et al., 2016; Jefferson and Smith, 2016). Unfortunately, the PRE–HK area has a long history, around 160 years, of dredging and land reclamation, which significantly bothered and altered dolphin behaviors (Lai et al., 2016). Marcotte et al. (2015) studied the cumulative impacts of land reclamation and dredging on humpback dolphins in the north of Lantau Island in HK waters since 1996 and reported a significant decline in dolphin density near the northeast corner of HK airport, which was built artificially in the 1990s. The avoidance from the construction site and increase of swimming of dolphins were also recorded during the piling work of HK airport reclamation (Jefferson, 2000). Hung (2015) reported a decline of 60% of humpback dolphins in HK waters from 2003 to 2014 caused by the reclamation work for building the landing platform of the Tuen Mun-Chek Lap Kok Link for the Hong Kong–Zhuhai–Macau Bridge.
Researchers have devoted themselves to assessing the risk of dredging activities on marine mammals or humpback dolphins and finding their tolerance limits for decades; however, the impacts still remained largely unknown. Dredging sediment plumes are characterized by extensive spatial impacts (several kilometers to hundreds of kilometers) and prolonged duration (weeks to months) and exhibit a direct linkage to pollutant re-suspension (releasing adsorbed contaminants from sediments), thereby deserving a critical research focus among dredging threats (He et al., 2024a,b). Thanks to the coastal hydrodynamic and sediment transport models, dredging sediment plumes could be reliably simulated and reasonably predicted both spatially and temporally, which provides a chance to bridge sediment plume evolution and dredging risk on wildlife habitats (Feola et al., 2016; Di Risio et al., 2017; Zarzuelo et al., 2019; De Padova et al., 2020).
Previously, field observations and experiments are the main means to estimate the dredging plume risk on marine mammals or humpback dolphins. Based on those data, researchers built up risk assessment strategies or proposed related policies and rules for coastal constructions (Jefferson et al., 2009; Manap and Voulvoulis, 2014, 2015; McQueen et al., 2020). However, those traditional estimations may not be enough to predict dredging plume risk in terms of ongoing or future coastal projects. A very recent study regarding risk assessment of coastal dredging proposed a strategy with the help of sediment transport modeling and machine learning techniques to quantify the environmental risk considering dredging methods, duty cycles, etc (He et al., 2024a). The unsupervised machine learning technique, K-means clustering, has been widely employed to identify representative patterns and reduce data complexity while preserving key variability also in environmental studies (Zahmatkesh et al., 2015; Carvalho et al., 2016; Cremonini et al., 2021; Uti et al., 2023; Martínez et al., 2024)—for example, Cremonini et al. (2021) implemented K-means clustering to identify sub-series of wave parameters and wind speed. He et al. (2024b) applied K-means to generate representative metocean scenarios for the simulation of e-waste dispersion. Clustering analysis has also been employed in partitioning other variables such as flood, rainfall, river discharge, and temperature for various research purposes (Zahmatkesh et al., 2015; Bárcena et al., 2016; Carvalho et al., 2016; Núñez et al., 2019). Based on those studies, it is possible to link the gap of risk prediction regarding marine mammals’ protection and propose reliable suggestions for better decision-making before conducting any coastal constructions.
This study aims to quantify the risk of sediment plumes caused by dredging operations to the habitat of Indo-Pacific humpback dolphins in Pearl River Estuary–Hong Kong (PRE–HK) waters by applying the risk assessment framework based on computational fluid mechanics (CFD) and machine learning techniques (He et al., 2024a). As shown in Figure 1, PRE–HK is located in the subtropics of the Northern Hemisphere, one of the most important habitats for the Indo-Pacific humpback dolphins who live along the coast from tropical to warm temperature zones (Karczmarski et al., 2016; Guo et al., 2022). In addition, the north side of Lantau Island, the yellow block shown in Figure 1, has been recognized as the Guangdong–PRE National Reservation of Indo-Pacific humpback dolphins for its importance in preserving the humpback dolphins. Therefore, it is an urgent need to build numerical risk assessment strategies and provide case studies to understand and predict the impact of coastal dredging on humpback dolphins. Moreover, this study investigates the impacts of dredging locations to evaluate dredging plume risks, which can guide site-specific conservation measures (e.g., sediment containment strategies, hydrodynamic mitigation), and provide scientific references for optimizing construction site selection based on environmental compatibility assessments.
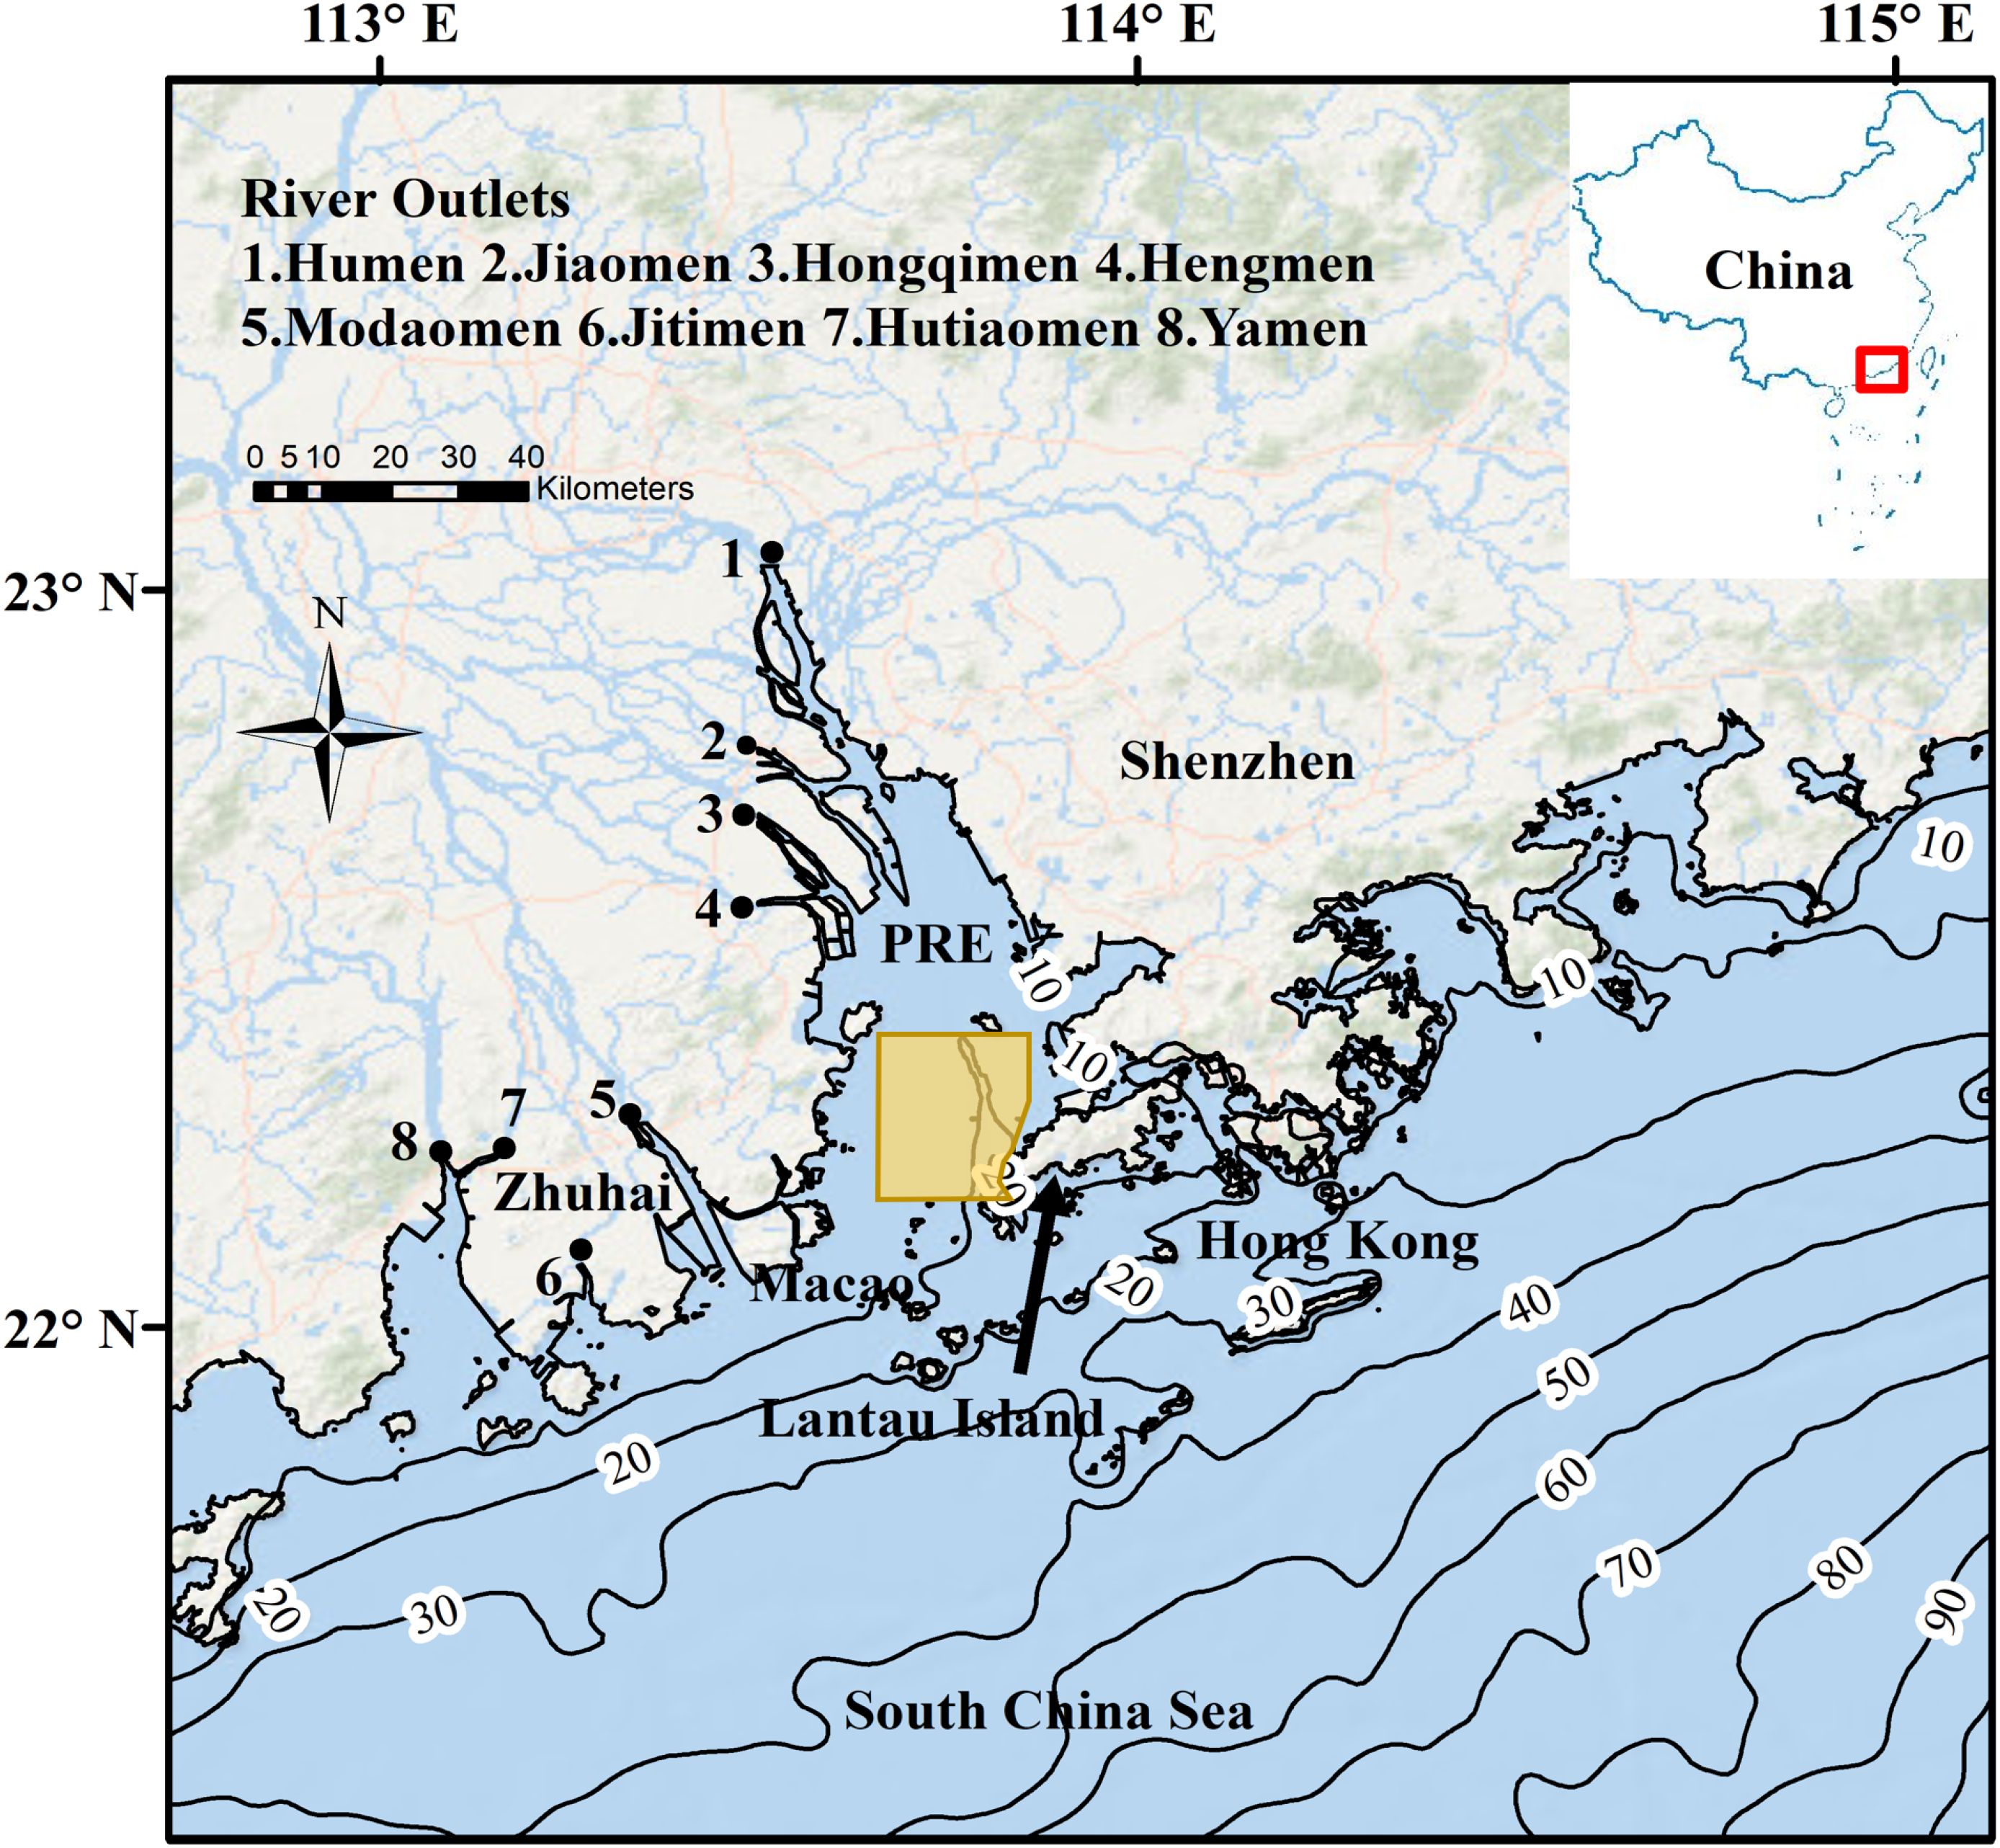
Figure 1. Map of the Pearl River Estuary (PRE) showing topographic features and isobaths (in meters), and the yellow block denotes the Guangdong-PRE National Reservation of Indo-Pacific humpback dolphins.
2 Risk assessment strategy
Figure 2 presents the risk assessment strategy, which is an extension of the risk assessment framework proposed by He et al. (2024a). It is composed of two important parts, estimation of the “hazard” (H) and definition of the “vulnerability” (V). The “risk” (R) equals to the product of hazard and vulnerability, see Equation 1 (Castanedo et al., 2009a, b; Chiri et al., 2020).
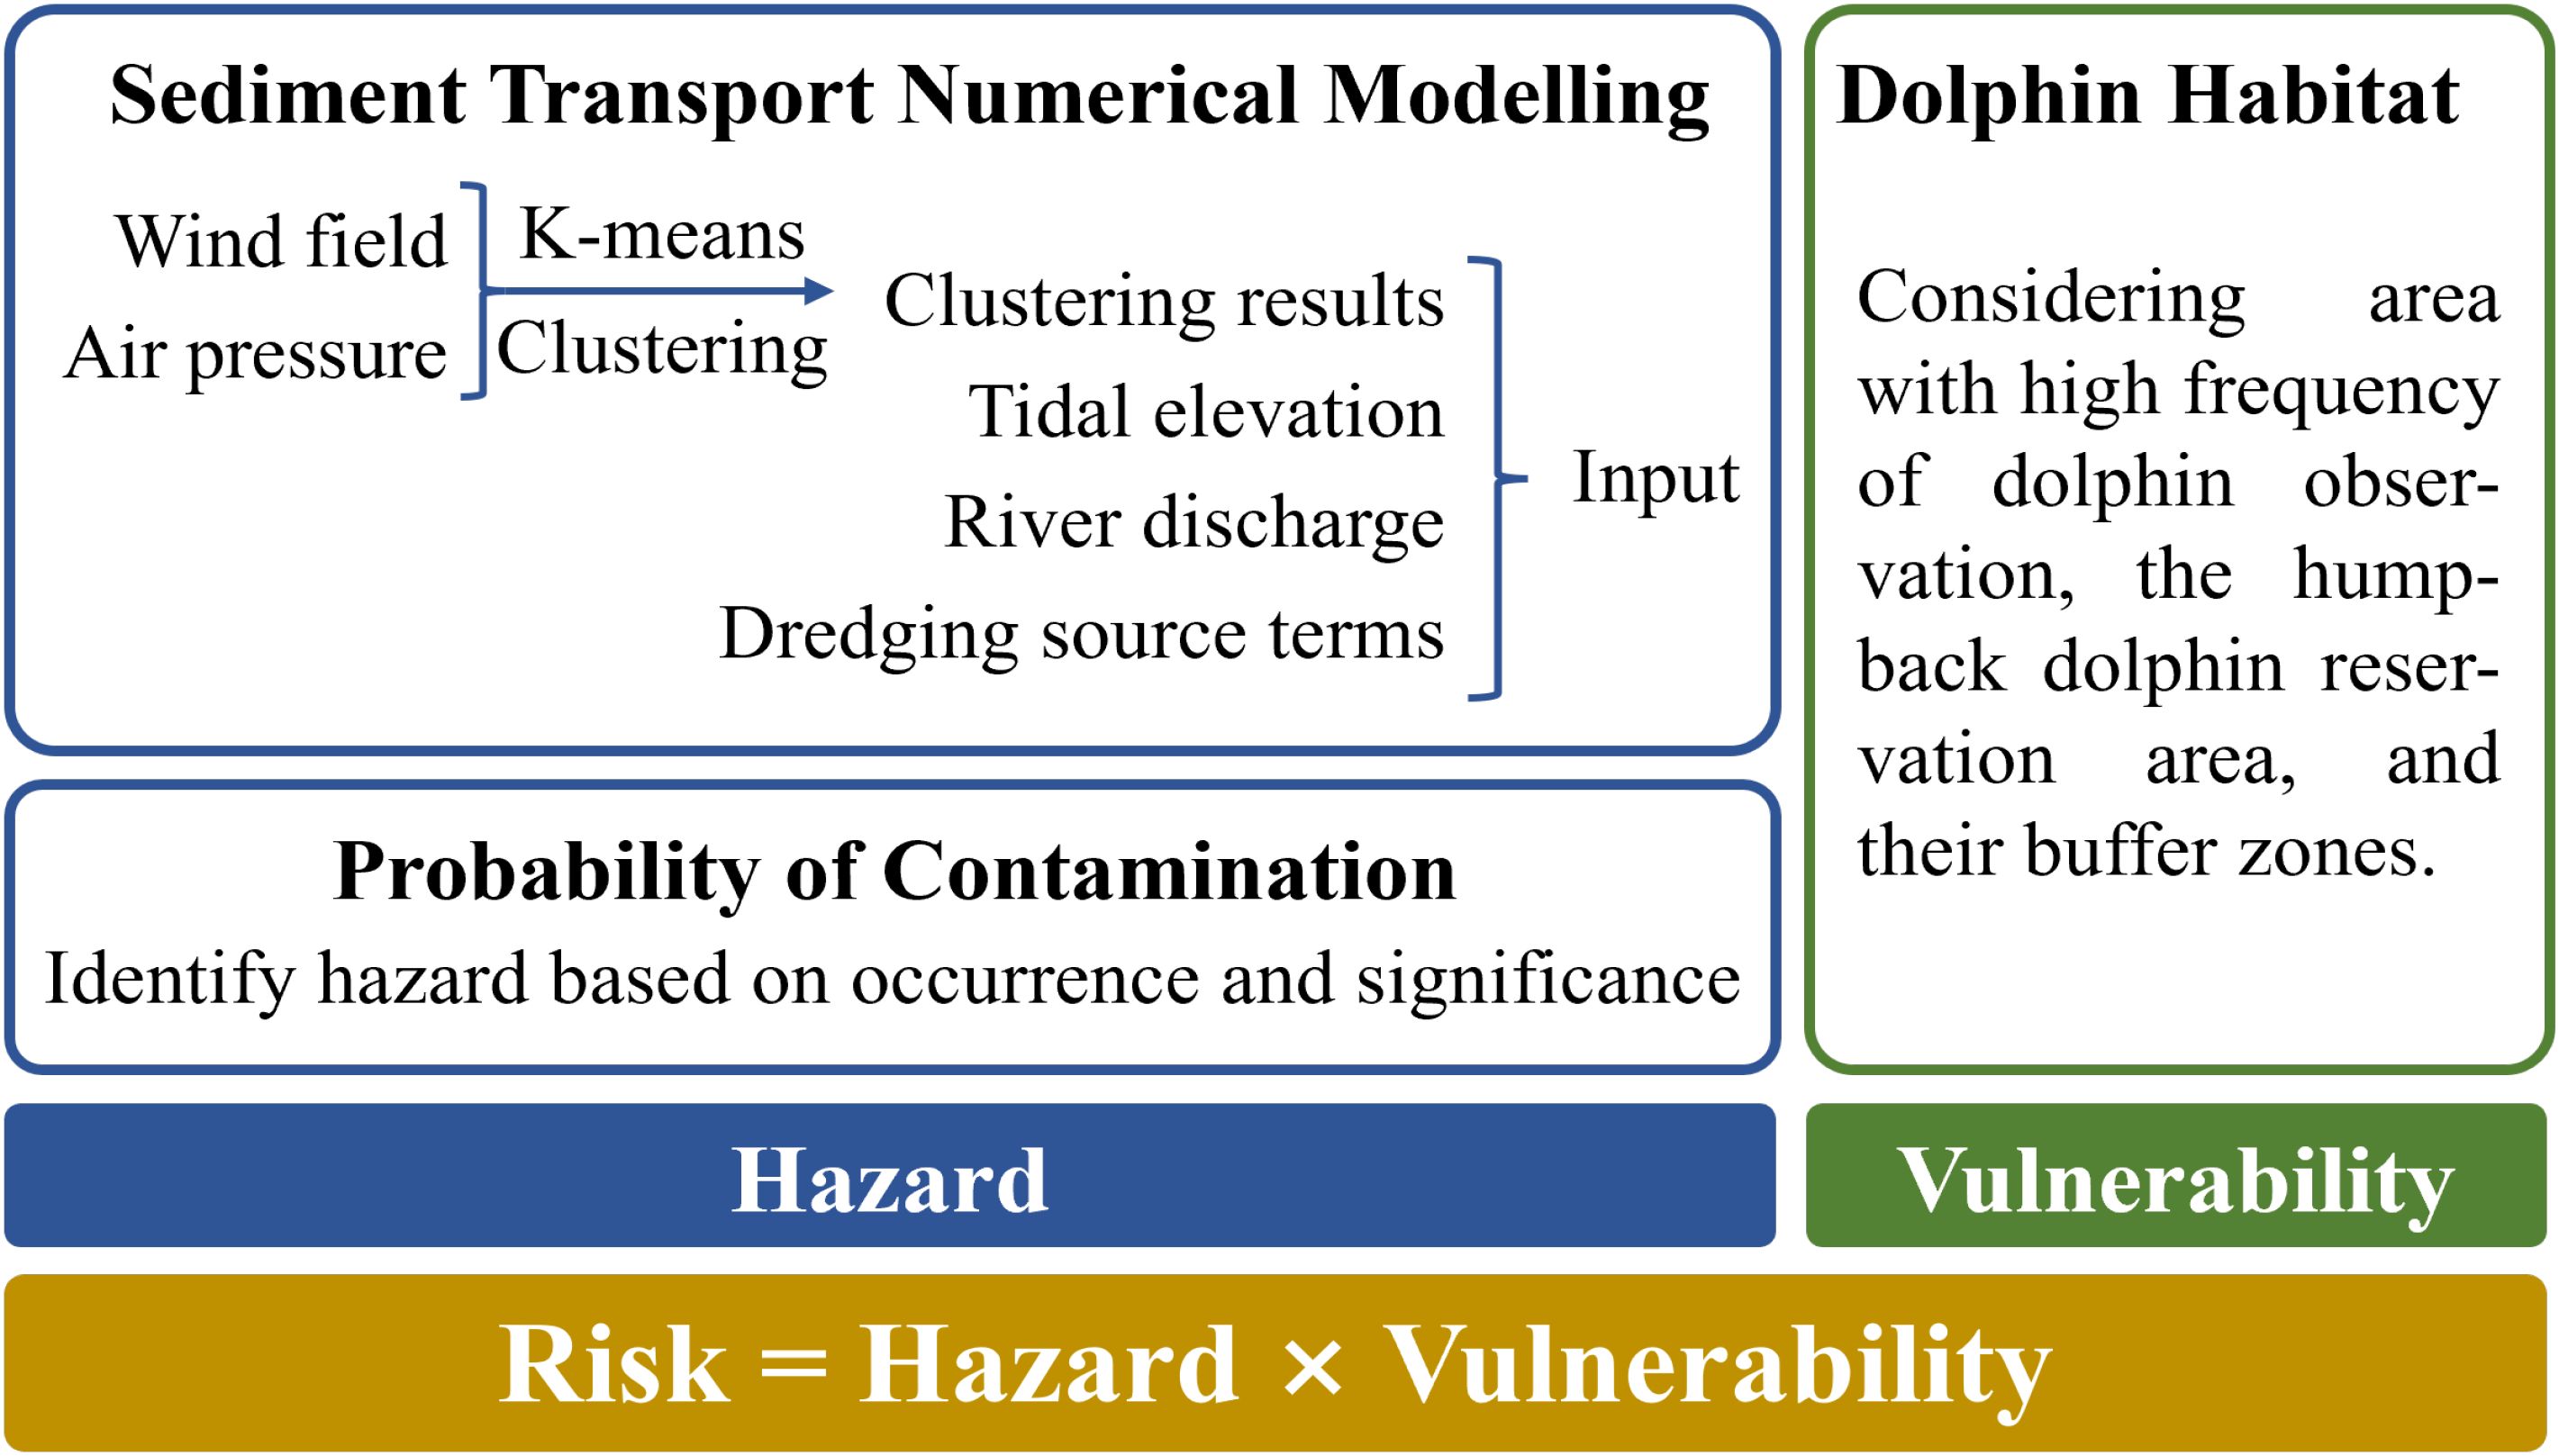
Figure 2. Flowchart showing the risk assessment strategy, which was built on the numerical simulations and considered the vulnerability in terms of humpback dolphin habitats.
where I denotes the hazard indexes, defined in the following and x represents any location in the domain of interest. Related concepts and terms in Figure 2 are explained in the following sections.
2.1 Sediment transport modeling
The Finite Volume Coastal Ocean Model (FVCOM) and its sediment module was implemented with unstructured grid, finite-volume, three-dimensional (3D) primitive equations (Chen et al., 2003). The computational mesh followed the one used in He et al. (2024a), as well as the model validation (He et al., 2022, 2024a), with correlation coefficients of four tidal gauge stations exceeding 0.95 and SKILL numbers of velocity components reaching 0.83. Tide, wind, air pressure, and river discharge were applied as external forcing.
An unsupervised machine learning clustering algorithm, K-means clustering (Lloyd, 1982; Bishop and Nasrabadi, 2006) was used to generate a number of metocean scenarios (clusters) to represent the long-term climatology instead of selecting by randomly choosing or averaging 1-year conditions that cannot capture the local climatology features on a robust statistical ground. In this study, we follow the methodology described in Cremonini et al. (2021), and the clustering processes and results have been discussed in He et al. (2024a). Both 15- and 30-day scenarios have been selected as scenario durations to test the proper duration. The 15-day scenarios were chosen because they could capture the features of spring and neap tide, include almost the whole evolution of dredging plume, and save computational costs in the same time (He et al., 2024a). A total of 100 metocean scenarios with a length of 15 days each and their corresponding frequency were obtained based on 42 years of climatology data.
The dredging source terms (Feola et al., 2016; Di Risio et al., 2017; De Padova et al., 2020) were treated as point sources in the nearest mesh nodes. The choice of dredging source locations considered both ongoing/planned projects and local topography, which could generate site-specific flow structures. The HK government has announced several reclamation projects, such as the third runway of HK airport, Kau Yi Chau Artificial Island, Lantau Tomorrow Reclamation, and Sunny Bay Reclamation. Dredging is unavoidable since reclamation materials become unaffordable, even though the HK government suspended dredging in reclamation projects during the last two decades. Moreover, the maintenance of two navigation channels, Lantau Channel and Urmston Road, needs regular dredging operations, which are also considered when choosing the dredging source location. In this case, five dredging locations were chosen around Lantau Island, as shown in Figure 3, considering the nearby ongoing and future dredging projects, i.e., the third runway of HK airport, Kau Yi Chau Artificial Island, and the maintenance of Urmston Road and Lantau Channel. Besides these, locations inside bay (III), facing river discharge (V), and near severe tidal streams (I and IV) were included for further comparison. The corresponding cases regarding different dredging locations (I, II, III, IV, and V) are labeled as cases I, II, III, IV, and V in the following context.
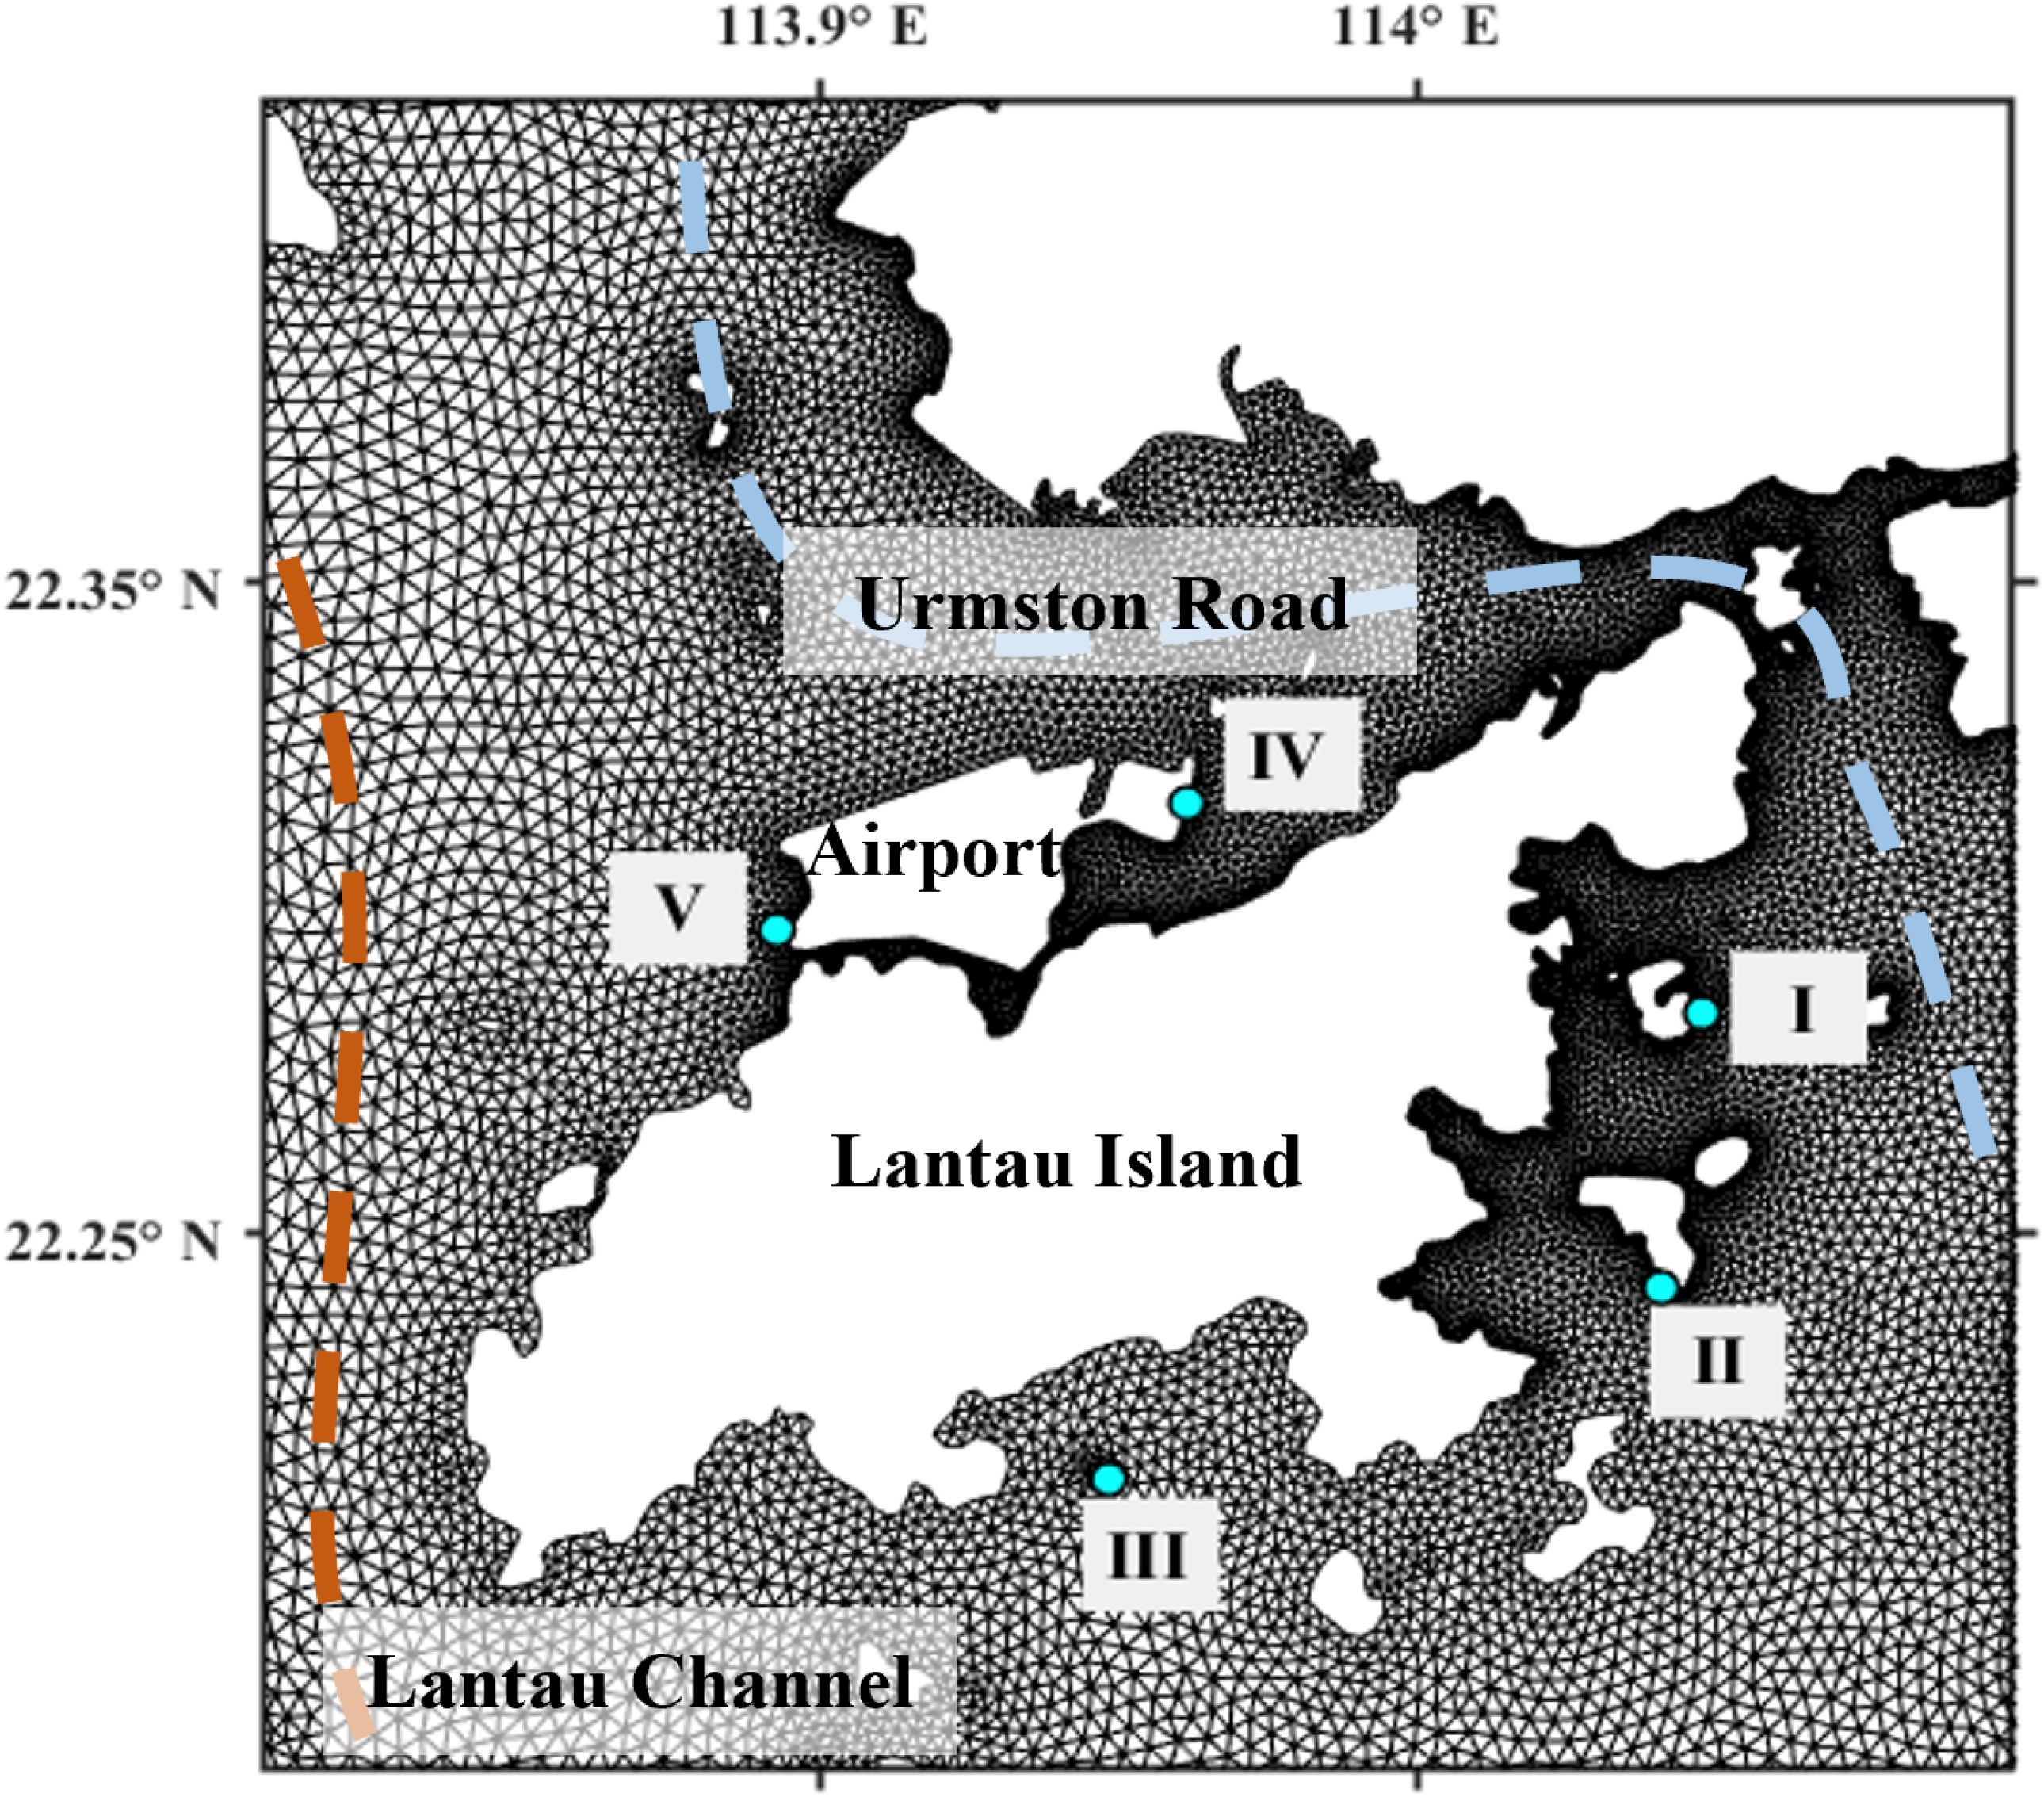
Figure 3. Focused view of mesh grids showing the resolution around HK waters, five proposed dredging locations in blue dots (I, II, III, IV, and V), and two channels around Lantau Island (Urmston Road in blue color and Lantau Channel in brown color).
For the present analysis, we intend to simulate the sediment transport of dredging operations employing a cutter suction dredger (CSD) with a blow-filling speed of 6,000 m3/h, following the land reclamation proposal mentioned in Yin et al. (2022). In this case, two sources of dredging plumes can be generated, one of which is caused by the cutter head during the operation of CSD, the other of which is the effusion of sand–seawater mixture from the reclamation site. The grain size of fine sediment D50 = 8.464 µm was obtained from the test of Hong Kong marine deposit and proved to be consistent with Feng et al. (2017). Based on the empirical estimation according to Becker et al. (2015), the sediment flux generated by the cutter head is around 26.9 kg/s if the CSD works for 12 h a day, and the effusion from the reclamation is around 38.3 kg/s. To mimic the real situation and consider the long tail effect of the sediment plume evolution, the timetable of the dredging work used in our simulation is designed as follows: (1) working 12 h per day, (2) working from day 1 to 6, and (3) suspending from day 7 to 15. The working duties directly relate to the dredging source term, thus affecting the modeling results. However, we tried to set up a standard case, convey the general information and dredging risks, and promote this strategy. The design mentioned above could be flexibly modified according to project recommendations, local policies, etc.
The erosion constant, critical shear stress for deposition, and the critical shear stress for erosion were 1.2 × 10⁻⁵ kg/(m2 s), 0.08 N/m2, and 0.2 N/m2, respectively. In addition, the input of sediment porosity Pb was 0.5, and the density ρs was 2,650 kg/m3. This model has been extensively validated in our previous work (He et al., 2022, 2023).
2.2 Hazard modeling
The spatial and temporal distribution of suspended sediment concentration (SSC) could be obtained through sediment transport modeling. Furthermore, by running hundreds of sediment transport simulations (the number of clusters multiplied by the number of dredging sources), an extensive dataset of dredging plume evolution patterns was generated, thanks to the application of K-means clustering. The hazard modeling mentioned in this section aims to quantify hazards by transforming SSC distributions into measurable indexes.
For each mesh node, one pollution event is defined if the time variation of SSC exceeds a certain threshold smin lasting for a certain time period tmin. Two criteria were applied to evaluate the hazard of the dredging operations and the occurrence and significance of hazard (He et al., 2024a). Those two criteria reflect the hazard based on different considerations, among which the significance of hazard conveys a more comprehensive information by considering both SSC and duration time. Occurrence is “1” if at least one pollution event is observed, or else the occurrence is “0”. Significance index is assigned to the mesh node whose SSC variations satisfy the conditions following Table 1. The numbers in Table 1 were suggested by Lisi et al. (2017) and He et al. (2024a). The levels of SSC/smin and corresponding periods can be adjusted for local concerns. It should be mentioned that the simulated SSC comes from the dredging sources, which is the extra load to adjacent environment. Thus, both the SSC and threshold smin mentioned here refer to the sediment amount above the background.
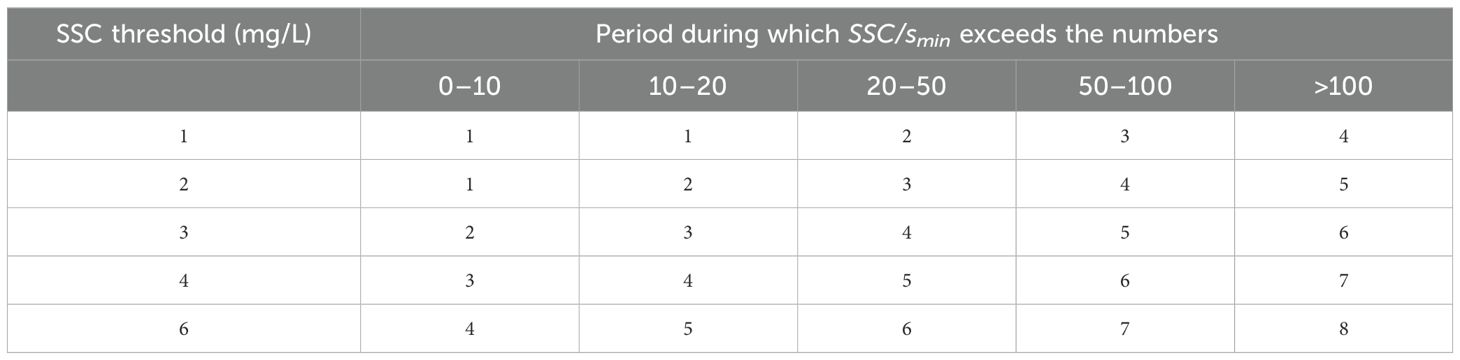
Table 1. Definition of the significance of pollution based on both SSC/smin magnitudes and lasting time.
The decision of smin and tmin is the key in hazard modeling. Unfortunately, clear evidence that the turbidity directly influences marine mammals was limited. Weiffen et al. (2006) explored the impact of turbidity increase on the vision acuity of seals and reported that the ability of vision decreased sharply when the turbidity reached above 1 formazin turbidity unit (FNU). On the contrary, it was found that marine mammals often inhabited turbid environments and utilized sophisticated sonar systems to sense the surroundings (Au, 2000); however, construction noises were reported with negative impacts on detecting prey, navigating, and communicating (Mooney et al., 2009; Marine Aggregate Levy Sustainability Fund, 2009). It is agreed that marine mammals have a certain level of tolerance to turbidity, although the thresholds still remain unclear for individual mammals.
Recently, Lin et al. (2021) reported that turbidity was significantly negatively correlated with humpback dolphin activity (sighting rate and foraging) based on principal component analysis (PCA) near Taiwan, China. No observation of humpback dolphins was detected when the turbidity was above 16.07 NTU during the eight groups of seasonal measurements in 2017 and 2018 (Lin et al., 2021). If considering 16.07 NTU as a limit of potential harm to dolphins, the corresponding SSC could be calculated according to the quantified relationship between turbidity and SSC. Turbidity has been considered as the most ubiquitous of surrogate technologies used to estimate suspended-sediment concentration (Landers and Sturm, 2013). The relationship between turbidity and SSC is affected by several parameters, particularly sediment size (Loperfido et al., 2010). Xie et al. (2022) has analyzed the correlation between turbidity and SSC in waters with sediment sizes similar to those of Taiwan waters. In this case, turbidity of 16.07 NTU could be transformed into SSC of 16.5 mg/L according to the equation proposed by Xie et al. (2022), y = 1.0055x + 0.3829. Based on the observation released by HK Environmental Protection Department (EPD), the SSC of the majority of time and stations is within the range of 5–20 mg/L. Therefore, a rise of SSC of 5 mg/L has a huge chance leading to a total SSC exceeding 16.5 mg/L. Thus, 5 mg/L was used in this study as the threshold smin of a pollution event.
The choice of the time period threshold tmin can be more difficult and complex as there have been massive literatures explaining direct or indirect harm to humpback dolphins or marine mammals; however, few data could support the quantification of temporal accumulation. Todd et al. (2015) reviewed various negative effects brought by dredging sediment plume, including turbidity, toxins, and pollutants. Persistent organic pollutants (Gui et al., 2014), such as organotins (Zhang et al., 2022), heavy metals (Gui et al., 2017), and microplastics (Zhang et al., 2021), were proved to endanger the habitats of Indo-Pacific humpback dolphins. Aspects including objective harm, local policies, and subjective goals of projects should be considered when determining tmin in the application of this strategy.
In the present study, we related tmin to the concentration of heavy metals and persistent organic pollutants. Gui et al. (2017) investigated the spatio-temporal trends of the concentrations of 11 heavy metals in the liver and kidney of Indo-Pacific humpback dolphins (Sousa chinensis) from western PRE during 2004–2015 and found that Zn, Cu, and Hg were sufficiently high to cause toxicological effects. A comparison of the persistent organic pollutant concentrations has been summarized in Gui et al. (2014) regarding Indo-Pacific humpback dolphins from the Pearl River Estuary (PRE). However, heavy metals and persistent organic pollutants absorbed by seabed sediment can be re-suspended into water columns when dredging takes place. One of the references helping decide tmin is about the remobilization of particulate-phase metals in re-suspended coastal sediments (Kalnejais et al., 2007). This study showed that the metal contents remained in suspension over time scales of hours after re-suspension—for example, around 50% Pb, 20% Cu, and 80% Mn, corresponding to the amount of metal tested at the maximum of re-suspension in their experiment, remained in the water column after 8 h of settlement in a sample from Massachusetts Bay, USA (Kalnejais et al., 2007). Another proposed way to decide tmin in this study is to estimate the re-suspended of polyfluoroalkyl compounds. Wang et al. (2019) examined the distribution of polyfluoroalkyl substances in the seawater and sediment of the South China sea coastal region. Ahrens et al. (2010) provided information on the environmental behavior and fate of polyfluoroalkyl compounds found in water, suspended particulate matter, and sediment, although in Japan, and found that suspended sediment particles could absorb extra polyfluoroalkyl compounds as they stayed in the water column, increasing the chance of intake by marine animals. With this information, we implemented 4 h as tmin, the minimum lasting period of one pollution event, based on the hypothesis that the accumulation of the defined pollution events could be harmful to humpback dolphins.
Following (Equation 2), by multiplying the frequency of the m-th scenario, generated by K-means clustering, and the spatial distribution of hazard indexes and then summing along those of M hydrodynamic scenarios, the probability of contamination in each location for a particular index (H(I,x)) is obtained as:
where I(x) corresponds to the spatial distribution of the occurrence or significance index and fm to the cluster frequency.
2.3 Vulnerability
The vulnerability must be concerned to distinguish the spatial significance and better characterize the potential harm of dredging operations on humpback dolphins. The rating of vulnerability takes political, institutional, economic, and socio-cultural factors into account (Castanedo et al., 2009b; Viavattene et al., 2018; Rangel-Buitrago et al., 2020). In this study, the concern lies in the potential impact on humpback dolphins’ living habitats. The classification of vulnerability considers both official reservation areas, released by the Mainland China government, and the spatial distribution patterns of humpback dolphins based on the analysis of sighting surveys. It is worth noting that previous studies have demonstrated that the areas affected by sediment plumes from dredging projects near Lantau Island closely overlap with conservation zones and regions with a high frequency of humpback dolphin observations (He et al., 2024a).
There are two humpback dolphin reservations in the PRE area, Guangdong–PRE National Reservation and Guangdong–Jiangmen Provincial Reservation of Indo-Pacific humpback dolphins, the latter of which existed outside of our study domain and will not be considered. The Guangdong–PRE National Reservation is located in the west of Lantau Island (113°39′59″ E–113°51′37″ E, 22°10′57″ N–22°23′58″ N), occupying a large part of PRE main body.
The sighting survey is the main approach to evaluate the population size of the humpback dolphins, although it is time-consuming and inconvenient considering various limitations during the cruise, such as weather conditions and human and material resources. Guo et al. (2022) collected data on humpback dolphins from 2015 to 2021 based on boat surveys and presented spatial distribution patterns of sighting rates by kernel density analysis in PRE waters. The patterns showed that the area with high sighting rates of humpback dolphins lay on the west coast of Pearl River Estuary (PRE). Karczmarski et al. (2016) investigated Indo-Pacific humpback dolphins’ spatial behavioral dynamics in Hong Kong (HK) and presented maps based upon 50% and 95% kernel density estimators of area utilization distribution for all sightings, showing that the region of west and southwest Lantau Island possessed a large number of dolphins regarding both frequency and group sizes.
The assignment of the vulnerability indexes 1 to 4 refers to Guo et al. (2022) and Karczmarski et al. (2016): (1) the index of 4 is assigned to reservation areas, areas with high sighting rates, and areas with 95% kernel density; (2) the index of 3 is assigned to an area with medium sighting rates and an area with 50% kernel density; (3) the index of 2 is assigned to an area within 2 km from the reservation, an area with low sighting rates, and an area within 1 km far from the area of 50% kernel density; and (4) the index of 1 is assigned to the rest of the domain. Based on the above information, the vulnerability related to humpback dolphin habitats and activities is displayed in Figure 4.
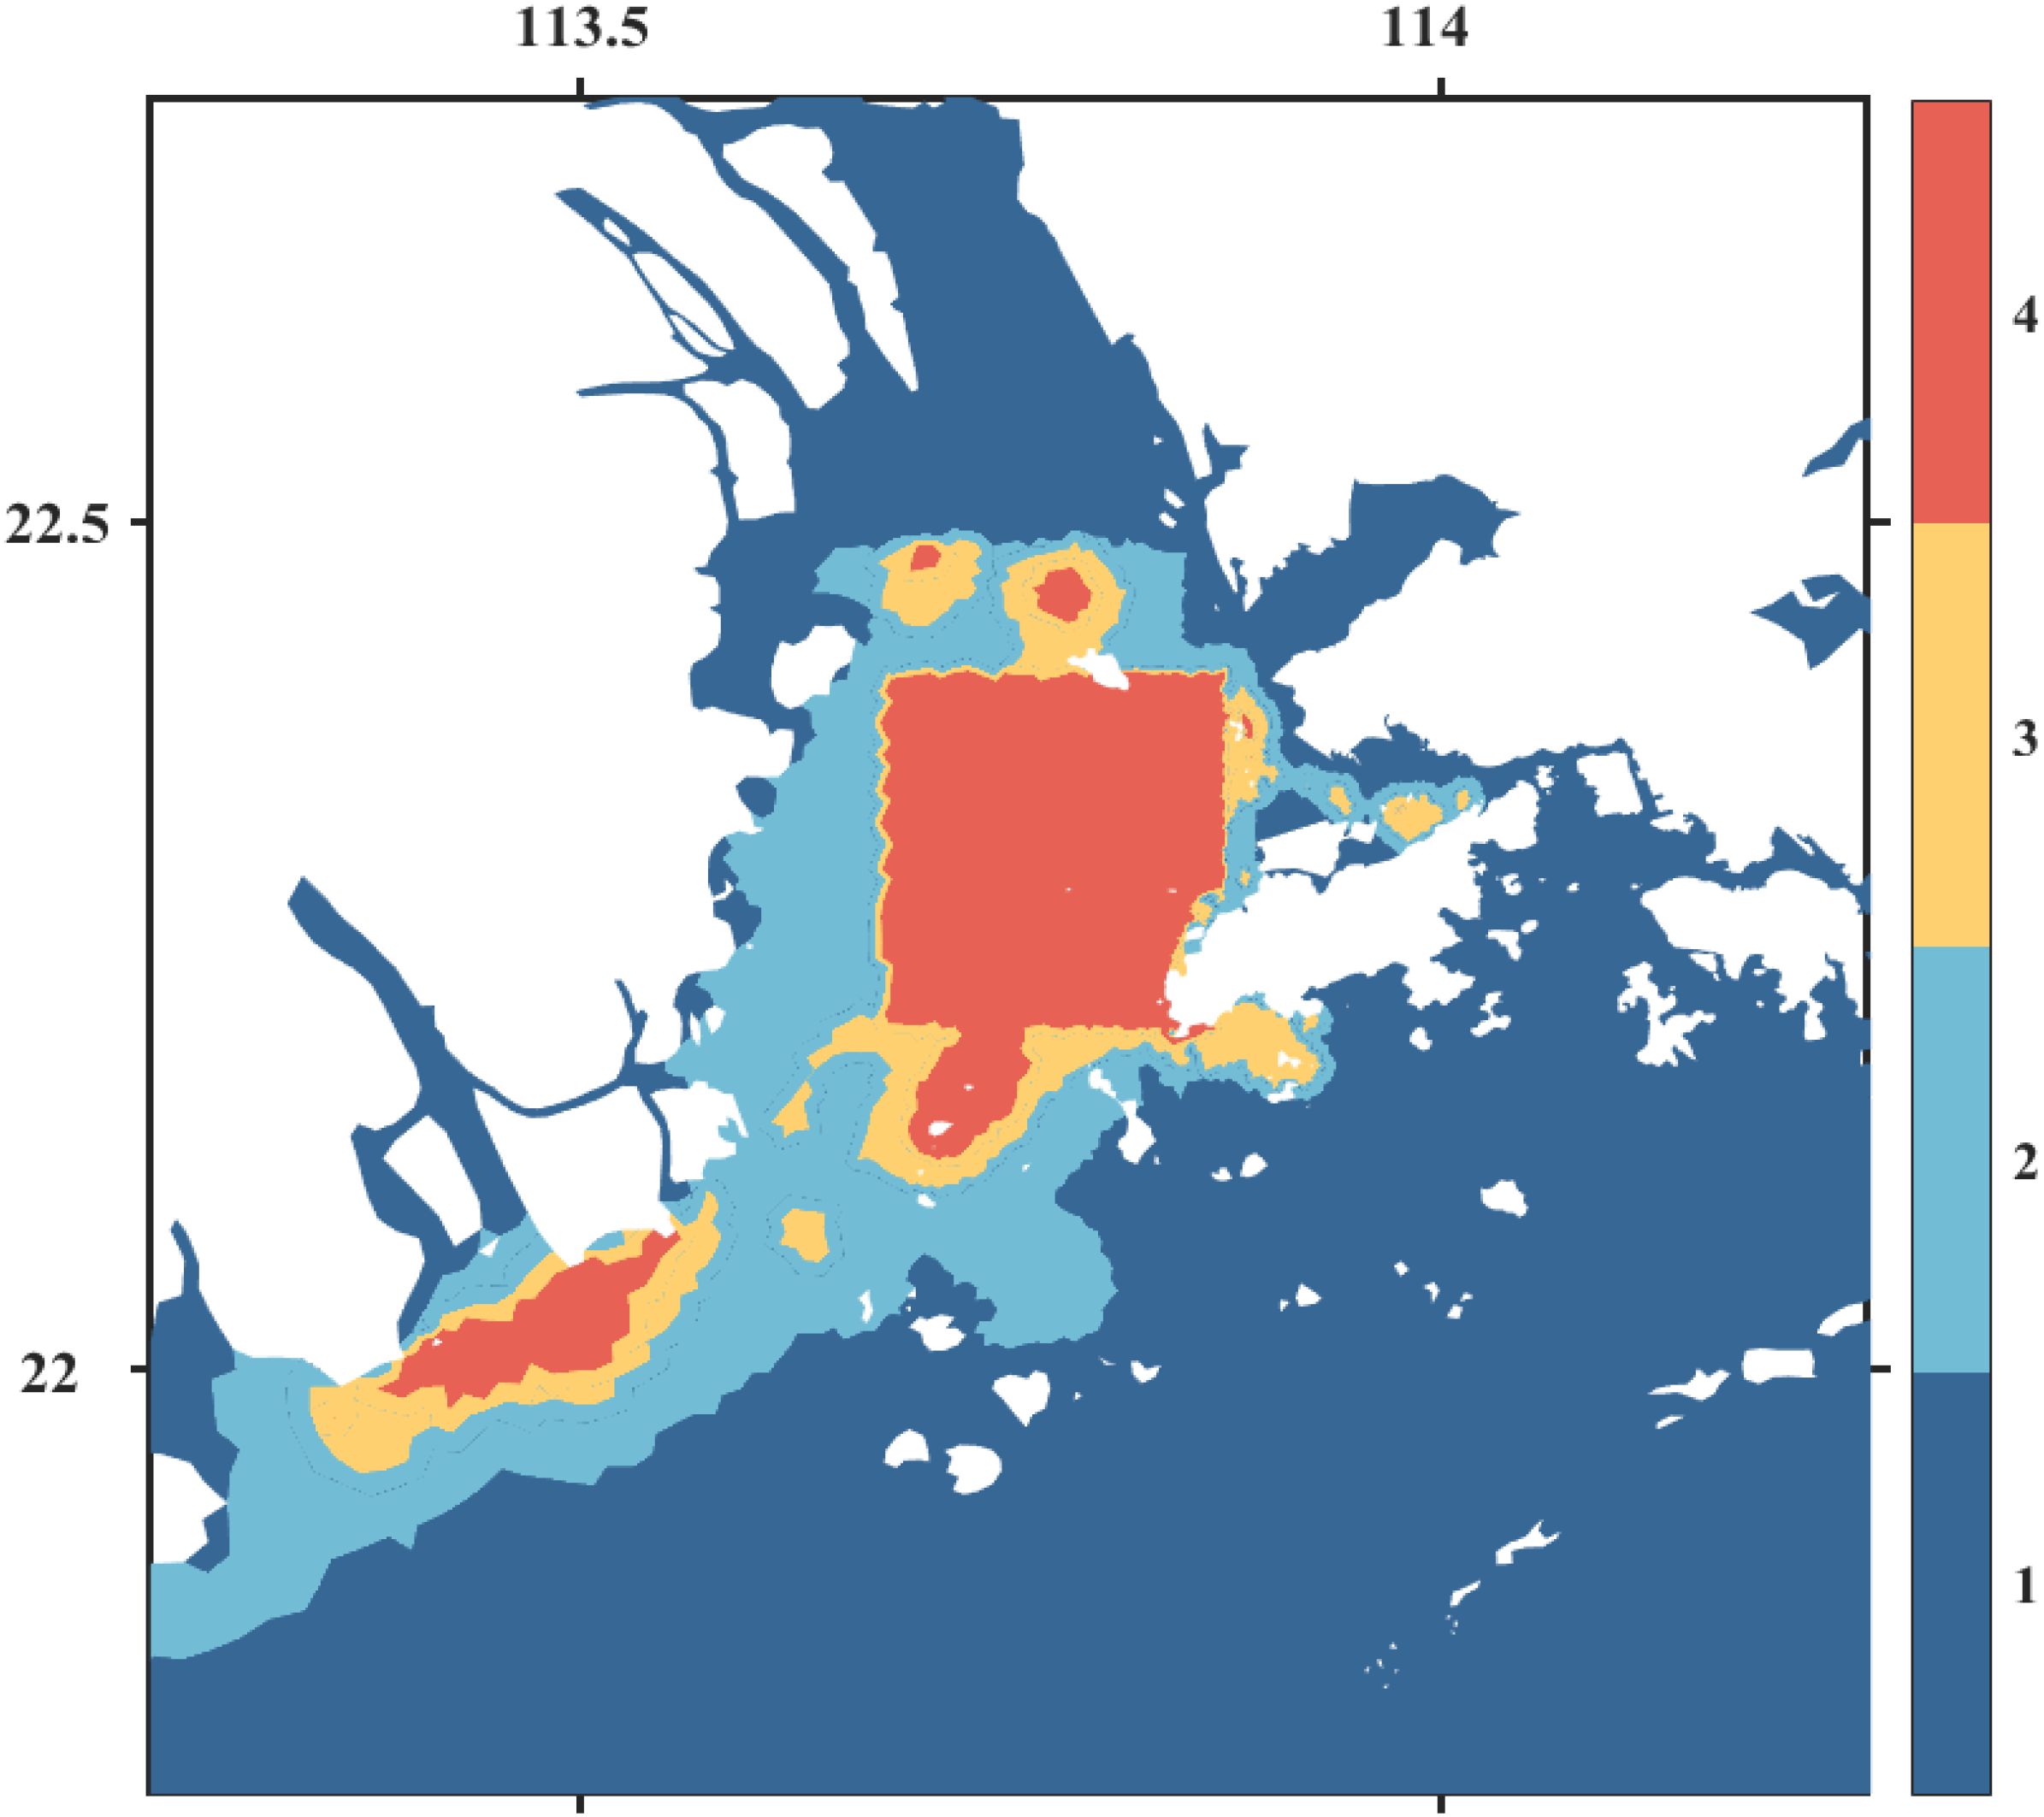
Figure 4. Vulnerability map considering national reservation areas and kernel density analysis based on the sighting of humpback dolphins during cruises (Karczmarski et al., 2016; Guo et al., 2022).
3 Results
3.1 Estimation of hazard
Figure 5 shows the occurrence (a1)–(e1) and significance (a2)–(e2) of hazard of five dredging cases—I, II, III, IV, and V, respectively, noting that the calculation of hazard considered 100 metocean scenarios and their corresponding frequency.
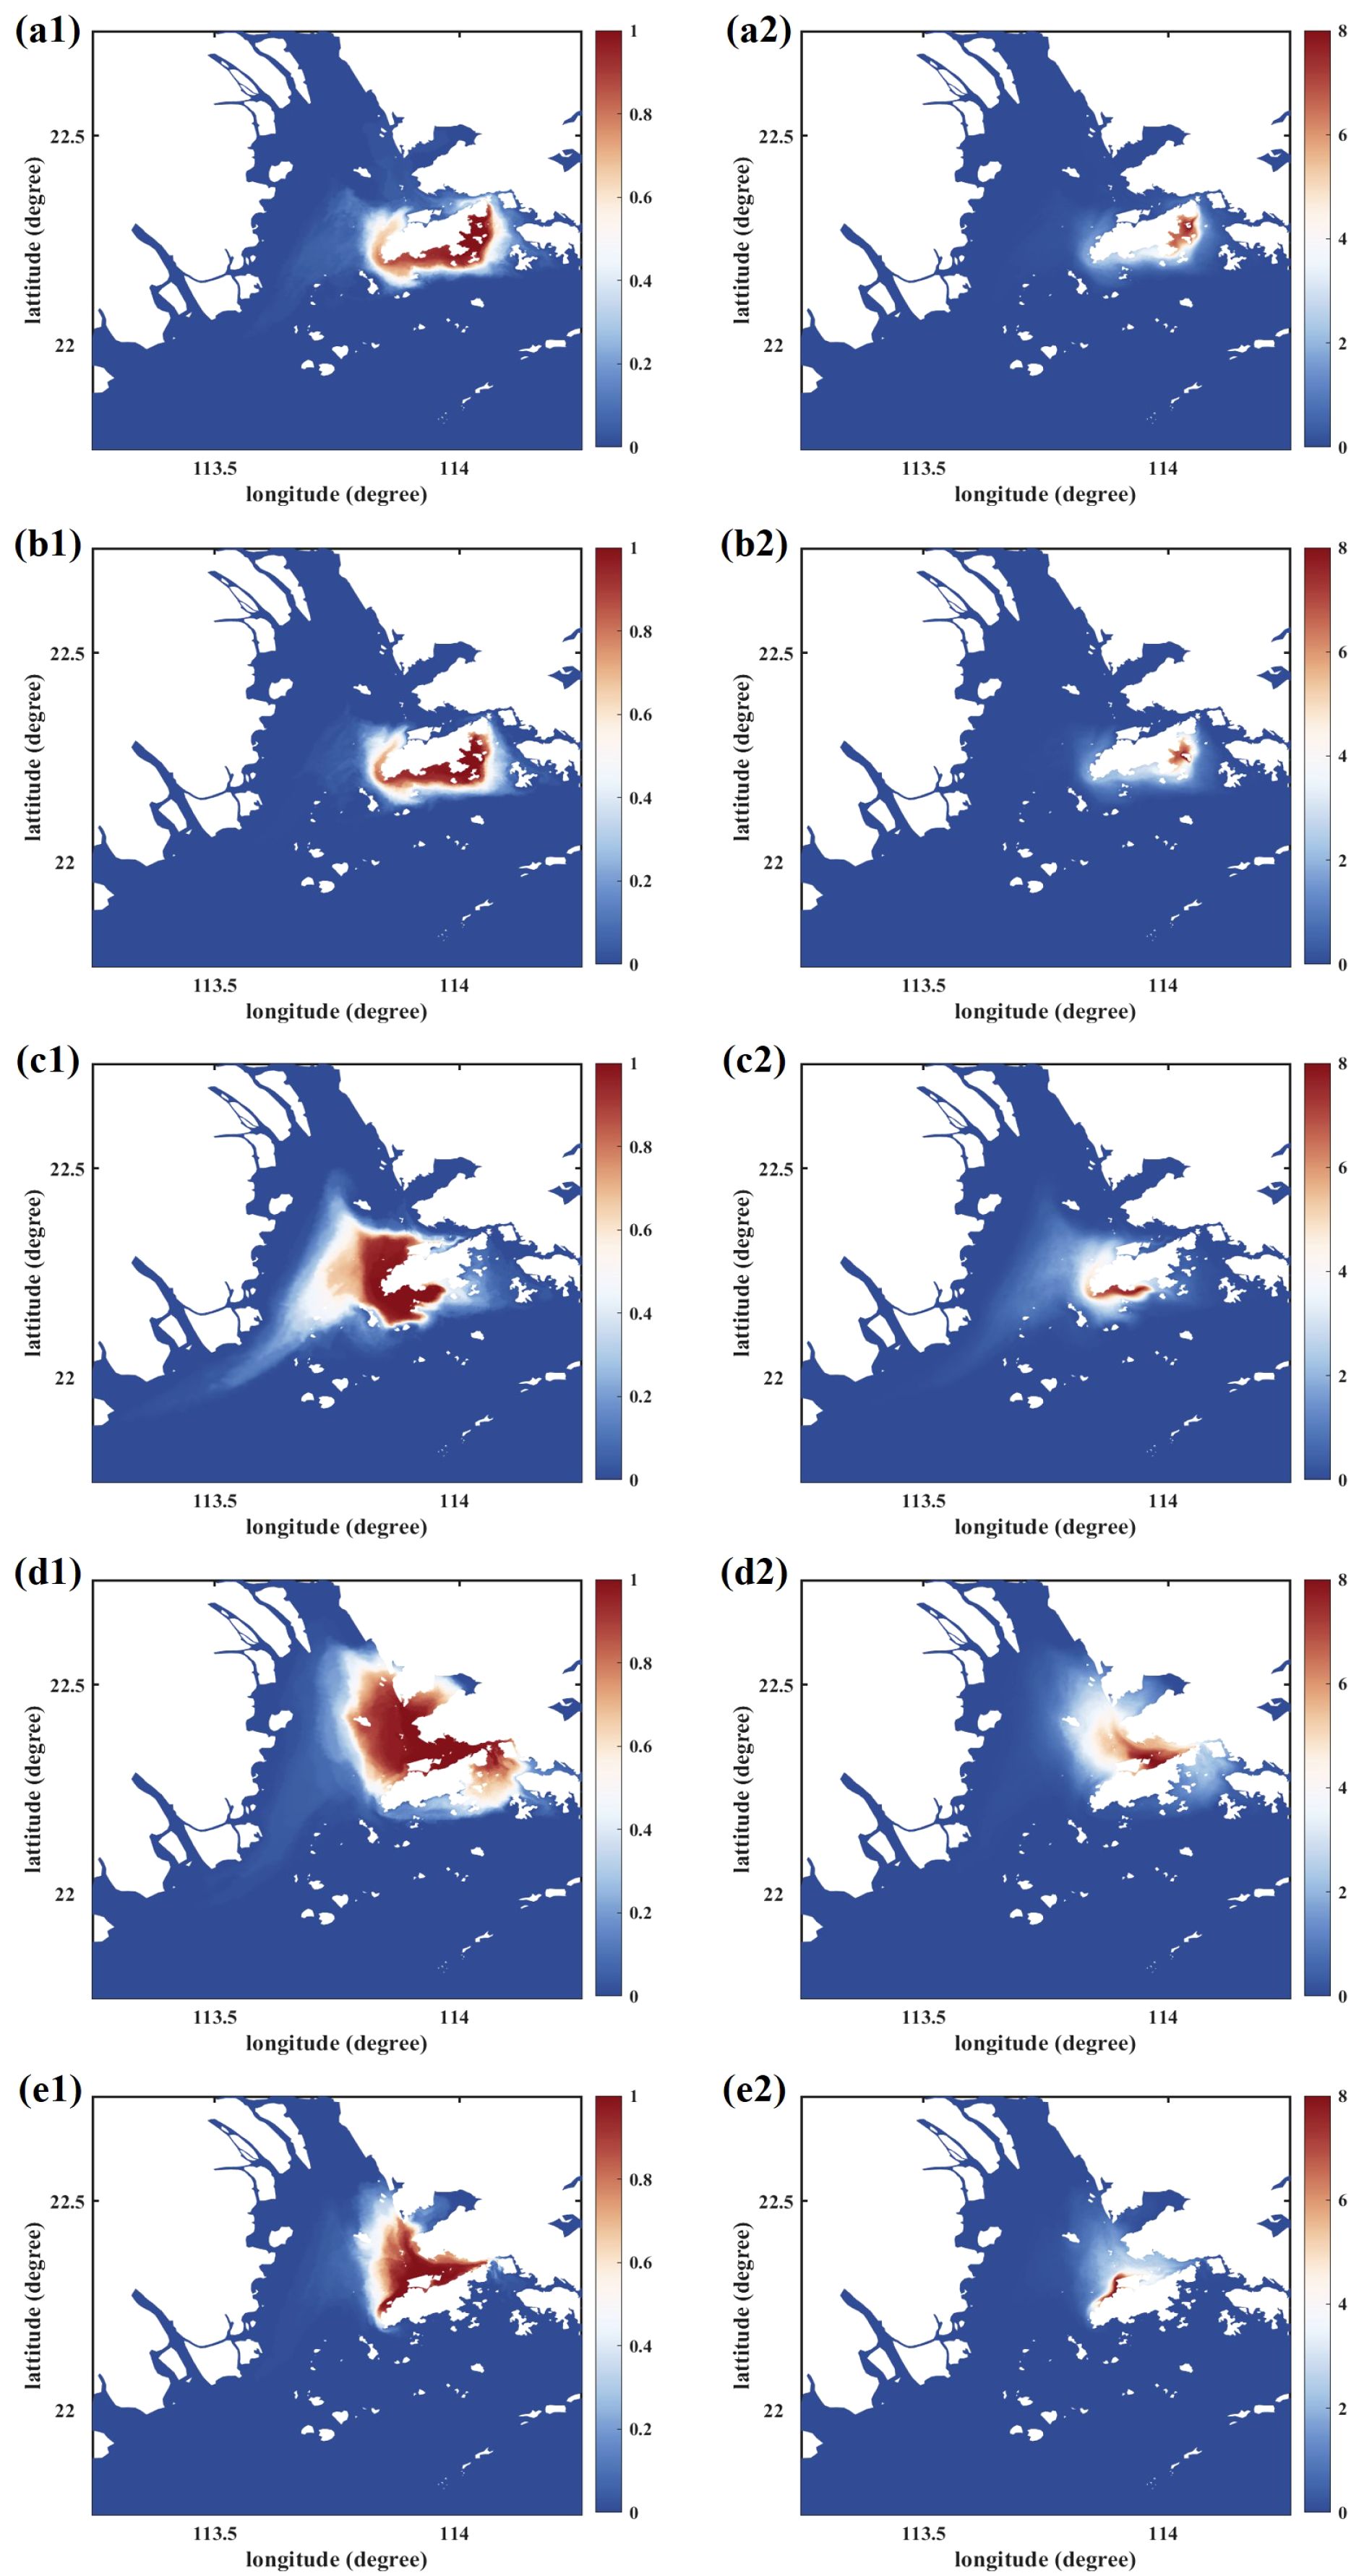
Figure 5. Hazard maps of five dredging locations regarding occurrence and significance: (a–e) denote the five dredging locations I, II, III, IV, and V; (a1–e1) hazard of occurrence, (a2–e2) hazard of significance.
In all five cases, the occurrence of hazard was retained in PRE–HK waters without entering into the South China Sea (SCS). However, the contour shapes were slightly different among the five cases. Cases I and II had similar occurrence maps, with hazard concentrated on the east-southeast coastlines and spread to the south-southwest coastlines of Lantau Island. The occurrence of hazard in case III was similar to the occurrence maps for the reason that two cases had close dredging locations. The hazard in case III centered around the west part of Lantau Island and extended to the west coast of PRE. Cases IV and V obtained the occurrence maps with the hazard distributed in the north of Lantau Island. However, case IV had a larger area of hazard occurrence than that of case V. In case IV, sediment particles had a large probability of occurrence, more than 0.8, to be found in the middle of PRE, i.e., Deep Bay, and the north of Lantau Island. In contrast, the occurrence of hazard in case V could hardly enter Deep Bay or go far inside the PRE and was totally blocked by the north coastlines of Lantau Island from spreading to the south part. The occurrence of hazard maps directly illustrated that the dredging locations had a significant impact on sediment transport, and locations III and IV may not be suitable for dredging operations considering the large affected areas.
The occurrence of hazard maps provided the probability information by considering the frequency of each scenario. However, the occurrence criterion cannot convey the message about pollution level or residence time. The significance criterion can highlight the areas that are more worthy of attention and protection by considering both SSC and residence time. Figures 5a2–e2 present the significance of hazard regarding five dredging locations. The significance magnitude of 8 implies that the sum of the lasting time of all the events exceeds 100 h regarding a threshold of 30 mg/L. Based on this definition, the dark red color in Figures 5a2–e2 reflects areas with serious pollution considering both SSC and lasting time.
Case I and II had high significance values around the east side of Lantau Island as shown in Figures 5a2, b2; however, case I exhibited more severe pollution than case II, which could hardly be identified based on Figures 5a1, b1. Dredging locations I and II were close to the end of Urmston Road, as shown in Figure 3, and sat downstream of the northeast headland of Lantau Island, where the macro-vortices were periodically generated and collapsed under the dominance of tidal currents the whole year, as reported by He et al. (2022). Under this condition, sediment particles could be transported to far-fields in several tidal cycles, similar to the cases also reported in Hitchcock and Bell (2004). Thus, the high significance numbers only existed in areas close to the dredging locations, i.e., the bay on the east side of Lantau Island, and then decreased sharply when approaching the end of Urmston Road.
The areas with high significance of hazard in case III was quite different compared with that of cases I and II. The heavily polluted areas, in case III, were concentrated along the south coastlines of Lantau Island in a slender shape. On the contrary, the high significance area in case V was on the north side of Lantau Island. Dredging locations III and V were closer to Lantau Channel than Urmston Road. Macro-vortices were generated around the transition zone of Lantau Channel, i.e., area between the floodplain and the main channel, based on the previous study of compound channel flow (He et al., 2023). Thus, sediment particles reaching the west side of Lantau Island, i.e., around the Lantau Channel, could be spread along the tidal currents and macro-vortices. This illustrated why the area with high significance only existed near the coastlines instead of the adjacent waters to the west of Lantau Island. Areas with significance numbers below 6 in case III were observed in the west side and went inside the main body of PRE. In case V, the light pollution area was only distributed on the north side of Lantau Island, i.e., the east side of PRE.
Case IV had the most severe pollution among the five cases, shown as the largest area with high significance numbers in Figure 5d2. Location IV was close to Urmston Road and located upstream of the northeast headland of Lantau Island. Based on the knowledge of local hydrodynamics presented in He et al. (2022), tidal currents rushed into PRE through this corner and interacted with headlands in narrow channels, during which process massive macro-vortices were generated, transported, and destroyed. Under this condition, the sediment plume caused by dredging could be enlarged toward the upstream of Urmston Road thanks to the tidal currents; however, it was hard for sediment particles to escape from the north side of Lantau Island, blocking by the northeast headland of Lantau Island and leading to a large pollution area with high significance.
The five locations were chosen around Lantau Island in five representative directions, namely, the east side near Urmston Road (I), the southeast side (II), the south side (III), the north side to the east of the airport (IV), and the north side to the west of the airport (V). Both Urmston Road and Lantau Channel had a positive impact on transporting the sediment particles to far-fields. In addition, the coastlines and headlands could shape the pollution, such as along the coastlines, in the lee of headlands, or inside the bays. The HK airport may play a role in separating the dangerous dredging locations compared with cases IV and V. The airport could block the sediment particles from spreading toward the east and reduce the affected area, unlike case IV, whose dredging location was the most dangerous one considering both the occurrence and the significance of hazard.
3.2 Estimation of risk
As illustrated in Section 2, the risk caused by dredging should not only consider the SSC distribution, i.e., the hazard, but also take the dolphin activities into account (Castanedo et al., 2009b; Rangel-Buitrago et al., 2020). The vulnerability indexes of PRE–HK waters were defined according to the location of reservation areas and the spatial distribution patterns of humpback dolphins (Karczmarski et al., 2016; Guo et al., 2022). Figure 4 shows the vulnerability map regarding dolphin habitats. Note that the risk values obtained using (Equation 1) were normalized by its potential maximum value to better compare the risk of the two criteria.
Figure 6 presents the occurrence (a1)–(e1) and significance (a2)–(e2) of risk of five dredging cases, I, II, III, IV, and V, respectively. The high-risk areas regarding occurrence in all five cases were concentrated on the west side of Lantau Island, more specifically, the reservation area, which was reasonable since the reservation area possesses high vulnerability values. Even for cases I and II in Figures 6a1, b1, respectively, the occurrence of risk on the west side was far more significant than the east side, whose dredging locations were on the east side and the corresponding hazard was distributed in the east bay of Lantau Island, as shown in Figures 5a1, b1. This indicated that vulnerability could greatly influence the risk assessment results, such as the “hot spot” in the north corner of Lantau Island (Jefferson, 2000; De Padova et al., 2020). Another huge difference is that case III had the most severe risk among the five cases, unlike the occurrence of hazard maps where case IV had a larger area of occurrence with a high probability than case III. In addition, case IV exhibited a higher risk than case V even though location V was closer to the dolphin reservation area than location IV. This is not in line with common sense that dredging in further locations could have a lower risk and will provide a valuable reference to decision-makers in view of field works.
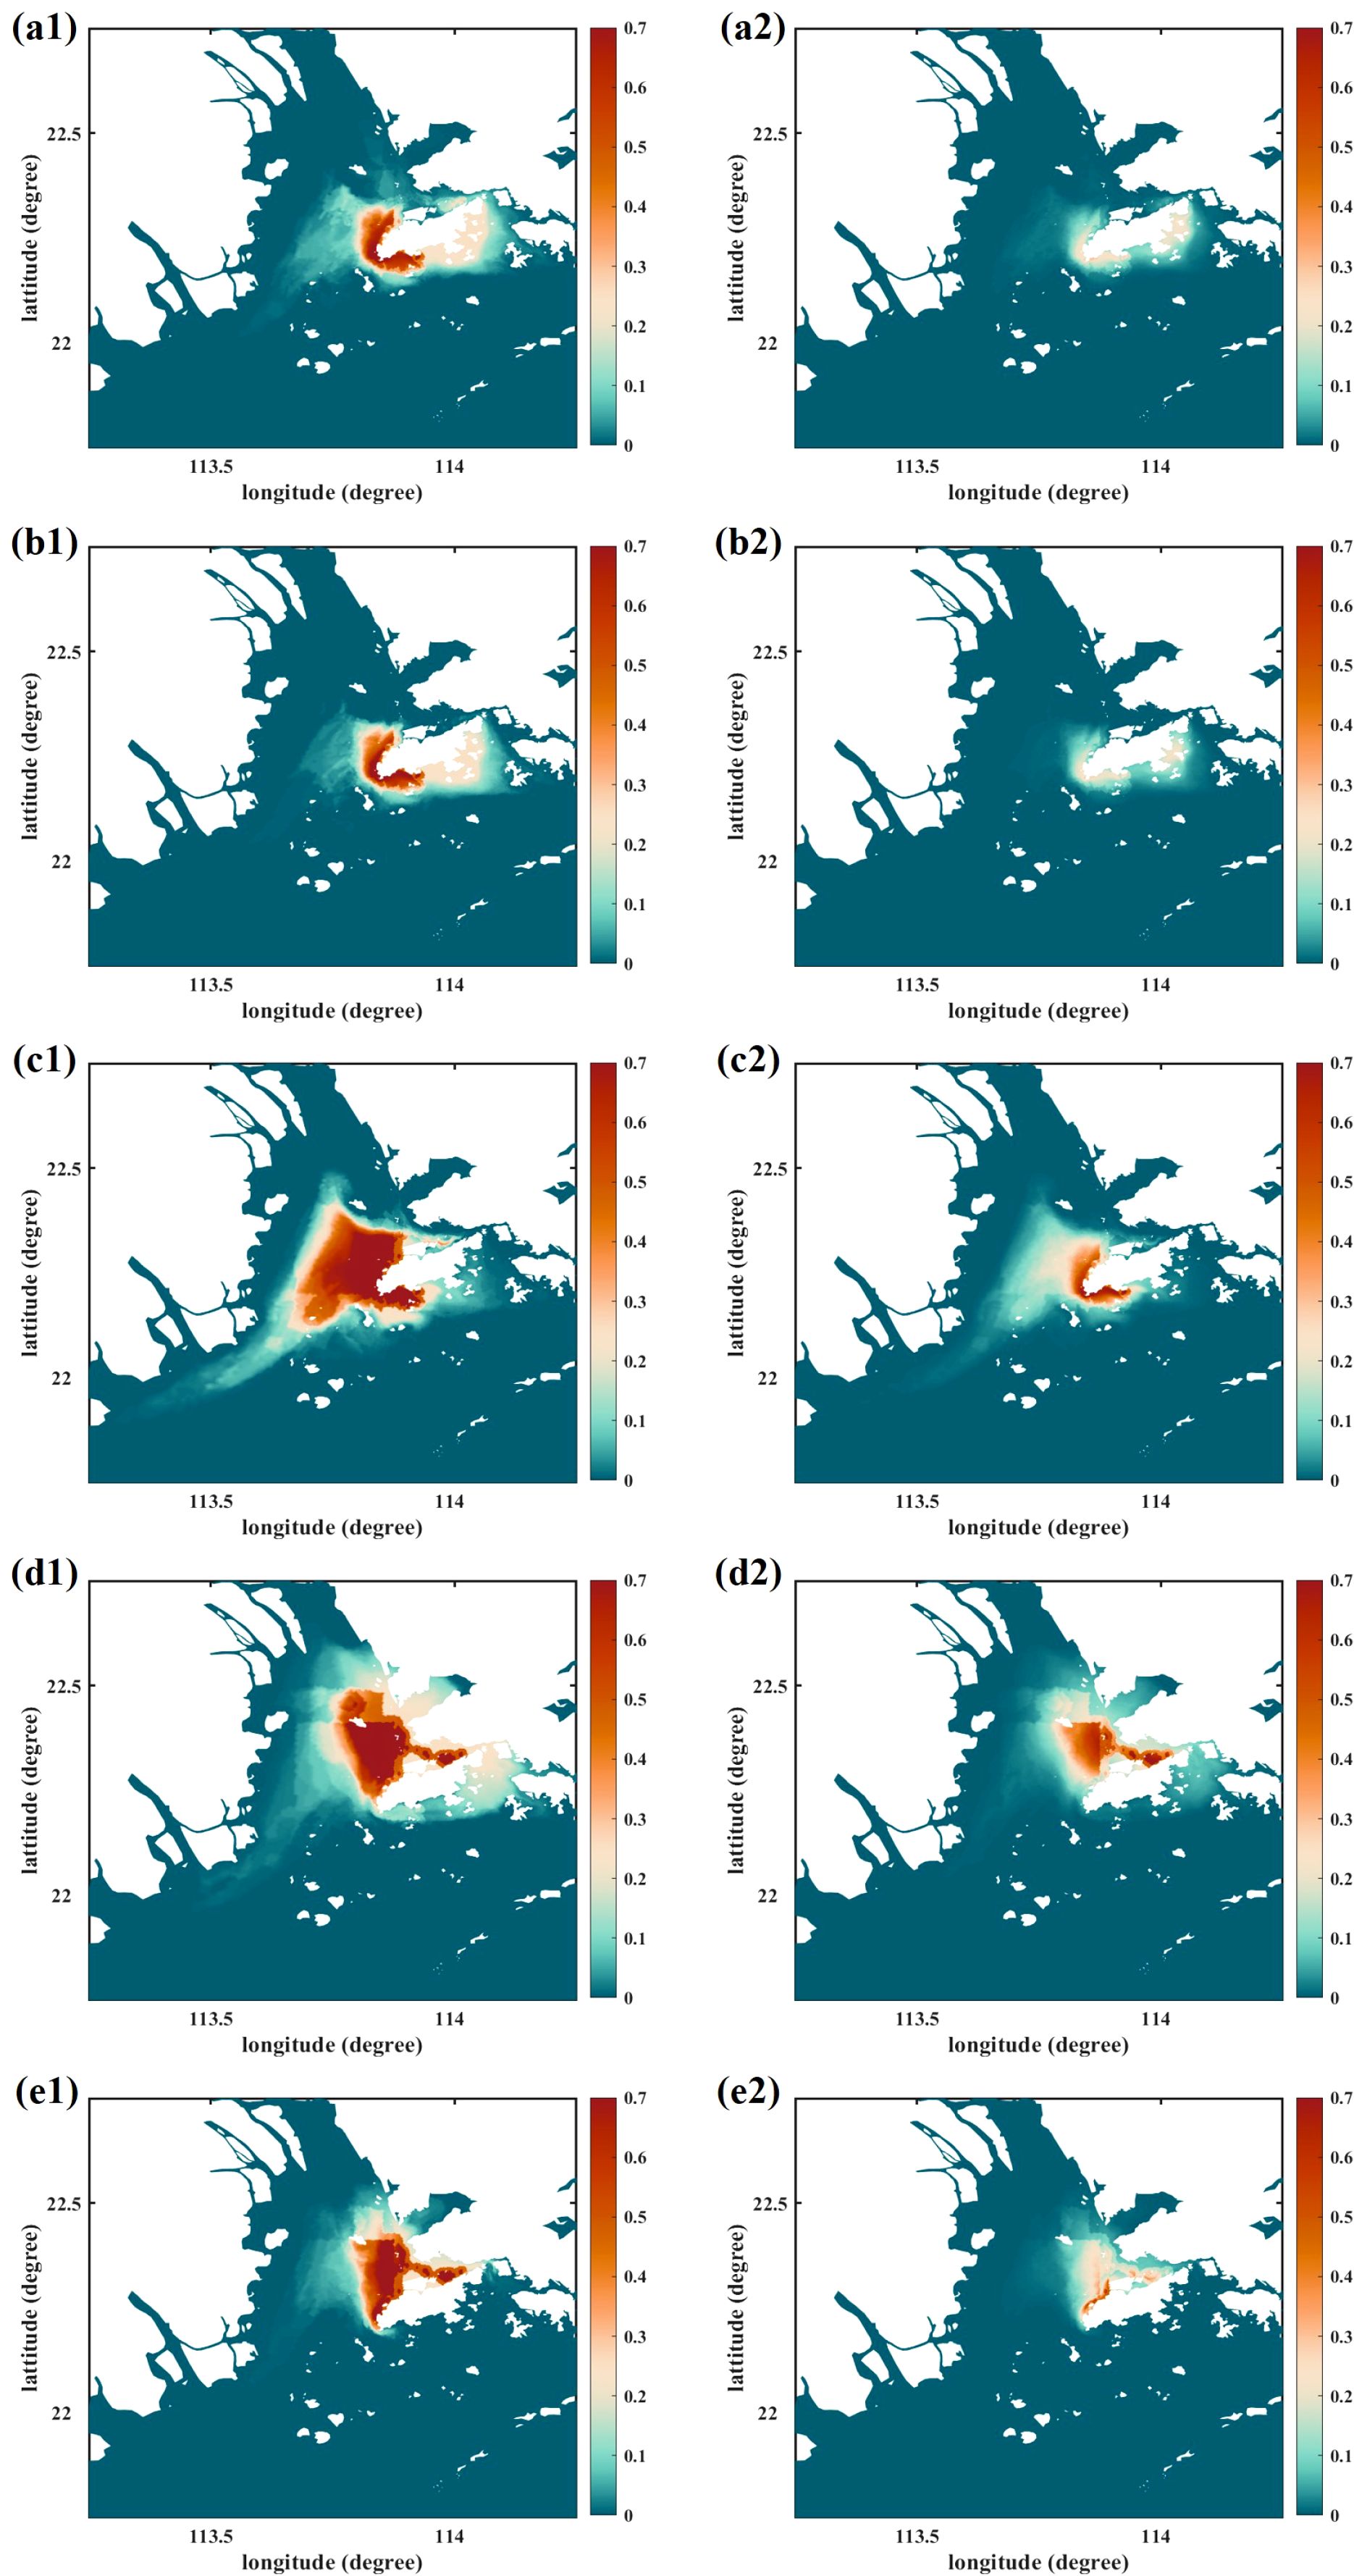
Figure 6. Risk maps of five dredging locations regarding occurrence and significance: (a–e) denote the five dredging locations I, II, III, IV, and V; (a1–e1) risk of occurrence, (a2–e2) risk of significance.
The significance of risk of the five cases is shown in Figures 6a2–e2. Cases I and II had the lowest risk among the five cases since the dredging locations were far from the reservation area and places with high dolphin sighting rates. Besides that, unlike the occurrence of risk in case I and II, the west side of Lantau Island exhibited similar risk magnitudes, around 0.2, compared with the east side, indicating the difference between the significance and occurrence parameters. The risk magnitudes of significance also decreased in the other three cases compared with the risk values of occurrence. In case III, the size of the high-risk area decreased and centered around the west headland of Lantau Island in a C-shape. The high-risk area in case IV was distributed in Urmston Road, starting from the dredging location and expanding toward the northwest until the northeast corner of the Guangdong–PRE National Reservation. Case V possessed a high-risk area very close to the northwest coastlines of Lantau Island, which was much smaller than that of case IV. The difference between cases IV and V again further confirmed that the shorter distance between dredging locations and the reservation will not definitely lead to a higher risk.
Basically, locations III and IV were the most unsuitable dredging locations from a comprehensive view. Location III represents the southwest adjacent waters of Lantau Island, facing the SCS. If dredging operations take place in this area, sediment particles would be convected into PRE by tidal currents and also transported toward the west owing to the macro-vortices’ dynamics around headlands and compound channels, i.e., Lantau Channel, based on the knowledge of local circulations demonstrated in He et al (2022, 2023). On the other hand, location IV stands for the area in the east of HK airport shielded by the north coastlines of Lantau Island and close to Urmston Road. This place is dominated by tide-generated macro-vortices which are persistent the whole year long. Sediment particles could be transported quickly to the upper stream of Urmston Road due to the generation and destruction of the high density of macrovortices, where the north coastlines of Lantau Island play an important role in preventing sediment particles from going downstream.
4 Discussion
4.1 Comparisons of risk regarding different dredging locations
The above maps of hazard and risk spatial distributions can directly reveal the highly polluted area. However, the comparison among the different dredging solutions, in our case, the dredging locations, is one of the main aspects during the planning and management phases of any dredging project (Feola et al., 2016; Zarzuelo et al., 2019; De Padova et al., 2020). A quantitative comparison is usually based on more synthetic indexes or graphical presentation. Examples are the SSC number (Erm and Soomere, 2006; Rapaglia et al., 2011) developed to describe the resuspension due to ship wakes and semivariogram functions (Matheron, 1963; Feola et al., 2016) and the more recent Dredging Sensitivity Index (DSI) (Trevisan et al., 2020). None of the mentioned approaches was designed in order to evaluate the direct potential risk on marine mammals.
In the following, we discuss the results, mainly the spatial distribution of the probability of risk, using two methods that can synthetically compare different dredging operations (He et al., 2024a). The new approaches to the evaluation of risk could represent a valuable tool during the planning and decision making process.
The first method, risk boxes, is to compute the statistical moments of the risk values obtained for each case. In fact, we use box plots based on the spatial distribution of the risk values. By demonstrating the locality, spread, and skewness groups, the risk values of all the mesh nodes could be considered as an arithmetic progression for one risk map of each dredging scenario. A risk box or box-and-whisker plot synthetically summarizes the main statistical properties of a set of data, in this case risk values. In fact, the median value is shown inside a box bounded between the first and third quartile. Moreover, the whiskers represent the minimum and maximum values, excluding the outliers.
Figure 7 presents the risk boxes regarding occurrence and significance of risk. Panels (a) and (c) show the distribution of non-zero risk values calculated based on the whole domain, regarding occurrence and significance of risk, respectively. In addition, one trick was used to better visualize the dredging risk to dolphins by ignoring the area with vulnerability index equal to 1. By this means, Figures 6b, d could present the occurrence and significance of risk only in reservation areas and places with high sighting frequency of humpback dolphins.
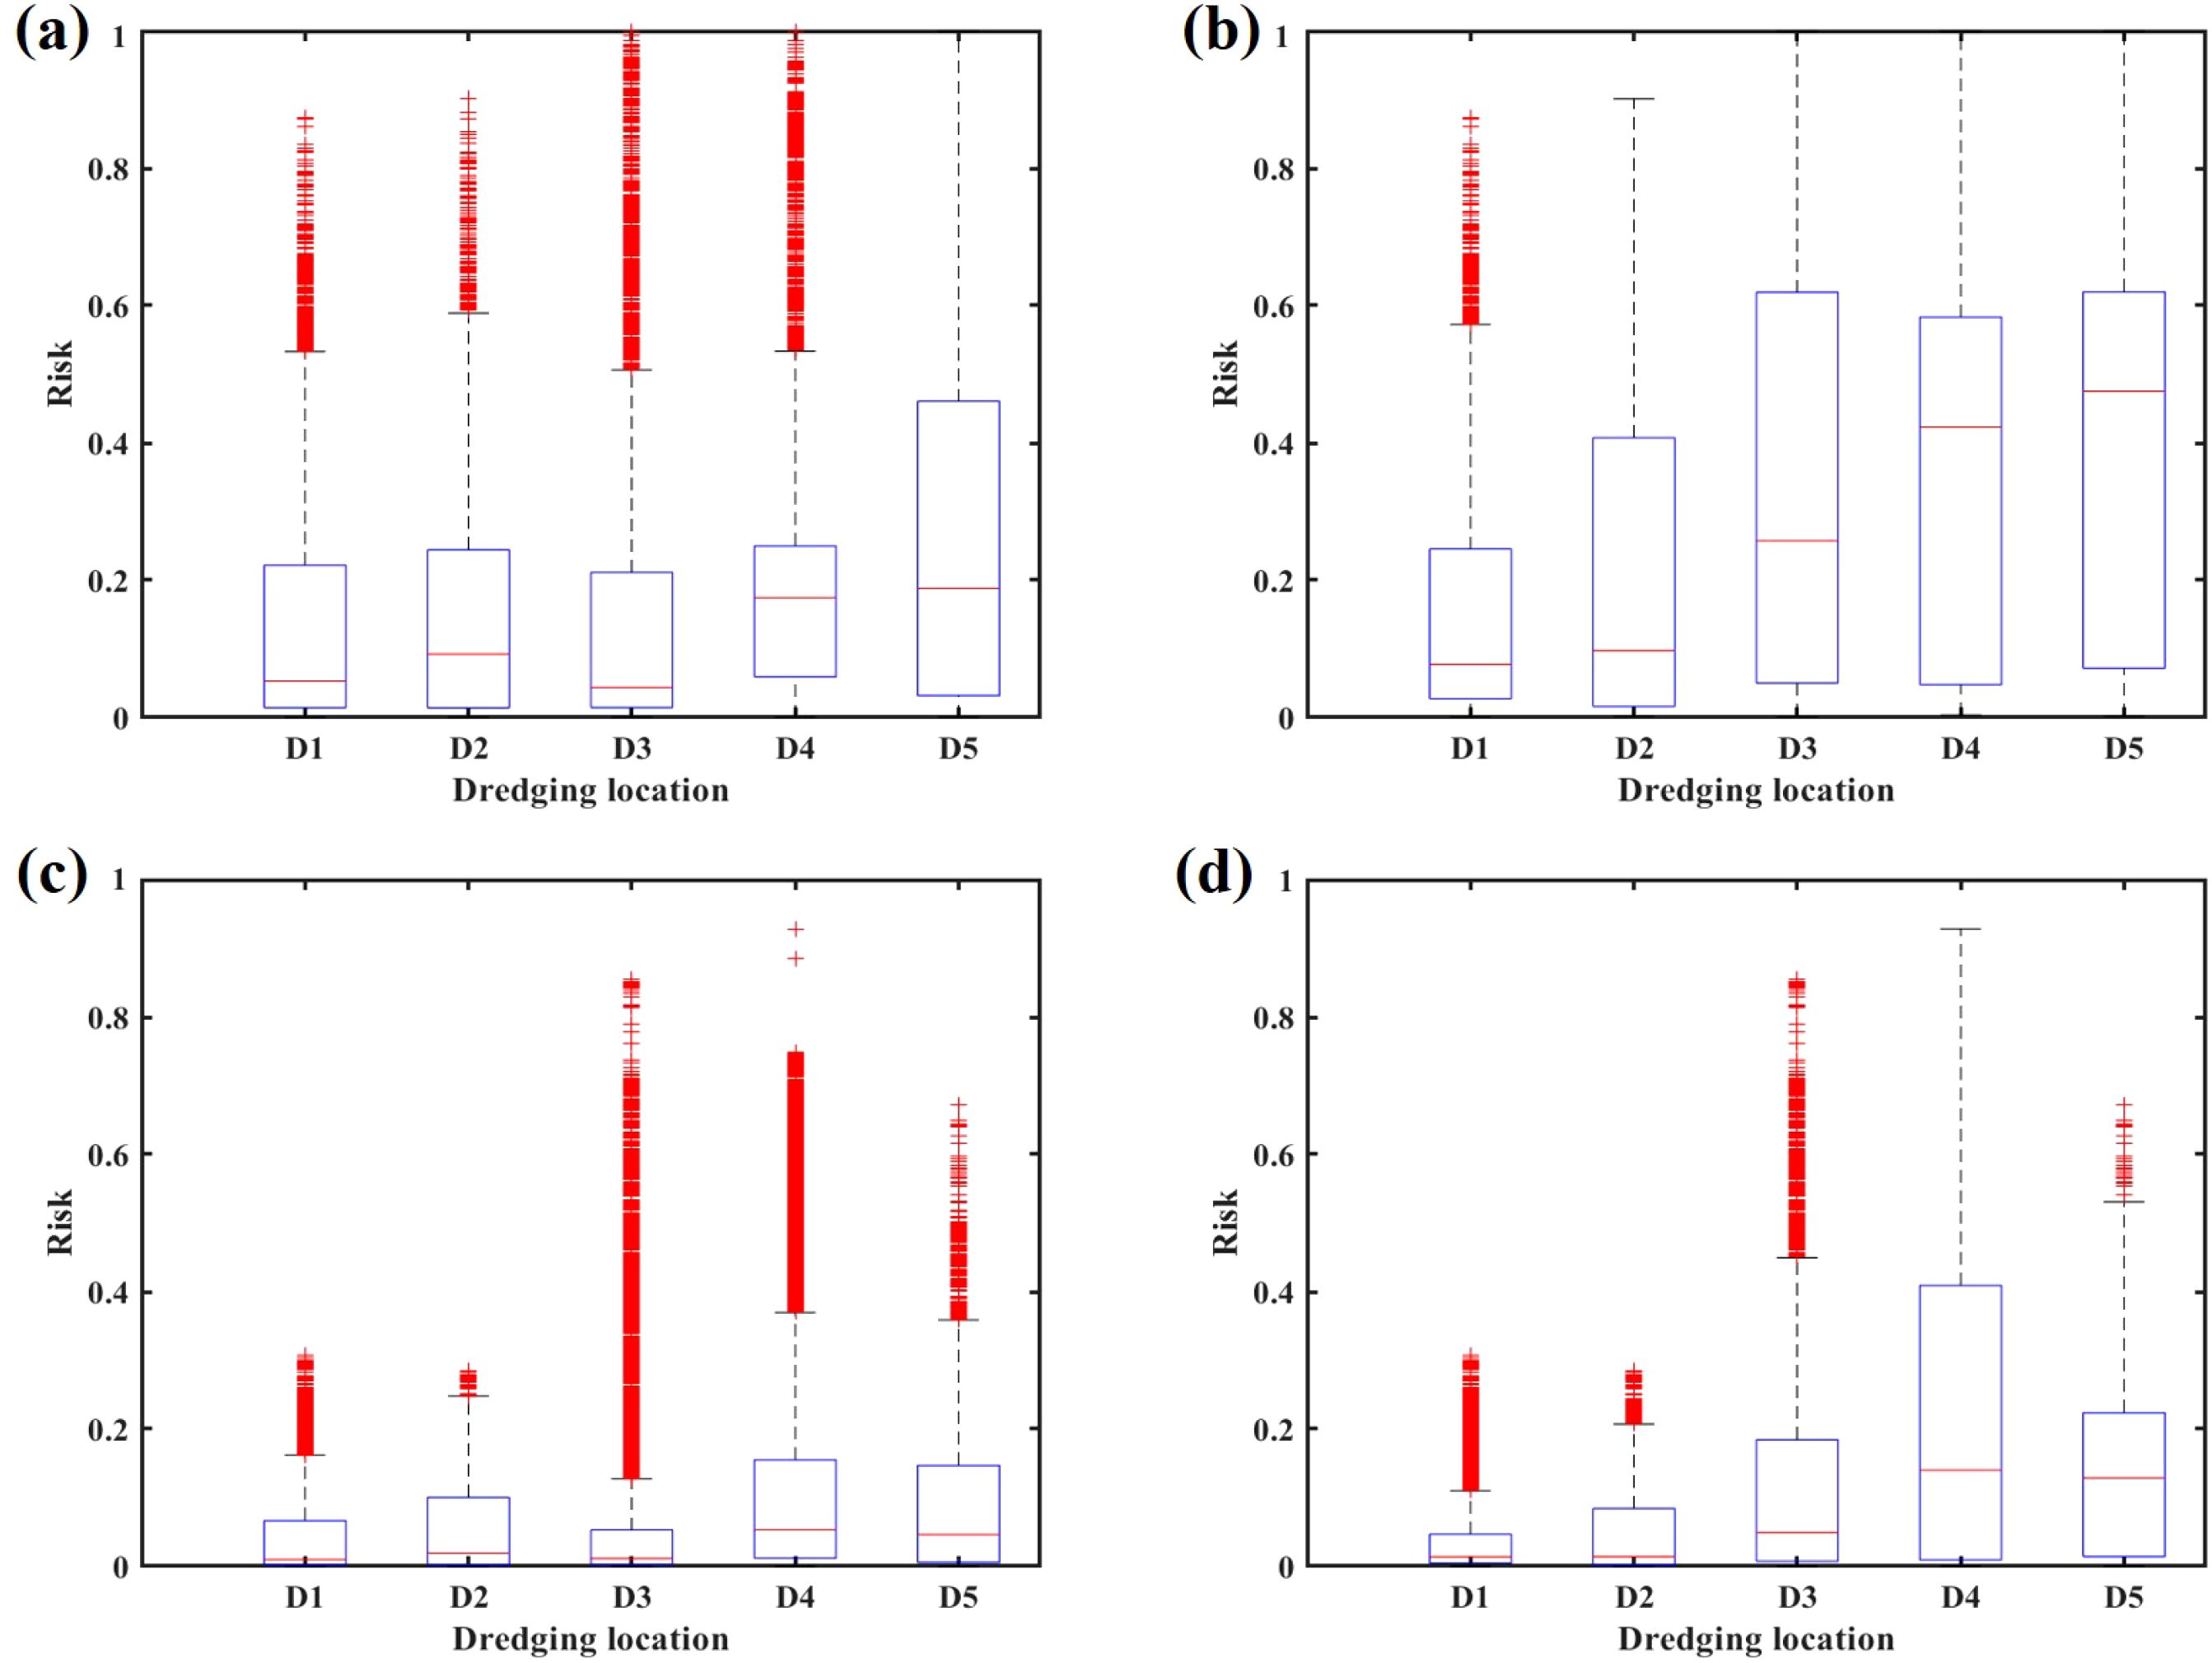
Figure 7. Box plots showing the risk numbers of five dredging locations: non-zero risk numbers of occurrence (a) and significance (c) calculated based on the whole domain and risk numbers of occurrence (b) and significance (d) calculated in the dolphin reservation and high probability of observation area.
Figure 7a shows the occurrence of non-zero risk values regarding five dredging locations. Since zero-risk data points were excluded, the cross-comparisons should be made when the data capacities are analogous. In this case, the polluted area should be roughly similar if comparing among the risk boxes. It could be found in panel (a) that case II had a higher risk than case I based on the mean value, 75th percentiles, and maximum values of the boxes, considering that these two cases had similar polluted areas as shown in Figures 6a1, b1. Cases III and IV were another pair possessing similar sizes in terms of polluted areas. From the risk boxes, it could be found that case IV had a far larger mean risk value than case III, and both cases had a maximum value of more than 0.5 and massive outliers even reaching 1. For case V, the risk box showed that the maximum value reached 1 with no outliers, and the mean value was around 0.2. However, the contaminated area of case V was apparently smaller than case III or case IV regarding both occurrence and significance criteria. This indicated that the polluted area in case V was more concentrated with larger risk magnitudes. The significance of risk is shown in Figure 7c and could be analyzed following the same logic, leading to similar findings as above. In addition, the magnitudes of significance of risk were greatly lower than occurrence. Cases I and II had no outliers exceeding 0.4, whereas massive outliers were still found in cases III and IV, indicating a certain small area with a high risk of more than 0.4.
Figures 7b, d have targeted the area with a vulnerability index larger than 1. By this means, some of the risk data points from areas with limited humpback dolphin activities were excluded or, more probably, low risk points. The remaining sample capacities of five cases were more comparable than those of Figures 7a, c. In addition, the boxes were enlarged in both sizes and characteristic values. It could be found that in highly vulnerable places, cases I and II had a lower risk in places among the five cases. It is worth noting that case IV had the largest risk without outliers, indicating that location IV was the most unsuitable dredging location.
It is worth noting that cases IV and V differed largely in risk, which could be found in both risk distribution maps and risk boxes. In fact, the north side of Lantau Island has attracted lots of attention regarding the protection of humpback dolphins due to the high abundance in dolphin population and reclamation projects, such as HK airport construction (Jefferson, 2000; Marcotte et al., 2015; Piwetz et al., 2021). In the meantime, this area exhibited complex circulations which further complicate the sediment transport during dredging and reclamation (Pan et al., 2020; Chu et al., 2022; He et al., 2022). Based on the abovementioned risk assessment strategy and analysis, it can be concluded that the dredging plume development varies significantly with the choice of dredging locations, which is mainly driven by the local circulations. Currently, the third runway of HK airport is under construction, located in the north of Lantau Island. This study can help the decision-makers with the choice of dredging or reclamation location based on quantified risk in terms of turbidity increase for the better protection of humpback dolphins.
4.2 Risk roses based on the wind features
In this section, we introduced the second method to synthetically represent the risk distribution.
Previous results have devoted to presenting the hazard and risk from a space-based view. However, the decision makers or project executers may also concern about the risk from a time-based view to avoid working in “dangerous” weather or take more measures to protect marine environment and creatures. The PRE–HK region experiences south–southwest monsoon wind in summer and stronger northeast wind in winter. Wind-induced circulations played a non-ignorable role in estuarine circulations and sediment transport. The 100 representative scenarios generated by K-means clustering could characterize the wind features; thus, the risk of each scenario could convey the information in terms of scenario-based distribution of risk. The risk of each scenario regarding wind is defined as:
where Rw(I) is the dredging risk caused by the w scenario regarding wind computed as the integral over the computational domain D of the normalized risk , based on one of the three indexes, I, times the frequency of the scenario, fw.
The wind direction is divided into 16 bins, and each of them occupies 22.5° in order to better group wind data points based on similar directions. The wind direction of data points, which had the frequency of six-hourly data, was calculated and assigned to the 16 classes for each scenario. The class that most frequently appeared was chosen as the representative wind direction of that scenario. Following the logic of wind rose plots, “risk rose” plots could be generated by assigning the Rw(I) numbers, Equation 3, of the M scenarios onto a “rose” according to their representative wind direction instead of using the mean wind intensities of each scenario. By this means, the risk rose directly presents the relationship between the risk and wind features.
Figure 8 presents the occurrence (a1)–(e1) and significance (a2)–(e2) of risk rose of five dredging cases, I, II, III, IV, and V, respectively, considering the area with vulnerability larger than 1. Risk roses only consider that areas with vulnerability higher than 1 could filter out the risk of less important areas and highlight the information regarding dolphin habitats. The block size on the risk roses represents the frequency of scenarios from the corresponding direction. The color of risk roses stands for the risk values.
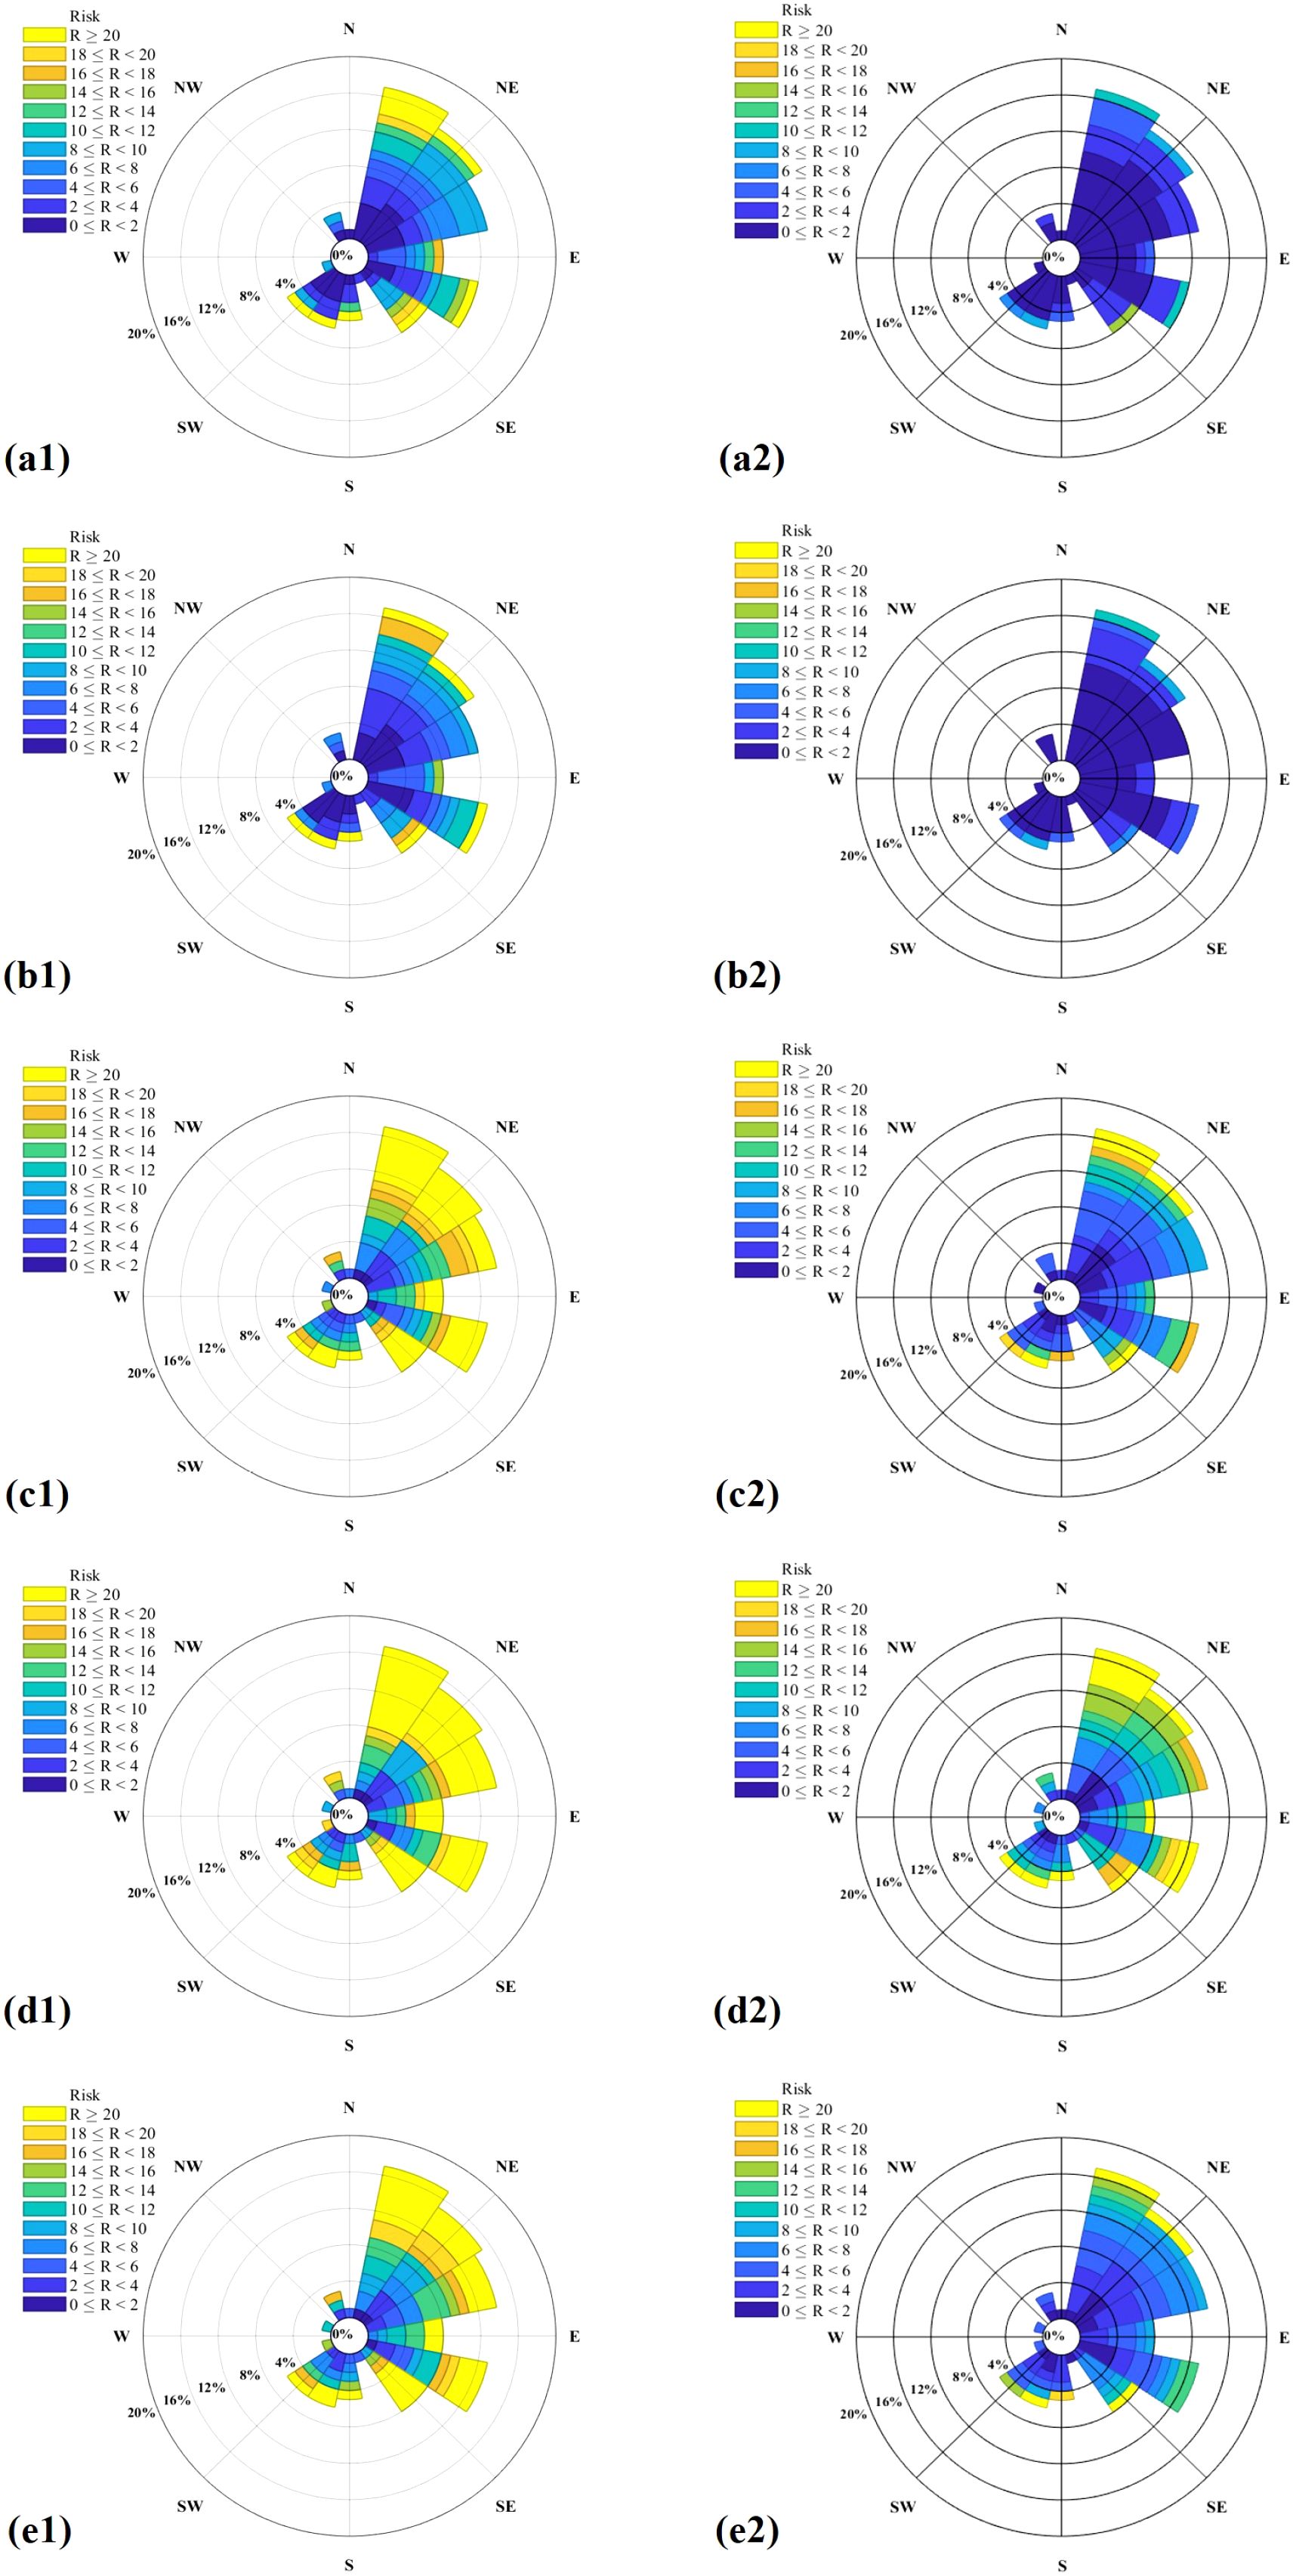
Figure 8. Risk roses calculated over the dolphin reservation and high probability of observation area regarding five dredging locations: (a–e) denote the five dredging locations I, II, III, IV, and V; (a1–e1) risk roses of occurrence, (a2–e2) risk roses of significance.
Figures 8a1–e1 show the occurrence of risk roses only considering areas with vulnerability higher than 1 regarding the five cases. The scenarios with northeast wind related to the most severe risk and highest frequencies in all five cases. Case II had the lowest risk among the five regarding occurrence, whereas cases III, IV, and V had comparable risk and frequencies in all directions. Figures 8a2–e2 show the significance of risk roses only considering areas with vulnerability higher than 1 regarding the five cases. The risk rose of case IV had the most frequent high-risk scenarios compared with the remaining four cases, especially from the northeast direction, indicating the promoting role of winter monsoon in sediment transport. The remaining four cases show comparable risk levels regarding the significance parameter. Cases III and V had a larger frequency of high risk (yellow blocks) from the northeast direction than that of cases I and II. It could be observed that the risk roses of cases I and II had smaller sizes than the other roses when only considering the dolphins’ habitats and reservations—for example, the blocks in the southeast direction in (a2) and the blocks in the northeast direction in (b2). This conveyed the message that there existed scenarios generating zero risk if only areas with vulnerability higher than 1 were concerned in cases I and II.
Wind effects are always concerned in coastal management, such as extreme weather (Wang and Liu, 2021), wind farm, and its related ecosystem problems (Bergström et al., 2014). However, the management of wind regarding sediment transport was less mentioned (Zhang et al., 2023). Wind speed and direction play an important role in mass or sediment transport (Baeye et al., 2011; Sassi et al., 2015; Colosimo et al., 2020). The temporarily stored sediments in the shallow waters or intertidal system were easily re-suspended during wind events (Colosimo et al., 2020). The visualization of risk rose relates the risk of turbidity increase with the wind directions and intensities. Moreover, by selecting interested mesh nodes, this tool could be used as a predictor of risk levels in targeted areas varying with real-time weather information.
5 Conclusions
This study extended the risk assessment framework proposed by He et al. (2024a) to estimate the impact of dredging turbidity increase on the Indo-Pacific humpback dolphin by implementing ocean simulations and K-means clustering technique. Five dredging locations were selected around Lantau Island, in PRE–HK waters, where several ongoing or future dredging/reclamation would take place. A total of 500 sediment transport simulations were conducted, considering five dredging locations and 100 representative metocean scenarios generated by K-means clustering.
The occurrence and significance of hazard proved that the choice of dredging locations made a significant difference in the sediment transport patterns. Local circulations and topography conditions around dredging locations were particularly important for the sediment plume development. Sediment plumes could be enlarged rapidly if dredging around places with a high density of macro-vortices, such as location IV, the north corner of Lantau Island. The north coastlines of Lantau Island could block the transport of sediment particles from tidal currents, such as case V.
The risk values were the products of the hazard and vulnerability index, the latter of which was built based on the sighting rate of dolphins and the national reservation. Dredging on the north corner, case IV, generated the most severe risk to the humpback dolphins. Apart from the risk spatial distributions, the risk boxes and risk roses were introduced to present the risk comparisons among five cases and wind scenarios. Those visualization methods could help better quantify the risk and understand the scenarios requiring special attention.
This study illustrated the risk assessment strategy based on numerical ocean modeling and provides a detailed case study regarding the risk of dredging operations to the humpback dolphins. The strategy can be flexibly modified according to local policies, project tasks, and other marine mammals. This study can serve as an important reference to coastal and environmental management for different considerations.
Furthermore, two aspects of work are worth future efforts. Firstly, the dataset, including K-means results, sediment modeling, hazard modeling, and risk calculation, could be used in risk prediction. The weather forecast, for example, 15 days in this study, could serve as a data point in K-means clustering. It can be determined which cluster this data point belongs to. Then, the risk assessment results of that cluster can be used as a quick prediction. This prediction can also make up a deficiency that humpback dolphin breeding and migration cycles cannot be effectively clustered. An extra coefficient can be added to the risk calculation equation to emphasize the predicted time period. Secondly, this study can guide the risk mitigation operations before, during, and after the projects, such as optimizing the dredging location during the feasibility study, organizing working duties during dredging operations, instructing to set up silt curtains or coagulants, etc. More efforts are needed in quantifying the tolerance limits of marine mammals for better collaboration with computational fluid dynamics (CFD).
Data availability statement
The raw data supporting the conclusions of this article will be made available by the authors, without undue reservation.
Author contributions
CH: Data curation, Investigation, Writing – original draft. AS: Conceptualization, Data curation, Methodology, Supervision, Writing – original draft, Writing – review & editing. Z-YY: Funding acquisition, Methodology, Supervision, Writing – review & editing. FL: Methodology, Writing – review & editing. Y-FJ: Funding acquisition, Writing – review & editing. X-SC: Writing – review & editing.
Funding
The author(s) declare that financial support was received for the research and/or publication of this article. This work is supported by the Research Impact Fund of the Research Grants Council of Hong Kong (R5037-18), and Shenzhen Science and Technology Program (Grant No.: KQTD20221101093555006). A.S. acknowledges the support received by the Research Grants Council of the Hong Kong Special Administrative Region, China (Project Reference Number: AoE/P-601/23-N) and by the Research Institute for Land and Space (RILS) (project ID P0049622).
Acknowledgments
The observed sea level data of tide gauge stations are provided by the Hydrographic Office of the Hong Kong Marine Department. The Finite-Volume Coastal Ocean Model (FVCOM) source code was obtained from the Marine Ecosystem Dynamics Modeling Laboratory (http://fvcom.smast.umassd.edu/).
Conflict of interest
The authors declare that the research was conducted in the absence of any commercial or financial relationships that could be construed as a potential conflict of interest.
Generative AI statement
The author(s) declare that no Generative AI was used in the creation of this manuscript.
Publisher’s note
All claims expressed in this article are solely those of the authors and do not necessarily represent those of their affiliated organizations, or those of the publisher, the editors and the reviewers. Any product that may be evaluated in this article, or claim that may be made by its manufacturer, is not guaranteed or endorsed by the publisher.
References
Ahrens L., Taniyasu S., Yeung L. W., Yamashita N., Lam P. K., and Ebinghaus R. (2010). Distribution of polyfluoroalkyl compounds in water, suspended particulate matter and sediment from Tokyo Bay, Japan. Chemosphere 79, 266–272. doi: 10.1016/j.chemosphere.2010.01.045
Au W. W. L. (2000). Hearing in whales and dolphins: An overview. In: Au W.W.L., Fay R.R., and Popper A.N. (eds) Springer Handbook of Auditory Research, vol 12. New York, NY: Springer. doi: 10.1007/978-1-4612-1150-1_1
Baeye M., Fettweis M., Voulgaris G., and Van Lancker V. (2011). Sediment mobility in response to tidal and wind-driven flows along the belgian inner shelf, southern north sea. Ocean Dynamics 61, 611–622. doi: 10.1007/s10236-010-0370-7
Bárcena J. F., García-Alba J., García A., and Álvarez C. (2016). Analysis of stratification patterns in river-influenced mesotidal and macrotidal estuaries using 3d hydrodynamic modelling and k-means clustering. Estuarine Coast. Shelf Sci. 181, 1–13. doi: 10.1016/j.ecss.2016.08.005
Becker J., van Eekelen E., van Wiechen J., de Lange W., Damsma T., Smolders T., et al. (2015). Estimating source terms for far field dredge plume modelling. J. Environ. Manage. 149, 282–293. doi: 10.1016/j.jenvman.2014.10.022
Bergström L., Kautsky L., Malm T., Rosenberg R., Wahlberg M., Capetillo N.Å., et al. (2014). Effects of offshore wind farms on marine wildlife—a generalized impact assessment. Environ. Res. Lett. 9, 034012.
Bishop C. M. and Nasrabadi N. M. (2006). Pattern recognition and machine learning Vol. 4 (New York: Springer).
Carvalho M., Melo-Goncalves P., Teixeira J., and Rocha A. (2016). Regionalization of europe based on a k-means cluster analysis of the climate change of temperatures and precipitation. Phys. Chem. Earth Parts A/B/C 94, 22–28. doi: 10.1016/j.pce.2016.05.001
Castanedo S., Abascal A., Medina R., Fernandez F., Liste M., and Olabarrieta M. (2009a). “Development of a gis-based oil spill risk assessment system,” in OCEANS 2009-EUROPE (New York: IEEE), 1–6.
Castanedo S., Juanes J., Medina R., Puente A., Fernandez F., Olabarrieta M., et al. (2009b). Oil spill vulnerability assessment integrating physical, biological and socio-economical aspects: Application to the cantabrian coast (bay of biscay, Spain). J. Environ. Manage. 91, 149–159.
Chan S. C. and Karczmarski L. (2019). Epidermal lesions and injuries of coastal dolphins as indicators of ecological health. EcoHealth 16, 576–582. doi: 10.1007/s10393-019-01428-0
Chen T., Hung S. K., Qiu Y., Jia X., and Jefferson T. A. (2010). Distribution, abundance, and individual movements of indo-pacific humpback dolphins (sousa chinensis) in the pearl river estuary, China. Mammalia 74, 117–125. Walter de Gruyter Berlin. doi: 10.1515/MAMM.2010.024
Chen C., Liu H., and Beardsley R. C. (2003). An unstructured grid, finite-volume, three-dimensional, primitive equations ocean model: application to coastal ocean and estuaries. J. Atmospheric Oceanic Technol. 20, 159–186. doi: 10.1175/1520-0426(2003)020<0159:AUGFVT>2.0.CO;2
Chiri H., Abascal A. J., and Castanedo S. (2020). Deep oil spill hazard assessment based on spatiotemporal met-ocean patterns. Mar. pollut. Bull. 154, 111123. doi: 10.1016/j.marpolbul.2020.111123
Chu N., Liu G., Xu J., Yao P., Du Y., Liu Z., et al. (2022). Hydrodynamical transport structure and lagrangian connectivity of circulations in the pearl river estuary. Front. Mar. Sci. 9, 996551. doi: 10.3389/fmars.2022.996551
Colosimo I., de Vet P. L., van Maren D. S., Reniers A. J., Winterwerp J. C., and van Prooijen B. C. (2020). The impact of wind on flow and sediment transport over intertidal flats. J. Mar. Sci. Eng. 8, 910. doi: 10.3390/jmse8110910
Cremonini G., De Leo F., Stocchino A., and Besio G. (2021). On the selection of time-varying scenarios of wind and ocean waves: Methodologies and applications in the north tyrrhenian sea. Ocean Model. 163, 101819. doi: 10.1016/j.ocemod.2021.101819
De Padova D., Ben Meftah M., De Serio F., and Mossa M. (2020). Management of dredging activities in a highly vulnerable site: Simulation modelling and monitoring activity. J. Mar. Sci. Eng. 8, 1020. doi: 10.3390/jmse8121020
Di Risio M., Pasquali D., Lisi I., Romano A., Gabellini M., and De Girolamo P. (2017). An analytical model for preliminary assessment of dredging-induced sediment plume of far-field evolution for spatial non homogeneous and time varying resuspension sources. Coast. Eng. 127, 106–118. doi: 10.1016/j.coastaleng.2017.06.003
Erm A. and Soomere T. (2006). The impact of fast ferry traffic on underwater optics and sediment resuspension. Oceanologia 48, 283–301.
Feng W.-Q., Lalit B., Yin Z.-Y., and Yin J.-H. (2017). Long-term non-linear creep and swelling behavior of hong kong marine deposits in oedometer condition. Comput. Geotech. 84, 1–15. doi: 10.1016/j.compgeo.2016.11.009
Feola A., Lisi I., Salmeri A., Venti F., Pedroncini A., Gabellini M., et al. (2016). Platform of integrated tools to support environmental studies and management of dredging activities. J. Environ. Manage. 166, 357–373. doi: 10.1016/j.jenvman.2015.10.022
Gui D., Yu R., He X., Tu Q., Chen L., and Wu Y. (2014). Bioaccumulation and biomagnification of persistent organic pollutants in indo-pacific humpback dolphins (sousa chinensis) from the pearl river estuary, China. Chemosphere 114, 106–113. doi: 10.1016/j.chemosphere.2014.04.028
Gui D., Yu R.-Q., Karczmarski L., Ding Y., Zhang H., Sun Y., et al. (2017). Spatiotemporal trends of heavy metals in indo-pacific humpback dolphins (sousa chinensis) from the western pearl river estuary, China. Environ. Sci. Technol. 51, 1848–1858. doi: 10.1021/acs.est.6b05566
Guo L., Lin W., Zeng C., Luo D., and Wu Y. (2020). Investigating the age composition of indo-pacific humpback dolphins in the pearl river estuary based on their pigmentation pattern. Mar. Biol. 167, 1–12.
Guo L., Luo D., Yu R.-Q., Zeng C., Huang N., Wang H., et al. (2022). Habitat decline of the largest known indo-pacific humpback dolphin (sousa chinensis) population in poorly protected areas associated with the hypoxic zone. Front. Mar. Sci. 9, 1048959. doi: 10.3389/fmars.2022.1048959
He C., De Leo F., Stocchino A., Yin Z.-Y., Abascal A. J., and Jin Y.-F. (2024a). Environmental risk assessment of coastal dredging based on clustering of meteocean forcing. Coast. Eng. 192, 104555. doi: 10.1016/j.coastaleng.2024.104555
He C., Stocchino A., He Y., Leung K. M. Y., De Leo F., Yin Z.-Y., et al. (2024b). Risk assessment of e-waste-liquid crystal monomers re-suspension caused by coastal dredging operations. Sci. Total Environ. 933, 173176. doi: 10.1016/j.scitotenv.2024.173176
He C., Yin Z. Y., Stocchino A., and Wai O. W. H. (2023). Generation of macro-vortices in estuarine compound channels. Front. Mar. Sci. 10, 1082506. doi: 10.3389/fmars.2023.1082506
He C., Yin Z.-Y., Stocchino A., Wai O. W. H., and Li S. (2022). The coastal macro-vortices dynamics in hong kong waters and its impact on water quality. Ocean Model. 175, 102034. doi: 10.1016/j.ocemod.2022.102034
Hitchcock D. R. and Bell S. (2004). Physical impacts of marine aggregate dredging on seabed resources in coastal deposits. J. Coast. Res. 20, 101–114. doi: 10.2112/1551-5036(2004)20[101:PIOMAD]2.0.CO;2
Hoffman C. A. (2012). “Mitigating impacts of underwater noise from dredging on beluga whales in cook inlet, Alaska,” in The Effects of Noise on Aquatic Life (New York: Springer), 617–619.
Huang S.-L., Karczmarski L., Chen J., Zhou R., Lin W., Zhang H., et al. (2012). Demography and population trends of the largest population of indo-pacific humpback dolphins. Biol. Conserv. 147, 234–242. doi: 10.1016/j.biocon.2012.01.004
Hung S. (2015). Monitoring of marine mammals in hong kong waters, (2014-15) (Hong Kong: Agriculture, Fisheries and Conservation Department of Hong Kong SAR Government), 1–151.
Jefferson T. A. (2000). Population biology of the indo-pacific hump-backed dolphin in hong kong waters. Wildlife Monogr. 144, 1–65. Available online at: http://www.jstor.org/stable/3830809.
Jefferson T. A., Hung S. K., and Würsig B. (2009). Protecting small cetaceans from coastal development: Impact assessment and mitigation experience in hong kong. Mar. Policy 33, 305–311. doi: 10.1016/j.marpol.2008.07.011
Jefferson T. A. and Smith B. D. (2016). Re-assessment of the conservation status of the indo-pacific humpback dolphin (sousa chinensis) using the iucn red list criteria. Adv. Mar. Biol. 73, 1–26. doi: 10.1016/bs.amb.2015.04.002
Kalnejais L. H., Martin W. R., Signell R. P., and Bothner M. H. (2007). Role of sediment resuspension in the remobilization of particulate-phase metals from coastal sediments. Environ. Sci. Technol. 41, 2282–2288. doi: 10.1021/es061770z
Karczmarski L., Huang S.-L., Or C. K., Gui D., Chan S. C., Lin W., et al. (2016). Humpback dolphins in hong kong and the pearl river delta: Status, threats and conservation challenges. Adv. Mar. Biol. 73, 27–64. doi: 10.1016/bs.amb.2015.09.003
Lai R. W., Perkins M. J., Ho K. K., Astudillo J. C., Yung M. M., Russell B. D., et al. (2016). Hong kong’s marine environments: History, challenges and opportunities. Regional Stud. Mar. Sci. 8, 259–273. doi: 10.1016/j.rsma.2016.09.001
Landers M. N. and Sturm T. W. (2013). Hysteresis in suspended sediment to turbidity relations due to changing particle size distributions. Water Resour. Res. 49, 5487–5500. doi: 10.1002/wrcr.20394
Lin C.-h., Lin H.-J., Suen J.-P., and Chou L.-S. (2021). Association between estuary characteristics and activities of the critically endangered indo-pacific humpback dolphin (sousa chinensis). Front. Mar. Sci. 8, 577976. doi: 10.3389/fmars.2021.577976
Lisi I., Feola A., Bruschi A., Di Risio M., Pedroncini A., Pasquali D., et al. (2017). La modellistica matematica nella valutazione degli aspetti fisici legati alla movimentazione dei sedimenti in aree marino-costiere. Manuali E. Linee Guida ISPRA 169, 144.
Liu M., Lin M., and Li S. (2023). Population distribution, connectivity and differentiation of indo-pacific humpback dolphins in chinese waters: Key baselines for improving conservation management. Aquat. Conserv.: Mar. Freshw. Ecosyst. 33, 409–422. doi: 10.1002/aqc.3930
Lloyd S. (1982). Least squares quantization in pcm. IEEE Trans. Inf. Theory 28, 129–137. doi: 10.1109/TIT.1982.1056489
Loperfido J., Just C. L., Papanicolaou A. N., and Schnoor J. L. (2010). In situ sensing to understand diel turbidity cycles, suspended solids, and nutrient transport in clear creek, Iowa. Water Resour. Res. 46, W06525. doi: 10.1029/2009WR008293
Manap N. and Voulvoulis N. (2014). Risk-based decision-making framework for the selection of sediment dredging option. Sci. Total Environ. 496, 607–623. doi: 10.1016/j.scitotenv.2014.07.009
Manap N. and Voulvoulis N. (2015). Environmental management for dredging sediments–the requirement of developing nations. J. Environ. Manage. 147, 338–348. doi: 10.1016/j.jenvman.2014.09.024
Marcotte D., Hung S. K., and Caquard S. (2015). Mapping cumulative impacts on hong kong’s pink dolphin population. Ocean Coast. Manage. 109, 51–63. doi: 10.1016/j.ocecoaman.2015.02.002
Marine Aggregate Levy Sustainability Fund. (2009) A generic investigation into noise profiles of marine dredging in relation to the acoustic sensitivity of the marine fauna in UK waters with particular emphasis on aggregate dredging. MEPF Ref No: MEPF 8, P21.
Martínez A., Abascal A. J., García A., Aragón G., and Medina R. (2024). Lagrangian modelling of oil concentrations at sea: A sensitivity analysis to the grid resolution and number of lagrangian elements. Mar. pollut. Bull. 198, 115787. doi: 10.1016/j.marpolbul.2023.115787
Matheron G. (1963). Principles of geostatistics. Econom. Geol. 58, 1246–1266. doi: 10.2113/gsecongeo.58.8.1246
McQueen A. D., Suedel B. C., de Jong C., and Thomsen F. (2020). Ecological risk assessment of underwater sounds from dredging operations. Integrated Environ. Assess. Manage. 16, 481–493. doi: 10.1002/ieam.4261
Mooney T. A., Nachtigall P. E., Breese M., Vlachos S., and Au W. W. (2009). Predicting temporary threshold shifts in a bottlenose dolphin (tursiops truncatus): The effects of noise level and duration. J. Acoustical Soc. America 125, 1816–1826. doi: 10.1121/1.3068456
Núñez P., García A., Mazarrasa I., Juanes J. A., Abascal A. J., Méndez F., et al. (2019). A methodology to assess the probability of marine litter accumulation in estuaries. Mar. pollut. Bull. 144, 309–324. doi: 10.1016/j.marpolbul.2019.04.077
Pan J., Lai W., and Devlin A. T. (2020). Channel-trapped convergence and divergence of lateral velocity in the pearl river estuary: Influence of along-estuary variations of channel depth and width. J. Geophysical Res.: Oceans 125, e2019JC015369.
Piwetz S., Jefferson T. A., and Würsig B. (2021). Effects of coastal construction on indo-pacific humpback dolphin (sousa chinensis) behavior and habitat-use off hong kong. Front. Mar. Sci. 8, 572535. doi: 10.3389/fmars.2021.572535
Rangel-Buitrago N., Neal W. J., and de Jonge V. N. (2020). Risk assessment as tool for coastal erosion management. Ocean Coast. Manage. 186, 105099. doi: 10.1016/j.ocecoaman.2020.105099
Rapaglia J., Zaggia L., Ricklefs K., Gelinas M., and Bokuniewicz H. (2011). Characteristics of ships’ depression waves and associated sediment resuspension in venice lagoon, Italy. J. Mar. Syst. 85, 45–56. doi: 10.1016/j.jmarsys.2010.11.005
Sassi M., Duran-Matute M., van Kessel T., and Gerkema T. (2015). Variability of residual fluxes of suspended sediment in a multiple tidal-inlet system: the dutch wadden sea. Ocean Dynamics 65, 1321–1333. doi: 10.1007/s10236-015-0866-2
Todd V. L., Todd I. B., Gardiner J. C., Morrin E. C., MacPherson N. A., DiMarzio N. A., et al. (2015). A review of impacts of marine dredging activities on marine mammals. ICES J. Mar. Sci. 72, 328–340. doi: 10.1093/icesjms/fsu187
Trevisan C. L., Vicente M. C., Rocha B. C. S., and Wasserman J. C. (2020). Development of a dredging sensitivity index, applied to an industrialized coastal environment in Brazil. Sci. Total Environ. 748, 141294. doi: 10.1016/j.scitotenv.2020.141294
Uti M. N., Din A. H. M., Yusof N., and Yaakob O. (2023). A spatial-temporal clustering for low ocean renewable energy resources using k-means clustering. Renewable Energy 219, 119549. doi: 10.1016/j.renene.2023.119549
Viavattene C., Jiménez J., Ferreira O., Priest S., Owen D., and McCall R. (2018). Selecting coastal hotspots to storm impacts at the regional scale: A coastal risk assessment framework. Coast. Eng. 134, 33–47. doi: 10.1016/j.coastaleng.2017.09.002
Wang J. and Liu P. L.-F. (2021). Numerical study on impacts of a concurrent storm-tide-tsunami event in macau and hong kong. Coast. Eng. 170, 104000. doi: 10.1016/j.coastaleng.2021.104000
Wang Q., Tsui M. M., Ruan Y., Lin H., Zhao Z., Ku J. P., et al. (2019). Occurrence and distribution of per-and polyfluoroalkyl substances (pfass) in the seawater and sediment of the south China sea coastal region. Chemosphere 231, 468–477. doi: 10.1016/j.chemosphere.2019.05.162
Weiffen M., Möller B., Mauck B., and Dehnhardt G. (2006). Effect of water turbidity on the visual acuity of harbor seals (phoca vitulina). Vision Res. 46, 1777–1783. doi: 10.1016/j.visres.2005.08.015
Xie B., Bao R., Yin D., Zhu L., Hu R., Cai W., et al. (2022). The spatio-temporal distribution and transport of suspended sediment in laizhou bay: Insights from hydrological and sedimentological investigations. Front. Earth Sci. 10, 994258. doi: 10.3389/feart.2022.994258
Yin J., Chen W., Tan D., and Wu P. (2022). A sustainable approach to marine reclamations using local dredged marine soils and wastes: Soft soil improvement, physical modelling study, and settlement prediction-control. AIJR Proc. 1–14. doi: 10.21467/proceedings
Zahmatkesh Z., Karamouz M., and Nazif S. (2015). Uncertainty based modeling of rainfall-runoff: combined differential evolution adaptive metropolis (dream) and k-means clustering. Adv. Water Resour. 83, 405–420. doi: 10.1016/j.advwatres.2015.06.012
Zarzuelo C., López-Ruiz A., and Ortega-Sánchez M. (2019). Evaluating the impact of dredging strategies at tidal inlets: Performance assessment. Sci. Total Environ. 658, 1069–1084. doi: 10.1016/j.scitotenv.2018.12.227
Zhang X., Luo D., Yu R.-Q., Xie Z., He L., and Wu Y. (2021). Microplastics in the endangered indo-pacific humpback dolphins (sousa chinensis) from the pearl river estuary, China. Environ. pollut. 270, 116057. doi: 10.1016/j.envpol.2020.116057
Zhang H.-X., Shen Y.-M., and Tang J. (2023). Wave and storm surge evolutions in the pearl river estuary with large-scale land reclamation impacts. Ocean Eng. 273, 113977. doi: 10.1016/j.oceaneng.2023.113977
Keywords: risk assessment, humpback dolphin, coastal dredging, pearl river estuary, sediment transport
Citation: He C, Stocchino A, Yin Z-Y, De Leo F, Jin Y-F and Chen X-S (2025) Risk assessment of coastal dredging sediment plumes on the habitat of Indo-Pacific humpback dolphin (Sousa chinensis). Front. Mar. Sci. 12:1617954. doi: 10.3389/fmars.2025.1617954
Received: 25 April 2025; Accepted: 07 July 2025;
Published: 01 August 2025.
Edited by:
Vanessa F Fonseca, Center for Marine and Environmental Sciences (MARE), PortugalReviewed by:
Periyadan K Krishnakumar, National Center for Wildlife, Saudi ArabiaNuning Vita Hidayati, Fisheries and Marine Science Faculty, Indonesia
Copyright © 2025 He, Stocchino, Yin, De Leo, Jin and Chen. This is an open-access article distributed under the terms of the Creative Commons Attribution License (CC BY). The use, distribution or reproduction in other forums is permitted, provided the original author(s) and the copyright owner(s) are credited and that the original publication in this journal is cited, in accordance with accepted academic practice. No use, distribution or reproduction is permitted which does not comply with these terms.
*Correspondence: Alessandro Stocchino, YWxlc3NhbmRyby5zdG9jY2hpbm9AcG9seXUuaGsuZWR1