 Dong Liang1,2,3
 Na Gao1,3*
 Mingli Zhao1,4*Mianrun Chen1,2,3Dongling Li5
 Haobing Cao6Zhaoyuan Zhang5Huamei Huang1,2,3
 Huaguo Zhang6
- 1South China Sea Development Research Institute, Ministry of Natural Resources, Guangzhou, China
- 2Southern Marine Science and Engineering Guangdong Laboratory (Zhuhai), Zuhai, China
- 3South China Sea Remote Sensing Mapping Collaborative Application Technology Innovation Center, Ministry of Natural Resources, Guangzhou, China
- 4South China Sea Sea Area and Island Center, Ministry of Natural Resources, Guangzhou, China
- 5State Key Laboratory of Satellite Ocean Environment Dynamics, Second Institute of Oceanography, Ministry of Natural Resources, Hangzhou, China
- 6The National Key Laboratory of Water Disaster Prevention, Hohai University, Nanjing, China
As critical zones of land–sea interaction, coastal areas serve as core regions for dense populations, economic development, and sustainable social progress. However, coastal erosion poses a significant challenge for China. Current risk management practices often rely on subjective judgment and lack standardized, quantifiable frameworks that integrate both subjective and objective perspectives. This study aims to develop a comprehensive classification framework for coastal degradation risk. By integrating the Analytic Hierarchy Process (AHP) and Criteria Importance Through Intercriteria Correlation (CRITIC) method using game theory, this framework effectively combines expert insights with empirical evidence. Six key indicators were collected for Sheyang coast over the past two decades, including shoreline change rate, nearshore mean wave height, nearshore mean current velocity, salt marsh vegetation area, mudflat area, and coastal slope. Based on the combined weights, coastal damage risk values were calculated. By leveraging the cloud model, critical thresholds were systematically identified to differentiate five risk levels—ranging from accretion to severe erosion—through a comprehensive assessment of shoreline siltation, shoreline stability, shoreline erosion accompanied by salt marsh vegetation disappearance, and steep slope formation with near-complete mudflat loss. This approach integrates multi-dimensional coastal parameters to establish a scientific framework for risk classification, enabling precise distinction between gradual sediment accumulation and catastrophic erosive degradation. The study reveals that the hydrodynamic conditions of Sheyang coast has gradually shifted from tide-dominated to wave-dominated, indicating a significant intensification of wave action in the region. The geomorphology evolved from wide tidal flats to steep erosional features, with a marked cumulative effect of coastal degradation, reflected in the escalation of risk level from level 2 to level 5. The proposed framework exhibits notable enhancements in both accuracy and adaptability, offering robust scientific support for targeted coastal zone management strategies. It not only elevates the precision of risk identification across dynamic coastal environments but also advances the methodological frontiers of coastal risk assessment.
1 Introduction
As a typical transition zone between terrestrial and marine systems, the coastal zone plays a dual role as a vital ecological buffer and a hotspot of intensive human activities. Its dynamic evolution has significant implications for the sustainable socioeconomic development of coastal regions (Liu et al., 2020). Currently, over one-third of China's mainland coastline is threatened by erosion (Cai et al., 2009), and this trend is being further exacerbated by escalating anthropogenic pressures, which continue to intensify environmental stress in these region (Hou et al., 2016). Under these compounded pressures, there is an urgent need for a scientifically grounded and quantitatively robust risk classification framework to guide ecological restoration and enable precise coastal risk management.
Coastal damage risk assessment is essential for disaster risk reduction and sustainable coastal planning. However, most existing studies primarily focus on vulnerability assessment (Alexandrakis and Poulos, 2014; Zhu et al., 2018), with limited attention given to the quantification of degradation risk. In terms of indicator weighting, current methodologies largely rely on single approaches. The Analytic Hierarchy Process (AHP), for example, has been applied to evaluate erosion risks in Fujian Province (Luo et al., 2013), while the entropy weight method has been used to assess ecological vulnerability in western Jilin (Zhang et al., 2014). These approaches, however, exhibit notable limitations: AHP is highly susceptible to subjective bias, while the entropy method remains heavily reliant on data variability, often struggling to effectively integrate expert knowledge with empirical evidence. Likewise, the adoption of equal weighting (Zhu et al., 2018) tends to obscure the differential significance of key risk factors, potentially undermining the precision of risk assessment frameworks. This methodological gap highlights the need for a hybrid approach that synergizes subjective judgment with objective data metrics. The challenge remains to develop a hybrid weighting strategy that combines the strengths of both knowledge-driven and data-driven approaches while distinguishing primary from secondary risk contributors. The persistent challenge lies in formulating a hybrid weighting strategy that harmonizes the strengths of knowledge-driven and data-driven methodologies, while simultaneously discerning primary risk factors from secondary contributors.
In terms of risk classification methodology, a range of techniques has been adopted in related fields. These include equal-interval grading for wetland degradation (Jiang et al., 2017), natural breaks for landslide risk assessment (Ayalew and Yamagishi, 2005), standard deviation methods for flood risk categorization (Wang et al., 2011), and clustering algorithms for urban inundation risk zoning (Xu et al., 2018). Notably, fuzzy set theory (Luo et al., 2013) and cloud models (Cao et al., 2022) have been explored for coastal risk classification. However, a dedicated risk grading system specifically tailored to coastal degradation—characterized by cumulative processes and delayed responses to disturbances—remains absent. There is a pressing need to develop classification methods that reflect the unique temporal and spatial dynamics of coastal degradation, avoiding the misapplication of generic models that may lead to biased results.
A quantifiable coastal damage risk classification system can not only underpin the design of targeted ecological restoration initiatives but also facilitate the continuous monitoring of long-term risk trajectories. To address this gap, this study examines more than two decades of coastal evolution in Sheyang coast. By systematically integrating geomorphic parameters (shoreline change rate, coastal slope), hydrodynamic forces (nearshore mean wave height, nearshore mean current velocities), and ecological indicators (vegetation area, mudflat area), a multi-dimensional evaluation framework is established to address the following scientific challenges: (1) In the risk assessment of coastal damage, How to integrate subjective and objective weighting methods to reconcile conflicts between “knowledge-driven” and “data-driven” weighting approaches; (2) How can a continuous, gradient-based risk model—capturing the transition from siltation to severe erosion—be established to support a dynamic early warning mechanism for coastal damage. This study innovatively propose a threshold-based classification framework that systematically integrates game theory-based combined weighting with the Multiple Backward Cloud Transformation based on Sampling with Replacement (MBCT-SR), addressing the challenges of subjective–objective weighting conflicts and fuzzy threshold quantification in delayed-onset coastal degradation.
2 Materials and methods
2.1 Study area
The study area is located at Sheyang coast (120°29'52.80", 330°49'28.20") in Jiangsu Province, China. Stretching 20 km northward from the estuary to Shuangyang Port and 10 km southward, this segment encompasses a total coastline of approximately 30 km, characterized by a typical silty coast (Figure 1).
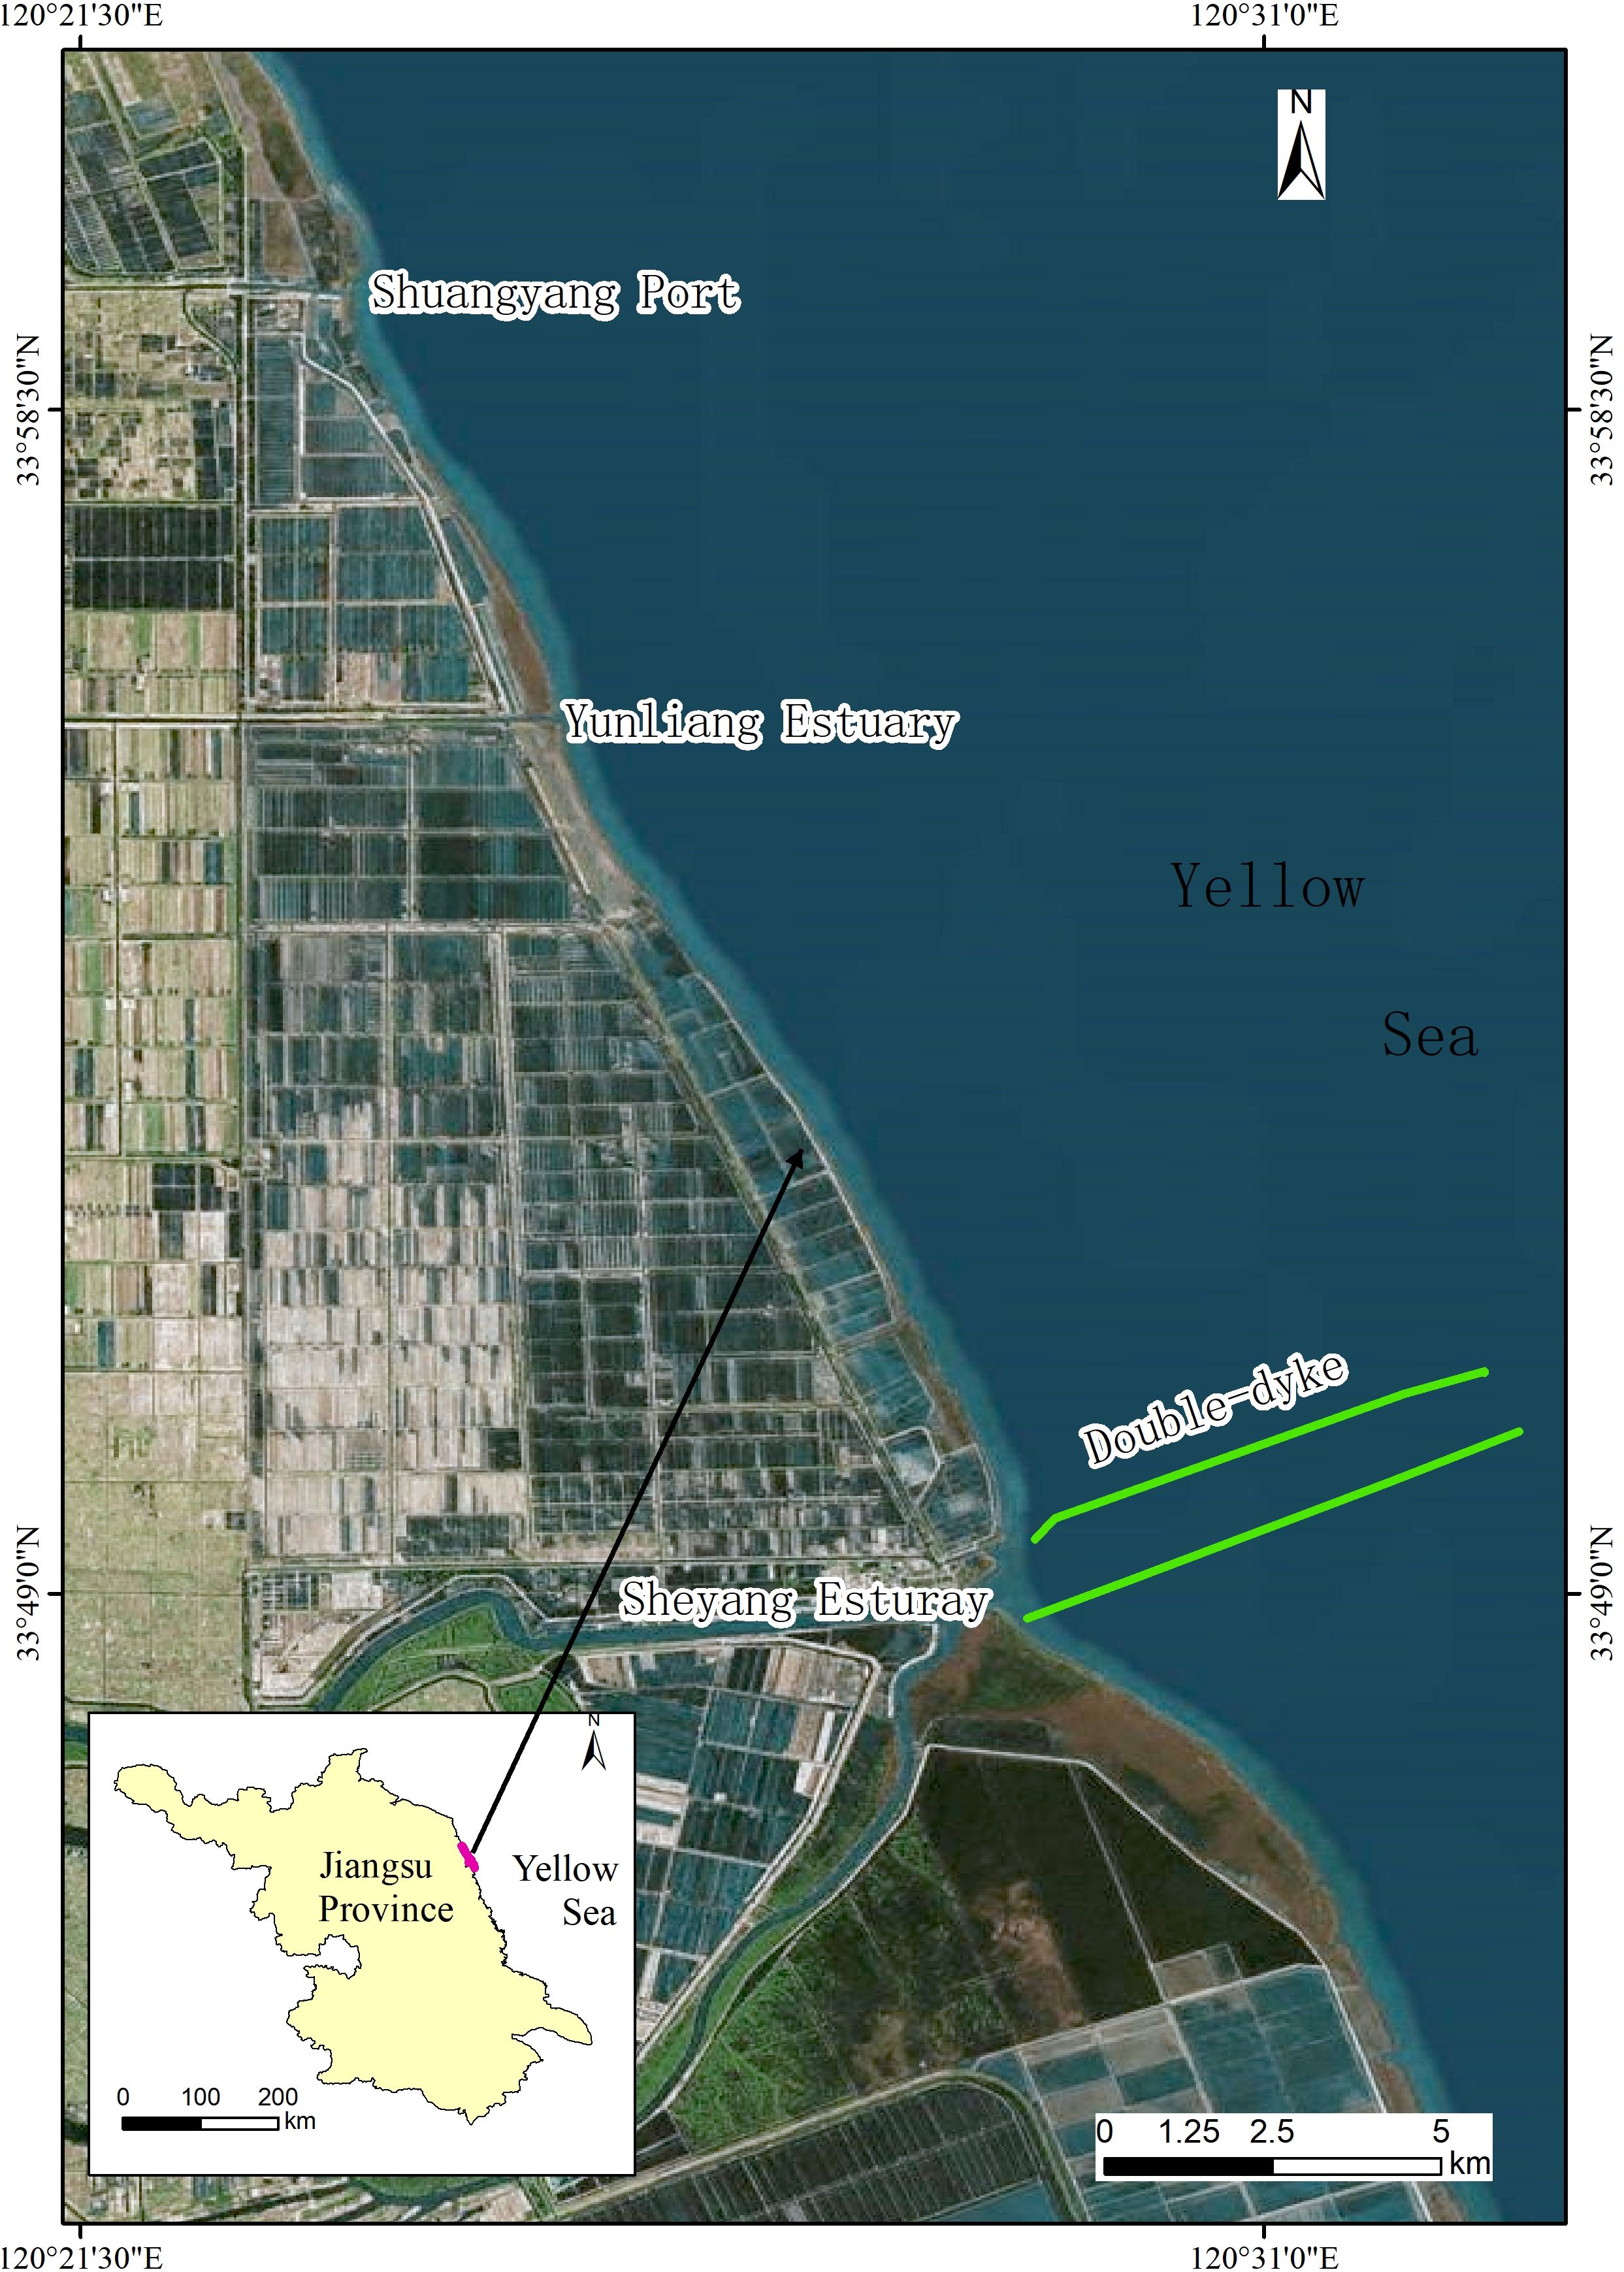
Figure 1. Location of the study area.
Analysis of historical remote sensing imagery indicates that human reclamation activities were prevalent between 1983 and 2000, yet the coastline within the study area remained relatively undisturbed in its natural state during this period. These reclamation activities were carried out approximately 1 km inland from the coast, with a mudflat expanse of around 1.5 km, and no sign of coastal erosion were observed. However, by 2005, reclamation activities had encroached closer to the shoreline, the onset of coastal erosion near Shuangyang port.
In addition to reclamation, a set of oriented east-west double-dykes was constructed at Sheyang Estuary in 2013. As documented by Zhang et al (2013), the predominant sediment transport direction in this region is from north to south, The construction of the double-dyke partially impeded sediment movement, resulting in siltation on both the northern and southern sides of structures. Since 2013, the area of erosion, which was initially concentrated in the northern sector, expanded southward, eventually reaching the southern coast of the estuary. Over the past three years, the coastline has undergone severe erosion, with mudflats narrowing significantly. In some certain areas, the annual erosion rate has soared to as high as 100 m•a-1.
Over a span of four decades, the coastline has transitioned from a stable state to one of critical erosion, reflecting a gradual yet cumulative degradation process. This continuous and progressive deterioration renders the study area an ideal exemplary site for conducting in-depth, continuous and comprehensive risk quantification and classification research.
2.2 Data acquisition and processing
Under the long-term influence of natural and anthropogenic factors, the coastal zone of Sheyang coast has transitioned from a stable state in 1985 to an erosional state by 2020 (Liang et al., 2024). The degradation of Sheyang coast can be classified as a delay type, characterized by imperceptible initial impacts, prolonged duration, gradual and indirect processes, and cumulative effects (Xu et al., 2016b). Consequently, long-term sequential data are essential for evaluating delay coastal damage. This study has endeavored to compile long-term, stable, and temporally consistent datasets of coastal geomorphological-ecological-dynamic parameters for the study area since 2000. The specific metrics include mudflat area (Moller et al., 1999; Loi et al., 2024), coastal slope (Nageswara Rao et al., 2008), shoreline change rate (Xu et al., 2016a), salt marsh vegetation area, nearshore mean wave height, and nearshore mean current velocity.
2.2.1 Coastal salt marsh vegetation and mudflat data
This study utilized time-series satellite remote sensing imagery and cloud computing capabilities from the freely accessible Google Earth Engine (GEE) platform to retrieve salt marsh vegetation and mudflat data in the coastal zone. To meet the requirements for long-term monitoring, Landsat Collection 2 Level 2 Tier 1 data products were employed. These products underwent preprocessing, including radiometric calibration and geometric correction, ensuring they were directly applicable. First, band calculations were performed on each image to derive the Normalized Difference Vegetation Index (NDVI) (Xu, 2006) and Modified Normalized Difference Water Index (MNDWI) (Tucker, 1979). Then, threshold segmentation was then applied to separate seawater and land areas. A fixed temporal window was used to calculate the inundation frequency for each pixel. The calculation formula is designated as Equation 1:
where denotes number of times the image that was classified as a water body during the time window and N denotes the number of valid observations of the image during the time window. Areas with over 95% inundation frequencies were classified as water bodies, while those less than 5% were classified as land. For pixels with frequencies between 5% and 95%, tidal flat areas were calculated (Wang et al., 2020; Murray et al., 2022). Finally, salt marsh vegetation areas were extracted from the mudflats using annual maximum NDVI composites during the growing season (July to October) combined with threshold segmentation. Mudflat areas were derived by subtracting salt marsh vegetation areas from the tidal flat areas.
2.2.2 Coastal slope
Coastal elevation in mudflat zones was estimated by integrating inundation frequency (obtained as described in Section 2.2.1) with ICESat-2 (Markus et al., 2017) laser altimetry data (Xu et al., 2022). There is a strong correlation between the inundation frequency and elevation of tidal flats. Tidal flats with higher elevations are less frequently inundated due to their relatively elevated topography, making them less susceptible to tidal flooding. In contrast, lower-elevation tidal flats exhibit higher inundation frequencies. Leveraging ICESat-2 ATL03 data products, which provide high-precision topographic profiles, a linear empirical relationship was established between inundation frequency and elevation. This relationship allowed for the conversion of inundation frequency data into coastal elevation values (Chen et al., 2023; Wu et al., 2024). Subsequently, the coastal slope was calculated based on the derived elevation data.
2.2.3 Shoreline change rate data
Shoreline change rate data were extracted from remote sensing imagery. Historical Landsat images were acquired from the Geospatial Data Cloud platform (http://www.gscloud.cn). The multi-year average high-tide line was visually interpreted and adopted as the shoreline reference. Shoreline change rates were quantified using the Digital Shoreline Analysis System (DSAS) in ArcGIS, which generated transects and computed annual shoreline change rate, with detailed procedures documented in Liang et al. (2024).
2.2.4 Nearshore mean wave height data and nearshore mean current velocity
This study employed a validated numerical model of tides and waves in adjacent coastal regions to derive hydrodynamic data. The model consists of approximately 55000 computational grids, with a minimum resolution of 5 meters, and was refined specifically along the double-dyke section of the Sheyang Estuary to improve spatial accuracy. These models were driven by wave and wind datasets from the European Centre for Medium-Range Weather Forecasts (ECMWF) Reanalysis V5 (ERA5). Historical bathymetry data were integrated to update model depths, and grid refinements were implemented to account for the construction of double-dyke and human reclamation activities. The validated model was subsequently used to extract nearshore hydrodynamic parameters, including nearshore mean wave height and nearshore mean current velocity, for the period 2000–2023 across the study area, providing a robust dataset for coastal risk assessment. Comprehensive methodological details can be found in Liang et al. (2024).
2.3 Evaluation method
2.3.1 Determination of indicator weights
Methods for determining evaluation indicator weights are classified into subjective and objective approaches. Subjective methods draw upon expert knowledge to integrate domain-specific insights and address complex system interdependencies (e.g., multi-criteria decision-making), yet they remain susceptible to subjective cognitive biases (Luo et al., 2013; Mani Murali et al., 2013). In contrast, objective methods derive weights from data statistical properties, thereby eliminating human interference (Zhang et al., 2014). These two paradigms inherently embody the complementary tension between "knowledge-driven" and "data-driven" approaches. To reconcile empirical knowledge with data-driven patterns, this study adopts a hybrid strategy: subjective and objective weights are independently determined and then integrated via game theory, enhancing the robustness and interpretability of evaluation outcomes.
2.3.1.1 Subjective weighting: AHP method
This study adopts the AHP as the subjective method to determine weights for the six evaluation indicators. The steps are as follows:
1. Construct a pairwise comparison judgment matrix for the six indicators using a 1–9 scale (Table 1). For example, a score of 1 indicates equal importance, 3 denotes slight superiority, 5 represents moderate superiority, 7 signifies strong superiority, and 9 reflects absolute dominance. Intermediate values (2, 4, 6, 8) and their reciprocals are used for nuanced comparisons.
2. Twelve experts were recruited to score the relative importance of the indicators. Consistency checks were performed on their responses, and weights were calculated only after passing these checks.
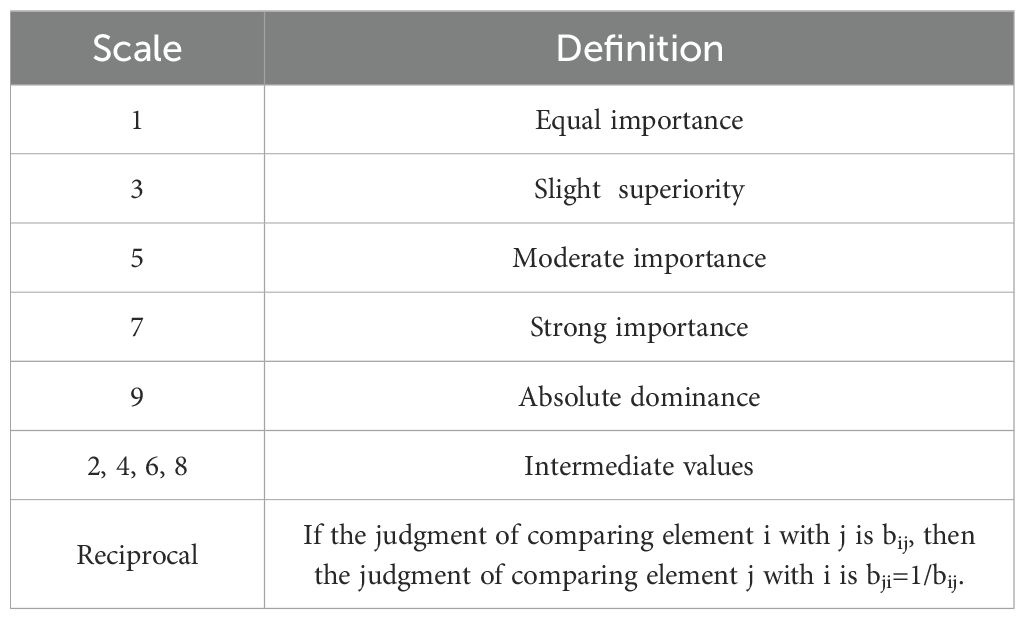
Table 1. AHP importance scale.
2.3.1.2 Objective weighting: criteria importance through intercriteria correlation (CRITIC) method
The CRITIC method was employed as the objective approach. The computational steps are as follows (Diakoulaki et al., 1995; Wang and Luo, 2010):
1. Data Matrix: Let X denote the raw data matrix, where xij represents the value of the j-th indicator for the i-th sample (i = 1,2,…,n; j = 1,2,…,m) (Equation 2).
2. Normalization:
For negatively oriented indicators (e.g., coastal slope, nearshore mean current velocity, nearshore mean wave height), The calculation formula is designated as Equation 3.
For positively oriented indicators (e.g., salt marsh vegetation area, mudflat area, shoreline change rate), The calculation formula is designated as Equation 4.
3. The statistical metrics are defined as follows: the mean is calculated using Equation 5, the standard deviation by Equation 6, and the correlation coefficient by Equation 7.
4. The information content for each indicator is defined by Equation 8.
5. The objective weights are derived from Equation 9.
2.3.1.3 Game theory combined weighting
To harmonize conflicts between subjective (AHP) and objective (CRITIC) weights, a game theoretic was implemented (Fudenberg and Tirole, 1991; Osborne, 2004):
1. The weights of the six evaluation indicators were independently determined using the AHP (subjective) and CRITIC (objective) methods, forming a fundamental weight vector . L denotes the number of weighting methods (here,L=2), n represents the number of evaluation indicators (here, n=6). Let be the weight set determined by the k-th weighting method. In this study, represents the AHP method weights, and represents the CRITIC method weights. Let be the linear combination coefficient. Then, the linear combination of the subjective and objective weights is:
2. Following the principles of game aggregation model, the objective is to minimize the deviation between and in Equation 10. To achieve this, the two linear combination coefficients and in Equation 10 are optimized, yielding the most satisfactory integrated weight within W. The objective function is formulated as:
According to the matrix differentiation property, the system of linear equations for the optimized first-order derivative condition of Equation 11 is equivalent as:
Solve the system of linear Equation 12 to obtain the combination coefficients and , use normalize the two, and finally use Equation 13 to obtain the combination weights of the game theory:
2.3.2 Risk classification
Mathematical methods for risk classification include the natural breaks method (Ayalew and Yamagishi, 2005), cluster analysis (Xu et al., 2018), and heuristic gaussian cloud transform (HGCT) (Liu et al., 2013). While these tools can categorize risk values into distinct levels, the resultant classifications may not necessarily align with real-world risk manifestations. Furthermore, each method imposes specific data requirements (e.g., long-term temporal correlations, existence of latent subgroups, significant inter-cluster heterogeneity), necessitating rigorous data collection and preprocessing to ensure valid risk stratification. To address these limitations, this study proposes a hybrid approach combining coastal geomorphological and ecological critical threshold extraction with Multiple Backward Cloud Transformation based on Sampling with Replacement (MBCT-SR) (Xu et al., 2014; Xu and Wang, 2017) for risk classification. This methodology enhances correspondence with real-world risk scenarios while circumventing the stringent data prerequisites of conventional mathematical tools. The main calculation steps for MBCT-SR are as follows:
1. The expected value is computed using Equation 14.
2. Random sample grouping: Equation 15 computes the within-group sample mean, Equation 16 calculates the within-group sample variance, and Equation 17 performs inter-group variance vector assembly.
For (i=1, i<=m, i++)
For (j=1, j<=r, j++)
Random sampling of N cloud droplets xi(i=1,2,…,N)
End for
End for
3. Equation 18 determines both the entropy (En) and super entropy (He):
3 Result
3.1 Coastal salt marsh vegetation and coastal geomorphological changes
This study extracted the temporal changes in salt marsh vegetation area and mudflat extent along the Sheyang coast since the year 2000 (Figure 2). Notably, salt marsh vegetation near Shuangyang Port had disappeared by 2009, and those in the Yunliang Estuary were vanished by 2018. In contrast, the southern section of the Sheyang Estuary still retains surviving salt marsh vegetation, and the northern section even shows a slight increase in salt marsh vegetation area. In particular, the salt marsh vegetation area approximately 1 km south of the Sheyang Estuary reaches over 20 hectares. However, the salt marshes along the coast about 10 km south of the estuary are in decline, having started to disappear around 2012, with the degradation trend expanding both northward and southward. In Figure 2a, red lines are used to distinguish areas with persistent salt marshes from those where they have vanished. It is important to note that the absence of salt marsh vegetation within the Sheyang Estuary is not due to degradation or loss, but rather a result of the estuary's natural width, which prevents the formation of salt marshes in this area. Therefore, it is not necessary to delineate this region using a red line.
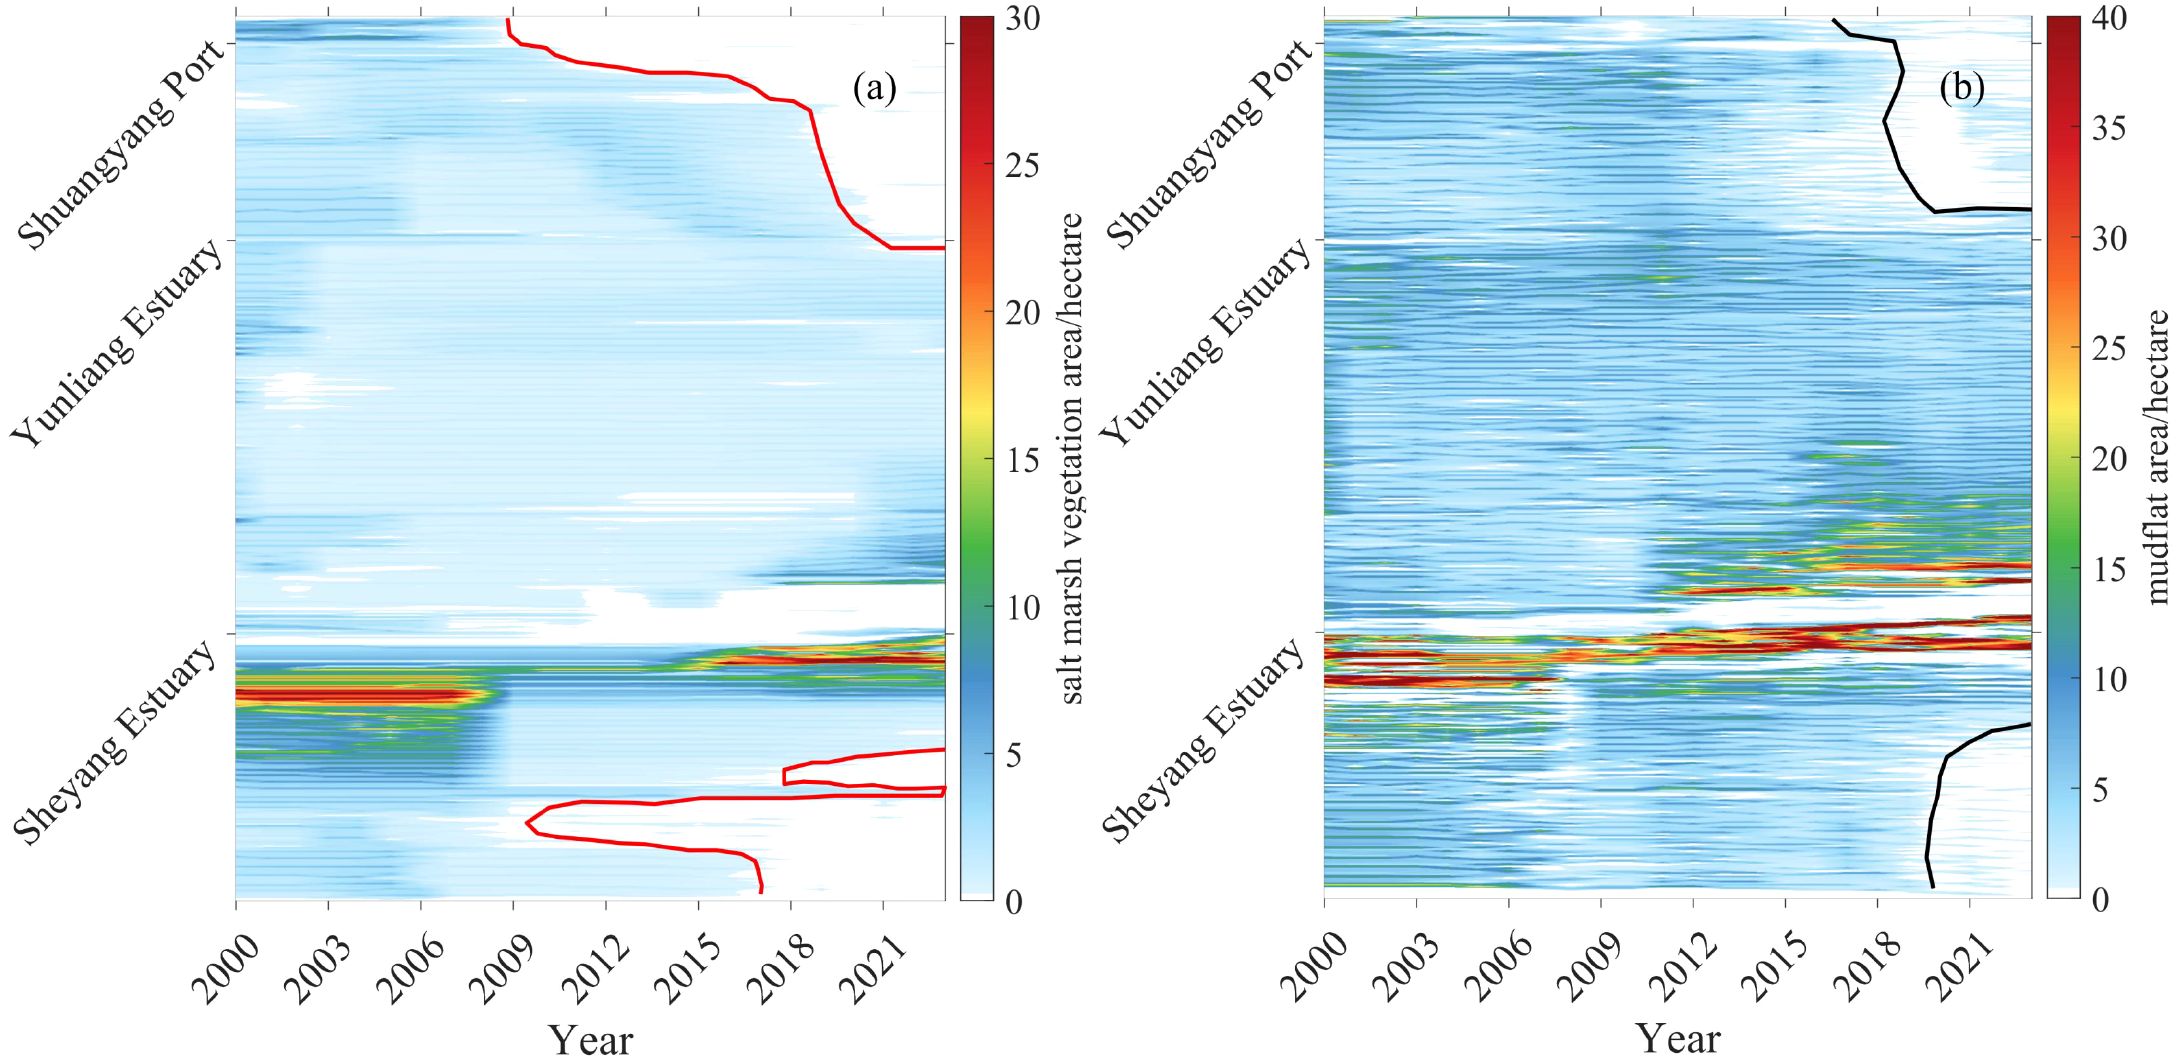
Figure 2. Variation diagram of salt marsh vegetation areas (a) and mudflat areas (b):red lines are salt marsh vegetation disappearance boundary; black lines are mudflat disappearance boundary
The mudflat area between Shuangyang Port and Yunliang Estuary has significantly decreased since 2019 and is now nearly absent, with the mudflat area generally reduced to less than 1 hectare. Similarly, mudflats approximately 10 km south of the Sheyang Estuary have also diminished since 2019, with area values typically below 1 hectare. In Figure 2b, black lines are used to delineate areas with existing mudflats from those where mudflats have disappeared. Similar to the case of salt marshes, the absence of mudflats within the Sheyang Estuary is not a result of degradation, but rather due to the natural width of the estuary, which limits the formation of mudflats in this area. Therefore, it is not necessary to delineate this region with a black line.
This study also extracted changes in shoreline position and coastal slope along the Sheyang coast since the year 2000 (Figure 3). As shown in Figure 3a, the Sheyang coastline has been predominantly erosional. In particular, the coast near Shuangyang Port experienced severe erosion in 2015, while significant shoreline retreat began around Yunliang Estuary in 2012. Further south, a 10 km stretch of coastline south of the Sheyang Estuary has undergone severe erosion since 2019. The areas of intensive erosion in Figure 3 correspond both spatially and temporally with the disappearance of salt marsh vegetation and mudflat areas observed in Figure 2. In contrast, shoreline accretion is observed near the mouth of the Sheyang Estuary, coinciding with salt marsh and mudflat expansion exceeding 20 hectares, as illustrated in Figure 2.
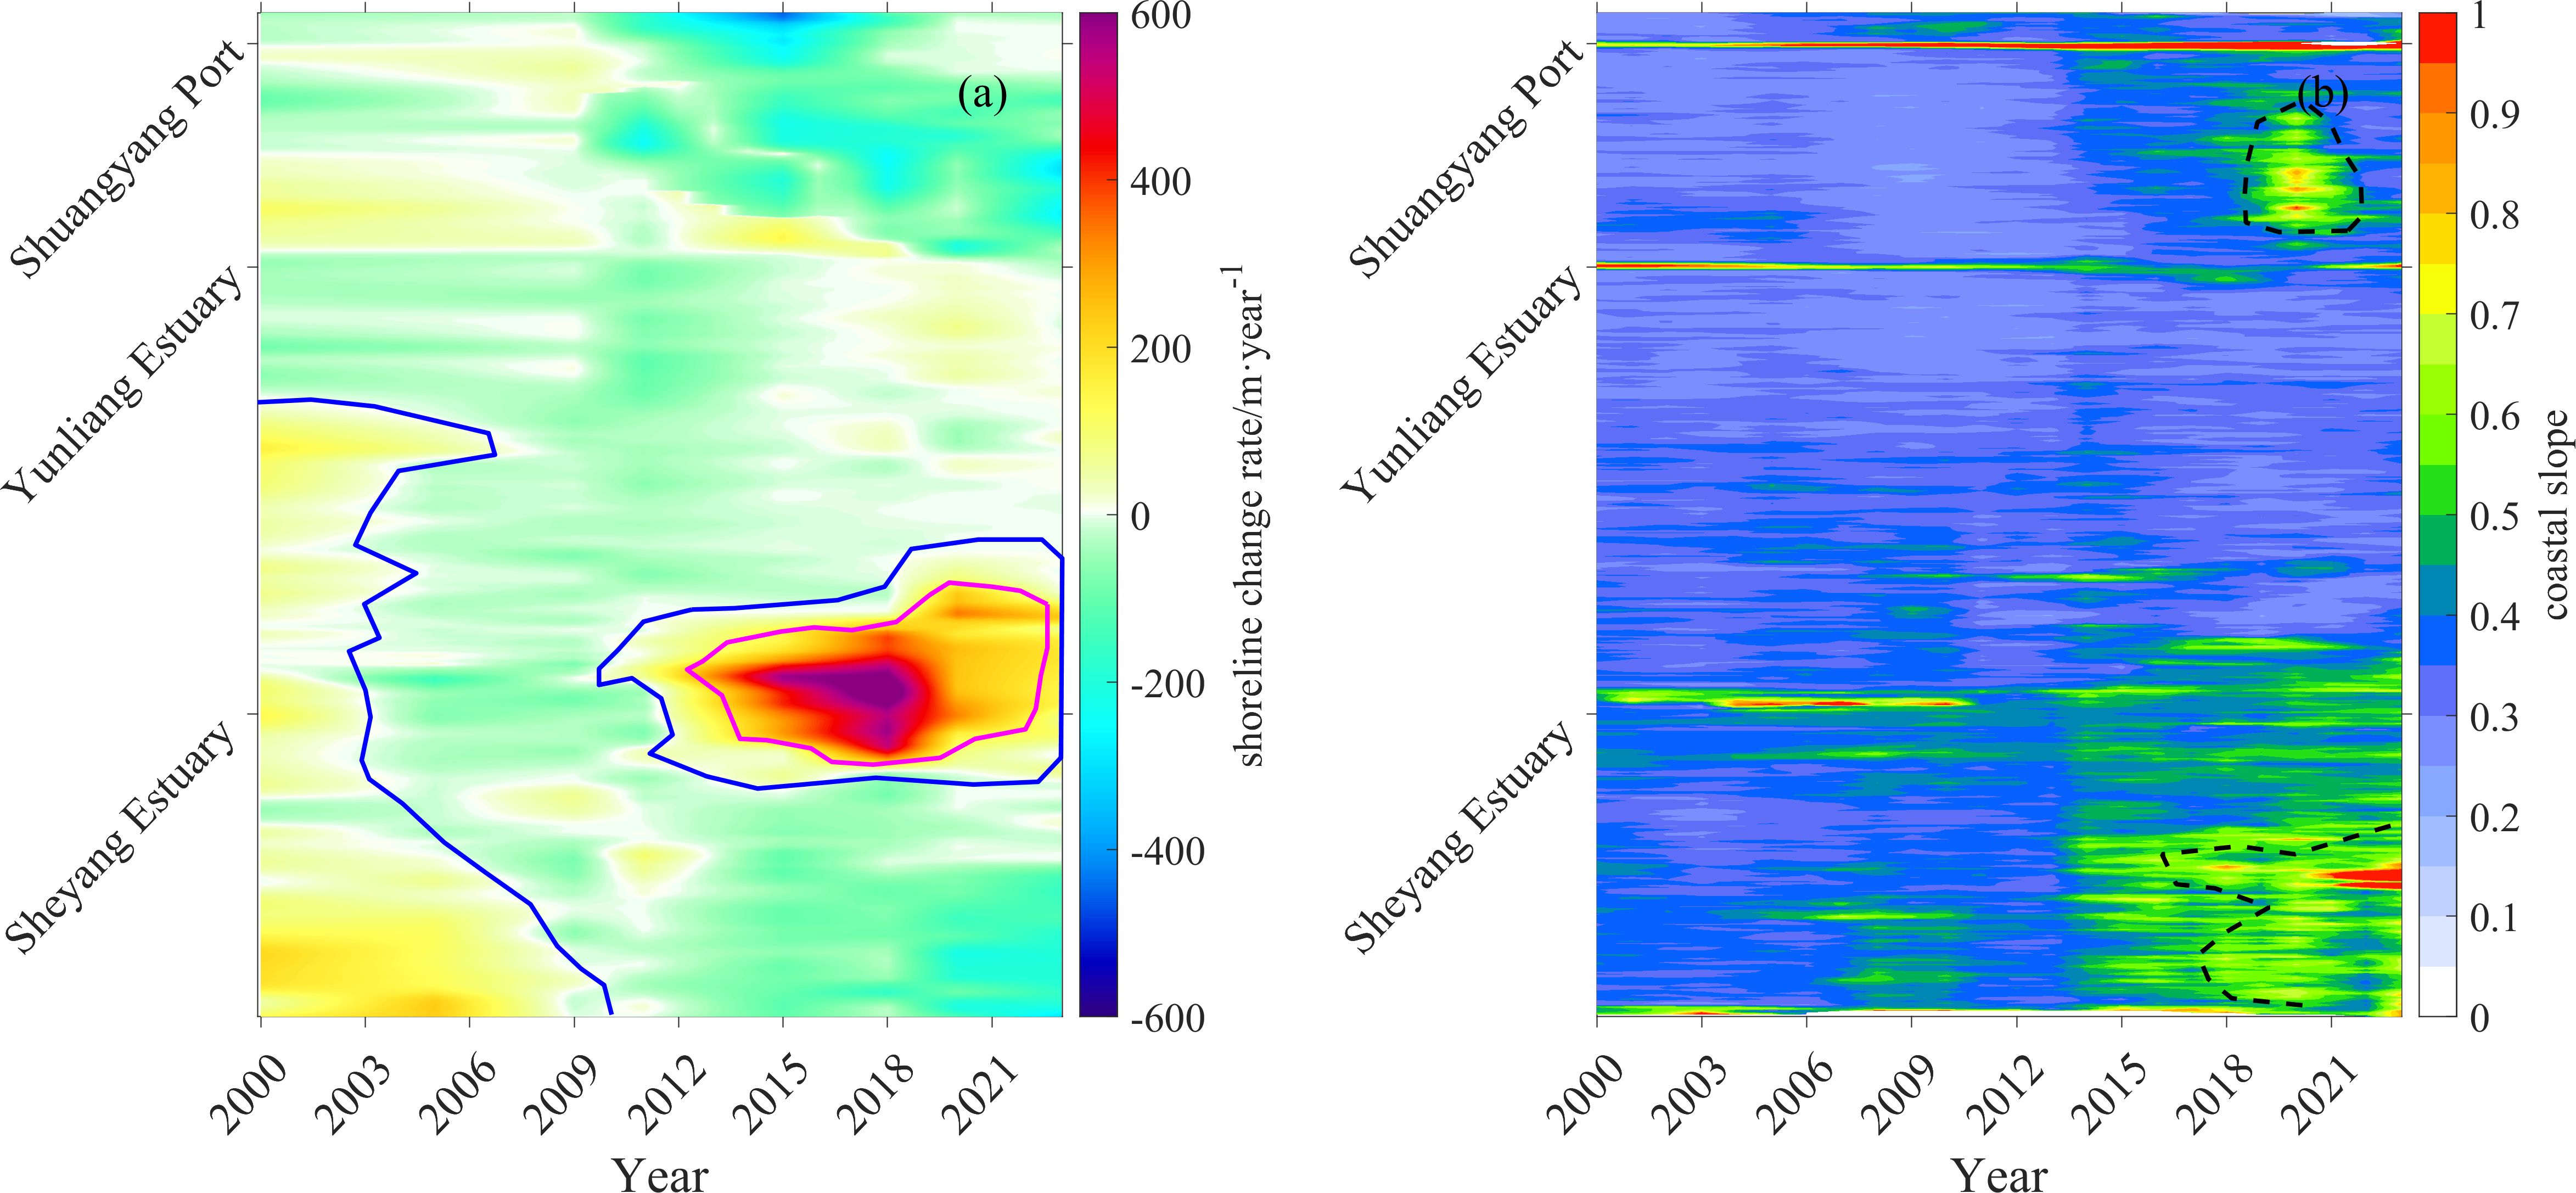
Figure 3. Shoreline change (a) and Coastal slope (b) diagram:pink lines is shoreline siltation boundary; blue lines are shoreline stable boundary;black dashed lines are steep slope boundary.
In Figure 3a, the boundary between erosional and stable shoreline segments is delineated with blue lines, while the transition between stable and accreting segments is marked with pink lines. Figure 3b shows that coastal slope along the Sheyang shoreline has steepened progressively over the past two decades. South of the Sheyang Estuary, slope increases have become especially pronounced since 2015, with some segments now exceeding a slope value of 1. Along the coast near Yunliang Estuary, continuous erosion during 2018 led to the formation of steep coastal slopes. These scarps subsequently diminished, accompanied by a gradual slope decrease. The segments where steep slopes occurred are marked with black dashed lines in Figure 3b.
This study compiled long-term data on nearshore mean wave height and nearshore mean current velocity along the nearshore area of the Sheyang coast since 2000 (Figure 4). Over the past two decades, both nearshore mean wave height and nearshore mean current velocity in the Sheyang nearshore zone have shown a marked increase. Nearshore mean wave height has increased by approximately 0.2 meter during this period, with particularly pronounced intensification observed in severely eroded and cliffed sections of the coast—such as the Yunliang Estuary and the southern 10 km of the Sheyang Estuary. In contrast, nearshore mean wave height has remained relatively stable in accretional or morphologically stable zones, such as the main body of the Sheyang Estuary.
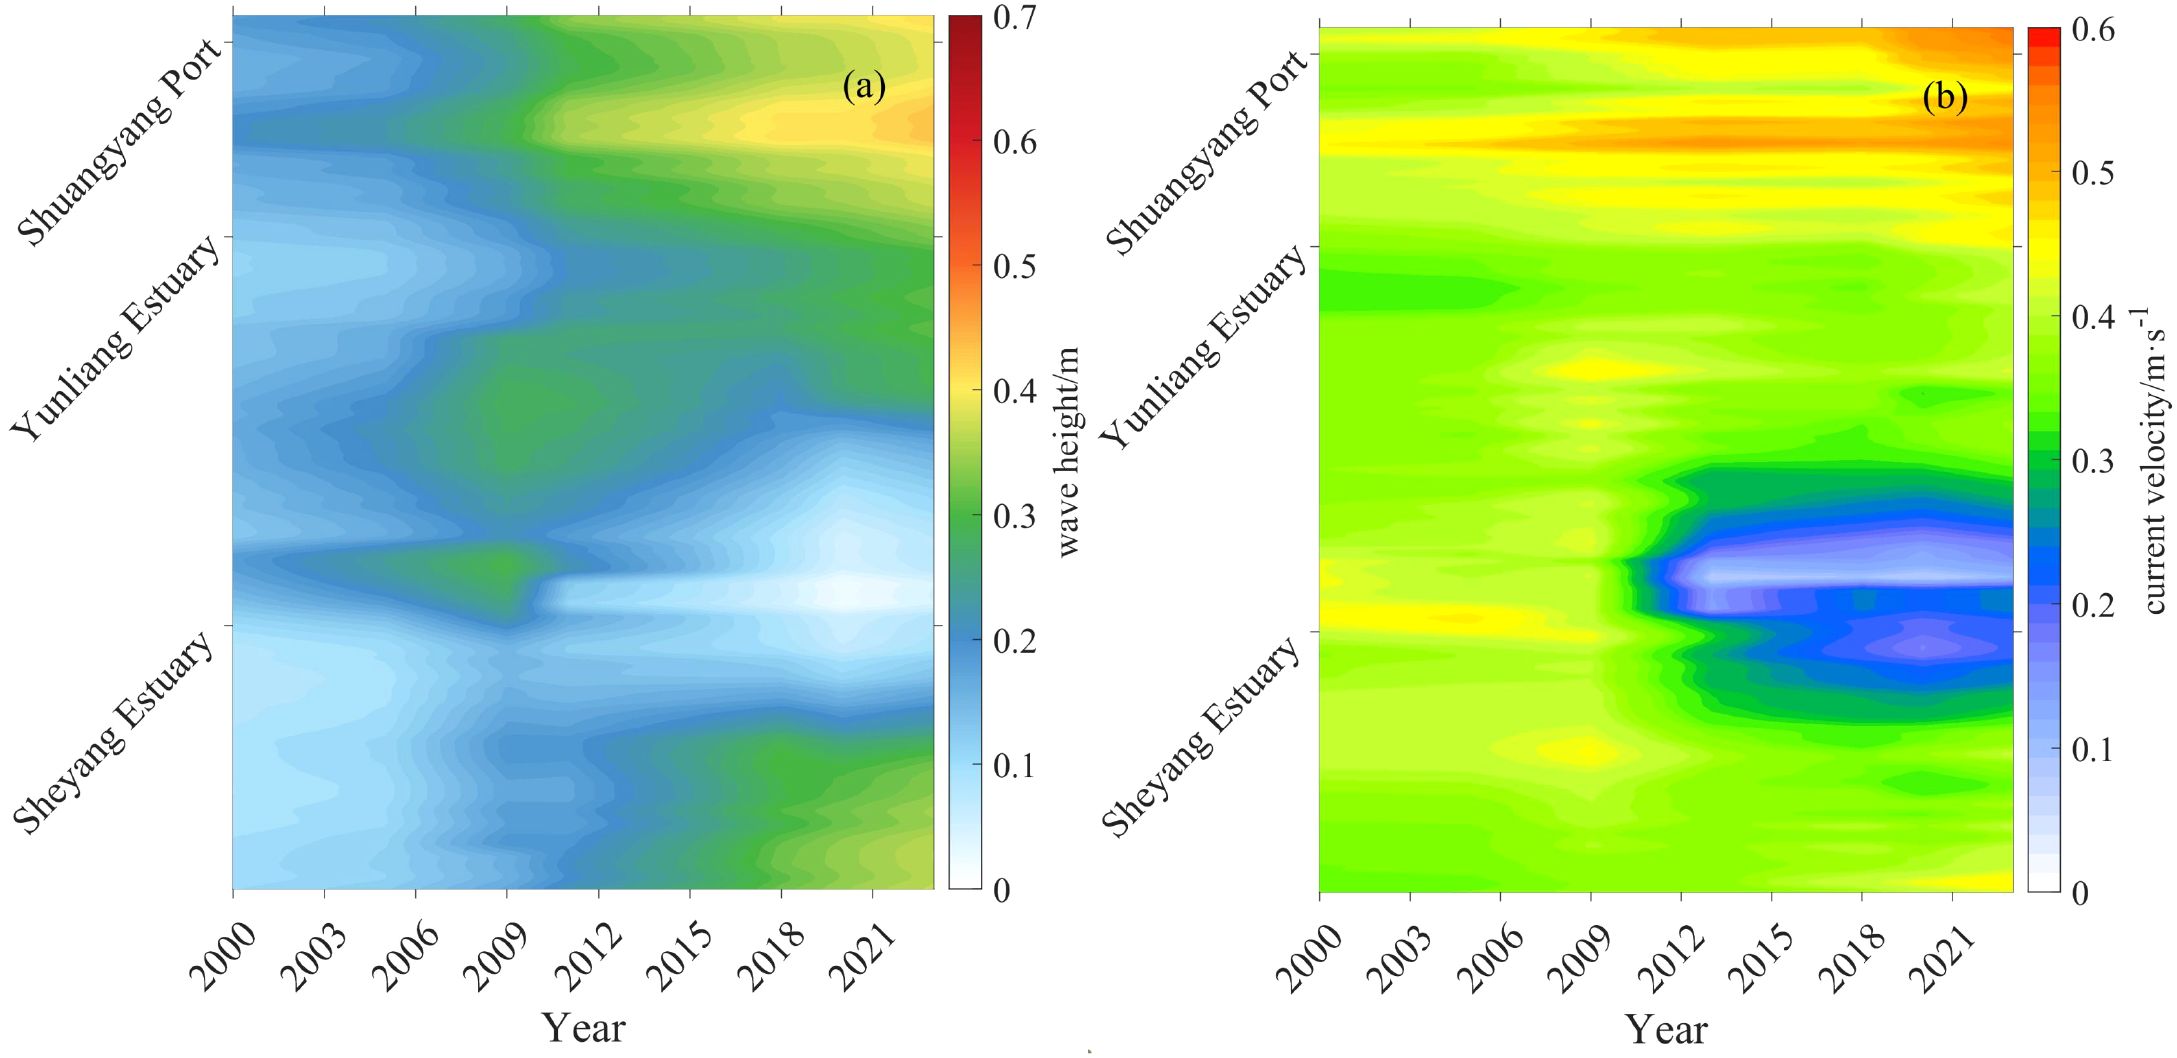
Figure 4. Variation diagram of nearshore mean wave height (a) and nearshore mean current velocity (b).
Nearshore mean current velocity has also increased by approximately 0.1 m/s from 2000 to 2023. This intensification is especially evident in highly eroded areas, such as the coast adjacent to Shuangyang Port. Conversely, in stable or accreting coastal segments—particularly the Sheyang Estuary—the nearshore mean current velocity has shown a decreasing trend.
3.2 Evaluation indicator weights
Based on the weighting determination methodology outlined in Section 2.3.2, Table 2 summarizes the weights assigned to six evaluation indicators using subjective (AHP) and objective (CRITIC) approaches. Twelve senior engineers engaged in coastal zone management were invited to participate in the scoring process. After conducting a consistency check, four experts who did not meet the consistency requirements were excluded, resulting in a final panel of eight experts. Among them, five experts assigned the highest weight to the shoreline change rate, while experts 1 and 7 assigned the highest weight to nearshore mean wave height, and expert 3 gave the highest weight to salt marsh vegetation area. Expert 2 placed relatively high weights on both shoreline change rate and nearshore mean wave height, with the two indicators accounting for a combined 64% of the total weight. However, nearshore mean current velocity indicator accounted for only 1.8% in their scoring. Conversely, in evaluation of the expert 3, the weight for salt marsh vegetation area was only 2.6%, showing a large deviation from the scoring of other experts. In addition, experts 5 and 6 assigned relatively low weights to coastal slope. These differences highlight the subjective variability among the eight experts, with notable discrepancies in the weights assigned to salt marsh vegetation area, coastal slope, shoreline change rate, and nearshore mean current velocity. After averaging the scores of all eight experts, the final AHP-derived weights were obtained, where shoreline change rate had the highest weight, followed by nearshore mean wave height.
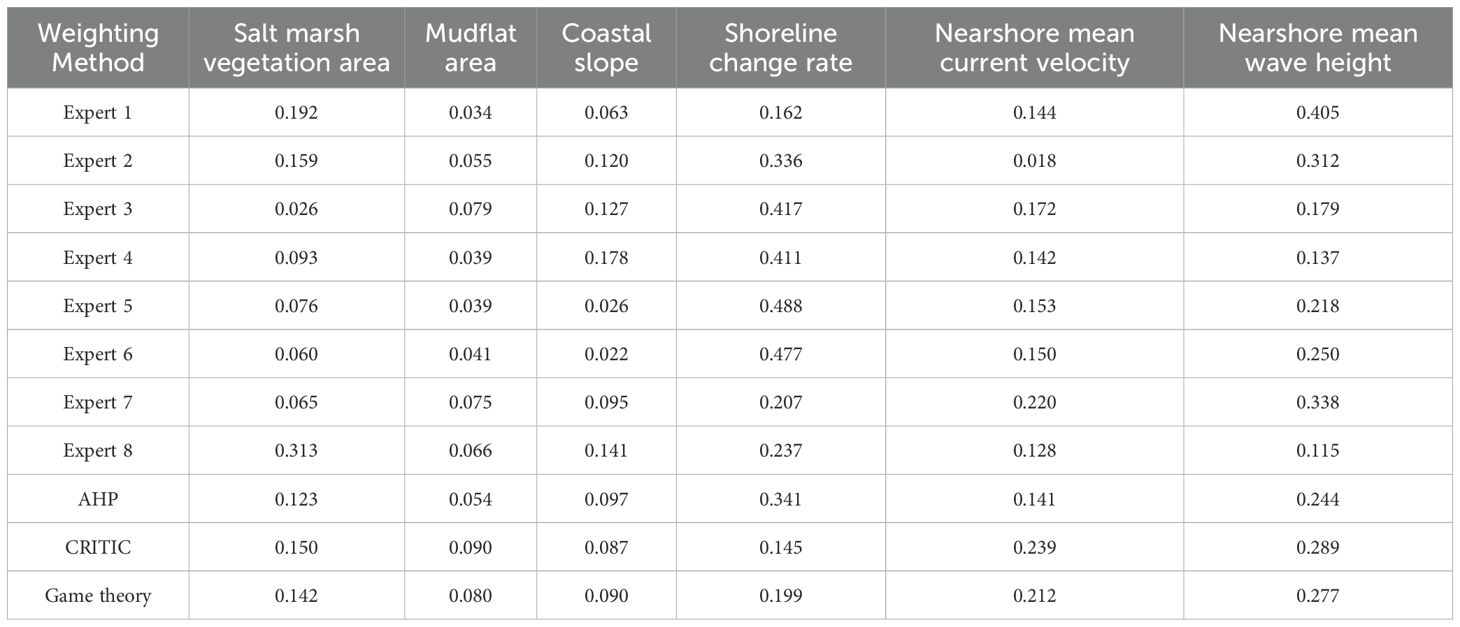
Table 2. Weights of evaluation indicators.
In the CRITIC method, nearshore mean wave height received the highest weight, followed by nearshore mean current velocity, salt marsh vegetation area, and shoreline change rate. Comparative analysis of Figures 2-4 revealed that the top 4 indicators ranked by the CRITIC method exhibited spatial and temporal correlations at the Yunliang Estuary, Sheyang Estuary, and the coastline 10 km south of the Sheyang Estuary, particularly post-2012. This suggests that assigning higher weights to nearshore mean wave height, nearshore mean current velocity, shoreline change rate, and salt marsh vegetation area under the CRITIC framework is reasonable. However, notable conflicts emerged between the CRITIC and AHP rankings, especially for shoreline change rate and nearshore mean current velocity.
After applying game theory-based combination weighting, the integrated approach increased the weights of shoreline change rate and coastal slope (originally derived from CRITIC) while reducing the weights of nearshore mean current velocity, nearshore mean wave height, salt marsh vegetation areas, and mudflat areas. Shoreline change rate experienced the largest weight increase, whereas nearshore mean current velocity saw the most significant reduction. Ultimately, the combined weighting prioritized nearshore mean wave height as the highest-weighted indicator, followed by nearshore mean current velocity. This outcome aligns with the recent transformation of the Sheyang coast from a tide-dominated to a wave-dominated system, characterized by steepened slopes and narrowed tidal flats (Figures 2b, 3b), where wave dynamics now dominate (Zhang et al., 2013; Liang et al., 2024). The elevated weight for nearshore mean wave height under the game theory framework not only reflects the coastal environmental characteristics of Sheyang but also reasonably adjusts the AHP-derived dominance of shoreline change rate, highlighting the necessity of balancing subjective and objective perspectives in coastal vulnerability assessments.
3.3 Risk classification of coastal damage in Sheyang
Based on the subjective and objective risk assessment weights, risk values determined by different evaluation methods were obtained (Figure 5). In Figure 5, the five colored lines represent different coastal conditions: L1 represents the dividing line for shoreline siltation; L2, the boundary for shoreline stability; L3, the demarcation line for salt marsh vegetation disappearance; L4, the threshold for mudflat substantial disappearance; and L5, the frontier for steep slopes. The risk values derived from the AHP and CRITIC methods show strong correspondence with coastal states: the boundary between coastal siltation and stable shoreline corresponds to low-risk zones, the boundary marking the disappearance of unvegetated tidal flats and formation of steep slopes aligns with high-risk zones, and the transitional area between the stable shoreline boundary and salt marsh vegetation disappearance boundary reflects moderate-risk zones. Historically, both AHP and CRITIC methods exhibit similar trends in the evolution of risk values across estuarine coasts, though CRITIC generally yields higher risk values than AHP. After balancing subjective and objective weights using game theory, the integrated risk values lie between those of AHP and CRITIC methods (Figure 5b).
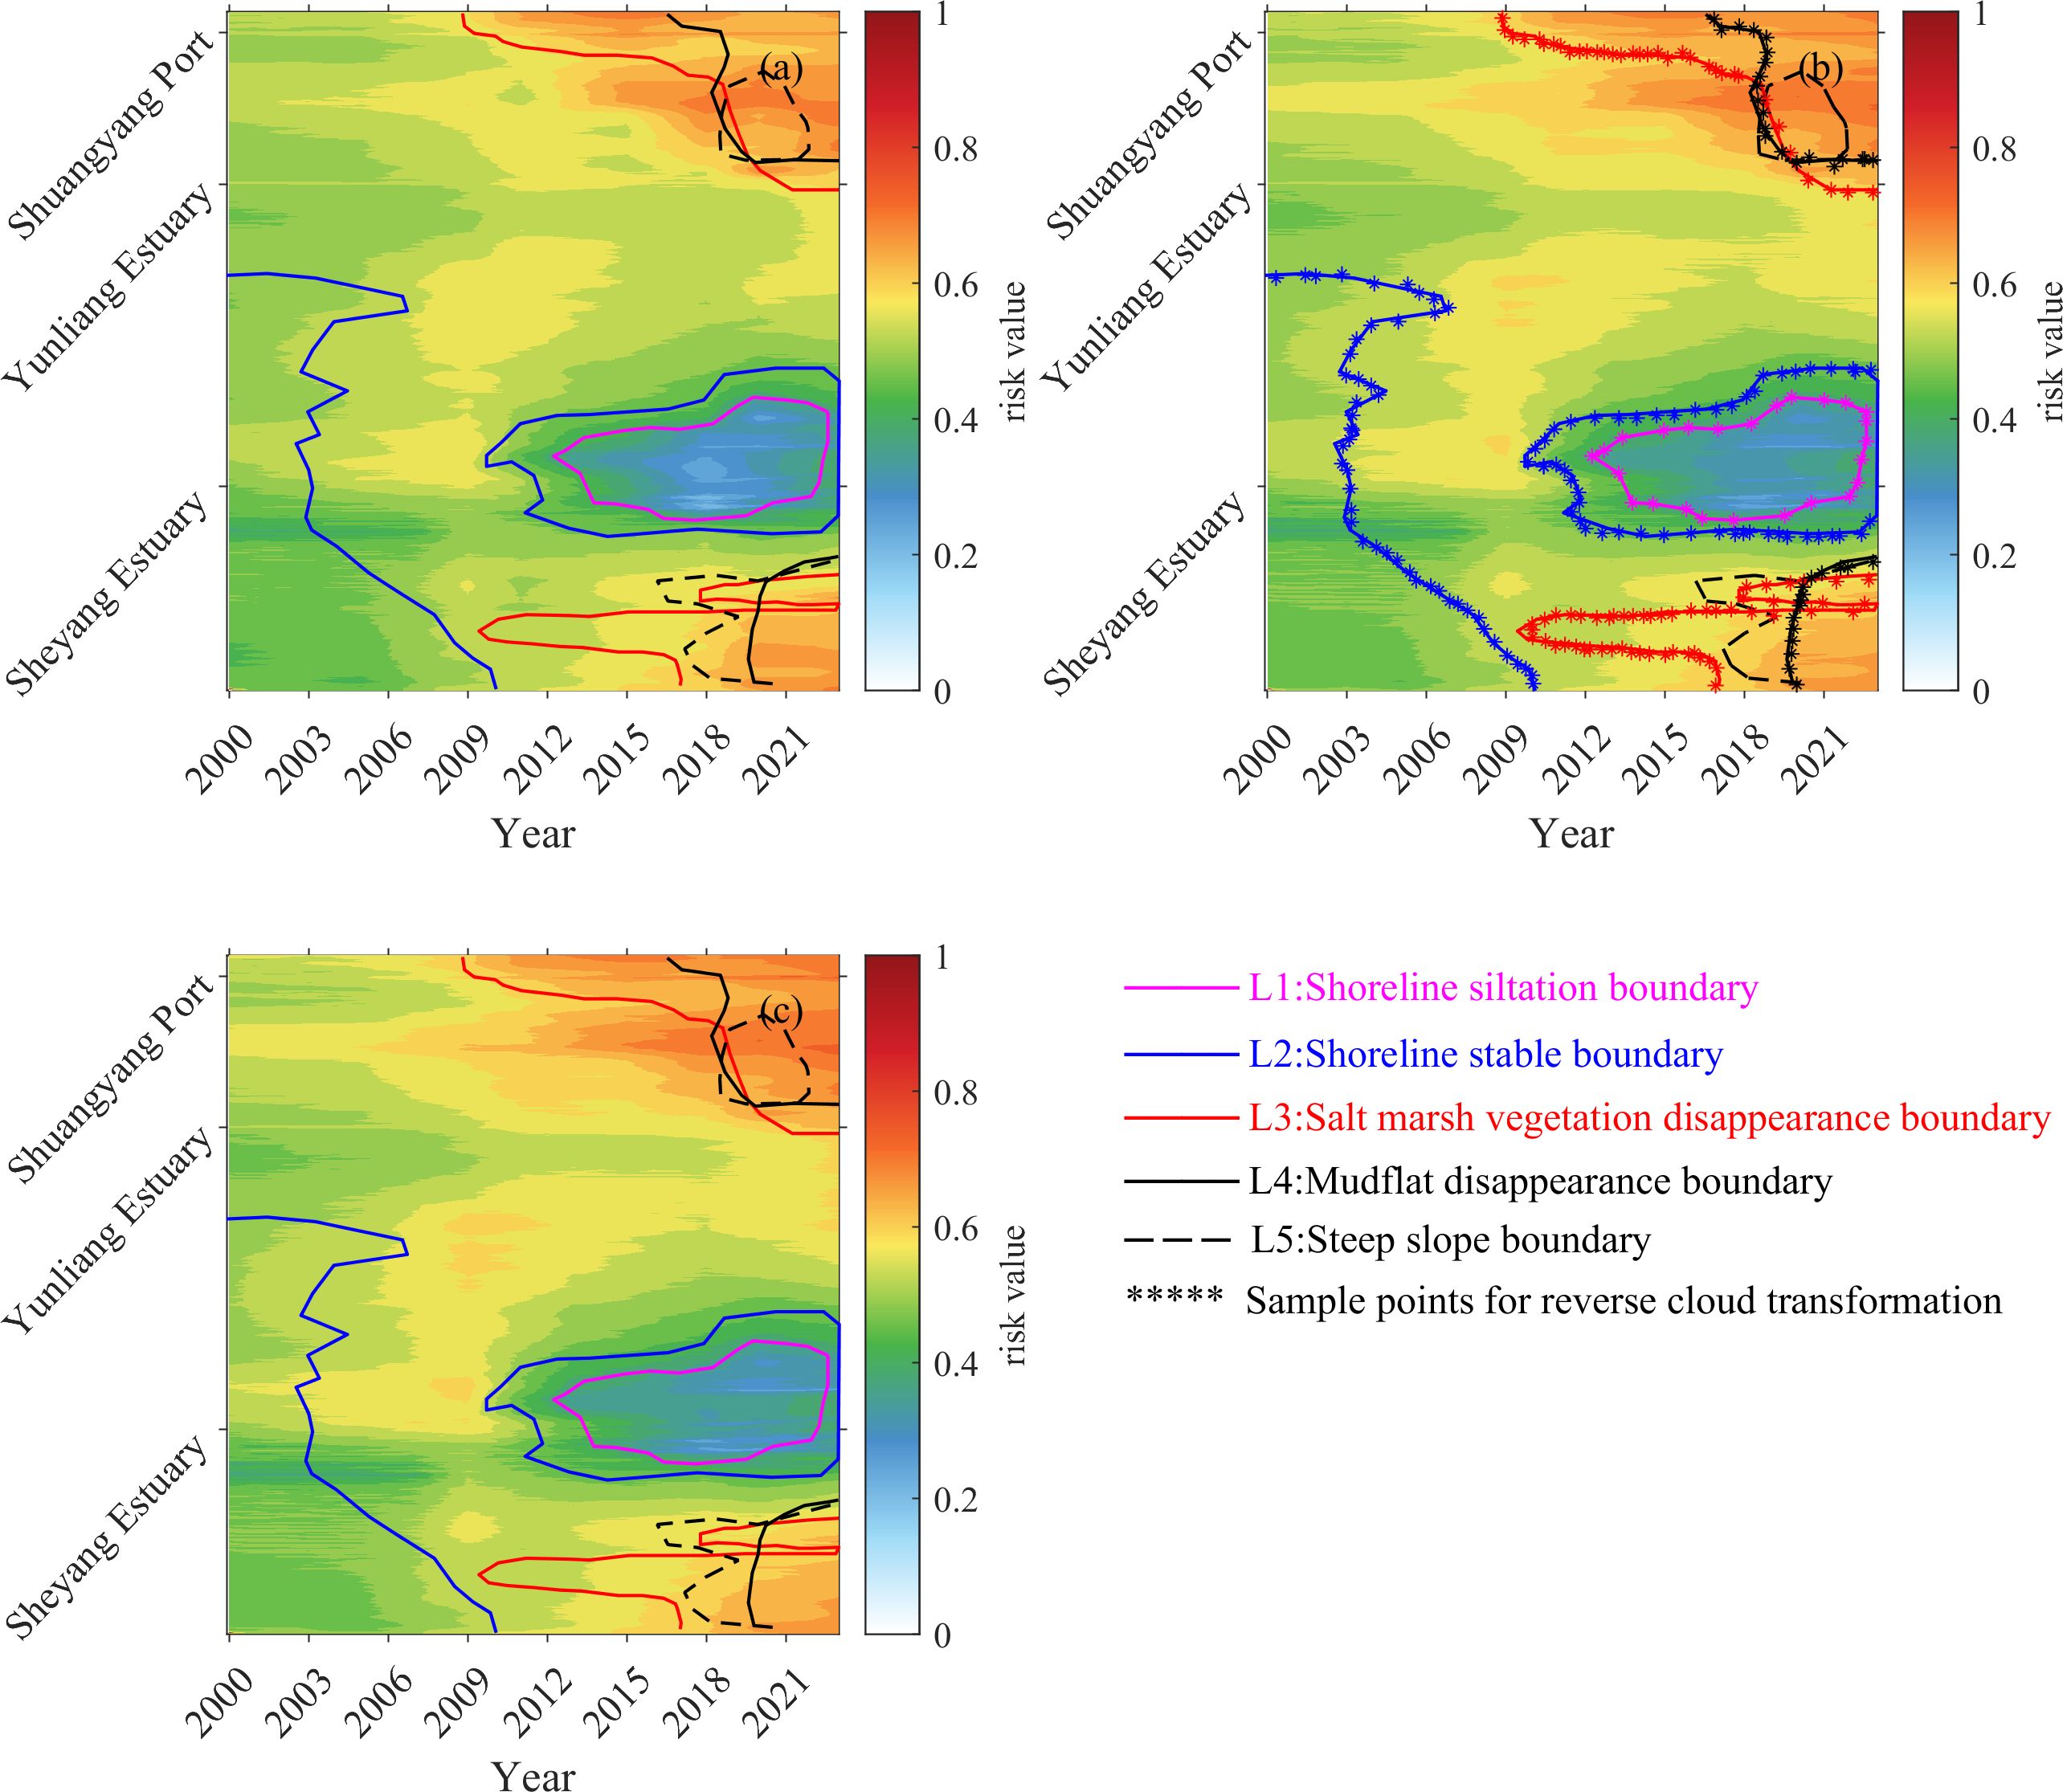
Figure 5. Risk assessment results: (a) AHP; (b) game theory; (c) CRITIC.
Critical thresholds for risk classification were extracted from the demarcation lines in Figure 5b. By applying the MBCT-SR method for reverse cloud transformation, the classification thresholds for different risk levels were determined as 0.387, 0.499, 0.592, and 0.641. The corresponding membership clouds for these thresholds are illustrated in Figure 6. Integrating the coastal states depicted in Figures 2, 3, we derived the specific manifestations of coastal states and their associated risk value intervals across five distinct risk levels, as summarized in Table 3. Notably, the maximum risk value for the Sheyang coast is 0.73; thus, the upper limit of the fifth risk level is defined as C(0.73, 0, 0).
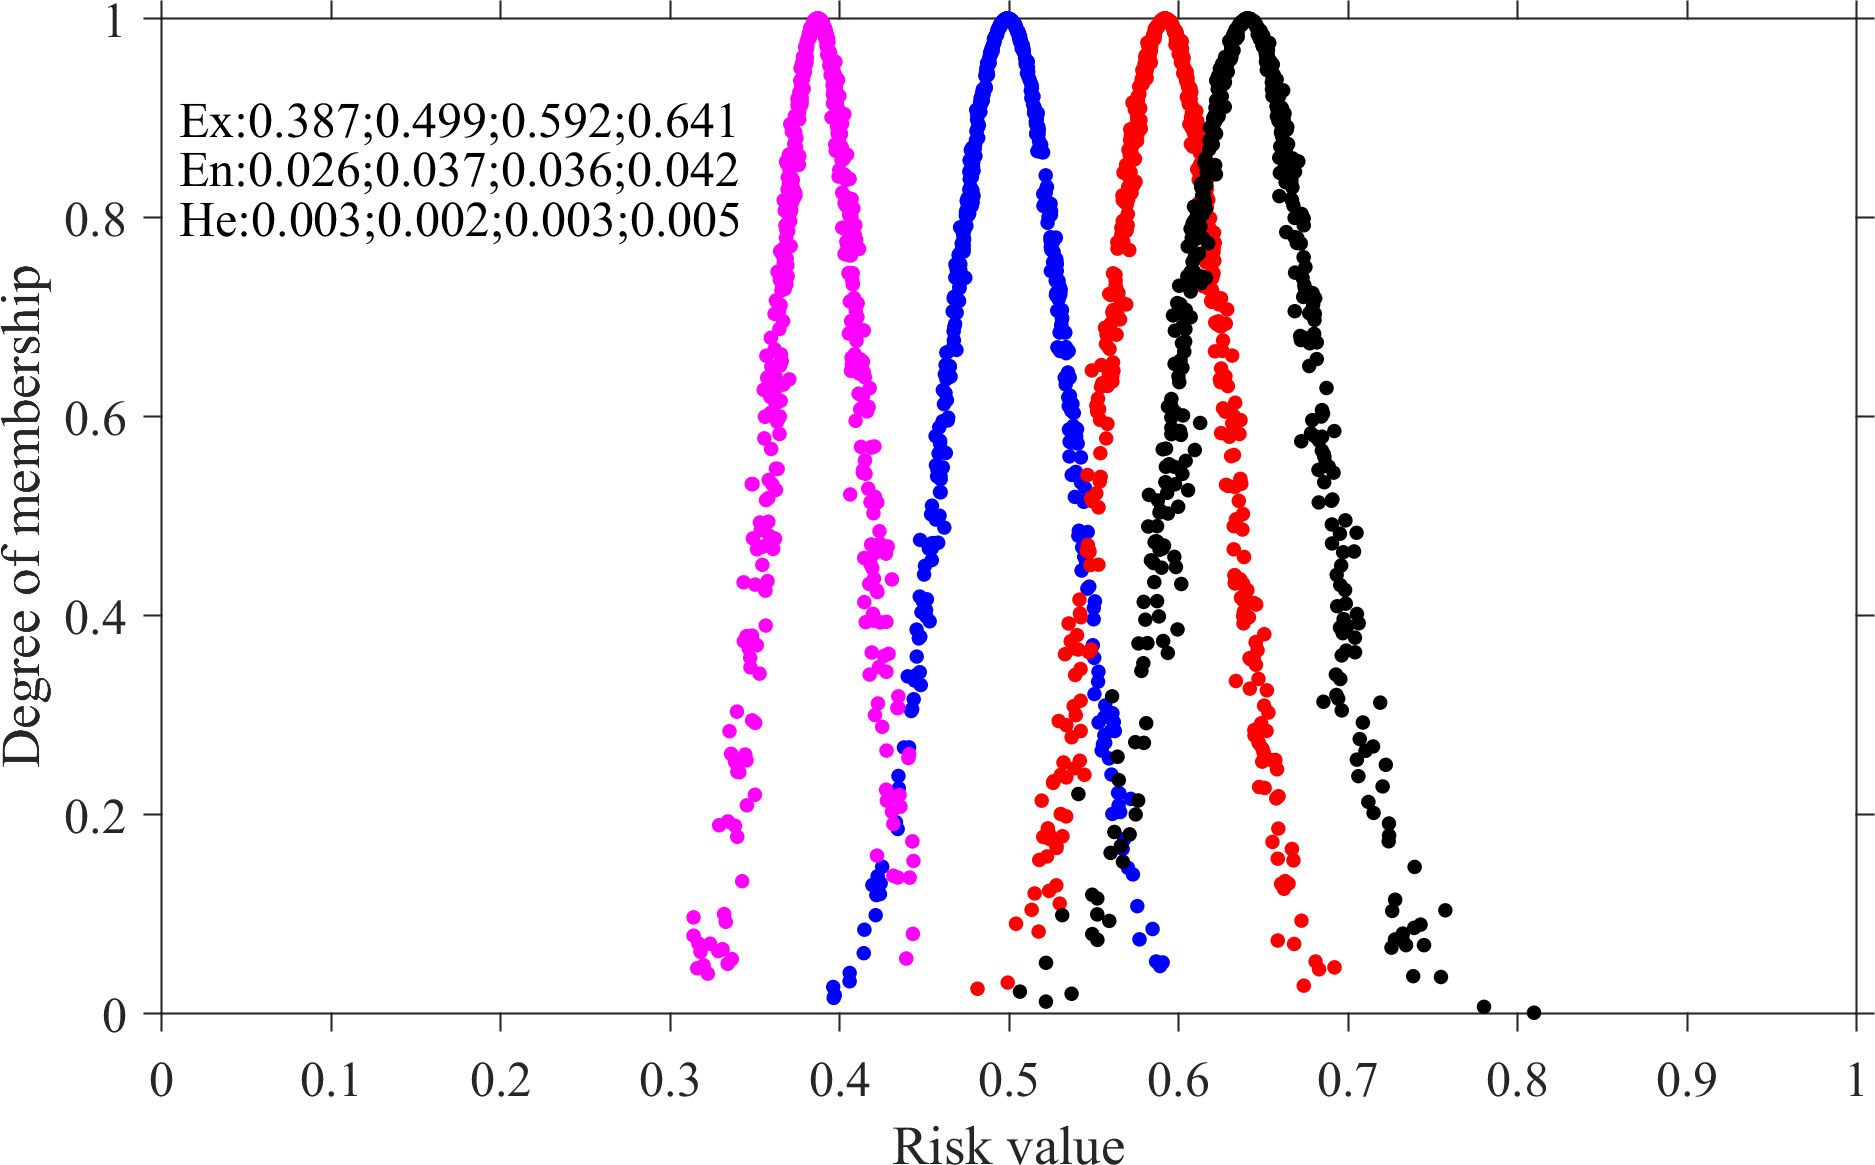
Figure 6. Coastal damage risk classification results.
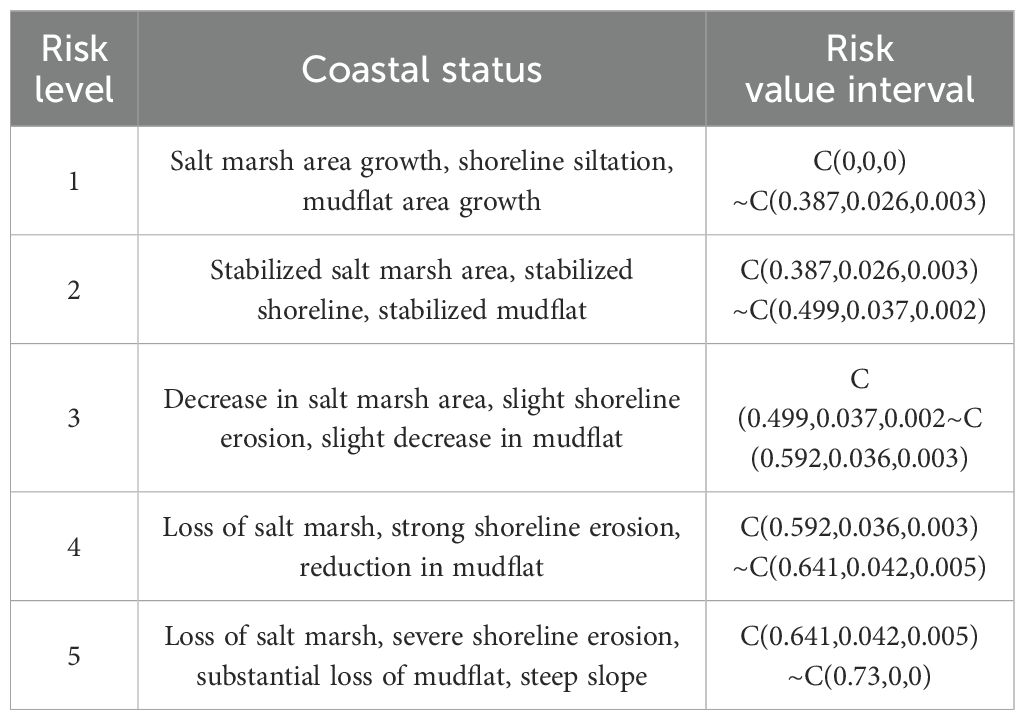
Table 3. Statistics on the results of the risk classification of coastal damage.
4 Discussion
4.1 Applicability analysis of different risk classification methods
A combination of AHP and fuzzy set theory has been applied for coastal erosion risk classification along the Fujian coast (Luo et al., 2013). AHP combined with the cloud model has been used to assess coastal erosion vulnerability along the mainland China coastline (Cao et al., 2022), while AHP and the equal interval method were applied to evaluate coastal erosion risk in the Yangtze River Delta (Li et al., 2015). In line with these previous classification approaches, this study also applied fuzzy set theory, the cloud model, and the equal interval method for coastal risk classification. In addition, we employed the standard deviation method, cluster analysis, and the HGCT to evaluate the suitability of different approaches for classifying the risk of slow-onset coastal degradation. Due to space limitations, detailed derivations of the mathematical formulas involved in these methods are not presented in this study.
The results of different risk classification methods are shown in Figure 7. Comparative analysis enables the discussion of their applicability. The cluster analysis method yielded a very narrow range for level-3 risk, while the ranges for level-1 and level-5 risks were overly broad. It also failed to differentiate between accretional and stable coastlines, as well as between highly erosional and severely erosional coastlines. The natural breaks method, fuzzy set theory, and HGCT were more effective in distinguishing five coastal risk states. However, they all exhibited relatively large intervals for level-1 and level-5 risks, overestimating both accretion and severe erosion categories.
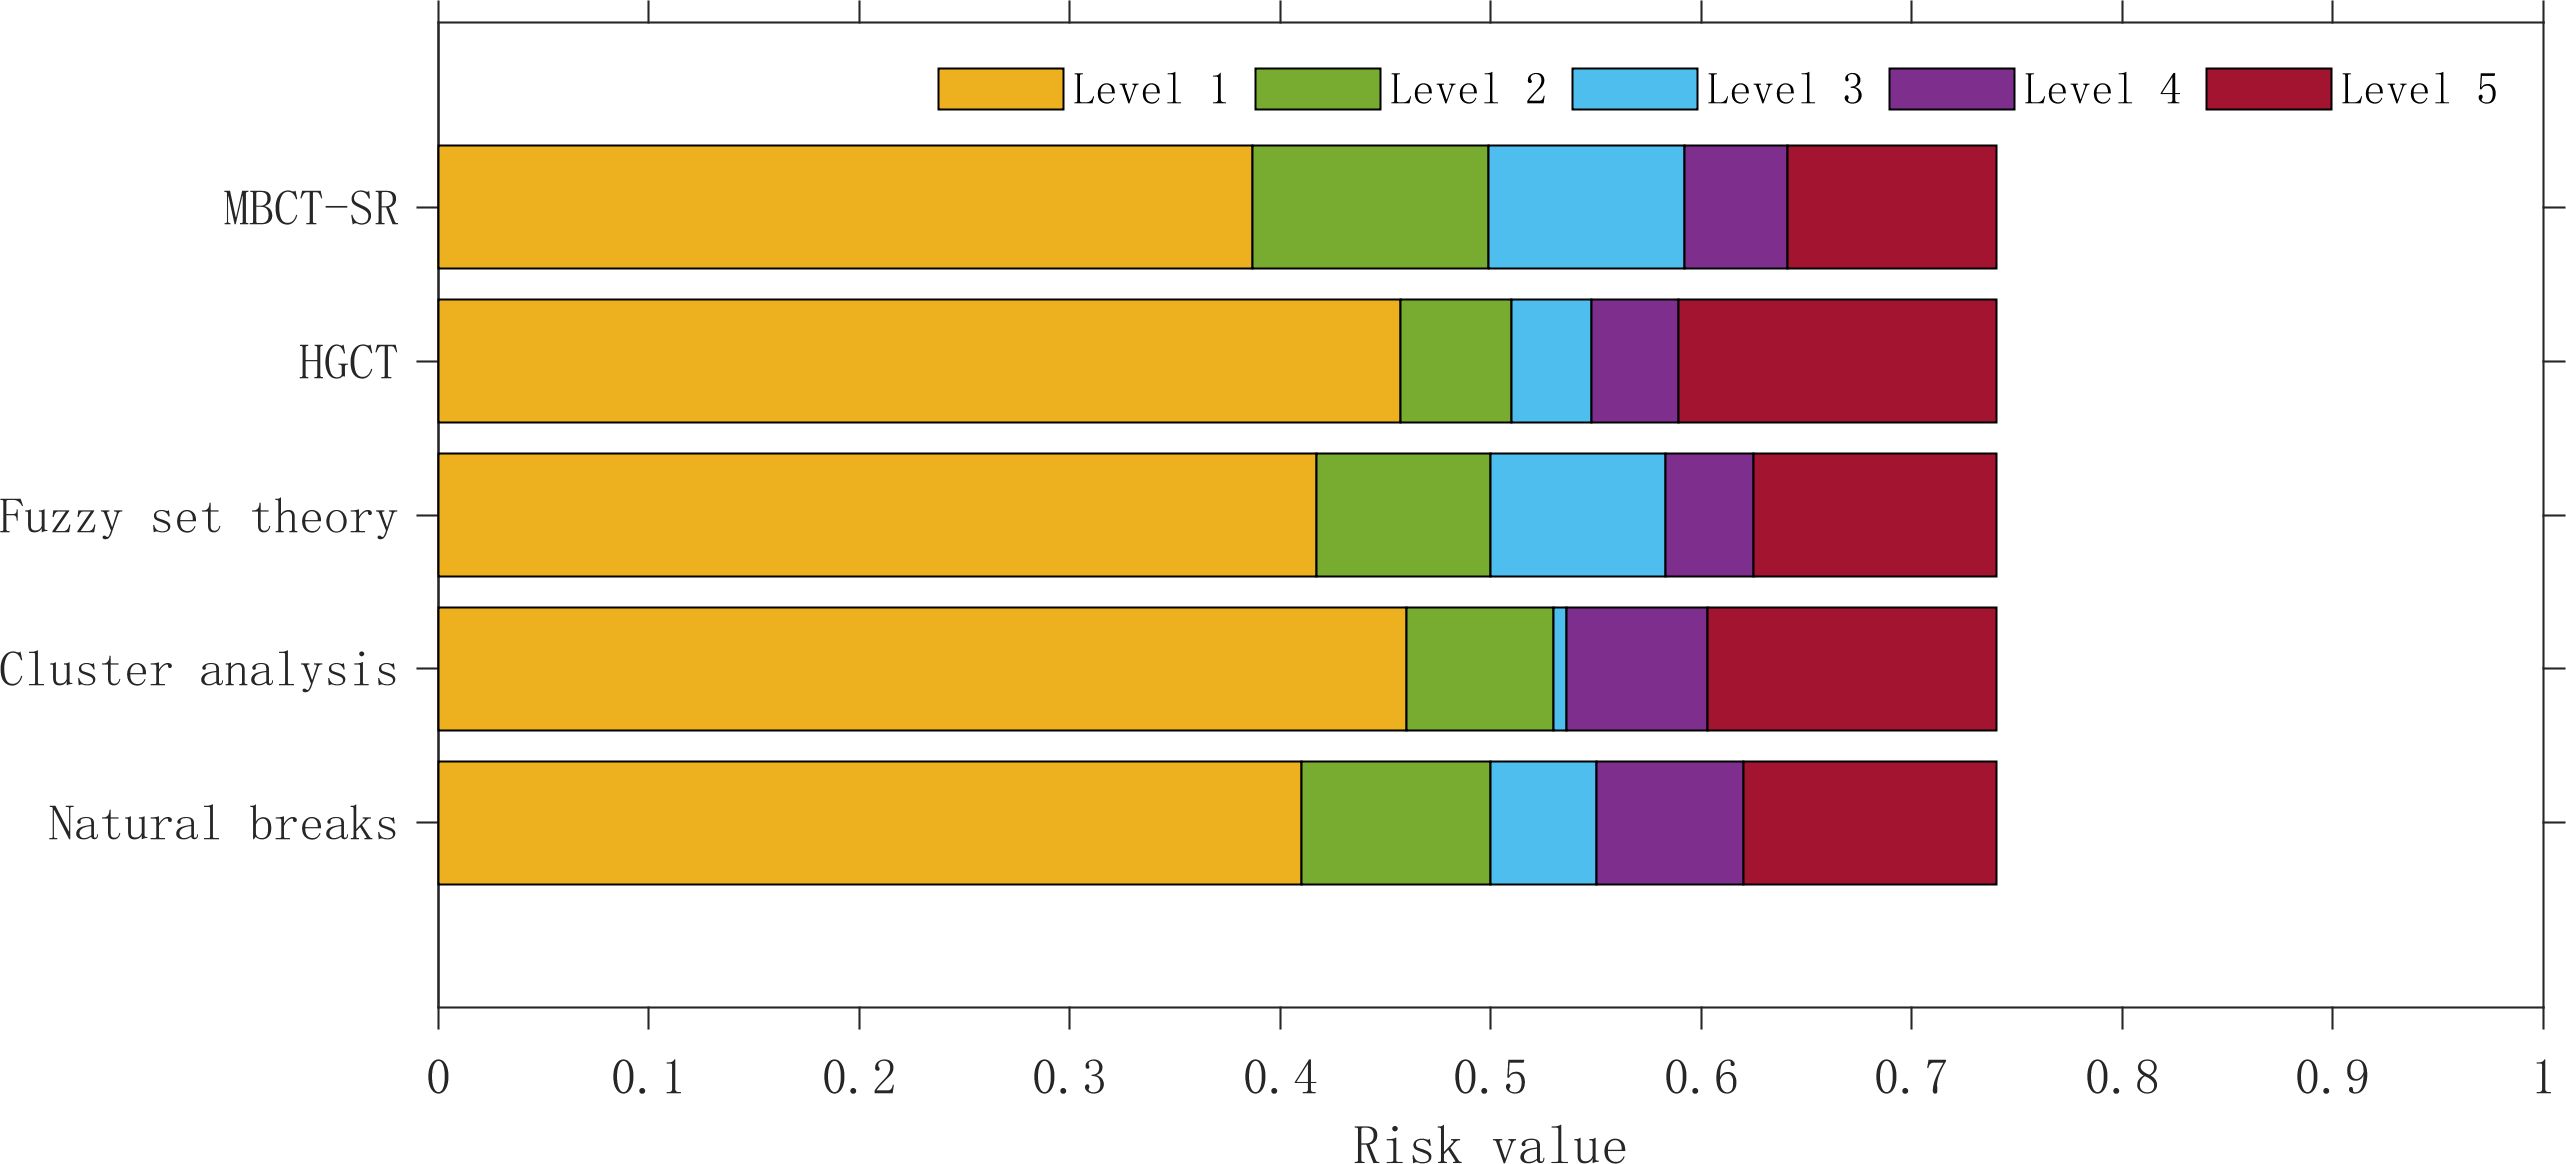
Figure 7. Comparison of risk grading results.
The equal interval method assigned a level-1 risk interval of 0–0.2, which does not align with observed coastal conditions. The standard deviation method showed even greater discrepancies between risk classification and actual coastal states, indicating that both methods are unsuitable for classifying slow-onset coastal degradation risk.
This study pioneers the integration of AHP, CRITIC, and MBCT-SR, thereby enabling a more sensitive, balanced, and comprehensive classification of coastal risks that incorporates both subjective and objective factors. The threshold-based cloud model approach effectively distinguished among accreting, stable, strongly erosional, and severely erosional coastal states. Compared to other methods, it produced notably narrower intervals for level-1 and level-5 risks, while providing broader intervals for level-2 and level-3 risks. By aligning classification with actual coastal conditions, this approach resulted in risk values that correspond well to real-world degradation levels.
4.2 Analysis of coastal damage risk growth
Based on the risk thresholds derived from the MBCT-SR method described in Section 4.1, we analyzed and evaluated the spatiotemporal dynamics of coastal degradation risk within the study area. The risk evolution patterns across five subregions were statistically examined (Figure 8).
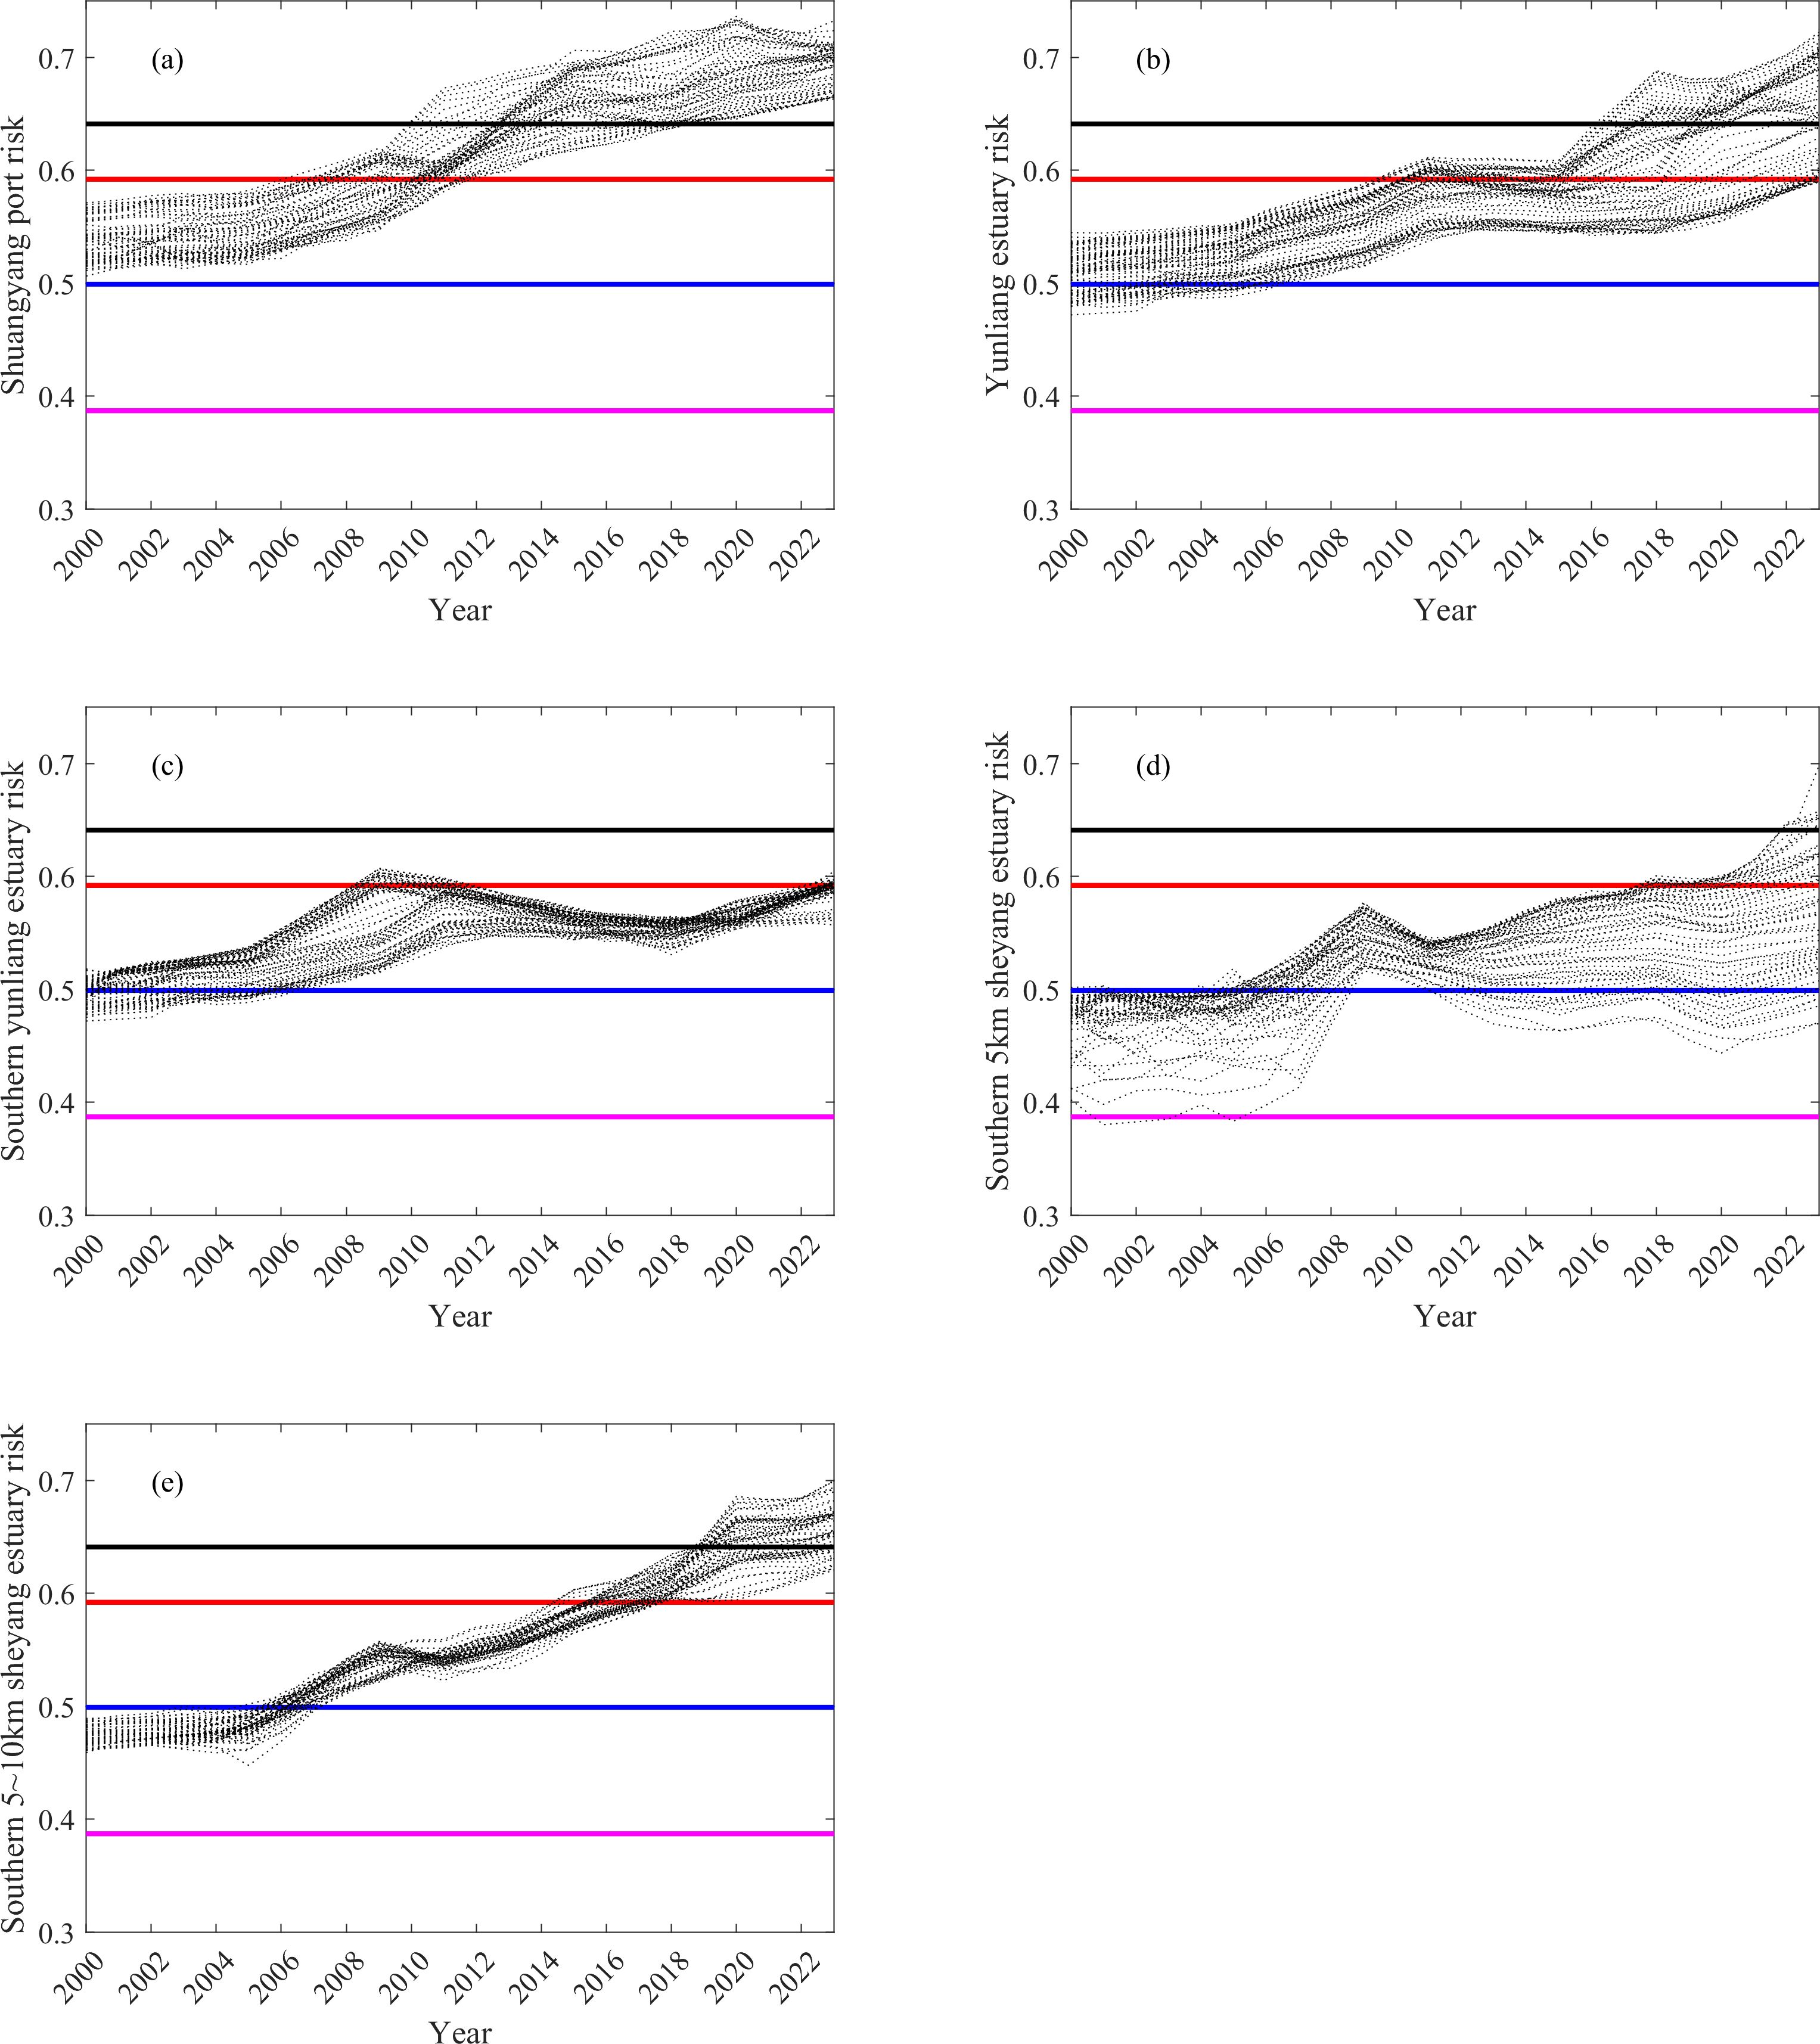
Figure 8. Change trend of coastal damage risk.
At Shuangyang Port, the coastal risk level reached grade 4 around 2009 and escalated to grade 5 by approximately 2017, indicating a transition from grade 4 to grade 5 within an eight-year period. In the Yunliang Estuary, the risk level increased to grade 3 by 2002 and further rose to grade 4 by 2020, taking approximately 16 years for the transition. Notably, the risk in the Yunliang Estuary is currently trending toward grade 5. If the rate of risk escalation follows the trajectory observed at Shuangyang Port, the Yunliang Estuary may reach grade 5 around 2028. This suggests a high likelihood of complete cliff formation along this coastal segment in the near future.
The southern coast of the Yunliang Estuary maintained a grade 3 risk level from 2000 onward, largely due to the influence of the twin-island embankment construction. However, by 2023, one-third of the coastline had already reached level 4 risk. This indicates a strong potential for the entire segment to transition into grade 4 in the coming years. If the current risk escalation trend continues, salt marsh vegetation in the southern Yunliang Estuary may completely disappear by around 2028.
From 2012 to 2023, the southern 5 km section of the Sheyang Estuary has experienced a slow but steady increase in coastal damage risk. Most of the shoreline in this section has reached grade 3 risk, with some areas escalating to grade 4. These sections are now subject to moderate erosion and the threat of salt marsh vegetation loss. In contrast, the 5–10 km coastal zone south of the Sheyang Estuary has experienced rapid risk escalation. Approximately half of this stretch has reached grade 4 risk, while the other half has already entered grade 5. Given the observed trajectory, it is highly probable that this entire section will transition to grade 5 risk in the near future.
4.3 Implications for coastal management
When coastal degradation risk is assessed using qualitative descriptions alone, results are often influenced by subjective judgment, making it difficult to achieve an objective and comprehensive evaluation. Moreover, current coastal restoration efforts are typically reactive, initiated only after degradation has already occurred. Under existing qualitative frameworks, it is challenging to anticipate future changes in risk levels, resulting in a lack of proactive risk management.
This study provides a quantitative assessment of coastal degradation risk for the Sheyang coast, offering an objective evaluation of actual risk levels. The results indicate that both Shuangyang Port and the 5–10 km southern segment of the Sheyang Estuary have largely reached grade 5 risk, highlighting the urgent need for targeted risk control measures in these areas. For these coastal zones, it is recommended to implement wave attenuation measures, such as the construction of submerged breakwaters or the placement of rock revetments (Lorenzoni et al., 2016; Rangel-Buitrago et al., 2018; Tsiaras et al., 2020), and subsequently restore salt marsh vegetation on the landward side of the protective structures.
In the Yunliang Estuary, the findings suggest a strong potential for severe erosion. To mitigate the escalating risk of coastal damage, it is recommended that management authorities adopt proactive measures by implementing wave-dissipating structures—such as submerged breakwaters (Lorenzoni et al., 2016)—within the next five years. For the southern coast of the Yunliang Estuary, proactive intervention is also needed to prevent the complete loss of salt marsh vegetation area, which may occur within a similar five-year timeframe if current trends continue. Flexible wave-dissipating structures may be appropriate solutions for these coastal regions (Verduzco-Zapata et al., 2021).
The southern 0–5 km segment of the Sheyang Estuary is experiencing a gradual increase in degradation risk. Although the risk level here is currently lower than that in other high-risk zones, this region still warrants proactive management—such as deploying flexible wave-dissipating structures (Verduzco-Zapata et al., 2021; Zhang et al., 2022)—to prevent further erosion and avert potential loss of critical salt marsh ecosystems.
These quantified risk thresholds enable coastal managers to implement spatially-explicit, temporally-optimized protection strategies, fundamentally transforming the current reactive management paradigm into a predictive risk governance framework.
4.4 Limitations
While this study has successfully evaluated damage risks to the Sheyang coast, the generalizability of the findings is constrained by three major limitations. First, the sediment transport of the Yellow River has significant impacts on coasts (Yu et al., 2021). However, since the Yellow River changed its course in 1855, the sediment supply to the Sheyang coast has been essentially cut off (Zhou et al., 2014). This study did not incorporate riverine sediment input into the assessment system. Second, sea-level rise and mean tidal range are recognized as key drivers of coastal change (FitzGerald et al., 2008; Le Cozannet et al., 2014; Balke et al., 2016). Although this study sought to collect data on these indicators, the limited spatial extent of the study area precluded the acquisition of spatiotemporal data, thereby precluding objective weight analysis. Third, the maximum risk value observed in Sheyang (0.73) implies that the risk classification for the 0.73–1.0 interval requires validation from coasts with more severe degradation.
Future research should integrate innovative technologies and methodologies to bridge these data gaps (e.g, spatiotemporally varying river sediment data), thereby refining the current assessment framework into a more systematic, robust, and widely applicable tool for evaluating coastal geomorphological and ecological risks.
5 Conclusions
Focusing on the dynamics of the Sheyang coast over the past 20 years, this study integrated multiple key indicators to assess coastal damage risks and obtained the following core conclusions:
First, by combining the AHP and CRITIC using game theory, the importance ranking of risk indicators was determined as: nearshore mean wave height > nearshore mean current velocity > shoreline change rate > salt marsh vegetation area >coastal slope > mudflat area. This result aligns with the Sheyang coast's transition from tide-dominated to wave-dominated dynamic regimes, underscoring the pivotal role of marine hydrodynamic factors in driving coastal changes.
Second, the risk values in the study closely correspond to actual coastal states: low-risk corresponds to stable accretion, medium-risk corresponds to moderate erosion, and high-risk corresponds to severe erosion. The game theory combined weighting method balances the biases of AHP and CRITIC in risk assessment, making the evaluation results more reasonable and accurate.
Third, using the MBCT-SR method, five risk levels were divided based on geomorphological and ecological thresholds, corresponding to different risk thresholds. This classification system provides clear risk-level criteria for coastal zone management, facilitating the formulation of targeted strategies.
Finally, the integrated threshold-cloud model method has obvious advantages: It not only aligns with actual coastal conditions but also minimizes dependence on extensive long-term data, offering an effective approach for risk assessment in data-scarce regions.
This study provides scientific support for the management and conservation of the Sheyang coast and similar regions, while also introducing innovative breakthroughs in coastal risk assessment methodologies. Future studies should incorporate factors such as river sediment transport and sea-level rise to improve the assessment framework, thereby enhancing the accuracy and generalizability of the research.
Data availability statement
The raw data supporting the conclusions of this article will be made available by the authors, without undue reservation.
Author contributions
DL: Conceptualization, Methodology, Software, Data curation, Writing – original draft, Visualization. NG: Formal analysis, Data curation, Writing – review & editing, Visualization. MZ: Formal analysis, Funding acquisition, Supervision, Writing – review & editing, Project administration. MC: Resources, Writing – review & editing. DLL: Software, Data curation, Supervision, Writing – review & editing. HC: Formal analysis, Writing – review & editing. ZZ: Software, Data curation, Writing – review & editing. HH: Supervision, Writing – review & editing. HZ: Supervision, Writing – review & editing.
Funding
The author(s) declare that financial support was received for the research and/or publication of this article. This research was supported by the National Key Research and Development Program of China (grant number 2022YFC3106203), Southern Marine Science and Engineering Guangdong Laboratory (Zhuhai) (SML2021SP308), Science and Technology Development Foundation of South China Sea Bureau, Ministry of Natural Resource (23YD01).
Conflict of interest
The authors declare that the research was conducted in the absence of any commercial or financial relationships that could be construed as a potential conflict of interest.
The reviewer LS declared a shared affiliation with the authors DLL, ZZ, HZ to the handling editor at the time of review.
Generative AI statement
The author(s) declare that no Generative AI was used in the creation of this manuscript.
Publisher’s note
All claims expressed in this article are solely those of the authors and do not necessarily represent those of their affiliated organizations, or those of the publisher, the editors and the reviewers. Any product that may be evaluated in this article, or claim that may be made by its manufacturer, is not guaranteed or endorsed by the publisher.
References
Alexandrakis G. and Poulos S.E. (2014). An holistic approach to beach erosion vulnerability assessment. Sci. Rep. 4, 6078. doi: 10.1038/srep06078
Ayalew L. and Yamagishi H. (2005). The application of GIS-based logistic regression for landslide susceptibility mapping in the Kakuda-Yahiko Mountains, Central Japan. Geomorphology 65, 15–31. doi: 10.1016/j.geomorph.2004.06.010
Balke T., Stock M., Jensen K., Bouma T. J., and Kleyer M. (2016). A global analysis of the seaward salt marsh extent: The importance of tidal range. Water Resour. Res. 52, 3775–3786. doi: 10.1002/2015WR018318
Cai F., Su X., Liu J., Li B., and Lei G. (2009). Coastal erosion in China under the condition of global climate change and measures for its prevention. Prog. Natural Sci. 19, 415–426. doi: 10.1016/j.pnsc.2008.05.034
Cao C., Cai F., Qi H., Liu J., Lei G., Zhu K., et al. (2022). Coastal erosion vulnerability in mainland China based on fuzzy evaluation of cloud models. Front. Mar. Sci. Volume 8. doi: 10.3389/fmars.2021.790664
Chen C., Zhang C., Tian B., Wu W., and Zhou Y. (2023). Tide2Topo: A new method for mapping intertidal topography accurately in complex estuaries and bays with time-series Sentinel-2 images. ISPRS J. Photogramm Remote Sensing 200, 55–72. doi: 10.1016/j.isprsjprs.2023.05.004
Diakoulaki D., Mavrotas G., and Papayannakis L. (1995). Determining objective weights in multiple criteria problems: The critic method. Comput. Operations Res. 22, 763–770. doi: 10.1016/0305-0548(94)00059-H
FitzGerald D. M., Fenster M. S., Argow B. A., and Buynevich I. V. (2008). Coastal impacts due to sea-level rise. Annu. Rev. Earth Planetary Sci. 36), 601–647. doi: 10.1146/annurev.earth.35.031306.140139
Hou X., Wu T., Hou W., Chen Q., Wang Y., and Yu L. (2016). Characteristics of coastline changes in mainland China since the early 1940s. Sci. China Earth Sci. 59, 1791–1802. doi: 10.1007/s11430-016-5317-5
Jiang W., Lv J., Wang C., Chen Z., and Liu Y. (2017). Marsh wetland degradation risk assessment and change analysis: A case study in the Zoige Plateau, China. Ecol. Indic. 82, 316–326. doi: 10.1016/j.ecolind.2017.06.059
Le Cozannet G., Garcin M., Yates M., Idier D., and Meyssignac B. (2014). Approaches to evaluate the recent impacts of sea-level rise on shoreline changes. Earth-Science Rev. 138, 47–60. doi: 10.1016/j.earscirev.2014.08.005
Li X., Zhou Y., Tian B., Kuang R., and Wang L. (2015). GIS-based methodology for erosion risk assessment of the muddy coast in the Yangtze Delta. Ocean & Coastal Management 108, 97–108.
Liang D., Gao N., Ying X., Zeng Z., Xiejun S., Wanming X., et al. (2024). Research and application of constructing a coastal erosion risk prediction model based on LSTM. Haiyang Xuebao 46, 130–140. doi: 10.12284/hyxb2024059
Liu Y., Li D., He W., and Wang G. (2013). Granular computing based on gaussian cloud transformation. Fundamenta Informaticae 127, 385–398. doi: 10.3233/FI-2013-916
Liu R., Pu L., Zhu M., Huang S., and Jiang Y. (2020). Coastal resource-environmental carrying capacity assessment: A comprehensive and trade-off analysis of the case study in Jiangsu coastal zone, eastern China. Ocean Coast. Manage. 186, 50–62. doi: 10.1016/j.ocecoaman.2020.105092
Loi L. T., Phong N. T., and Nguyen L. T. (2024). Intertidal bare mudflat and wave attenuation: A case study in the Vietnamese Mekong Delta. Ecol. Eng. 206, 107320. doi: 10.1016/j.ecoleng.2024.107320
Lorenzoni C., Postacchini M., Brocchini M., and Mancinelli A. (2016). Experimental study of the short-term efficiency of different breakwater configurations on beach protection. Journal of Ocean Engineering and Marine Energy 2 (2), 195–210.
Luo S., Wang H., and Cai F. (2013). An integrated risk assessment of coastal erosion based on fuzzy set theory along Fujian coast, southeast China. Ocean Coast. Manage. 84, 68–76. doi: 10.1016/j.ocecoaman.2013.07.007
Mani Murali R., Ankita M., Amrita S., and Vethamony P. (2013). Coastal vulnerability assessment of Puducherry coast, India, using the analytical hierarchical process. Natural Hazards Earth System Sci. 13, 3291–3311. doi: 10.5194/nhess-13-3291-2013
Markus T., Neumann T., Martino A., Abdalati W., Brunt K., Csatho B., et al. (2017). The Ice, Cloud, and land Elevation Satellite-2 (ICESat-2): science requirements, concept, and implementation. Remote Sens. Environ. 190, 260–273. doi: 10.1016/j.rse.2016.12.029
Moller I., Spencer T., French J. R., Leggett D., and Dixon M. (1999). Wave transformation over salt marshes: a field and numerical modelling study from North Norfolk, England. Estuarine Coast. Shelf Sci. 49, 411–426. doi: 10.1006/ecss.1999.0509
Murray N. J., Worthington T. A., Bunting P., Duce S., Hagger V., Lovelock C. E., et al. (2022). High-resolution mapping of losses and gains of Earth’s tidal wetlands. Science 376 (7594), 744–749.
Nageswara Rao K., Subraelu P., Venkateswara Rao T., Hema Malini B., Ratheesh R., Bhattacharya S., et al. (2008). Sea-level rise and coastal vulnerability: an assessment of Andhra Pradesh coast, India through remote sensing and GIS. J. Coast. Conserv. 12, 195–207. doi: 10.1007/s11852-009-0042-2
Rangel-Buitrago N., Williams A.T., and Anfuso G. (2018). Hard protection structures as a principal coastal erosion management strategy along the Caribbean coast of Colombia. A chronicle of pitfalls. Ocean & Coastal Management 156, 58–75. doi: 10.1016/j.ocecoaman.2017.04.006
Tsiaras A.-C., Karambas T., and Koutsouvela D. (2020). Design of detached emerged and submerged breakwaters for coastal protection: Development and application of an advanced numerical model. J. Waterw. Port. Coast. Ocean. Engin. 146 (4), 04020012. doi: 10.1061/(ASCE)WW.1943-5460.0000566
Tucker C. J. (1979). Red and photographic infrared linear combinations for monitoring vegetation. Remote Sens. Environ. 8, 127–150. doi: 10.1016/0034-4257(79)90013-0
Verduzco-Zapata M. G., García-Nava H., Ocampo-Torres F. J., Mendoza E., Ramírez-Serrano E. I., and and Torres-Orozco E. (2021). Ocean surface waves propagating over a spatial arrangement of subsurface fixed horizontal plate breakwaters crowned with flexible medium. Journal of Fluids and Structures 100, 103318.
Wang X., Xiao X., Zou Z., Chen B., Ma J., Dong J., et al. (2020). Tracking annual changes of coastal tidal flats in China during 1986–2016 through analyses of Landsat images with Google Earth Engine. Remote Sens. Environ. 238, 110987.
Wang Y., Li Z., Tang Z., and Zeng G. (2011). A GIS-based spatial multi-criteria approach for flood risk assessment in the Dongting Lake Region, Hunan, Central China. Water Resour. Manage. 25, 3465–3484. doi: 10.1007/s11269-011-9866-2
Wang Y.-M. and Luo Y. (2010). Integration of correlations with standard deviations for determining attribute weights in multiple attribute decision making. Math. Comput. Model. 51, 1–12. doi: 10.1016/j.mcm.2009.07.016
Wu W., Zhang M., Chen C., Chen Z., Yang H., and Su H. (2024). Coastal reclamation shaped narrower and steeper tidal flats in Fujian, China: Evidence from time-series satellite data. Ocean Coast. Manage. 247, 106933. doi: 10.1016/j.ocecoaman.2023.106933
Xu H. (2006). Modification of normalised difference water index (NDWI) to enhance open water features in remotely sensed imagery. Int. J. Remote Sens. 27, 3025–3033. doi: 10.1080/01431160600589179
Xu Y., Cao K., Li M., and Xu Z. (2016b). Coastal ecological risk assessment: Its research progress and prospect. Adv. Earth Sci. 31, 137–146.
Xu N., Gao Z., and Ning J. (2016a). Analysis of the characteristics and causes of coastline variation in the Bohai Rim (1980–2010). Environ. Earth Sci. 75, 1–11. doi: 10.1007/s12665-016-5452-5
Xu H., Ma C., Lian J., Xu K., and Chaima E. (2018). Urban flooding risk assessment based on an integrated k-means cluster algorithm and improved entropy weight method in the region of Haikou, China. J. hydrology 563, 975–986. doi: 10.1016/j.jhydrol.2018.06.060
Xu N., Ma Y., Yang J., Wang X. H., Wang Y., and Xu R. (2022). Deriving tidal flat topography using ICESat-2 laser altimetry and sentinel-2 imagery. Geophysical Res. Lett. 49, e2021GL096813. doi: 10.1029/2021GL096813
Xu C.-L. and Wang G.-Y. (2017). A novel cognitive transformation algorithm based on Gaussian cloud model and its application in image segmentation. Numerical Algorithms 76, 1039–1070. doi: 10.1007/s11075-017-0296-y
Xu C., Wang G., and Zhang Q. (2014). A new multi-step backward cloud transformation algorithm based on normal cloud model. Fundamenta Informaticae 133, 55–85. doi: 10.3233/FI-2014-1062
Yu D., Han G., Wang X., Zhang B., Eller F., Zhang J., et al. (2021). The impact of runoff flux and reclamation on the spatiotemporal evolution of the Yellow River estuarine wetlands. Ocean Coast. Manage. 212, 105804. doi: 10.1016/j.ocecoaman.2021.105804
Zhang X., Wang C., Li E., and Xu C. (2014). Assessment model of ecoenvironmental vulnerability based on improved entropy weight method. Sci. World J. 2014, 797–814. doi: 10.1155/2014/797814
Zhang W., Ge Z.-M., Li S.-H., Tan L.-S., Zhou K., Li Y.-L., et al. (2022). The role of seasonal vegetation properties in determining the wave attenuation capacity of coastal marshes: Implications for building natural defenses. Ecological Engineering 175, 106494.
Zhang C., Yang Y., Tao J., Chen Y., Yao P., and Su M. (2013). Suspended sediment fluxes in the radial sand ridge field of South Yellow Sea. J. Coast. Res. 65), 624–629. doi: 10.2112/SI65-106.1
Zhou L., Liu J., Saito Y., Zhang Z., Chu H., and Hu G. (2014). Coastal erosion as a major sediment supplier to continental shelves: example from the abandoned Old Huanghe (Yellow River) delta. Continental Shelf Res. 82, 43–59. doi: 10.1016/j.csr.2014.03.015
Keywords: coastal damage risk, Sheyang coast, game theory, cloud model, quantitative assessment
Citation: Liang D, Gao N, Zhao M, Chen M, Li D, Cao H, Zhang Z, Huang H and Zhang H (2025) Quantitative assessment of coastal geomorphological and ecological damage risks: a case study of Sheyang coast. Front. Mar. Sci. 12:1635902. doi: 10.3389/fmars.2025.1635902
Received: 27 May 2025; Accepted: 01 July 2025;
Published: 01 August 2025.
Edited by:
Meilin Wu, Chinese Academy of Sciences (CAS), ChinaReviewed by:
Xianwu Shi, National Marine Hazard Mitigation Service, ChinaJie Sun, Chinese Academy of Sciences (CAS), China
Lianqiang Shi, Ministry of Natural Resources, China
Copyright © 2025 Liang, Gao, Zhao, Chen, Li, Cao, Zhang, Huang and Zhang. This is an open-access article distributed under the terms of the Creative Commons Attribution License (CC BY). The use, distribution or reproduction in other forums is permitted, provided the original author(s) and the copyright owner(s) are credited and that the original publication in this journal is cited, in accordance with accepted academic practice. No use, distribution or reproduction is permitted which does not comply with these terms.
*Correspondence: Na Gao, Zmh4Z2FvbmFAMTYzLmNvbQ==; Mingli Zhao, MTUwOTgwMjczQHFxLmNvbQ==