 İsmet Saygu
 Ruth H. Thurstan
 Callum Roberts3
 Zoe Heard
 Ekin Akoglu
 Paul R. Halloran
- 1Faculty of Environment, Science and Economy, University of Exeter, Exeter, United Kingdom
- 2Fisheries Faculty, Cukurova University, Adana, Türkiye
- 3Centre for Ecology and Conservation, University of Exeter, Penryn, United Kingdom
- 4Department of Marine Biology and Fisheries, Institute of Marine Sciences, Middle East Technical University, Erdemli, Türkiye
- 5Climate Change and Sustainable Development Application and Research Center, Middle East Technical University, Ankara, Türkiye
Knowledge of past ecosystems is essential to understand how marine ecosystems have changed under human pressure. This understanding is critical for the effective management of marine ecosystems today. However, there has been limited effort to investigate the historical state of marine ecosystems and their changes over time under human impact, particularly since the industrial revolution when fishing intensity markedly increased. In this study, we developed two mass-balanced Ecopath models with identical topology to create comparable representations of marine ecosystems of the North Sea in the 1890s and 1990s based on historical landings data of marine fisheries statistics from the ‘Fishery Board for Scotland’. While the 1890s represent the onset of industrial fisheries, the 1990s were specifically selected as a more recent reference point to align with existing models that are currently integral to ecosystem-based management in the North Sea. Indicator-based assessments revealed that direct and indirect impacts of fisheries on the food web triggered cascading changes in trophic interactions and ultimately led to a decline in the ecosystem’s maturity and resilience over the century, reflecting the industrialization of the North Sea fisheries. Our results now suggest that present day model-based fisheries management practices in the North Sea are based on ecosystem structure and function that were already degraded. Therefore, we propose the potential use of historical ecosystem models representing quasi-pristine state of ecosystems as baselines or thresholds for indicator-based assessments. Finally, this study emphasizes the importance of unveiling historical fisheries records from dusty archives.
1 Introduction
Understanding the historical state of ecosystems is crucial for effectively managing and restoring marine environments profoundly shaped by human activities, with the effects of cultural, industrial and climatic transitions becoming increasingly apparent over the past century (Thurstan, 2022). Historical ecosystem models allow us to explore how marine ecosystems were likely to have functioned before those ecosystems experienced significant anthropogenic impacts. These models can enable researchers and policymakers to distinguish between natural variability and human-induced changes. By reconstructing past conditions, we can better assess the extent of ecological degradation, design informed conservation strategies and identify sustainable pathways for human-sea interactions (Pitcher, 2005).
The ‘Back to the Future’ approach, first introduced by Pitcher et al. (1999), has inspired initiatives in historical and archaeological ecosystem modelling. Several notable examples of ecosystem models have been developed for oceans and seas worldwide, focusing on periods pre-dating the 1900s. At first, Fisheries Centre Research Reports, published by the Fisheries Centre at the University of British Columbia, introduced the historical models for various ecosystems including the Strait of Georgia in the 1880s (Dalsgaard et al., 1998), the Hecate Strait in the 1900s (Beattie et al., 1999), the North Sea in the 1880s (Mackinson, 2001), the northern British Columbia in 1750 and 1900 (Ainsworth et al., 2002), and Newfoundland in 1450 and 1900 (Pitcher et al., 2002). These reports primarily focused on technical details of model input calculations and basic results, establishing a foundation for subsequent modelling efforts. For instance, further model comparisons and time series simulations, to some extent, were conducted for northern British Columbia (Ainsworth et al., 2008; Efford, 2024). Moreover, the reconstruction of historical ecosystems using comparative modelling approaches has been successfully applied to a lagoonal system (Nuttall et al., 2011) and a lake ecosystem (McGregor, 2014).
In ecosystem modelling studies, particularly those applying Ecopath with Ecosim, indicators are essential tools for interpreting and comparing ecosystem structure and function across different periods or regions. These indicators summarizing aspects such as energy flow, trophic interactions, and biomass distribution, help translate complex food web dynamics into quantifiable metrics that can inform management. By capturing key features of ecological structure and functioning, indicators enable meaningful comparisons between historical and contemporary ecosystems and offer insights into long-term change and ecosystem resilience. Their use supports the identification of reference conditions and facilitates the assessment of anthropogenic impacts within an ecosystem-based management framework (ICES, 2025).
The North Sea is an exemplary region for such investigations, having been a focal point of fisheries activity since the early industrial period. North Sea fisheries have ancient roots, with historical and archaeological records pointing to significant intercontinental exploitation and trade of herring, cod and native oyster commencing centuries to millennia ago (Harris, 2000; Barrett and Orton, 2016). On the east coast of Scotland, archaeological investigations reveal a variety of fish species, including cod, saithe, haddock and whiting, and birds and marine mammals, were exploited for local sustenance and possibly trade since Mesolithic times (Cerón-Carrasco, 1998, 2002). During the 19th century, North Sea fisheries underwent a step change in geographical spread and intensity, as demand for fish increased and steam power was developed. In addition to the intensification of inshore fishing effort by line and net fisheries (Jones et al., 2016), the mid-late 19th century witnessed the introduction of demersal trawl fisheries to the east coast of Scotland (Jones et al., 2016). By the 1880s, steam-powered beam trawlers were established in a number of east coast Scotland ports (Jones et al., 2016). Fishing effort across all sectors continued to expand throughout the 20th century, and by the mid-1950s, landings by trawlers and Danish seine-nets were the predominant methods of landing fish into Scottish ports. In the present day, demersal trawlers continue to exert a major pressure on the ecosystem health of the east coast of Scotland and the wider North Sea region.
A comprehensive ecosystem model of the North Sea for the year of 1991 was presented in a technical report to support an ecosystem-based approach to fisheries management (Mackinson and Daskalov, 2007). Although an ecosystem model of the North Sea exist for 1981 (Christensen, 1995a), all North Sea models use this 1991 model as a baseline and focus on that year and beyond, reflecting their integration into ecosystem-based management strategies (Mackinson et al., 2018; Piet et al., 2024) to develop management advice under the auspices of International Council for the Exploration of the Sea (ICES) (ICES, 2013). The 1981 model is characterized by more limited input data and lower resolution compared to the more comprehensive and better-documented 1991 model.
The North Sea ecosystem model has been used to explore long-term management strategies for mixed demersal fisheries from 1991 onward, focusing on cod, haddock, and whiting (Mackinson et al., 2009), while also assessing the impact of fisheries subsidies on ecological sustainability and profitability between 1991 and 2003 (Heymans et al., 2011). Additionally, it has provided insights into how temperature changes and nutrient availability influenced ecological dynamics alongside fishing pressures between 1991 and 2007 (Mackinson, 2014). By 2015, food web projections based on the model for the period between 1991 and 2007 further highlighted the potential contributions of fisheries management measures toward achieving Good Environmental Status for the North Sea (Lynam and Mackinson, 2015).
The northern North Sea was specifically modelled and presented in a technical report for 1991 (Hill et al., 2021) as a part of a PhD study addressing the impacts of the landing obligation under the European Union Common Fisheries Policy (Hill, 2022). This study included time simulations spanning 1991 to 2018 and future projections under sea warming and fisheries management scenarios to 2050 and was based on the 1991 model developed by Mackinson and Daskalov (2007).
Similarly, the southern North Sea has been modelled for better fisheries management, particularly for investigating multispecies maximum sustainable yield and achieving Good Environmental Status (Stäbler et al., 2016), adjusting fishing effort to maintain optimal yields by hindcasting dynamics from 1991 to 2010 (Stäbler et al., 2019), and analysing food web structure and function through comparisons with the entire North Sea models for 1991 (Stäbler et al., 2018). Additionally, a food web model specifically explored southern Bight of the North Sea, a subregion of the southern North Sea, for the year 1991 (Pint et al., 2024).
Moreover, spatial dimensions have been incorporated into the entire North Sea (Romagnoni et al., 2015) and the southern North Sea (Püts et al., 2020, 2023). Other modelling approaches, such as an end-to-end ecosystem model (Thorpe et al., 2022) and an individual-based, spatially and temporally explicit multispecies model (Morell et al., 2023), have also been applied in the North Sea.
In summary, it is important to highlight that all of the North Sea modelling efforts are based on the year 1991 model developed by Mackinson and Daskalov (2007). Despite its ecological and economic importance, many aspects of the North Sea’s historical ecosystem dynamics remain poorly understood, particularly its state prior to the widespread industrialization of fisheries. Ecological modelling faces challenges not only in data-poor regions but also in data-poor historical periods. By utilizing historical fishing records to address this gap, this study aims to investigate century-long changes in ecosystem structure and function by developing a historical ecosystem model for the 1890s and comparing it with a more recent model from the 1990s. Beyond a technical model comparison, we examine how fishing pressure and ecological changes may have influenced trophic interactions, ecosystem stability, and the roles of key species in the food web. In doing so, we seek to address the broader question of how industrialisation may have transformed marine ecosystem dynamics, and how historical baselines can help inform sustainable, ecosystem-based management today.
2 Material and methods
2.1 Study area
The study area encompasses the continental shelf above the 400 m depth contour within the historical fishing grounds of the Scottish fishing fleet off the East Coast of Scotland (ECS), which includes the water surrounding fishing ports along the Scottish coast, extending northward to the Orkney and Shetland Islands. The described region falls within ICES Area IV, specifically the subdivisions IV-a (northern North Sea) and IV-b (central North Sea), as designated by ICES to facilitate better management of the North Sea ecosystem and its fisheries (Figure 1).
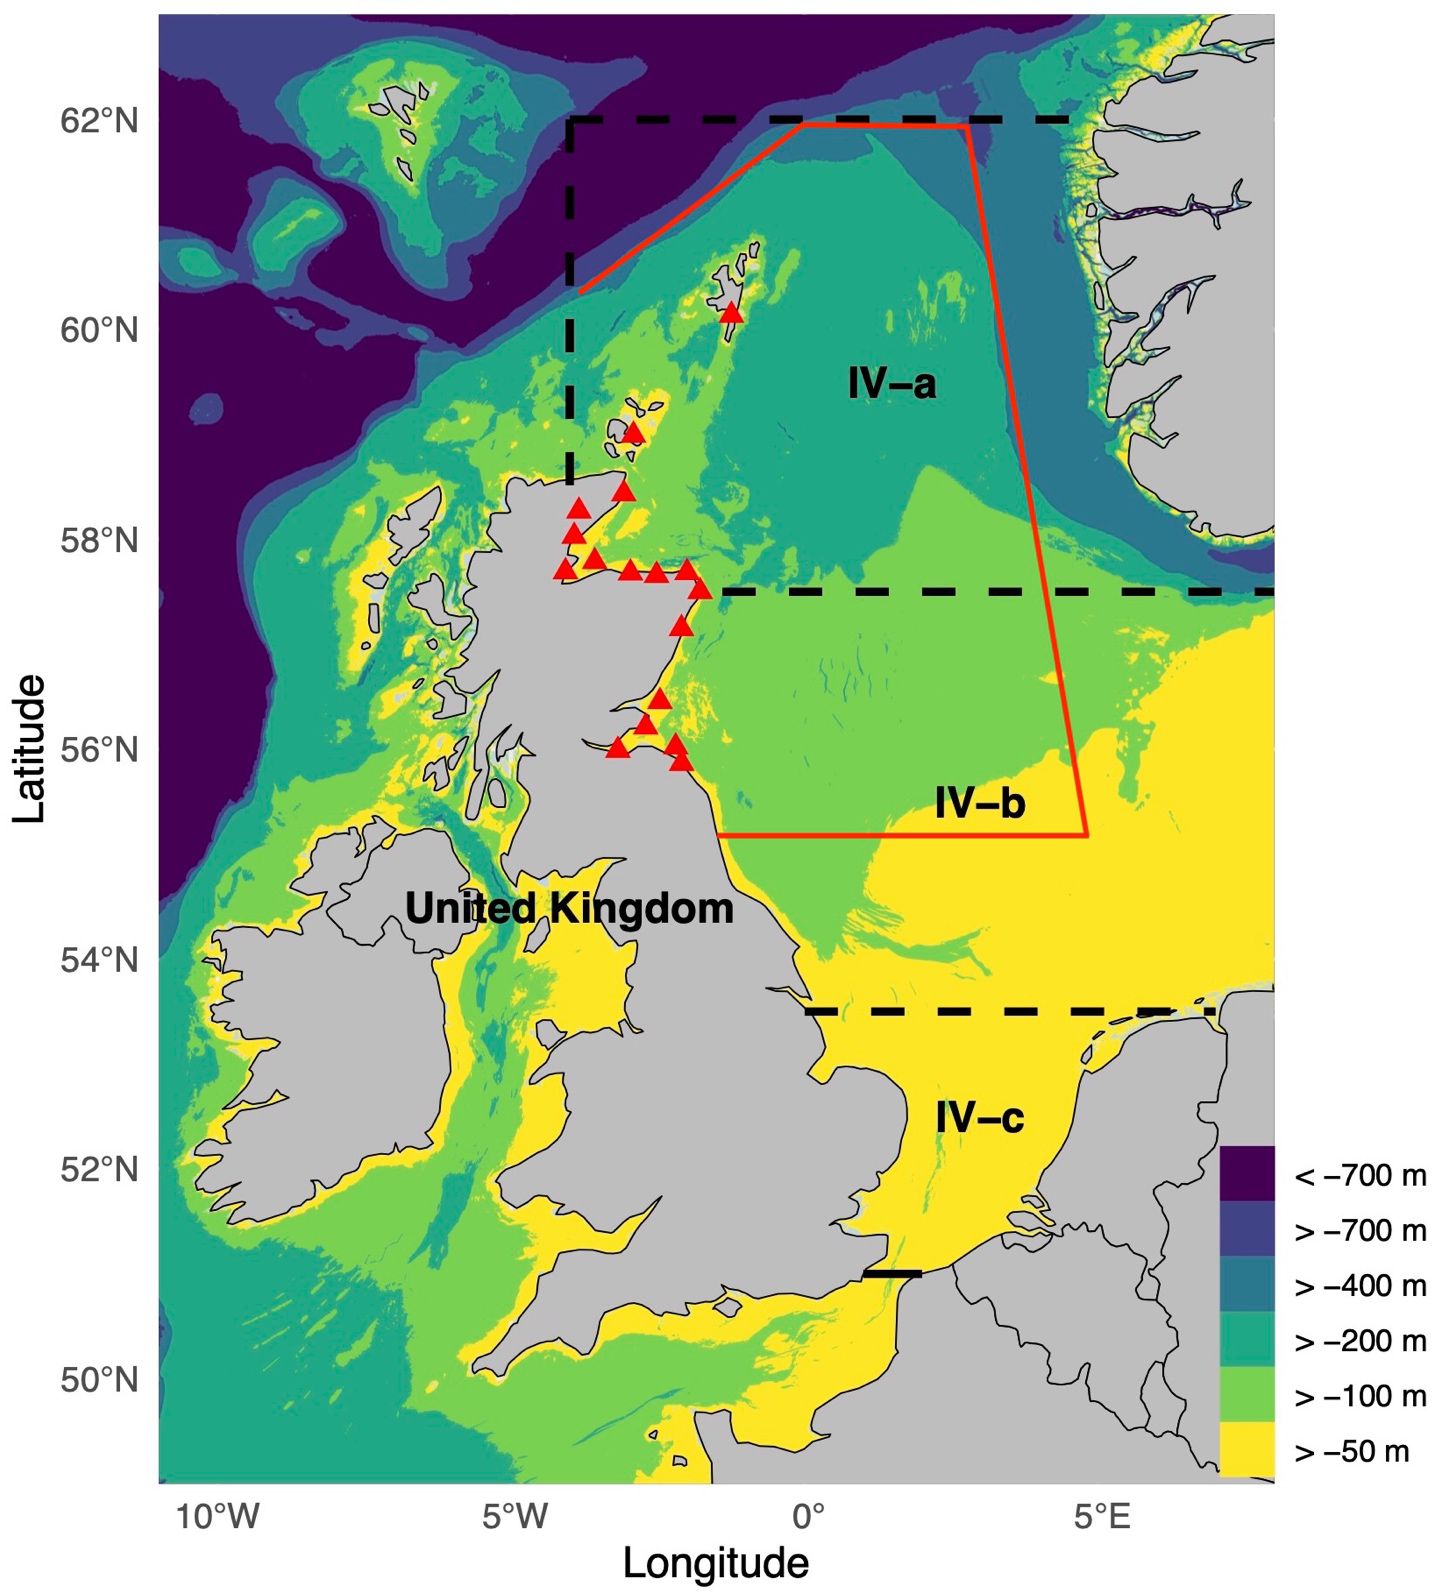
Figure 1. Study area: East Coast of Scotland (ECS). The red line indicates the approximate spatial extent of the ECS modelling area, based on historical fishing grounds of the Scottish fleet. The red triangles indicate fishing ports along the ECS. The ICES divisions of the northern North Sea (IV-a) and southern North Sea (IV-b and IV-c), which together comprise the North Sea, are outlined with black dashed lines. Colours indicate depth intervals. Fishing ports, from south to north along the Scottish coastline, include Eyemouth, Leith, Anstruther, Montrose, Stonehaven, Aberdeen, Peterhead, Fraserburgh, Banff, Buckie, Findhorn, Cromarty, Helmsdale, Lybster, Wick, and the Orkney and Shetland Islands.
The North Sea has an average depth of approximately 90 m, with significant regional variations. The southern North Sea (IV-b + IV-c) is relatively shallow (~50 m), with maximum depths reaching 125 m, and is characterized by predominantly terrigenous sediments formed through erosion processes (Slomp et al., 1997). In contrast, the northern North Sea has an average depth exceeding 100 m, with depths reaching approximately 400 m on the shelf and over 700 m within the Norwegian Trench. The northern seabed is primarily composed of mud and muddy sand, with rocky substrates near the coasts of Scotland and Norway.
The northern North Sea is strongly influenced by Atlantic Ocean currents, which regulate the salinity and nutrient dynamics. Two major currents transport high-salinity Atlantic waters into this region. The first flows through the Fair Isle Channel, while the second, more substantial inflow, moves along the western slope of the Norwegian Trench (Otto et al., 1990). Conversely, the Norwegian Coastal Current, a low-salinity outflow carrying freshwater from fjords and rivers, flows northward along the eastern slope of the trench, forming an anticlockwise gyre that affects the entire basin (Brown et al., 1999). Seasonal stratification in the northern North Sea creates a thermocline that enhances nutrient retention and supports high primary production during the spring and summer months (Reid et al., 1990).
Environmental heterogeneity influences biodiversity and fisheries. The northern North Sea hosts a diverse assemblage of species, including demersal gadoids such as cod, haddock, saithe, and whiting, and pelagic species such as herring and mackerel. This is in contrast to the southern North Sea, where flatfish and shellfish dominate (Mackinson and Daskalov, 2007; Frelat et al., 2017). The North Sea also hosts grey and harbour seal populations (Thompson et al., 2019; Russell et al., 2019; Thomas et al., 2019). Although our study area primarily focuses on the northern North Sea, it also extends into the southern North Sea. Consequently, the ECS is influenced by the bathymetry, sediment diversity, and oceanic conditions in both regions, shaping its complex ecological dynamics and resource utilization.
2.2 Modelling approach
Ecopath with Ecosim (EwE) is a widely used ecosystem modelling framework designed to analyse and quantify trophic interactions and human impact within marine ecosystems. EwE comprises three main modules: 1) Ecopath, a static model, 2) Ecosim, a temporal model, and 3) Ecospace, a spatiotemporal model. The Ecopath module, the foundation of EwE, provides a structured approach to represent energy flows and nutrient cycling from primary producers to top predators through a static, mass-balanced snapshot of the ecosystem’s food web. Ecopath uses two linear equations to ensure that biomass and energy budgets are balanced across all functional groups within the system. The first equation states that consumption equals the sum of production, respiration and unassimilated food. The second equation explains that production, as defined in the Equation 1, is derived from the sum of predation mortality, fishing mortality, other mortality, biomass accumulation, and net migration. This equation can be expressed mathematically (Christensen and Walters, 2024):
where Pi is the total production of functional group i, Bi is the biomass of group i, Yi is the total fishery catch rate of i, M2i is the instantaneous predation mortality rate for group i, Ei is the net migration rate (emigration-immigration) for i, BAi is the biomass accumulation rate for i, EEi is the ecotrophic efficiency of group i, and (1-EEi) represents the other mortality rate not attributed to predation or catches. EE describes the proportion of production utilized within a system (Heymans et al., 2016). This framework requires the following input parameters: Biomass (B), production/biomass (P/B), consumption/biomass (Q/B), and ecotrophic efficiency (EE), of which at least three must be provided, along with dietary and catch data. The model then estimates the remaining parameters to achieve mass balance. A useful tip is to allow Ecopath to estimate P/B or Q/B if the production/consumption (P/Q) ratio is provided as input to the model (Christensen and Walters, 2024).
2.3 Model structure and balancing
We developed two mass-balanced Ecopath models to represent the average state of the ECS during the 1890s (1890–1895) and the 1990s (1991–1995) using EwE version 6.6.8 (Christensen and Walters, 2024). The 1890s model represents the onset of industrial fisheries, before the rapid increase in fishing power associated with the transition from sail to steam (Thurstan et al., 2010). The 1990s was chosen for the second model as a more recent reference point, and one that aligns with existing ecosystem models that underpin ecosystem-based management in the North Sea. Notably, all North Sea ecosystem models used in management frameworks are either mass-balanced models or serve as initial conditions for time-series models based on the 1990s.
To ensure comparability, identical food web topologies were maintained in both models, meaning that the number of functional groups described and links among them remained consistent. This approach enables direct comparisons of indicators between the 1890s and 1990s food webs at both ecosystem and functional group levels.
First, we developed the Ecopath model for the 1990s. This model served as a robust foundation due to the relatively high availability and quality of data. The 1890s model, a historical Ecopath model, was constructed using available historical data, which was supplemented and guided by the outputs of the 1990s model (Figure 2). For this data-limited period, this approach ensured ecological plausibility by strictly adhering to ecologically sensible parameters and ratios. Specifically, the P/Q ratios were derived from the 1990s model, assumed to be time-invariant, and were used to estimate the Q/B ratios in the 1890s model. The same diet matrix was used to maintain consistent topology. The natural mortality of species, a component of total mortality, was assumed to be the same in both models. This means that the differences in total mortality between the two models were solely attributed to fishing mortality. Finally, to ensure that both the models achieved a mass-balanced state, they were iteratively refined in tandem. This dual balancing process allowed synergistic calibration, wherein adjustments in one model led to refinements in the other. This approach is conceptualized in Figure 2. The unit used in the models was tonnes wet weight per square kilometre (t km-2) for biomass, and tonnes wet weight per square kilometre per year (t km-2 y-1) for energy flows.
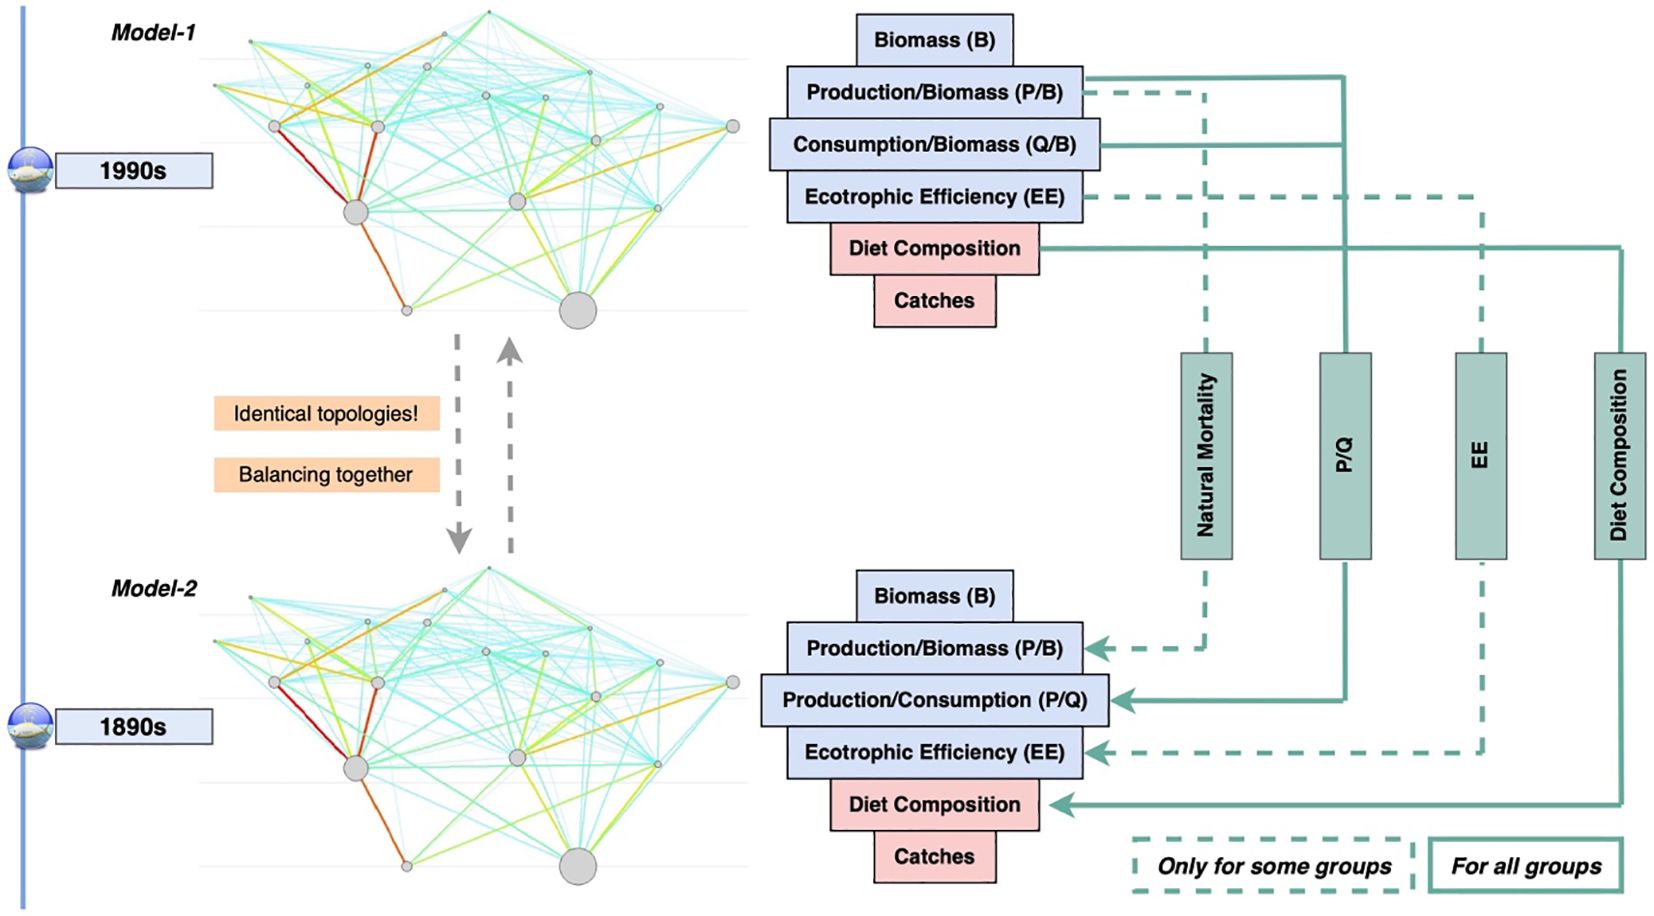
Figure 2. Conceptual diagram illustrating the steps involved in setting up and balancing the 1990s and the 1890s Ecopath models for the East Coast of Scotland ecosystem. The dashed green arrows indicate the transfer of input information for selected functional groups from the 1990s model to the 1890s model. The specific groups for which data were transferred are detailed in Table 1. The dashed arrow from P/B in the 1990s model to P/B in the 1890s model represents that P/B values for some groups were directly transferred. However, natural mortality (M) was assumed to be identical in both models for all groups.
To balance the models, we followed the best practice guidelines (Heymans et al., 2016). Prior to balancing, pre-balance (PREBAL) diagnostics were used to evaluate the slopes of B, P/B, and Q/B across trophic levels (Link, 2010; Heymans et al., 2016). The pedigree index was calculated to assess the quality of the input data by applying the pedigree routine, which assigns varying uncertainty ranges to each data source used to parameterize the Ecopath models based on default pedigree categories for B, P/B, Q/B, diet, and catch. The default procedures ensured mass balance across both models. The models were considered balanced when EE were below unity (EE < 1), gross growth efficiencies (P/Q) ranged from 0.1 to 0.3, which is consistent with the second law of thermodynamics, and respiration to assimilation (R/A) and production to respiration (P/R) ratios were below unity. Additionally, the respiration to biomass (R/B) ratios for fish groups were within the range of 1–10 year-1 (Heymans et al., 2016; Christensen and Walters, 2024).
2.4 Functional groups and input parameters
The resolution of functional groups in the ECS model was determined by considering the research objectives, commercial and ecological importance of species, and trophic diversity, similar to previous modelling efforts in the North Sea. However, a key constraint was the availability of historical data, particularly biomass and catch data, which needed to be region-specific and accurately reflect the modelled years. The ECS model comprised 25 functional groups, each representing either a single species or a group of ecologically similar species or taxa (Table 1). Due to data limitations in the historical model, multi-stanza groups, representing different ontogenetic life stages, were not included.
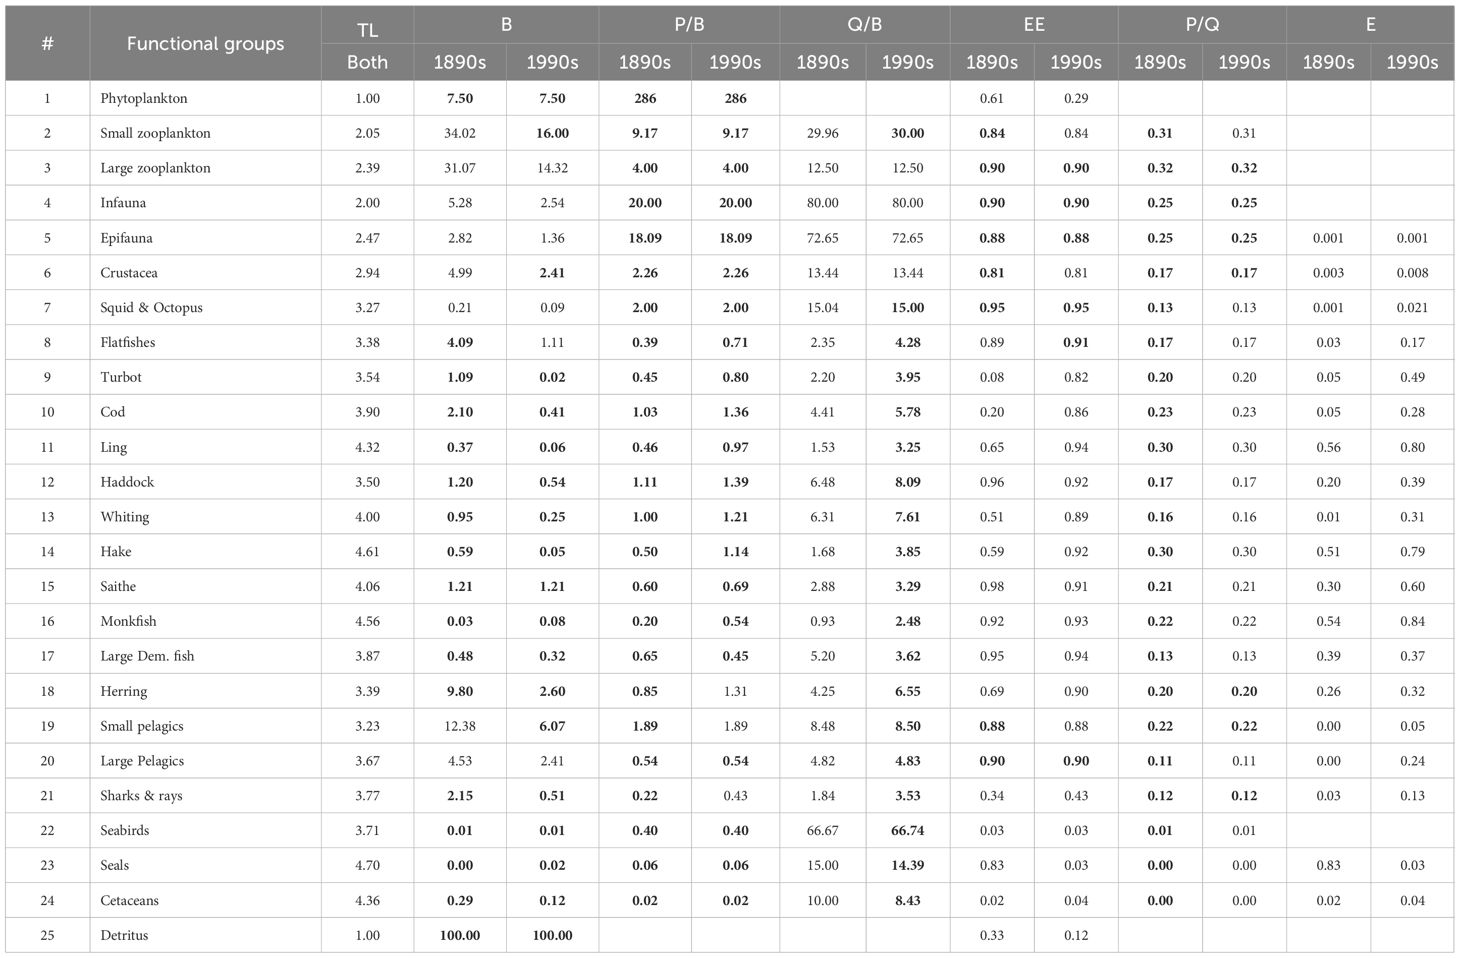
Table 1. Inputs (bold blue) and outputs of the two ECS models (1890s and 1990s) by functional groups: Trophic level (TL), biomass (B), production/biomass (P/B), consumption/biomass (Q/B), ecotrophic efficiency (EE), production/consumption (P/Q), exploitation rate (E).
The primary criterion for defining these groups was the availability of historical landings data, which were species-specific and documented by fishing ports along the Scottish coast in the Annual Report of the Fishery Board for Scotland (Fishery Board for Scotland, 1890–1895; 1991-1995). Data from fishing ports representing the ECS region were collected, including Eyemouth, Leith, Anstruther, Montrose, Stonehaven, Aberdeen, Peterhead, Fraserburgh, Banff, Buckie, Findhorn, Cromarty, Helmsdale, Lybster, Wick, and the Orkney and Shetland Islands (Figure 1). These data enabled the representation of several species as single species groups, including turbot, cod, ling, haddock, whiting, hake, saithe, and herring.
The models included three fishing fleets: herring fisheries (pelagic fisheries), whitefish fisheries (demersal fisheries), and creels (Scotland’s static pot). Due to the lack of statistical records detailing species-specific landings by fishing fleets, these fleets were defined based on historical records that identified herring-targeted and cod/ling-targeted fisheries (Jones et al., 2016). Significant differences in fishing methods between the two modelling periods made it more practical to categorize fleets based on prime target species rather than gear type. Notably, species- and fleet-specific catch data were available only after 2003, as reported by the Scientific, Technical, and Economic Committee for Fisheries (STECF, 2018). To address this gap, Hill et al. (2021) adapted the data to 1991 using landing proportions from 2003, assuming that these proportions remained constant in 1991. Using a similar approach, we simplified the classification from seven fleets (beam trawl, otter trawl, Nephrops trawl, pelagic, dredge, gill/trammel nets, and pots) to the three fleets. This allocation was assumed to remain constant across both modelled time periods. The landings by fishing fleet in this study are provided in the Supplementary Table S1.
Previous North Sea models provided valuable guidance for the thorough investigation and collection of publicly available data, for the 1890s model (Mackinson, 2001; Mackinson and Daskalov, 2007) and the 1990s model (Mackinson and Daskalov, 2007; Hill et al., 2021). These reports served as critical baselines for the input parameters and assumptions in this study. Specifically, biomass estimations for species derived only from stock assessments or survey-based methods, such as swept area, were adapted using data from these regional technical reports.
For fished groups, the turnover rate of a functional group (P/B) was estimated under the assumption of steady-state conditions, where P/B equates to total mortality (Z, year-1) as described by Allen (1971). Z is calculated as the sum of fishing mortality (F, year-1), derived from the ratio of catch (C) to biomass (B) following Christensen and Walters (2004), and natural mortality (M, year-1), estimated using the empirical equation by Pauly (1980). Fishing mortality was converted to its instantaneous form before being summed with natural mortality. Q/B ratios were determined using an empirical equation from Palomares and Pauly (1998). The input data and detailed descriptions of the functional groups are given in Table 1 and the Supplementary Table S2, respectively. Diet matrix was extracted and adapted from published literature and models, with preference given to studies from the North Sea where applicable (Supplementary Table S3). Mackinson and Daskalov (2007) provide a comprehensive overview of the data sources.
2.5 Network analysis
Based on thermodynamic and ecosystem principles (Christensen and Walters, 2004; Müller, 1997), we employed an indicator-based approach under four primary categories to assess food web characteristics and fisheries’ impacts: ecosystem theory indices, cycling indices, information indices, and fisheries indices. Furthermore, network analysis provided a comprehensive evaluation of mixed trophic interactions within the food web considering fisheries. Various ecological and fisheries indicators were calculated for each Ecopath model and compared to assess changes in ecosystem structure and function over a century. The equations and definitions of all ecological and fisheries indicators used in the network analysis are provided in Supplementary Material S1.
To assess ecosystem structure, functioning and energy dynamics, several ecosystem theory indicators were calculated. The trophic structure of the ecosystem was analysed using discrete trophic levels (TLs) and integrated trophic flows across TLs. Trophic levels were determined based on a diet composition matrix, with primary producers and detritus assigned a TL of 1, whereas the TLs of other functional groups were calculated accordingly (Lindeman, 1942). Flows within the food web were visualized using the Lindeman spine, which depicts the energy transfer (Lindeman, 1942; Ulanowicz, 1986). The total system throughput (TST), composed of total consumption, total export, total respiration, and total flows into detritus, indicates the overall size of the ecosystem (Finn, 1976). TST is also a valuable metric for normalizing other ecosystem indicators. To describe the complexity of feeding interactions within the food web, we calculated several metrics, including the sum of all production, total primary production, total primary production/total respiration, net system production, total primary production/total biomass, total biomass/TST, total biomass (excluding detritus), Schrödinger ratio (respiration/total biomass), and mean trophic level of the community (Christensen et al., 2005). For instance, the ratio of total primary production to total respiration is commonly used to assess whether the system is in a developing or mature state. The total primary production/total biomass ratio indicates the turnover rate of energy in the system, often higher in disturbed or fast-growing ecosystems. Similarly, total biomass/TST provides an indication of how much standing biomass is supported by a unit of energy flow, with lower values potentially signalling overexploitation. The Schrödinger ratio reflects the metabolic intensity of the ecosystem, and higher values may indicate stress or inefficiency. Shannon diversity index was used to quantify biological diversity of the ecosystem (Clarke and Warwick, 2001). The system omnivory index was calculated as the variance of trophic levels in the diet. A low value indicates a more specialist diet, while a high value suggests more complex dietary preferences. Finally, transfer efficiency was used to measure the energy transfer efficiency between adjacent trophic levels, representing the proportion of energy successfully passing to the next level (Lindeman, 1942). The mean transfer efficiency was determined as the geometric mean of transfer efficiency across trophic levels II to IV (Christensen et al., 2005).
We calculated a set of cycling indices, including throughput cycled (excluding detritus), predatory cycling index, throughput cycled (including detritus), Finn’s cycling index, and Finn’s mean path length, which are expected to be high in healthy ecosystems (Odum, 1969). Throughput cycled (excluding and including detritus) represent the amount of energy or matter recycled within the system, either among living components alone or including detrital pathways. Higher values indicate stronger internal recycling, which supports ecosystem stability and resilience, while lower values suggest more linear flow and potentially reduced capacity for self-regulation. Finn’s cycling index represents the recycled portion of the TST in an ecosystem and indicates the degree of material reuse within the system. A higher Finn’s cycling index value suggests greater material recycling, which contributes to ecosystem stability and resilience. Finn’s mean path length measures the average number of steps a unit of energy flow takes through the food web, reflecting the complexity of energy pathways and the interconnectedness of the ecosystem. Both Finn’s cycling index and Finn’s mean path length are critical for understanding an ecosystem’s recovery time following perturbations. Predatory cycling index specifically highlights the recycled portion of the TST, excluding contributions from detrital compartments, and offers insights into predatory cycling dynamics (Finn, 1976).
Information theory-based indices were applied to assess the organization, resilience, and complexity of the ecosystem. A healthy ecosystem maintains a balance between its capacity to recover from stress and its resistance to perturbations (Costanza and Mageau, 1999). Information indices provide a means to quantify this balance. Ascendency (A) measures the organizational status of a food web, reflecting its recovery capacity. The upper limit of ascendency is the development capacity (C), and the difference between capacity and ascendency, known as the system overhead (O), indicates the ecosystem’s resilience and ability to withstand perturbations and stress. Ascendency (A/C) and overhead (O/C) are expressed relative to capacity (C). Additionally, the relative redundancy (R/C) and flow diversity (C/TST) were calculated as indicators of the resilience and complexity of the food web. Redundancy measures the presence of alternate energy pathways that can buffer the system against disturbances. Flow diversity reflects the distribution and diversity of energy flow, higher values imply more complexity and stability. Relative exports (E/C), which represent the energy exiting the system, were also assessed (Ulanowicz, 2004; Heymans and Tomczak, 2016). Increasing relative exports may signal reduced energy retention within the system, often associated with stress or degradation.
In this study, ecosystem maturity was interpreted following classical ecosystem theory, particularly the framework proposed by Odum (1969) and later applied in network analysis by Christensen (1995b). Maturity refers to the degree of development of an ecosystem, generally characterised by increased biomass retention, efficient energy use, and complex internal cycling. Several ecological indicators were used to infer ecosystem maturity, including the total primary production to total respiration ratio, which distinguishes between developing (>1) and mature (⁓1 or <1) systems. Additional proxies included total biomass relative to total system throughput, Finn’s cycling index, and Finn’s mean path length, which together reflect the level of internal recycling and structural complexity. Furthermore, information indices such as ascendency, overhead, and redundancy were also used to assess the maturity and resilience balance of the system, with high ascendency and low redundancy typically associated with less mature or stressed ecosystems. These indicators collectively enabled a quantitative assessment of ecosystem maturity and its change over time.
Fishery-related indicators were used to assess fishing intensity and impact. Total catch, gross efficiency (catch/net primary production), and the mean trophic level of the catch were used to evaluate fishing performance and the effects of “fishing down the food web” (Christensen, 2000; Pauly et al., 1998). Exploitation rates (E = F/Z) and cumulative exploitation rate were calculated to measure fishing intensity. Primary production required for catches was calculated, normalized as a percentage of total primary production, and used to assess the fisheries’ ecosystem footprint (Christensen and Pauly, 1993; Pauly and Christensen, 1995). In addition, the loss in production index was used to quantify the reduction in secondary production caused by fishing, providing insights into its ecological effects on energy transfer within the ecosystem. A higher loss in production index indicates greater ecological impact associated with increased fishing pressure (Christensen et al., 2005). The probability of sustainable fishing reflects whether fishing activities are likely to maintain ecosystem functionality without exceeding sustainability limits. The probability of sustainable fishing decreases as fishing pressure increases, reflecting a lower likelihood of sustainability (Libralato et al., 2008).
Mixed trophic interactions within the food web were investigated using mixed trophic impact analysis, a method based on the information theory. Mixed trophic impact analysis quantifies the relative direct and indirect impacts of any functional group, including fisheries, on another group by simulating a hypothetical biomass increase while assuming that the overall trophic structure of the system remains unchanged (Ulanowicz and Puccia, 1990). Additionally, the cumulative impact derived from mixed trophic impact analysis represents the overall influence of a group throughout the food web. Together with keystoneness (Power et al., 1996), this identifies functional groups that are particularly important for maintaining the ecosystem structure and function. Keystone groups play a crucial structuring role in ecosystems, despite their relatively low biomass (Libralato et al., 2006).
3 Results
The ECS models representing the 1890s (19th century) and the 1990s (20th century) were described using 25 functional groups from TL = 1 (phytoplankton and detritus) to the top predator seals (TL = 4.7). The output parameters of the models by functional group are presented in Table 1, while the biomass and links of the functional groups are demonstrated via the trophic flow diagram in Figure 3. The detailed outputs from the Ecopath models are provided in Supplementary Table S4.
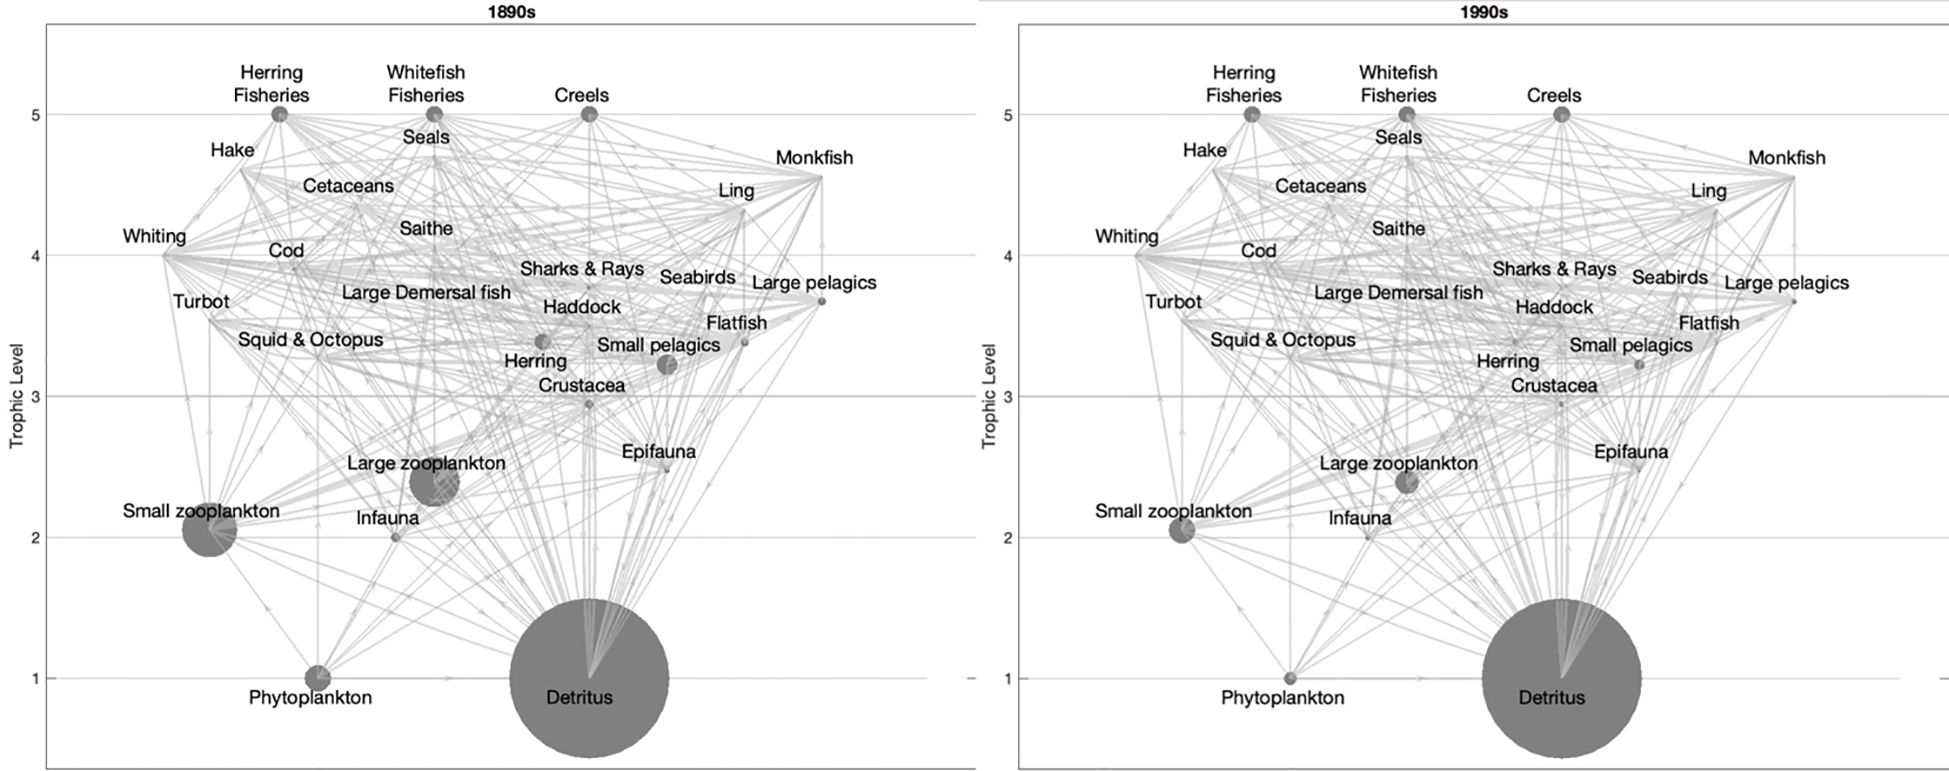
Figure 3. Flow diagram of the East Coast of Scotland in the 1890s (left) and 1990s (right). The size of the circles indicates the biomass of functional groups.
3.1 Ecosystem-level changes
The TST was calculated as 5860 t km-2 y-1 in the 1890s. TST comprised 40% consumption, 16% exports, 21% respiration flows, and 24% flows into detritus. In the 1990s, although the overall size of the ecosystem remained similar as being 5031 t km-2 y-1, the proportions of these flows shifted to 22% consumption, 31% exports, 11% respiration, and 36% flows into detritus. Total biomass, which was 127 t km-2 in the 1890s, decreased by approximately 53% over a century, and the total biomass (60 t km-2) relative to TST also declined by 45%. In contrast, the net system production (933 t km-2 y-1), total primary production/total respiration (1.8), and total primary production/total biomass (16.9) increased by approximately 68%, 111%, and 112%, respectively. The Schrödinger ratio (respiration/biomass) remained nearly unchanged, with values of 9.5 in the 1890s and 9.6 in the 1990s, indicating stable metabolic intensity relative to biomass. The mean trophic level of the community decreased from 1.89 in the 1890s to 1.53 in the 1990s, indicating a shift toward lower trophic levels. When excluding primary producers and detritus (TL = 1), it showed a slight decrease from 2.69 to 2.63. In contrast, the average trophic level of higher consumers (>TL2) remained unchanged at 3.49. The system omnivory index and Shannon diversity index showed slight decreases, from 0.23 and 2.25 in the 1890s to 0.21 and 2.17 in the 1990s. The mean transfer efficiency of the system was higher in the 1990s (19.0%, Table 2) than in the 1890s (17.9%, Table 2).
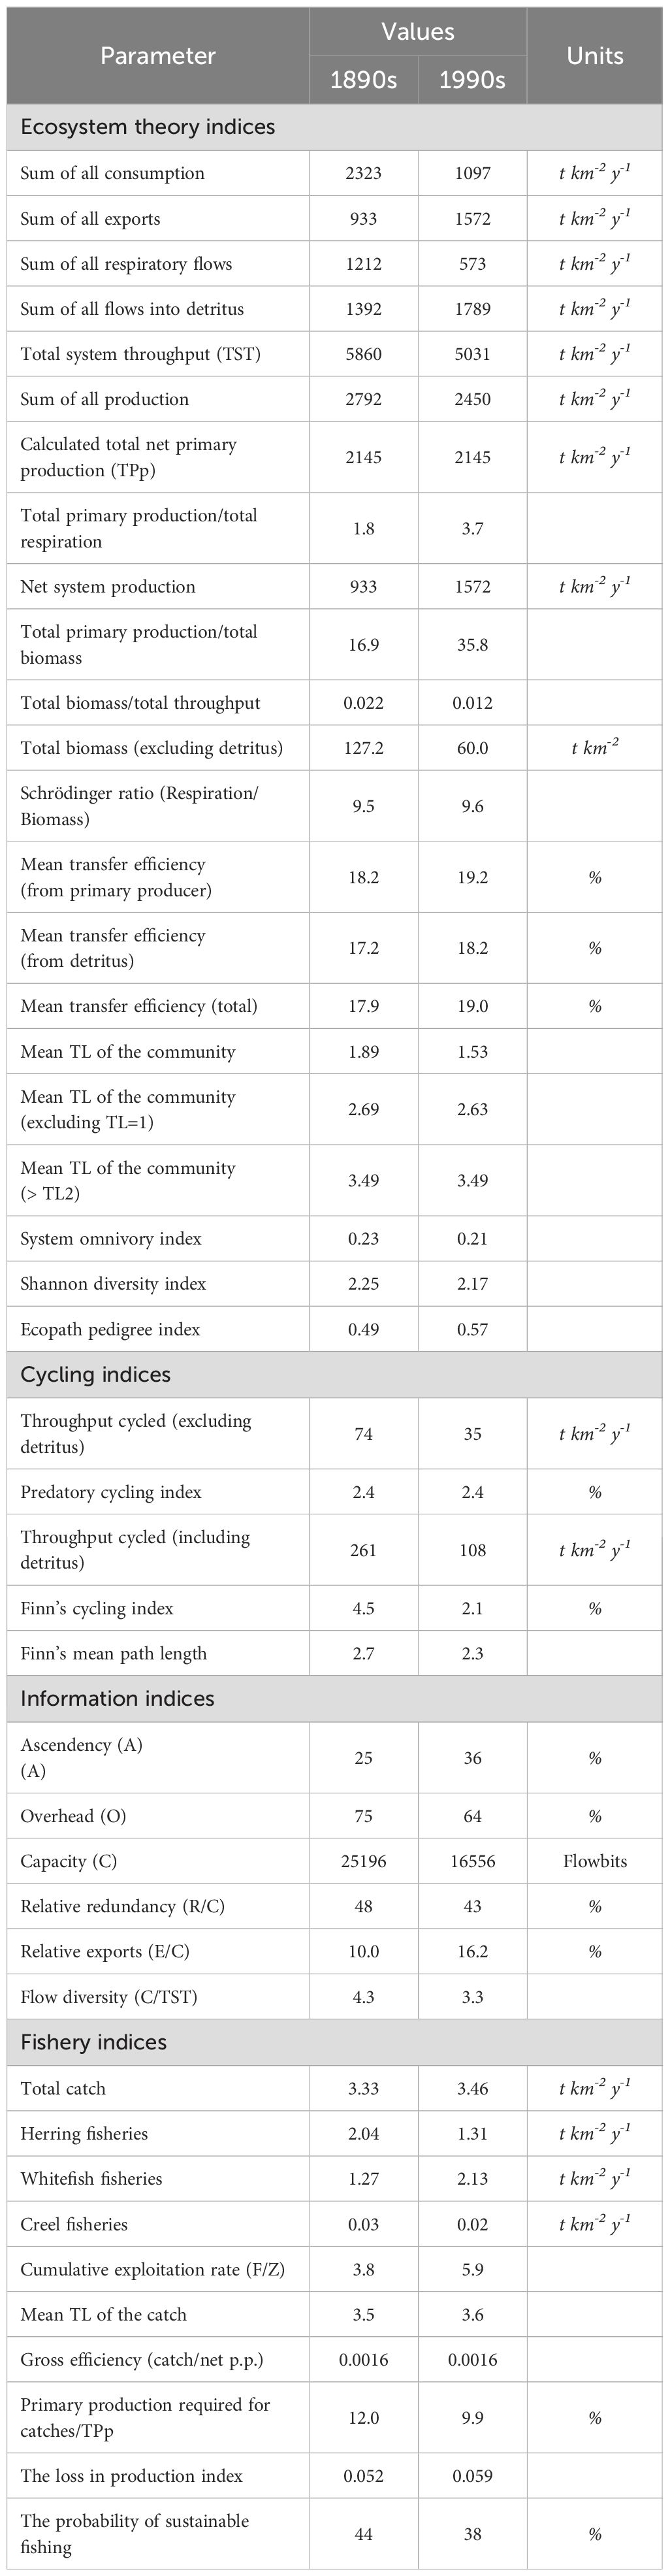
Table 2. Ecosystem and fishery indicators for the East Coast of Scotland models.
Energy flows through the integer trophic levels for both models were visualized using a Lindeman Spine diagram (Figure 4). The results showed that, excluding TL-I, TST (%), biomass, respiration, and flows to detritus were highest in TL-II in the 1890s, and these values decreased as the trophic levels increased. A similar pattern occurred in the 1990s, but energy flows at each trophic level were nearly halved, except for TST and biomass in TL-I, including grazing flows from primary producers to TL-II (Figure 4). Notably, the modelled primary productivity in the ecosystem remained unchanged during this period (Table 2). While the flow from primary producers to detritus increased significantly, the flow from detritus to TL-II (detrital food chain) decreased from the 1890s to the 1990s. Despite these changes, the dominance of the grazing food chain remained consistent at about 73% in both models. The highest total exports by fisheries occurred in TL-III, followed by TL-IV in both models. Exports were higher for all TLs in the 1990s model than in the 1890s model, in which only TL-III showed high exports.
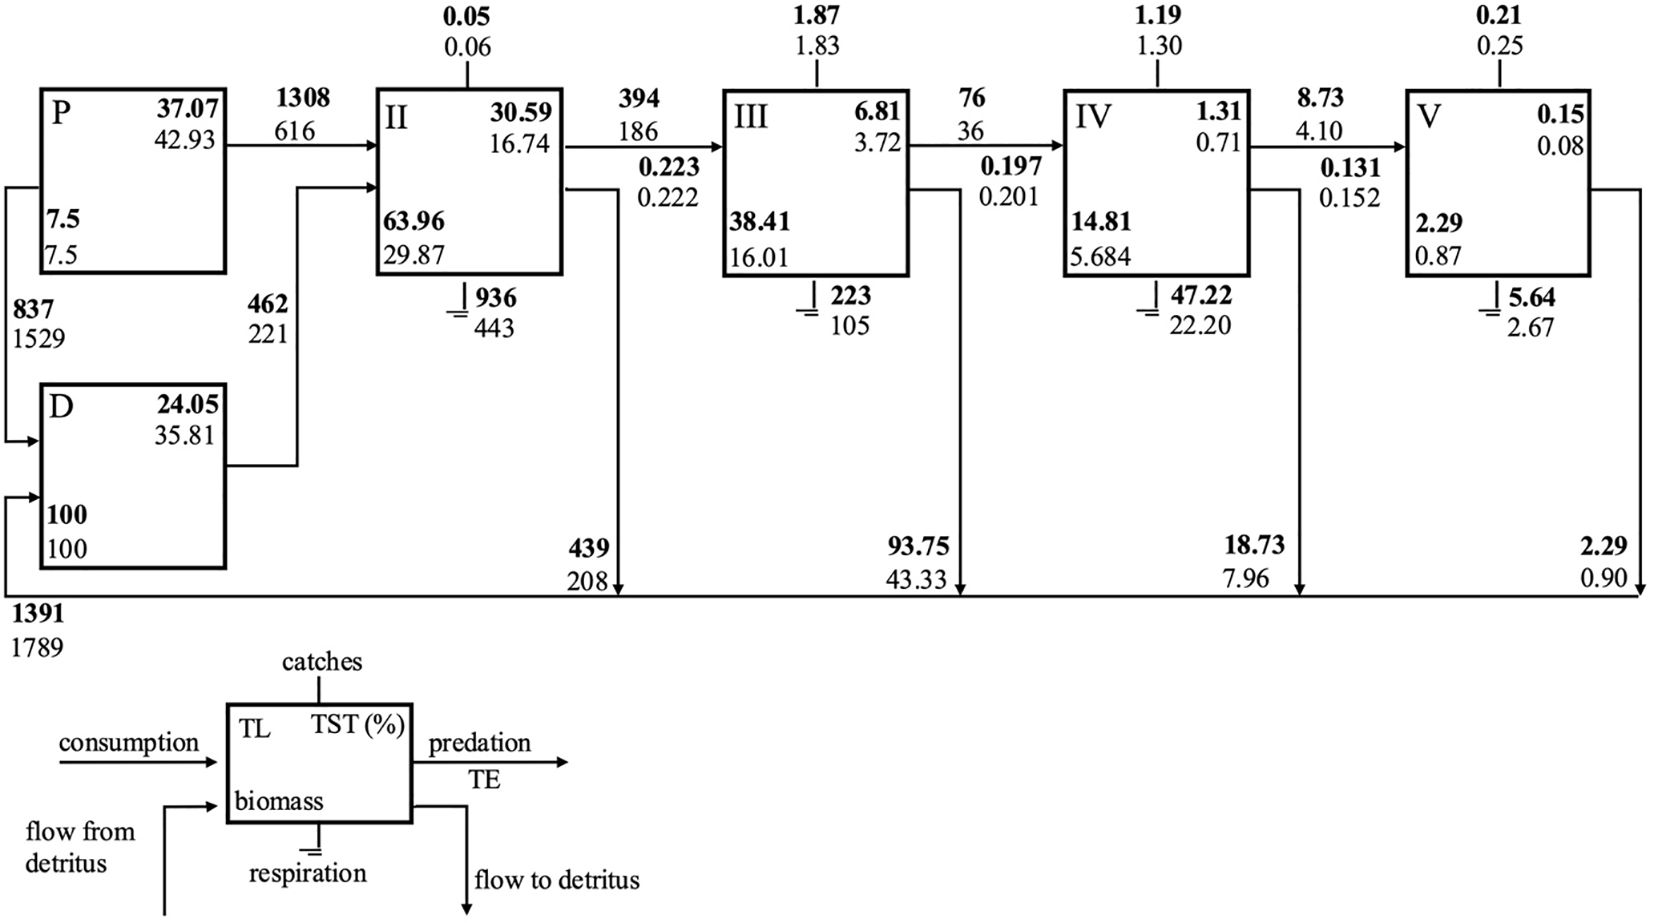
Figure 4. Lindeman spine showing trophic flows between integer trophic levels (TL). Primary producer (P); detritus (D); Total system throughput (TST); Transfer efficiency (TE); ECS_1890s (bold) and ECS_1990s model (normal).
Cycling indices indicated a significant decrease in material recycling within the ecosystem. Both throughput cycled (excluding and including detritus) and Finn’s cycling index decreased by more than 50%, along with a 14% decrease in Finn’s mean path length over the century. In contrast, the predatory cycling index remained constant at 2.4% in both models, indicating no change in predator-mediated recycling. From the perspective of information indices, changes in system organization and resilience were also observed. The relative ratio of the system’s ascendency increased from 25% to 36%, whereas its overhead (resilience) decreased from 75% to 64% (Table 2). In addition, other indicators of resilience and complexity showed similar patterns. Relative redundancy (R/C) decreased from 48% to 43%, and flow diversity (C/TST) dropped from 4.3 to 3.3, indicating a reduction in the diversity of energy pathways. In contrast, relative exports (E/C) increased from 10.0% to 16.2%, suggesting a higher proportion of energy exiting the system in the 1990s model.
3.2 Functional group-level changes
The modelled decrease in biomass from the 1890s to the 1990s was remarkable across most functional groups, with the exceptions of phytoplankton, detritus, and saithe, for which we assumed similar biomass levels in both models. The largest decreases were in turbot (98%), hake (91%), ling (83%), cod (81%), sharks & rays (76%), whiting (74%), flatfishes and herring (73%). Other groups experienced an approximately 50% reduction, with large demersal fish showing the smallest decrease of 34%. Conversely, there was a noteworthy increase in the modelled biomasses of monkfish and seals, by 180% and 950%, respectively (Table 1). During this period, the relative contributions of the functional group biomass to the total system biomass (excluding phytoplankton, small and large zooplankton, and detritus) also shifted. Flatfishes, turbot, cod, ling, whiting, herring, hake, and sharks & rays made up a larger proportion of the total biomass in the 1890s, while saithe, monkfish, large demersal fish, and seals were higher in the 1990s. Among these groups, seals showed the largest percentage increase, whereas turbot experienced the largest decrease (Table 1). Over the same period, the ratio of predation mortality to total mortality increased dramatically for turbot (778%), cod (287%), ling (58%), hake (73%), and herring (34%), whereas it decreased for haddock (30%), saithe (54%), monkfish (77%), and large pelagics (27%) (Supplementary Table S1).
Mixed trophic impact analysis revealed that direct and indirect trophic interactions changed significantly between the 1890s and the 1990s. While the impacts of the lower trophic level groups remained relatively stable, the influence of predators across the food web shifted dramatically. In particular, the impacts of cetaceans and cod decreased over the century, whereas the impacts of large pelagics, saithe, seals, and monkfish increased (Figure 5). As a result, cetaceans had the highest relative total impact and was the keystone species in the 1890s, a role it exchanged with large pelagics by the 1990s (Figure 6). Figure 6 also highlights the functional groups that experienced an increase or decrease in keystone status from the 1890s to the 1990s. The most significant change in the keystone status was observed for monkfish and seals in terms of percentage growth (Figure 6).
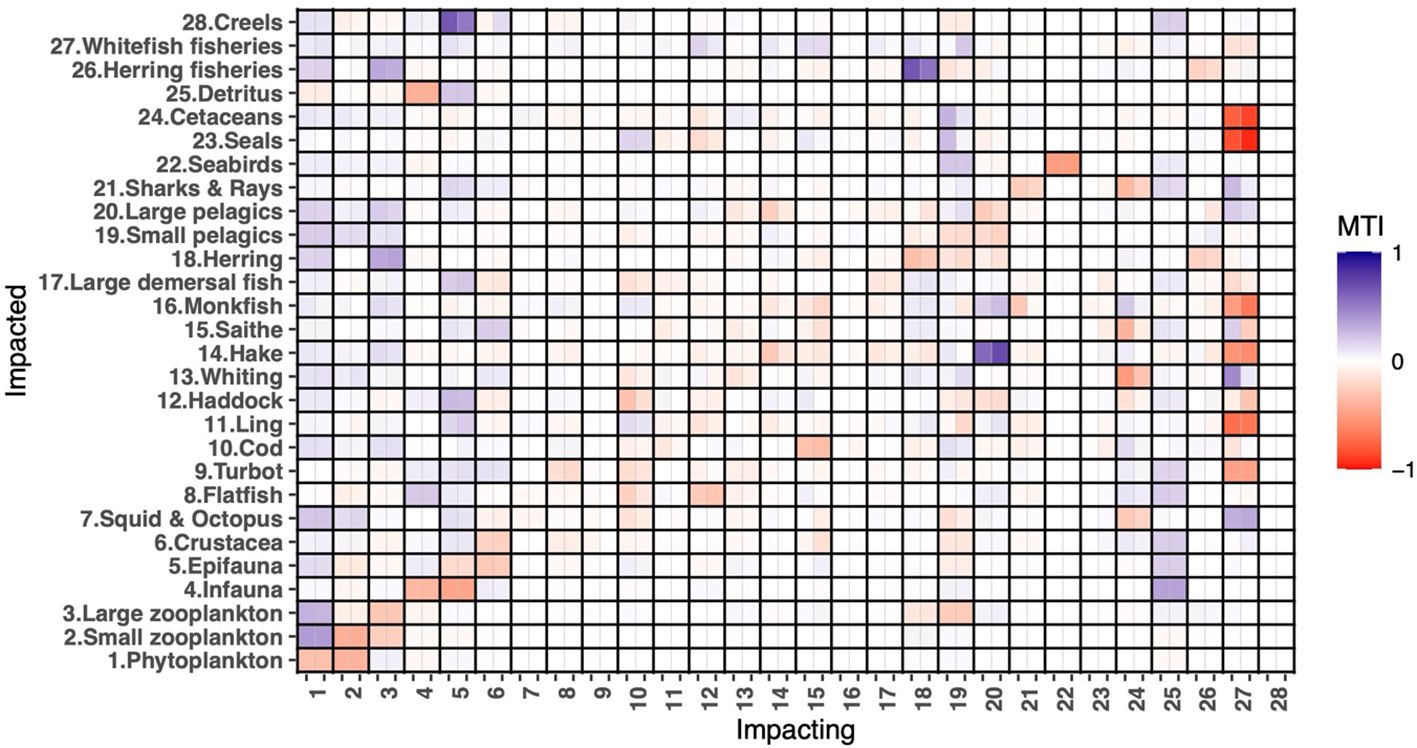
Figure 5. Mixed Trophic Impact analysis of the East Coast of Scotland models in the 1890s and the 1990s. The Y-axis represents the impacted groups (functional group numbers and names), whereas the X-axis represents the impacting groups (functional group numbers). Each cell on the X-axis contains two sub-cells, left for the 1890s model and right for the 1990s model, respectively.
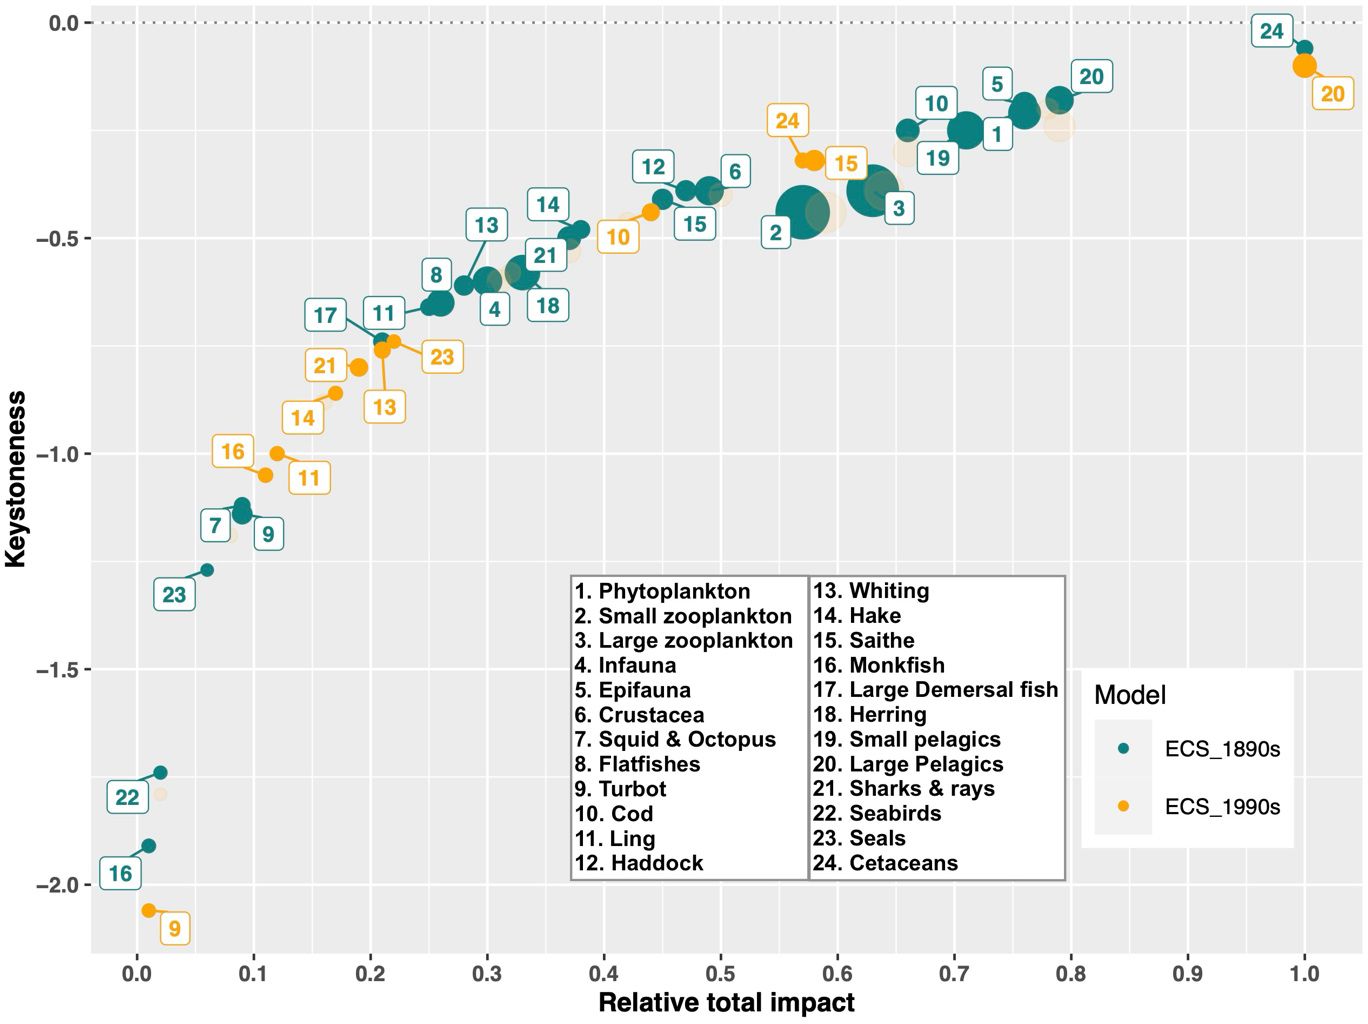
Figure 6. The keystoneness and relative total impact of the functional groups in the East Coast of Scotland models, representing the 1890s (ECS_1890s, green) and the 1990s (ECS_1990s, yellow). The size of the circles is proportional to the biomass of each group. While the ECS_1890s model includes all functional groups, ECS_1990s model only display those functional groups that showed significant changes.
3.3 Fishing impacts
Although the total catch did not show a significant change, remaining fairly stable from 3.33 t km-2 y-1 in the 1890s to 3.46 t km-2 y-1 in the 1990s, total fish removals by herring fisheries decreased from 2.04 t km-2 y-1 to 1.31 t km-2 y-1 and whitefish fisheries increased from 1.27 t km-2 y-1 to 2.13 t km-2 y-1 (Table 2). The exploitation rates (E=F/Z) of all groups increased over a century, except for large demersal fish, which showed a slight increase, and seals that decreased from 0.83 in the 1890s to 0.03 in the 1990s due to statutory protection (Table 1). Cumulative exploitation rate was higher in the 1990s at 5.87 and 3.79 in the 1890s. The probability of sustainable fishing decreased from 44% to 38% and the loss in production index increased from 0.052 to 0.059 from the 1890s to the 1990s. The mean trophic level of the catch was marginally higher in the 1990s despite using a similar diet matrix. These indicators are related to overfishing risk in an ecosystem and suggested a higher fishing pressure in 1990s than 1890s. However, primary production required for catches/total primary production (12% in the 1890s and 10% in the 1990s) and gross efficiency (0.0016 for both models) indicated either the same or reduced fishing pressure on the ecosystem, which contradicts previous indicators and suggests that fishing pressure may have been lower in the 1990s (Table 2).
Mixed trophic impact analysis highlighted the increasing overall impact of herring (from 0.1 to 0.24), whitefish (from 1.76 to 1.87), and creel (from 0.001 to 0.002) fisheries across the food web over the century. The impact of whitefish fisheries was the highest in both models, showing an increased negative effect on several functional groups, either exacerbating negative impacts (on flatfish, haddock, hake, monkfish, seals, and cetaceans) or diminishing positive impacts (on whiting, large pelagics, and sharks & rays). Notably, the impact on saithe shifted from positive (0.18) in the 1890s to negative (-0.26) in the 1990s. Conversely, some functional groups experienced reduced negative impacts, particularly large demersal fish, whereas the impacts on crustacea, cod, and herring shifted from negative to positive over the century (Figure 5).
4 Discussion
This is the first food web modelling approach to compare two models, with one including historical information, to explore how ecosystems changed over time in the North Sea, from the 19th century (1890s) to the 20th century (1990s), under changing fishing pressure, and considering the enormous developments in fishing technology during this period. This study suggests that ecosystem structure and function had already significantly changed by the 1990s, the point when more recent EwE models began to be used as a part of ecosystem-based fisheries management efforts. These changes were due to the direct and indirect impacts of fisheries on the food web, resulting in the degradation of trophic interactions and ultimately reducing the ecosystem’s maturity and resilience. Management based on understanding of altered food webs may institutionalise shifted environmental baselines, leading to decisions that prevent system recovery from past overfishing. In this context, historical reconstructions can provide more ecologically meaningful reference conditions to inform long-term management goals. This aligns with recent ICES guidance (ICES, 2025), which stresses the importance of making food web indicators, models, and data more operational for decision-making, while acknowledging key challenges such as selecting appropriate baselines, managing uncertainty, and communicating trade-offs.
4.1 Degradation of ecosystem health
Ecosystem indices indicate higher levels of maturity, resilience, and stability in the 1890s than in the 1990s. Over the century, the ecosystem’s total biomass and energy flows decreased, signalling a contraction in ecosystem size. Typically, as ecosystems become less mature, the amount of biomass sustained per unit of energy declines (total biomass/TST). The total system biomass is closely associated with the system’s exergy, which refers to a measure of the free energy available in an ecosystem and correlates with the ecosystem’s maturity (Christensen, 1995b). Although the TST in the food web decreased, significant declines were observed, specifically in total consumption and respiration flows, in contrast to the sum of exports, which increased over time. This reduction in total consumption and respiration may suggest decreased biological activity and energy cycling within the system, traits often associated with a less mature or resilient ecosystem (Odum, 1969). The increase in total exports (fishing and detritus exports) suggests that by the 1990s more energy exits the system rather than being retained and recycled, highlighting reduced stability and efficiency. Additionally, considerable declines in cycling indices, including throughput cycled, Finn’s cycling index, and Finn’s mean path length, support the idea that the ecosystem has lost its complexity and efficiency in nutrient and energy recycling (Finn, 1976). In the 1990s, relative ascendency and exports increased, whereas relative overhead and flow diversity decreased, which may indicate heightened ecosystem fragility against external stressors (Ulanowicz, 1980, 1986). Moreover, energy transfers from detritus to detrital compartments, which are crucial for nutrient regeneration (Ulanowicz, 1980), decreased by more than half. This reduction may further signify a decline in the maturity of the ecosystem (sensu Odum (1969). We argue that shifts in trophic interactions initiated an ecosystem-level change that ultimately resulted in a century-long degradation of the ecosystem health.
4.2 Shifts in trophic interactions
Network analyses may reveal a shift in trophic interactions in the East Coast of Scotland’s food web from the 1890s to the 1990s. Biomass changes across various ecosystem compartments influenced both direct and broader indirect interactions within the food web, as demonstrated by mixed trophic impact analysis. This shift also altered the roles of species in maintaining the ecosystem structure and function, as illustrated in the keystone analysis. As biomass pools fluctuate, trophic interactions become disorganized, which can alter the food web dynamics (Ulanowicz, 1986).
The influence of several predator functional groups (cetaceans, cod, whiting, sharks & rays, hake, ling and turbot) on the food web diminished, leading to an increase in the impact of lower trophic groups. Additionally, other predators, including large pelagics, saithe, seals, and monkfish, moved in to fill the ecological niches vacated by the declining predator groups. In particular, the keystone role of cetaceans shifted to large pelagic species, primarily mackerel, Atlantic horse mackerel, and blue whiting, whereas the role of cod replaced by saithe in our model. This can be a sign of a shift in the ecosystem control mechanism from top-down to more bottom-up processes in the food web. Although there is limited evaluation of keystone species in contrast to good records for ecosystem modelling in the North Sea (Keramidas et al., 2023), recent models indicate that lower trophic level groups, such as planktivores and detritivores, have had a more substantial impact on the food web than higher trophic groups (Hill, 2022). In a healthy ecosystem, marine mammals or top predators are expected to act as keystone species due to their predation impact and top-down control within the food web (Heymans et al., 2012). The concept of keystoneness highlights the importance of conserving these groups to maintain ecosystem functioning (Libralato et al., 2006). Thus, we suggest that the importance of keystone species identified by historical models should not be underestimated.
Regime shifts in the North Sea ecosystem have been well-documented, particularly a shift occurring just before the 1990s and reaching a new stage after the 2000s (Sguotti et al., 2022). The controlling mechanism on the food web was top-down during the 1980s and consequently shifted to bottom-up after the 1990s due to fishing and climate stressors (Sguotti et al., 2022). This finding strongly supported our ecosystem assessment. The shift, specifically in plankton and linked to climate stressors (Beaugrand, 2004; Alheit et al., 2005), contributed to the depletion of cod and wider gadoid stocks acting in synergy with fishing pressure (Beaugrand et al., 2003; Lynam et al., 2017; Sguotti et al., 2022), while also driving an increase in the horse mackerel assemblage (Reid et al., 2001). After the 2000s, the ecosystem was dominated by the emergence of new demersal species particularly saithe and plaice (Sguotti et al., 2022). We showed that the cascading role of cod shifted to saithe by 1990 at the latest, much earlier than predicted by the regime shift analyses based on statistical approaches. Detecting a regime shift can take many years, as is the case for the North Sea, where the shift was only identified years after it occurred (Wouters et al., 2015; DeYoung et al., 2008). Hence, historical models can be valuable for understanding regime shifts by providing a baseline for comparison with the current state, and they may also aid efforts to identify early warning signals of regime shifts.
The biomass of seals was significantly higher in the 1990s model than in the 1890s model, while the opposite was true for fishing mortality. Seal populations have been increasing since the 1960s due to conservation efforts in the North Sea (Summers, 1978; Russell et al., 2019; Thomas et al., 2019). Consequently, predation mortality by seals on prey species, such as cod, naturally increased from the 1890s to the 1990s. However, the model’s mixed trophic impact analysis suggested that although seals prey on cod and other gadoids, their impact was limited compared with that of fishing. Thus, our findings supported the view that fishing pressure, rather than seal predation, was the primary driver of gadoid stock declines (Alexander et al., 2015), further emphasizing the need to prioritize sustainable fishing practices, considering climatic drivers over population control of seals (Serpetti et al., 2017). This contrasts with studies that attribute gadoid decline to increased seal predation, such as in Newfoundland (Lilley et al., 2008) and the Gulf of St. Lawrence (Morissette et al., 2009).
4.3 Fishing impacts
In essence, we conceptualize fishing as the ‘first domino’ in the ecosystem, triggering cascading changes in trophic interactions that reshape the ecosystem’s structure and functions over a century until the 1990s. Ecopath models revealed that ecosystem indices, including cumulative exploitation rate, the loss in production index, and the probability of sustainable fishing, and the exploitation rates of all fished functional groups, except for epifauna, seals, and large demersal fish, indicated overfishing in the 1990s compared to the 1890s (Worm et al., 2009; Worm and Branch, 2012). Fisheries directly influence species by targeting them, and indirectly by altering their trophic interactions and habitats. In this instance, mixed trophic impact analysis matrix highlighted the prominent role of trawl fisheries in both the 1890s and the 1990s, indicating its widespread impact throughout the food web, likely also promulgated through its destructive influence on seabed habitat structure and composition. However, the nature of this impact shifted considerably in the 1990s. In contrast, pelagic and creel fisheries exhibited relatively minimal impacts in both periods, suggesting that their influence on the ecosystem was limited compared to the extensive and evolving role of trawl fisheries in the North Sea.
Mixed trophic impact analysis highlighted how trawl fisheries mediated the trophic interactions between cod and saithe. In the 1890s, whitefish fisheries negatively impacted cod while benefiting saithe; however, this pattern was reversed in the 1990s. Trawling directly affected both species by targeting them, but it also indirectly influenced their prey-predator relationships and competition for food. Specifically, in the 1890s, trawling positively impacted saithe by reducing competition. In contrast, in the 1990s, it benefited cod by both reducing predation and alleviating competition.
Trawl fishing commenced in the North Sea prior to the late 19th century, but fishing power in demersal trawl fisheries increased substantially from the 1880s to the 1990s due to technological advancements in fishing vessels, transitioning from sail-powered to steam and then motorized trawlers, and from beam to otter trawling (Thurstan et al., 2010). This progression reflects the industrialization of the North Sea fisheries, or in other words, a significant upward shift in fishing power. Our 1890s model represents a period dominated by sail-powered vessels, whereas the 1990s model corresponds to the motor-powered era. The early 1880s represented a new era in the industrial transition in fisheries, with steam power being introduced (Jones et al., 2016). Thereafter, landings per unit of trawl power decreased by an estimated 94% from the 1890s to the 2000s, suggesting a dramatic decline in demersal fish (Thurstan et al., 2010). Nonetheless, ecosystems may have been subject to intensive fishing pressure and marine mammal hunting before this era. Traditional fishing effort in the 1800s on whitefish (mostly cod + ling) stocks increased, and the stocks declined in some parts of the Britain’s coastal waters by the 1850s (Jones et al., 2016) and by 1890s (Thurstan et al., 2014). Seals were historically exploited across Scotland. While the scale of removals is unknown, legislation to protect grey seals (the Grey Sea Protection Act) first came into force in 1914 (SCOS, 2019). Moreover, cod and herring stocks had already been heavily exploited for a long time in the Northwest Atlantic, particularly with the dominance of herring fisheries by 1520 and cod fisheries between 1540 and 1790, which parallels European demographic growth (Holm et al., 2022). Therefore, ecosystems were not pristine in the 1890s (Pinnegar and Engelhard, 2008). However, the question remains whether ecosystem robustness can be maintained under such intensive traditional fishing pressures. At the very least, we suggest that the ecosystem state could not be maintained during the industrial transition to engine-powered vessels. Future historical modelling efforts might uncover earlier ecosystem states during cultural transitions before the industrial revolution.
4.4 Model assumptions and limitations
The input data pedigree provides insight into model quality and falls within an acceptable range compared to the North Sea (Keramidas et al., 2023) and global standards (Morissette, 2007) for both the 1890s and the 1990s Ecopath models. However, the pedigree of the 1890s model was lower than that of the 1990s model, primarily because of the methodological approach, which involved feeding input parameters from the more recent the 1990s model into the historic the 1890s model. The high pedigree of diet data may reduce uncertainty in both models, thanks to the ‘Year of the Stomach’, a major effort in 1981 by an ICES-coordinated project to collect and analyse fish stomach content in the North Sea (Christensen, 1995a). A low pedigree was assigned to the biomass data, particularly for the 1890s model, due to the varying origins of the data. These ranged from the lowest-confidence sources, such as Ecopath estimations or other models, to the highest-confidence data from localized sampling, with the former being weighted more heavily in the 1890s.
Although data-poor areas pose a well-recognized challenge in ecological modelling, this study underscores the equally significant issue of data-poor periods, where historical data availability and quality are limited. To address this, we applied a comprehensive methodological approach that combines the collection of the best available data, supplementing it with reasonable ecological ratios derived from a data-rich more recent model, and finally balancing models having the same topology simultaneously to produce comparable models with low-uncertainty. Even though there have been examples of comparing ecosystem models with non-identical topologies (Keramidas et al., 2023; Corrales et al., 2015), ecosystem indices that are heavily dependent on a model’s topology should not be compared across systems (Heymans et al., 2014, 2016). The optimal approach is to compare identical topologies, as in this study.
Our models differ from the existing North Sea models in terms of the number of functional groups used to describe the food web. While existing models typically consisted of more than 40 (ranging from 29 to 68) functional groups (Keramidas et al., 2023), including multi-stanza groups for species such as cod, whiting, and haddock, our models incorporate only 25 functional groups and did not include any stanza group to reduce uncertainty in the historical model. The extent of the historical landing data was the primary factor determining the resolution of the functional group. Additionally, this model focused on three main fishing fleets: pelagic (herring), demersal (whitefish), and creel fisheries. In contrast, other North Sea models often included more detailed fleet descriptions, such as trawls (beam, otter, and Nephrops), pelagic fisheries (trawl and seine), dredge, nets (gill and trammel), and creels. Simplifying the fleet structure was necessary to maintain consistency when considering technologically evolved vessels from the 1890s to the 1990s. This simplification was primarily due to the lack of species- and fleet-specific landing data for the 1890s. Although species-specific landing data and fleet-specific total landings are available separately, their integration into a detailed fleet structure was not feasible for that period. It is important to note that this simplification did not affect our evaluation of fisheries’ ecosystem impacts. Fishing removals would remain consistent, even if a more detailed fleet classification could have been performed. However, the lack of a finer fleet description limited the ability to analyse the interactions between functional groups and specific fishing methods. Another major limitation was the absence of discard data for the 1890s. To address this, we relied solely on the landing data for both models from the same data source. Nonetheless, it is well documented that discarding is an important factor that affects food webs and ecosystem dynamics (Hall et al., 2000; Coll et al., 2008; Sarda et al., 2015; Saygu et al., 2020).
Although discard data were omitted equally from both models, it is likely that discard rates were considerably higher in the 1890s due to less selective fishing practices at the time. Therefore, the exclusion of discards may have disproportionately underestimated total catch in the historical model, particularly for catch-based indicators. This may help explain why indicators such as Primary Production Required and Gross Efficiency appeared lower in the 1890s, despite lower overall exploitation. Such limitations should be considered when interpreting historical model outputs. In addition, this discrepancy may reflect the dependence of these indicators on phytoplankton biomass which was similar in both models based on in-situ measurements, including chlorophyll concentrations (Boyce et al., 2014) and the phytoplankton colour index (Helaouët, 2024), both of which are reliable indicators of phytoplankton biomass (Raitsos et al., 2005), as well as total phytoplankton abundance (Helaouët, 2024), supported to some extent by model-based estimations. In addition, due to data limitations, we allowed Ecopath to estimate the biomasses of small and large zooplankton for the 1890s model. Zooplankton biomass was halved from the 1890s to the 1990s, contributing to the loss of complexity in the food web. This estimation aligned with in-situ survey and model-based evaluations, which indicated a significant historical decline in zooplankton biomass, particularly between the 1950s and 1970s, driven by climate change and ecosystem dynamics (Pitois and Fox, 2006; Scherer et al., 2024).
This study highlights the importance of uncovering historical fisheries records to generate more comprehensive ecological and fishery perspectives. We found the ‘Fishery Board for Scotland, Sea Fisheries-Statistical Tables’ (Fishery Board for Scotland, 1890–1895; 1991-1995) to be a useful data source for the North Sea, particularly for its northern part. Indeed, these landing records are extendable toward the beginning of the 1800s, at least for herring and cod (Jones et al., 2016). These data can be deemed sufficient to set up Ecopath models representing a more pristine ecosystem and comparable again as the minimum Ecopath input data requirements are met. Furthermore, such data could support the development of dynamic temporal ecosystem models, enabling a better understanding of historical changes in ecosystem dynamics under multiple stressors such as fisheries and climate change.
5 Conclusion
Our study reveals century-long changes in marine ecosystem structure and function by applying a comparative ecosystem modelling approach. This approach uniquely juxtaposed historical (1890s) and more recent (1990s) models, assigning the less impacted historical model as a baseline or threshold for indicator-based assessments. We demonstrated significant degradation in ecosystem maturity, resilience, and stability over a century of intensive exploitation. To be consistent with data derived biomass estimates, the models must experience both an increase in fishing pressure over the interval, but also a decrease in zooplankton biomass. Both of these results are consistent with literature and highlight that both environmental change and industrialisation of fishing have played important roles in the depletion of fish biomass over the past century.
We show that using historical data it is possible to generate improved ecosystem baselines. Such baselines are critical for effective fisheries management. While the North Sea has well archived historical catch data, this is not unique and emphasises the importance of digitising and utilising such data for fisheries management globally.
Data availability statement
The original contributions presented in the study are included in the article/Supplementary Material. Further inquiries can be directed to the corresponding author.
Author contributions
İS: Conceptualization, Data curation, Formal Analysis, Methodology, Visualization, Writing – original draft, Writing – review & editing. RT: Conceptualization, Data curation, Funding acquisition, Writing – review & editing. CR: Conceptualization, Data curation, Funding acquisition, Writing – review & editing. ZH: Conceptualization, Data curation, Writing – review & editing. EA: Conceptualization, Methodology, Writing – review & editing. PH: Conceptualization, Data curation, Funding acquisition, Supervision, Writing – review & editing, Methodology.
Funding
The author(s) declare financial support was received for the research and/or publication of this article. This work was funded by the European Research Council (ERC) under the European Union’s Horizon 2020 research and innovation programme (grant agreement No 856488 -ERC Synergy project “SEACHANGE: Quantifying the impact of major cultural transitions on marine ecosystem functioning and biodiversity”) and a contribution to the project supported by The Scientific and Technological Research Council of Türkiye (TUBITAK) under the TUBITAK 2219 Programme (2023-1) and hosted by the University of Exeter.
Acknowledgments
For the purpose of open access, the author has applied a Creative Commons Attribution (CC BY) licence to any Author Accepted Manuscript version arising from this submission. Authors would like to address a special thanks to Clare Evelyn Hill and Jacob Bentley for their advice.
Conflict of interest
The authors declare that the research was conducted in the absence of any commercial or financial relationships that could be construed as a potential conflict of interest.
Generative AI statement
The author(s) declare that no Generative AI was used in the creation of this manuscript.
Any alternative text (alt text) provided alongside figures in this article has been generated by Frontiers with the support of artificial intelligence and reasonable efforts have been made to ensure accuracy, including review by the authors wherever possible. If you identify any issues, please contact us.
Publisher’s note
All claims expressed in this article are solely those of the authors and do not necessarily represent those of their affiliated organizations, or those of the publisher, the editors and the reviewers. Any product that may be evaluated in this article, or claim that may be made by its manufacturer, is not guaranteed or endorsed by the publisher.
Supplementary material
The Supplementary Material for this article can be found online at: https://www.frontiersin.org/articles/10.3389/fmars.2025.1646031/full#supplementary-material
References
Ainsworth C. H., Heymans J. J., Pitcher T. J., and Vasconcellos M. (2002). Ecosystem models of Northern British Columbia for the time periods 2000, 1950, 1900 and 1750. Fisheries Centre Res. Rep. 10, 1–40. Available online at: http://hdl.handle.net/2429/47126 (Accessed May 30, 2025).
Ainsworth C. H., Pitcher T. J., Heymans J. J., and Vasconcellos M. (2008). Reconstructing historical marine ecosystems using food web models: Northern British Columbia from Pre-European contact to present. Ecol. Model. 216, 354–368. doi: 10.1016/j.ecolmodel.2008.05.005
Alexander K. A., Heymans J. J., Magill S., Tomczak M. T., Holmes S. J., and Wilding T. A. (2015). Investigating the recent decline in gadoid stocks in the west of Scotland shelf ecosystem using a foodweb model. ICES J. Mar. Sci. 72, 436–449. doi: 10.1093/icesjms/fsu149
Alheit J., Möllmann C., Dutz J., Kornilovs G., Loewe P., Mohrholz V., et al. (2005). Synchronous ecological regime shifts in the central Baltic and the North Sea in the late 1980s. ICES J. Mar. Sci. 62, 1205–1215. doi: 10.1016/j.icesjms.2005.04.024
Allen K. R. (1971). Relation between production and biomass. J. Fisheries Res. Board Canada 28, 1573–1581. doi: 10.1139/f71-236
Barrett J. H. and Orton D. C. (Eds.) (2016). Cod and Herring: The Archaeology and History of Medieval Sea Fishing (Oxford: Oxbow Books). doi: 10.2307/j.ctvh1dw0d
Beattie A., Wallace S., and Haggan N. (1999). “Report of the BTF workshop on reconstruction of the hecate strait ecosystem,” in Back to the Future: Reconstructing the Hecate Strait Ecosystem, vol. 7 . Eds. Haggan N. and Beattie A. (University of British Columbia, Vancouver,Canada: Fisheries Centre Research Reports), 1–12.
Beaugrand G. (2004). The North Sea regime shift: evidence, causes, mechanisms and consequences. Prog. Oceanography 60, 245–262. doi: 10.1016/j.pocean.2004.02.018
Beaugrand G., Brander K. M., Lindley A. J., and Souissi S. (2003). Plankton effect on cod recruitment in the North Sea. Nature 426, 661–664. doi: 10.1038/nature02164
Boyce D. G., Dowd M., Lewis M. R., and Worm B. (2014). Estimating global chlorophyll changes over the past century. Prog. Oceanography 122, 163–173. doi: 10.1016/j.pocean.2014.01.004
Brown J., Hill A. E., Fernand L., and Horsburgh K. J. (1999). Observations of a seasonal jet-like circulation at the central North Sea cold pool margin. Estuarine Coast. Shelf Sci. 48, 343–355. doi: 10.1006/ecss.1999.0426
Cerón-Carrasco R. (1998). Fishing: Evidence for seasonality and processing of fish for preservation in the Northern Isles of Scotland during the Iron Age and Norse times. Environ. Archaeology 3, 73–80. doi: 10.1179/env.1998.3.1.73
Cerón-Carrasco R. (2002). Of Fish and Men: aspects of the utilization of marine resources as recovered from selected Hebridean archaeological sites = De iasg agus dhaoine. PhD thesis, University of Edinburgh, Edinburgh, UK, 400 pp.
Christensen V. (1995a). A model of trophic interactions in the North Sea in 1981, the Year of the Stomach. Dana 11, 1–28.
Christensen V. (1995b). Ecosystem maturity – towards quantification. Ecol. Model. 77, 3–32. doi: 10.1016/0304-3800(93)E0073-C
Christensen V. (2000). Indicators for marine ecosystems affected by fisheries. Mar. Freshw. Res. 51, 447–450. doi: 10.1071/MF99085
Christensen V. and Pauly D. (1993). “Flow characteristics of aquatic ecosystems,” in Trophic models of aquatic ecosystems, vol. 26. , 38–352. ICLARM Conference Proceedings.
Christensen V. and Walters C. J. (2004). Ecopath with Ecosim: methods, capabilities and limitations. Ecol. Model. 172, 109–139. doi: 10.1016/j.ecolmodel.2003.09.003
Christensen V. and Walters C. J. (2024). Ecosystem Modelling with EwE (Vancouver, BC: The University of British Columbia). doi: 10.14288/24d7-ab68
Christensen V., Walters C. J., and Pauly D. (2005). Ecopath with Ecosim: a user’s guide Vol. 154 (Vancouver, Canada: Fisheries Centre, University of British Columbia), 31.
Clarke K. R. and Warwick R. M. (2001). “Change in marine communities,” in Approach to Statistical Analysis and Interpretation, 2nd edn (PRIMER-E, Plymouth).
Coll M., Libralato S., Tudela S., Palomera I., and Pranovi F. (2008). Ecosystem overfishing in the ocean. PloS One 3, e3881. doi: 10.1371/journal.pone.0003881
Corrales X., Coll M., Tecchio S., Bellido J. M., Fernández Á., and Palomera I. (2015). Ecosystem structure and fishing impacts in the northwestern Mediterranean Sea using a food web model within a comparative approach. J. Mar. Syst. 148, 183–199. doi: 10.1016/j.jmarsys.2015.03.006
Costanza R. and Mageau M. (1999). What is a healthy ecosystem? Aquat. Ecol. 31, 105–115. doi: 10.1023/A:1009930313242
Dalsgaard J., Wallace S., Salas S., and Preikshot D. (1998). “Mass–balance model reconstructions of the Strait of Georgia: the present, one hundred, and five hundred years ago,” in Back to the Future: Reconstructing the Strait of Georgia Ecosystem, vol. 6 . Eds. Pauly D., Pitcher T. J., and Preikshot D. (University of British Columbia, Vancouver,Canada: Fisheries Centre Research Reports), 45–48.
DeYoung B., Barange M., Beaugrand G., Harris R., Perry R. I., Scheffer M., et al. (2008). Regime shifts in marine ecosystems: detection, prediction and management. Trends Ecol. Evol. 23, 402–409. doi: 10.1016/j.tree.2008.03.008
Efford M. (2024). Archaeological investigations and ecological modelling into pre-contact, (1792 CE) Tsleil-Waututh stewardship of Burrard Inlet, BC, Canada. PhD thesis, Vancouver, Canada: University of British Columbia, 200 pp.
Finn J. T. (1976). Measures of ecosystem structure and function derived from analysis of flows. J. Theor. Biol. 56, 363–380. doi: 10.1016/S0022-5193(76)80080-X
Fishery Board for Scotland (1890–1895; 1991-1995a). “Annual reports of the Fishery Board for Scotland, being for the years 1890–1895 and 1991-1995,” in General reports (Parts I) (HMSO, Edinburgh).
Frelat R., Lindegren M., Denker T. S., Floeter J., Fock H. O., Sguotti C., et al. (2017). Community ecology in 3D: Tensor decomposition reveals spatio-temporal dynamics of large ecological communities. PloS One 12, e0188205. doi: 10.1371/journal.pone.0188205
Hall M. A., Alverson D. L., and Metuzals K. I. (2000). By-catch: problems and solutions. Mar. pollut. Bull. 41, 204–219. doi: 10.1016/S0025-326X(00)00111-9
Harris B. (2000). Scotland’s herring fisheries and the prosperity of the nation, c.1660–1760. Scottish Historical Rev. 79, 39–60. doi: 10.3366/shr.2000.79.1.39
Helaouët P. (2024). “CPR data ICES areas,” in The Archive for Marine Species and Habitats Data (DASSH) Plymouth, UK. doi: 10.17031/67408ba96a59c
Heymans J. J., Coll M., Libralato S., and Christensen V. (2012). “Ecopath theory, modeling, and application to coastal ecosystems,” in Treatise on Estuarine and Coastal Science, vol. 9 . Eds. Wolanski E. and McLusky D. S. London, UK: Elsevier, 93–113. Available online at: https://ricerca.ogs.it/handle/20.500.14083/3743 (Accessed May 30, 2025).
Heymans J. J., Coll M., Libralato S., Morissette L., and Christensen V. (2014). Global patterns in ecological indicators of marine food webs: a modelling approach. PloS One 9, e95845. doi: 10.1371/journal.pone.0095845
Heymans J. J., Coll M., Link J. S., Mackinson S., Steenbeek J., Walters C., et al. (2016). Best practice in Ecopath with Ecosim food-web models for ecosystem-based management. Ecol. Model. 331, 173–184. doi: 10.1016/j.ecolmodel.2015.12.007
Heymans J. J., Mackinson S., Sumaila U. R., Dyck A., and Little A. (2011). The impact of subsidies on the ecological sustainability and future profits from North Sea fisheries. PloS One 6, e20239. doi: 10.1371/journal.pone.0020239
Heymans J. J. and Tomczak M. T. (2016). Regime shifts in the Northern Benguela ecosystem: challenges for management. Ecol. Model. 331, 151–159. doi: 10.1016/j.ecolmodel.2015.10.027
Hill C. E. (2022). Addressing the impact of the EU CFP landing obligation on the northern North Sea ecosystem and Shetland fisheries in a changing climate Oban, UK: University of the Highlands and Islands.
Hill C. E., Bentley J. W., Serpetti N., Fox C., Angus C., and Heymans J. J. (2021). Modelling the trophic interaction, structure, and function of the northern North Sea food web (Oban, UK: Ecopath Technical Report, Scottish Association for Marine Science), 115. Report No. 299.
Holm P., Nicholls J., Hayes P. W., Ivinson J., and Allaire B. (2022). Accelerated extractions of North Atlantic cod and herring 1520–1790. Fish Fisheries 23, 54–72. doi: 10.1111/faf.12598
ICES (2013). Interim Report of the Working Group on Multispecies Assessment Methods (WGSAM): 21–25 October 2013 (Stockholm, Sweden: ICES).
ICES (2025). Workshop on the operational use of Food Web indicators and information (WKFoodWeb; outputs from 2024 meeting). ICES Sci. Rep. 7, 49, 59 pp. doi: 10.17895/ices.pub.29235818
Jones P., Cathcart A., and Speirs D. C. (2016). Early evidence of the impact of preindustrial fishing on fish stocks from the mid-west and southeast coastal fisheries of Scotland in the 19th century. ICES J. Mar. Sci. 73, 1404–1414. doi: 10.1093/icesjms/fsv189
Keramidas I., Dimarchopoulou D., Ofir E., Scotti M., Tsikliras A. C., and Gal G. (2023). Ecotrophic perspective in fisheries management: a review of Ecopath with Ecosim models in European marine ecosystems. Front. Mar. Sci. 10. doi: 10.3389/fmars.2023.1182921
ICES (1993). Atlas of North Sea fishes. Based on bottom-trawl survey data for the years 1985–1987. ICES Cooperative Research Report No. 194. pp.268. doi: 10.17895/ices.pub.4622
Libralato S., Christensen V., and Pauly D. (2006). A method for identifying keystone species in food web models. Ecol. Model. 195, 153–171. doi: 10.1016/j.ecolmodel.2005.11.029
Libralato S., Coll M., Tudela S., Palomera I., and Pranovi F. (2008). Novel index for quantification of ecosystem effects of fishing as removal of secondary production. Mar. Ecol. Prog. Ser. 355, 107–129. doi: 10.3354/meps07224
Lilley G. R., Wieland K., Rothschild B. J., Sundby S., Drinkwater K. F., Brander K., et al. (2008). “Decline and recovery of Atlantic Cod (Gadus morhua) stocks throughout the North Atlantic,” in Resiliency of Gadid Stocks to Fishing and Climate Change (Anchorage, Alaska, USA: Alaska Sea Grant College Programme).
Lindeman R. L. (1942). The trophic-dynamic aspect of ecology. Ecology 23, 399–417. doi: 10.2307/1930126
Link J. S. (2010). Adding rigor to ecological network models by evaluating a set of pre-balance diagnostics: a plea for PREBAL. Ecol. Model. 221, 1580–1591. doi: 10.1016/j.ecolmodel.2010.03.012
Lynam C. P., Llope M., Möllmann C., Helaouët P., Bayliss-Brown G. A., and Stenseth N. C. (2017). Interaction between top-down and bottom-up control in marine food webs. Proc. Natl. Acad. Sci. United States America 114, 1952–1957. doi: 10.1073/pnas.1621037114
Lynam C. P. and Mackinson S. (2015). How will fisheries management measures contribute towards the attainment of good environmental status for the North Sea ecosystem? Global Ecol. Conserv. 4, 160–175. doi: 10.1016/j.gecco.2015.06.005
Mackinson S. (2001). “Representing trophic interaction in the North Sea in the 1880s using the Ecopath mass-balance approach,” in Fisheries impacts on North Atlantic ecosystems: models and analyses, vol. 9 . Eds. Guénette S., Christensen V., and Pauly D. (University of British Columbia, Vancouver,Canada: Fisheries Centre Research Reports), 35–98.
Mackinson S. (2014). Combined analyses reveal environmentally driven changes in the North Sea ecosystem and raise questions regarding what makes an ecosystem model’s performance credible? Can. J. Fisheries Aquat. Sci. 71, 31–46. doi: 10.1139/cjfas-2013-0173
Mackinson S. and Daskalov G. (2007). “An ecosystem model of the North Sea to support an ecosystem approach to fisheries management: description and parameterisation,” in Science Series Technical Report, No. 142, Cefas, Lowestoft. 196.
Mackinson S., Deas B., Beveridge D., and Casey J. (2009). Mixed-fishery or ecosystem conundrum? Multispecies considerations inform thinking on long-term management of North Sea demersal stocks. Can. J. Fisheries Aquat. Sci. 66, 1107–1129. doi: 10.1139/F09-057
Mackinson S., Platts M., Garcia C., and Lynam C. (2018). Evaluating the fishery and ecological consequences of the proposed North Sea multi-annual plan. PloS One 13, e0190015. doi: 10.1371/journal.pone.0190015
McGregor A. M. (2014). Using Ecopath modeling to describe historical conditions for a large, boreal lake ecosystem prior to European settlement. North Am. J. Fisheries Manage. 34, 16–29. doi: 10.1080/02755947.2013.833559
Morell A., Shin Y. J., Barrier N., Travers-Trolet M., Halouani G., and Ernande B. (2023). Bioen-OSMOSE: A bioenergetic marine ecosystem model with physiological response to temperature and oxygen. Prog. Oceanography 216, 103064. doi: 10.1016/j.pocean.2023.103064
Morissette L. (2007). Complexity, cost, and quality of ecosystem models and their impact on resilience: a comparative analysis, with emphasis on marine mammals and the Gulf of St. Lawrence. PhD thesis, Vancouver, Canada: University of British Columbia, 260.
Morissette L., Castonguay M., Savenkoff C., Swain D. P., Chabot D., Bourdages H., et al. (2009). Contrasting changes between the northern and southern Gulf of St. Lawrence ecosystems associated with the collapse of groundfish stocks. Deep Sea Res. Part II: Topical Stud. Oceanography 56, 2117–2131. doi: 10.1016/j.dsr2.2008.11.023
Müller F. (1997). State-of-the-art in ecosystem theory. Ecol. Model. 100, 135–161. doi: 10.1016/S0304-3800(97)00156-7
Nuttall M. A., Jordaan A., Cerrato R. M., and Frisk M. G. (2011). Identifying 120 years of decline in ecosystem structure and maturity of Great South Bay, New York using the Ecopath modelling approach. Ecol. Model. 222, 3335–3345. doi: 10.1016/j.ecolmodel.2011.07.004
Odum E. P. (1969). The strategy of ecosystem development: An understanding of ecological succession provides a basis for resolving man’s conflict with nature. Science 164, 262–270. doi: 10.1126/science.164.3877.262
Otto L., Zimmerman J. T. F., Furnes G. K., Mork M., Saetre R., and Becker G. (1990). Review of the physical oceanography of the North Sea. Netherlands J. Sea Res. 26, 161–187. doi: 10.1016/0077-7579(90)90091-T
Palomares M. L. D. and Pauly D. (1998). Predicting food consumption of fish populations as functions of mortality, food type, morphometrics, temperature, and salinity. Mar. Freshw. Res. 49, 447–453. doi: 10.1071/MF98015
Pauly D. (1980). On the interrelationships between natural mortality, growth parameters, and mean environmental temperature in 175 fish stocks. ICES J. Mar. Sci. 39, 175–192. doi: 10.1093/icesjms/39.2.175
Pauly D. and Christensen V. (1995). Primary production required to sustain global fisheries. Nature 374, 255–257. doi: 10.1038/374255a0
Pauly D., Christensen V., Dalsgaard J., Froese R., and Torres J. F. (1998). Fishing down marine food webs. Science 279, 860–863. doi: 10.1126/science.279.5352.860
Piet G., Bentley J., Jongbloed R., Grundlehner A., Tamis J., and de Vries P. (2024). A cumulative impact assessment on the marine capacity to supply ecosystem services. Sci. Total Environ. 948, 174149. doi: 10.1016/j.scitotenv.2024.174149
Pinnegar J. K. and Engelhard G. H. (2008). The ‘shifting baseline’ phenomenon: a global perspective. Rev. Fish Biol. Fisheries 18, 1–16. doi: 10.1007/s11160-007-9058-6
Pint S., Stevens M., Musimwa R., Standaert W., De Troch M., van Oevelen D., et al. (2024). A food web model of the Southern Bight of the North Sea. Ocean Coast. Manage. 255, 107256. doi: 10.1016/j.ocecoaman.2024.107256
Pitcher T. J. (2005). Back-to-the-future: a fresh policy initiative for fisheries and a restoration ecology for ocean ecosystems. Philos. Trans. R. Soc. B: Biol. Sci. 360, 107–121. doi: 10.1098/rstb.2004.1575
Pitcher T. J., Haggan N., Preikshot D., and Pauly D. (1999). “Back to the Future: A method employing ecosystem modelling to maximise the sustainable benefits from fisheries,” in Ecosystem Approaches to Fisheries Management, vol. 738. (Vancouver, Canada: University of British Columbia), 447–466.
Pitcher T. J., Heymans J. J., and Vasconcellos M. (Eds.) (2002). “Ecosystem models of Newfoundland for the time periods 1995, 1985, 1900, and 1450,” in Fisheries Centre Research Reports, vol. 10 (Vancouver,Canada: University of British Columbia).
Pitois S. G. and Fox C. J. (2006). Long-term changes in zooplankton biomass concentration and mean size over the Northwest European shelf inferred from Continuous Plankton Recorder data. ICES J. Mar. Sci. 63, 785–798. doi: 10.1016/j.icesjms.2006.03.009
Power M. E., Tilman D., Estes J. A., Menge B. A., Bond W. J., Mills L. S., et al. (1996). Challenges in the quest for keystones: Identifying keystone species is difficult but essential to understanding how loss of species will affect ecosystems. BioScience 46, 609–620. doi: 10.2307/1312990
Püts M., Kempf A., Möllmann C., and Taylor M. (2023). Trade-offs between fisheries, offshore wind farms, and marine protected areas in the southern North Sea—winners, losers, and effective spatial management. Mar. Policy 152, 105574. doi: 10.1016/j.marpol.2023.105574
Püts M., Taylor M., Núñez-Riboni I., Steenbeek J., Stäbler M., Möllmann C., et al. (2020). Insights on integrating habitat preferences in process-oriented ecological models—a case study of the southern North Sea. Ecol. Model. 431, 109189. doi: 10.1016/j.ecolmodel.2020.109189
Raitsos D. E., Reid P. C., Lavender S. J., Edwards M., and Richardson A. J. (2005). Extending the SeaWiFS chlorophyll data set back 50 years in the northeast Atlantic. Geophysical Res. Lett. 32, L06603. doi: 10.1029/2005GL022484
Reid P. C., de Fatima Borges M., and Svendsen E. (2001). A regime shift in the North Sea circa 1988 linked to changes in the North Sea horse mackerel fishery. Fisheries Res. 50, 163–171. doi: 10.1016/S0165-7836(00)00249-6
Reid P. C., Lancelot C., Gieskes W. W. C., Hagmeier E., and Weichart G. (1990). Phytoplankton of the North Sea and its dynamics: a review. Netherlands J. Sea Res. 26, 295–331. doi: 10.1016/0077-7579(90)90094-W
Romagnoni G., Mackinson S., Hong J., and Eikeset A. M. (2015). The Ecospace model applied to the North Sea: Evaluating spatial predictions with fish biomass and fishing effort data. Ecol. Model. 300, 50–60. doi: 10.1016/j.ecolmodel.2014.12.016
Russell D. J., Morris C. D., Duck C. D., Thompson D., and Hiby L. (2019). Monitoring long-term changes in UK grey seal pup production. Aquat. Conservation: Mar. Freshw. Ecosyst. 29, 24–39. doi: 10.1002/aqc.3100
Sarda F., Coll M., Heymans J. J., and Stergiou K. I. (2015). Overlooked impacts and challenges of the new European discard ban. Fish Fisheries 16, 175–180. doi: 10.1111/faf.12060
Saygu İ., Heymans J. J., Fox C., Özbilgin H., Bentley J. W., Eryaşar A. R., et al. (2020). Community-level impacts of trawl selectivity in the Eastern Mediterranean Sea assessed using an ecosystem modelling approach. ICES J. Mar. Sci. 77, 2918–2932. doi: 10.1093/icesjms/fsaa167
Scherer C., Ludlow F., Matthews A., Hayes P., Klais R., and Holm P. (2024). A Historical Plankton Index: Zooplankton abundance in the North Sea since 800 CE. Holocene 34, 843–859. doi: 10.1177/09596836241236332
SCOS (2019). Scientific Advice on Matters Related to the Management of Seal Populations: 2019 (Sea Mammal Research Unit, University of St Andrews, St Andrews, UK: Special Committee on Seals).
Serpetti N., Baudron A. R., Burrows M. T., Payne B. L., Helaouet P., Fernandes P. G., et al. (2017). Impact of ocean warming on sustainable fisheries management informs the Ecosystem Approach to Fisheries. Sci. Rep. 7, 13438. doi: 10.1038/s41598-017-13220-7
Sguotti C., Blöcker A. M., Färber L., Blanz B., Cormier R., Diekmann R., et al. (2022). Irreversibility of regime shifts in the North Sea. Front. Mar. Sci. 9. doi: 10.3389/fmars.2022.945204
Slomp C. P., Malschaert J. F. P., Lohse L., and Van Raaphorst W. (1997). Iron and manganese cycling in different sedimentary environments on the North Sea continental margin. Continental Shelf Res. 17, 1083–1117. doi: 10.1016/S0278-4343(97)00005-8
Stäbler M., Kempf A., Mackinson S., Poos J. J., Garcia C., and Temming A. (2016). Combining efforts to make maximum sustainable yields and good environmental status match in a food-web model of the southern North Sea. Ecol. Model. 331, 17–30. doi: 10.1016/j.ecolmodel.2016.01.020
Stäbler M., Kempf A., Smout S., and Temming A. (2019). Sensitivity of multispecies maximum sustainable yields to trends in the top (marine mammals) and bottom (primary production) compartments of the southern North Sea food-web. PloS One 14, e0210882. doi: 10.1371/journal.pone.0210882
Stäbler M., Kempf A., and Temming A. (2018). Assessing the structure and functioning of the southern North Sea ecosystem with a food-web model. Ocean Coast. Manage. 165, 280–297. doi: 10.1016/j.ocecoaman.2018.08.017
STECF (2018). The 2018 Annual Economic Report on the EU Fishing Fleet (STECF 18-07), Dentes De Carvalho Gaspar N., Keatinge M., and Guillen Garcia J. editor(s), EUR 28359 EN, (Luxembourg: Publications Office of the European Union) (2018). doi: 10.2760/56158
Summers C. F. (1978). Trends in the size of British grey seal populations. J. Appl. Ecol. 15, 395–400. doi: 10.2307/2402599
Thomas L., Russell D. J., Duck C. D., Morris C. D., Lonergan M., Empacher F., et al. (2019). Modelling the population size and dynamics of the British grey seal. Aquat. Conservation: Mar. Freshw. Ecosyst. 29, 6–23. doi: 10.1002/aqc.3134
Thompson D., Duck C. D., Morris C. D., and Russell D. J. (2019). The status of harbour seals (Phoca vitulina) in the UK. Aquat. Conservation: Mar. Freshw. Ecosyst. 29, 40–60. doi: 10.1002/aqc.3110
Thorpe R. B., Arroyo N. L., Safi G., Niquil N., Preciado I., Heath M., et al. (2022). The response of North Sea ecosystem functional groups to warming and changes in fishing. Front. Mar. Sci. 9. doi: 10.3389/fmars.2022.841909
Thurstan R. H. (2022). The potential of historical ecology to aid understanding of human–ocean interactions throughout the Anthropocene. J. Fish Biol. 101, 351–364. doi: 10.1111/jfb.15000
Thurstan R. H., Brockington S., and Roberts C. M. (2010). The effects of 118 years of industrial fishing on UK bottom trawl fisheries. Nat. Commun. 1, 15. doi: 10.1038/ncomms1013
Thurstan R. H., Hawkins J. P., and Roberts C. M. (2014). Origins of the bottom trawling controversy in the British Isles: 19th century witness testimonies reveal evidence of early fishery declines. Fish Fisheries 15, 506–522. doi: 10.1111/faf.12034
Ulanowicz R. E. (1980). An hypothesis on the development of natural communities. J. Theor. Biol. 85, 223–245. doi: 10.1016/0022-5193(80)90019-3
Ulanowicz R. E. (1986). Growth and development: Ecosystems phenomenology (New York: Springer-Verlag).
Ulanowicz R. E. (2004). Quantitative methods for ecological network analysis. Comput. Biol. Chem. 28, 321–339. doi: 10.1016/j.compbiolchem.2004.09.001
Ulanowicz R. E. and Puccia C. J. (1990). Mixed trophic impacts in ecosystems. Coenoses 5, 7–16. Available online at: http://www.jstor.org/stable/43461017 (Accessed May 30, 2025).
Worm B. and Branch T. A. (2012). The future of fish. Trends Ecol. Evol. 27, 594–599. doi: 10.1016/j.tree.2012.07.005
Worm B., Hilborn R., Baum J. K., Branch T. A., Collie J. S., Costello C., et al. (2009). Rebuilding global fisheries. Science 325, 578–585. doi: 10.1126/science.1173146
Keywords: historical baselines, ecopath with ecosim, historical ecology, network analysis, fisheries
Citation: Saygu İ, Thurstan RH, Roberts C, Heard Z, Akoglu E and Halloran PR (2025) Historical ecosystem models can serve as a baseline for indicator-based assessment: the North Sea. Front. Mar. Sci. 12:1646031. doi: 10.3389/fmars.2025.1646031
Received: 12 June 2025; Accepted: 18 September 2025;
Published: 02 October 2025.
Edited by:
Gideon Gal, Israel Oceanographic and Limnological Research, IsraelReviewed by:
Silvia Angelini, National Research Council - Institute for Biological Resources and Marine Biotechnology, ItalyMaysa Ito, Helmholtz-Zentrum fur Ozeanforschung Kiel Standort Westufer, Germany
Copyright © 2025 Saygu, Thurstan, Roberts, Heard, Akoglu and Halloran. This is an open-access article distributed under the terms of the Creative Commons Attribution License (CC BY). The use, distribution or reproduction in other forums is permitted, provided the original author(s) and the copyright owner(s) are credited and that the original publication in this journal is cited, in accordance with accepted academic practice. No use, distribution or reproduction is permitted which does not comply with these terms.
*Correspondence: İsmet Saygu, aS5zYXlndUBleGV0ZXIuYWMudWs=