 Tara Sigdel1
 Mark Nguyen1,2
 Juliane Liberto1
 Dejan Dobi3Henrik Junger3Flavio Vincenti1,2†Zoltan Laszik3*†
 Minnie M. Sarwal1,2*†
- 1Department of Surgery, University of California, San Francisco, San Francisco, CA, United States
- 2Department of Nephrology, University of California, San Francisco, San Francisco, CA, United States
- 3Department of Pathology, University of California, San Francisco, San Francisco, CA, United States
Background: There is an urgent need to develop and implement low cost, high-throughput standardized methods for routine molecular assessment of transplant biopsies. Given the vast archive of formalin-fixed and paraffin-embedded (FFPE) tissue blocks in transplant centers, a reliable protocol for utilizing this tissue bank for clinical validation of target molecules as predictors of graft outcome over time, would be of great value.
Methods: We designed and optimized assays to quantify 19 target genes, including previously reported set of tissue common rejection module (tCRM) genes. We interrogated their performance for their clinical utility for detection of graft rejection and inflammation by analyzing gene expression microarrays analysis of 163 renal allograft biopsies, and subsequently validated in 40 independent FFPE archived kidney transplant biopsies at a single center.
Results: A QPCR (Fluidigm) and a barcoded oligo-based (NanoString) gene expression platform were compared for evaluation of amplification of gene expression signal for 19 genes from degraded RNA extracted from FFPE biopsy sections by a set protocol. Increased expression of the selected 19 genes, that reflect a combination of specific cellular infiltrates (8/19 genes) and a graft inflammation score (11/19 genes which computes the tCRM score allowed for segregation of kidney transplant biopsies with stable allograft function and normal histology from those with histologically confirmed acute rejection (AR; p = 0.0022, QPCR; p = 0.0036, barcoded assay) and many cases of histological borderline inflammation (BL). Serial biopsy shaves used for gene expression were also processed for in-situ hybridization (ISH) for a subset of genes. ISH confirmed a high degree of correlation of signal amplification and tissue localization.
Conclusions: Target gene expression amplification across a custom set of genes can identify AR independent of histology, and quantify inflammation from archival kidney transplant biopsy tissue, providing a new tool for clinical correlation and outcome analysis of kidney allografts, without the need for prospective kidney biopsy biobanking efforts.
Introduction
Renal transplantation is the preferred treatment of end stage renal disease (ESRD) (1, 2); however, acute rejection, both T cell mediated rejection (TCMR) or antibody-mediated rejection (AMR), remain barriers to long-term graft survival. Current classification methods of histological rejection by modified Banff classification, suffer from heterogeneities in biopsy sampling, poor correlations between blinded pathology reads, and an inability to accurately quantify the inflammatory burden in the allograft, which is an important predictor of long-term graft function and survival (3–12). Unbiased and quantitative measurement of inflammation in the graft and its evolution over time and with treatment is an important measure to guide immunosuppression delivery. Measuring molecular inflammation can also discern clinical variance in the histological injury of borderline (BL) characteristics in the kidney, a finding that is not always detrimental to the allograft, specifically if it is also molecularly quiescent (13–18).
The tissue common rejection module (tCRM) score is a computed algorithm to assess inflammatory score for acute rejection, consisting of 11 genes, originally identified and validated in over 700 transplant tissue microarrays from kidney, heart, lung, and liver transplants (5, 19). A tCRM gene expression score was identified on the microarray data and then validated by QPCR on RNALater collected kidney transplant needle biopsies that had been collected prospectively, as part of biobanking efforts (5). The tCRM gene expression score of kidney tissues collected at 6 months directly correlated with risk of progressive interstitial fibrosis and tubular atrophy on 24 months protocol biopsies (19). In order to allow this score to be assessed on archival FFPE tissue blocks, we developed and optimized a protocol that would allow for target gene analysis on degraded RNA (11).
In this report, we applied our protocol that measures gene expression of 19 genes from RNA isolated from four 10-micron shaves off an FFPE block with histologically confirmed different phenotypes of normal functioning (NL), T cell-mediated rejection (TCMR), antibody-mediated rejection (ABMR), borderline changes (BL), and polyoma virus nephropathy (PVAN). In addition, chromogenic in situ hybridization (cISH) was employed on assessing spatial expression of two of the most significant genes (CXCL9 and CXCL10) on serial sections to demonstrate biological relevance and accuracy of gene expression data on FFPE blocks.
Methods
Patient Enrollment and Study Design
One hundred sixty-three kidney transplant recipient biopsies, with and without clinical graft dysfunction and matched biopsy histology, were profiled by oligo-based microarrays and unsupervised sub-clustering performed across the 19 target genes. Forty independent renal transplant recipients were identified with Banff supported diagnosis of acute T cell-mediated rejection (TCMR, n = 8), antibody-mediated rejection (ABMR, n = 8), borderline changes (BL, n = 8), polyoma virus nephropathy (PVAN, n = 8), and normal functioning (NL, n = 8) were used for clinical validation (Table 1) (20–23). The basis of inclusion of TCMR, ABMR, BL, and PVAN was to evaluate heterogeneous injury types. Demographic information is provided in Table 1. The study was approved by the Institutional Review Board and Ethics Committee of the University of California, San Francisco (UCSF), CA. All patients provided written informed consent to participate in the research, in full adherence to the Declaration of Helsinki. The clinical and research activities being reported are consistent with the Principles of the Declaration of Istanbul as outlined in the Declaration of Istanbul on Organ Trafficking and Transplant Tourism.
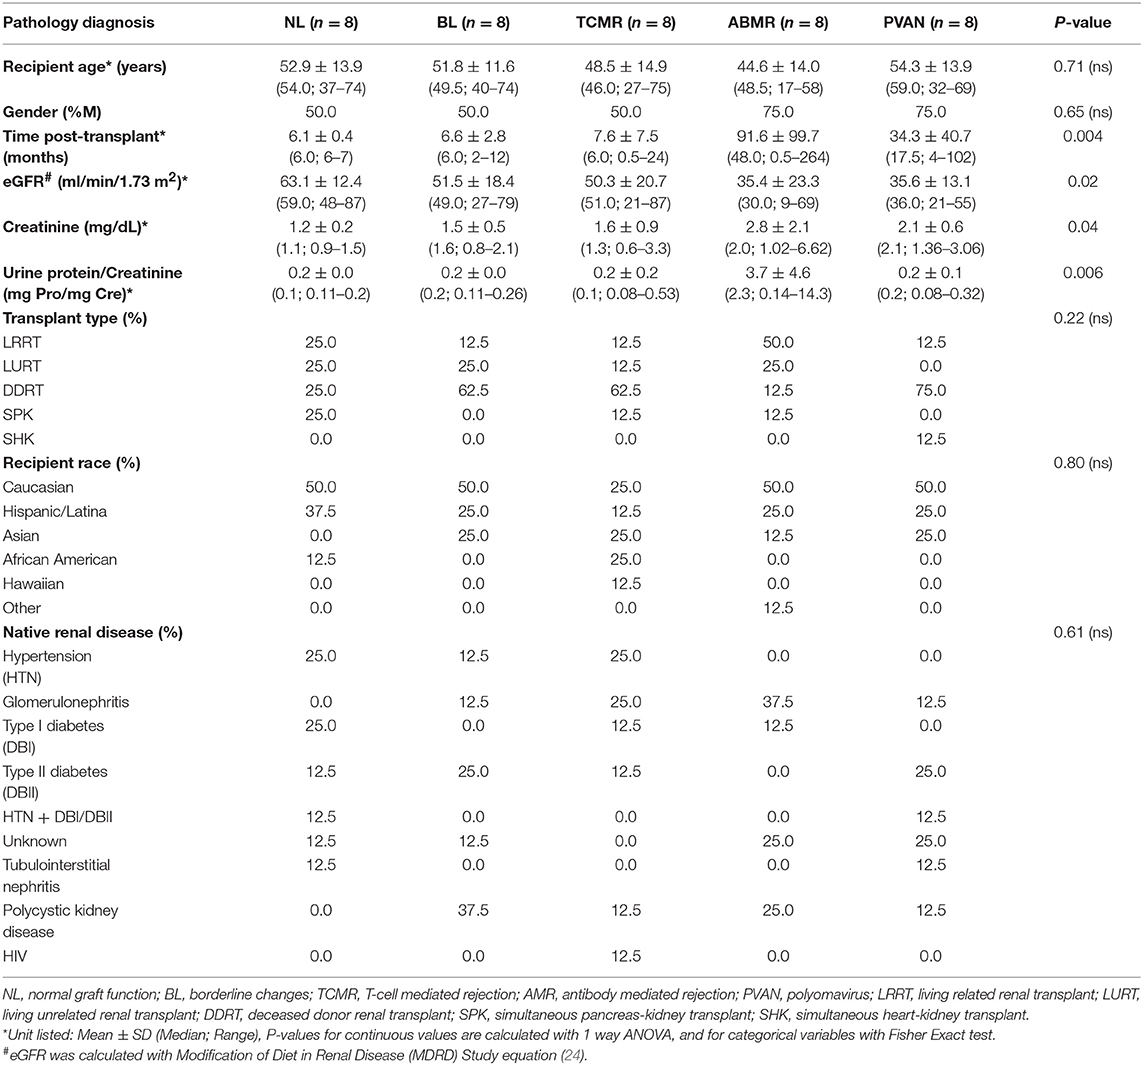
Table 1. Demographic table.
Histopathology
Tissue cores were fixed in 10% neutral buffered formalin and embedded in paraffin. First, 2 μm-thick consecutive sections were cut and stained with hematoxylin and eosin, periodic acid Schiff (PAS), and PAS-silver as part of the routine diagnostic workup. Immunofluorescence microscopy was performed on frozen sections with indirect method for complement 4d (C4d), and direct method for immunoglobulin G (IgG), IgM, IgA, C3, C1q, fibrinogen and albumin. Classification into TCMR, ABMR, BL, and NL were based on Banff classification (20–23). The diagnosis of PVAN required nuclear positivity in the tubular epithelium by SV-40 stain horseradish peroxidase-diaminobenzidine tetrahydrochloride detection method. Estimated glomerular rate (eGFR) was calculated using Modification of Diet in Renal Disease (MDRD) Study equation (24).
Interrogation of Microarray Data for the 19 Genes Across Different Kidney Transplant Injury Phenotypes
Microarray data from 163 kidney transplant biopsies (GSE72925) was analyzed by unsupervised analysis for sample clustering across the 19 genes; the 11 CRM genes (BASP, CD6, CXCL10, CXCL9, INPP5D, ISG20, LCK, NKG7, PSMB9, RUNX3, TAP1) and additional eight immune cell specific genes relating to different cell types, such as overall leukocyte burden (CD45), B cells (CD20), T cells (CD4, CD8A, FOXP3), macrophages (CD68), endothelial cells (CD31, PECAM1), and collagen (COL4A1).
Total RNA Extraction
We followed previously published protocol for the extraction of RNA from FFPE tissues (11). Based on our previous experience, we used 4 × 10 μm-thick sections to extract total RNA from FFPE samples. For rapid purification, PureLink FFPE Total RNA Isolation Kit was used (Invitrogen, Thermo Fischer Scientific, Foster City, CA) according to the manufacturer's recommendations. The RNA data quality was assessed by 260/280 absorption signal ratio and the RIN number.
NanoString's Barcoded Oligos Design and Assay
Barcoded Codesets for each gene studied including 5 reference genes (GAPDH, GUSB, HPRT1, LDHA, and TBP) used in the study were designed by NanoString Technologies as a service (detail information available in Supplemental Table S1). The NanoString assay was performed (NanoString Technologies, Seattle, WA) as follows. Briefly, 50 ng of each RNA sample was added to the CodeSet in hybridization buffer and incubated at 65°C for 16 h. The CodeSet consisted of Reporter and Capture probes that hybridize to the target sequences of interest, forming a tripartite complex. After the assay, the raw counts for each assay were collected using the NanoString data analysis software, nSolver® (NanoString Technologies, Seattle, WA). Raw counts were derived from the RCC data files. Normalization of the data was performed using nSolver® for the following two methods. (1) Positive control normalization: gene expression data is normalized to the mean of the POS control probes for each assay. (2) RNA content normalization: gene expression data was normalized to the geometric mean of housekeeping genes in the CodeSet.
cDNA Synthesis, and Gene Expression Quantification Using qPCR
A total of 50-ng RNA was reversed transcribed into complementary DNA (cDNA) using SuperScript VILO (Invitrogen, Thermo Fischer Scientific, Foster City, CA) and then amplified in a target specific amplification step for all 19 genes (above) using TaqMan PreAmp Master Mix and TaqMan Primers and Probes (Invitrogen, Thermo Fischer Scientific, Foster City, CA) (Supplemental Table S2) for a total of 18 amplification cycles. QPCR reactions were performed in the Fluidigm BioMark FD system using 18S gene as a housekeeping gene and Human XpressRef Universal Total RNA (Qiagen, Valencia, CA) as a reference RNA for 40 cycles. Resulting chip data was initially analyzed for quality control using the BioMark Analysis Software Version 2.0 (Fluidigm, South San Francisco, CA) and Ct values were exported into Excel. Normalization of the data was done in two steps. (1) Ct values of individual genes were normalized against Ct value of 18S for each gene to get dCt values. (2) dCt values of each sample was normalized against dCt values of the reference sample to get ddCt values which was subsequently used to calculate fold change (RQ) values for each gene in each sample.
Statistical Data Analysis and Confounder Analysis
Because of its steady expression, 18S ribosomal RNA has been a popular reference RNA in gene expression analyses. For the QPCR platform, 18S ribosomal RNA was used as the reference gene. However, for the nCounter system of NanoString, the system could not handle high abundance of 18S ribosomal RNA. We chose 5 common reference RNAs (GUSB, HPRT1, LDHA, TBP, GAPDH) as reference RNAs and used mean signal as reference value. We tested gene expression correlation by comparing Ct values of 18S ribosomal RNA with mean Ct values of the 5 reference RNAs (GUSB, HPRT1, LDHA, TBP, GAPDH) using 10 FFPE samples. There was a strong correlation with Pearson correlation (r) of 0.97 (R2 = 0.87) (P < 0.0001) in between the Ct value of 18S ribosomal RNA and the mean Ct value of the five reference genes listed above. This demonstrated that gene expression analyses performed with either 18S ribosomal RNA or the 5 common reference genes are comparable. Following reference gene normalization, QPCR platform data was log2 transformed. Unsupervised and supervised hierarchical clustering was performed using GENE-E (https://software.broadinstitute.org/GENE-E/) with utilization of one minus Pearson correlation and average as the metric and linkage method, respectively. Correlation values were calculated using Pearson and Spearman rank-based correlation method (GraphPad Prism, La Jolla California USA, www.graphpad.com) where the correlation coefficient, r, ranges from −1 to +1. Significant difference in two sets of data was determined by unpaired T-test with two-tailed P-value option and with FDR correction for multiple testing using two-stage step-up method of Benjamini, Keieger, and Yekutieli (using GraphPad Prism). A value of <0.05 was considered significant. The relationship in between gene expression and the biopsy scores was calculated using The Jonkheere-Terpstra test. The Spearman rank-order correlation was performed to calculate rho.
As seen on Table 1, we balanced recipient age, gender, transplant type, recipient race, and native renal disease (ESRD). Other parameters, such as serum creatinine, eGFR, and proteinuria were significantly different among injury phenotypes, which was expected. Post-transplant times were significantly different among different injury phenotypes (p = 0.004). A confounder analysis on gene expression levels of tCRM genes and months post-transplantation resulted in a p-value of 0.32 demonstrating post-transplantation time was not a factor driving gene expression values.
Chromogenic ISH (CISH) Assay for CXCL9 and CXCL10
The RNAscope platform (ACD Bio, Newark, CA) was used to quantify gene transcripts in situ. Probes against two of the most significant genes in rejection, and with readily available commercial assays, namely CXCL9 (cat # 440161) and CXCL10 (cat # 311851) (ACD Bio, Newark, CA) were applied on consecutive 2 μm-thick FFPE tissue sections and were detected by alkaline-phosphatase-based technique (RNAscope 2.5 HD Assay—Red) coupled with Warp Red chromogen (Biocare Medical, Pacheco, CA) followed by hematoxylin counterstain. Depending on the abundance and distribution of the transcript, the positive signal can be seen as separate dots or fused group(s) of multiple dots. After detection, the tissue sections were digitized by Aperio ScanScope XT. Whole-slide digital images were analyzed by the Definiens Tissue Studio platform's Dot Count module. In brief, the software models an “average” cell based on the hematoxylin counterstain first, and assigns each dot to a particular cell and counts them. Thresholds were adjusted individually and accuracy of the settings was checked by evaluation of 12 randomly selected HPFs at 40X. The number of dots in the entire section/1,000 cell characterized the expression level of a given gene.
Results
Acute Rejection, IFTA, and PVAN Share Signals of Molecular Inflammation in Microarray Datasets From 163 Kidney Transplant Biopsies
Initially, to evaluate the performance of the gene expression of the selected 19 genes across different transplant injury phenotypes we evaluated unsupervised interrogation of sample clustering across the 19 genes from the microarray data generated on 163 kidney tissue samples (68 NL, 26 AR, 10 PVAN, and 59 IFTA) (GEO Accession: GSE72925). As seen in Figure 1, there was an overall increased expression of most of these genes in AR, supporting the selection of these markers for rejection detection. The gene expression in other injury phenotypes including PVAN, IFTA, and histological and clinically stable biopsies (NL) is seen in Figure 1, highlighting that molecular inflammation is seen in biopsies not classified as AR by histology. This observation is in keeping with other studies that have reported that molecular inflammation in the graft can be sub-clinical and not always congruent with histology (25).
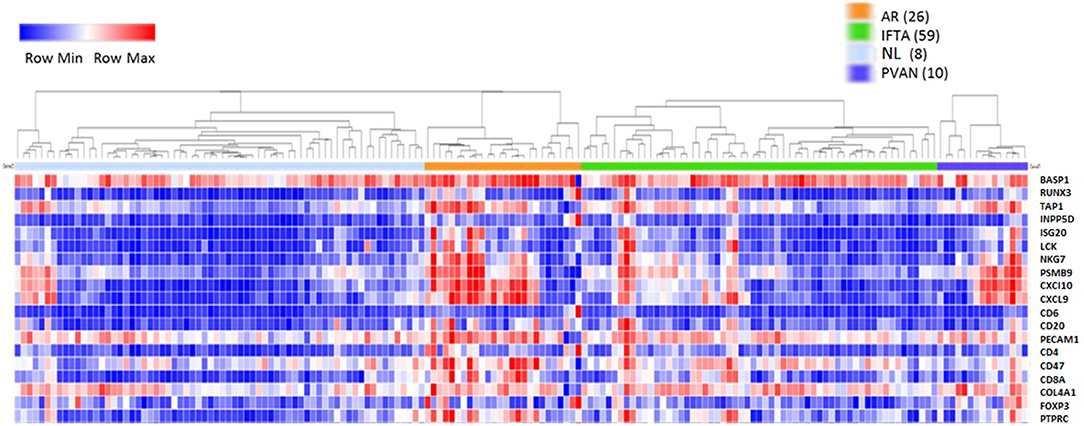
Figure 1. Heterogeneity of kidney graft injury across different injury phenotypes. As anticipated, CRM genes and genes specific to immune related genes are upregulated in the tissue from recipients of kidney transplantation with AR episodes. In addition, increased gene expression is seen with PVAN and IFTA subtypes. Furthermore, some tissues from normal graft biopsies also had molecular signatures that correspond to inflammation.
Validation of Perturbation of Transcriptional Signals by Either Fluidigm or NanoString Methods in FFPE Sections in Different Transplant Injury Phenotypes
We evaluated gene expression changes in different kidney transplant phenotypes on 40 independent samples (8 NL, 8 TCMR, 8 ABMR, 8 BL and 8 PVAN) using two platforms commonly used for quantification of gene expression. Gene expression data from the NanoString (barcoded oligos) platform showed significant increases in gene expression level in rejection (TCMR and ABMR) phenotypes compared to other phenotypes (including BL, PVAN, and NL) (Figure 2A). Thirteen of the 19 genes tested (BASP1, CXCl10, CXCL9, ISG20, LCK, NKG7, PSMB9, TAP1, CD31, CD4, CD68, COL4A, PTPRC) showed significantly increased mRNA levels in injury phenotypes (TCMR, ABMR, BL, and PVAN) when compared to NL (p ≤ 0.05). More genes were significantly increased in TCMR (BASP1, CXCL10, CXCL9, INPP5D, ISG20, LCK, RUNX3, CD6, CD4, COL4A) than in ABMR (INPP5D, ISG20, NKG7, RUNX3, CD31, CD4, CD68, COL4A) when compared to NL with p-value ≤0.05, highlighting subtle differences in tissue inflammatory components between TCMR and ABMR.
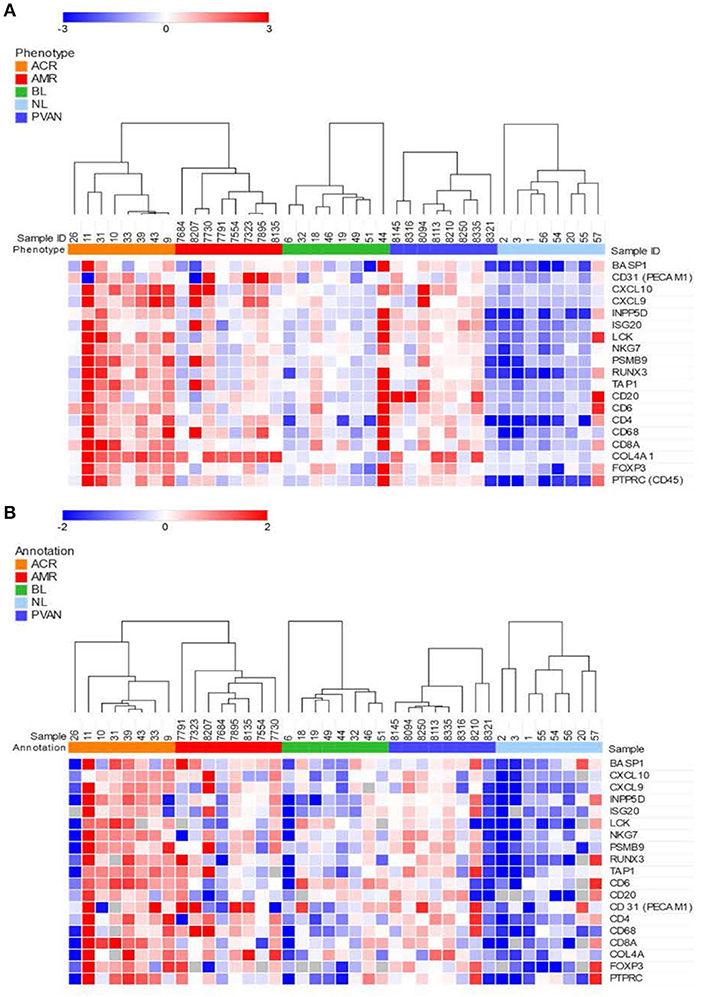
Figure 2. Quantitative methods of gene expression of CRM genes and immune-related genes differentiate kidney transplant biopsies with different transplant injuries. Expression of the genes across 40 unique samples that included 8 NL, 8 TCMR, 8 ABMR, 8 BL, and 8 PVAN. (A) As quantified by NanoString's gene expression platform. (B) As quantified by QPCR (Fluidigm).
Similar to the NanoString data, gene expression data from the QPCR platform showed an overall increased gene expression level in AR (TCMR and ABMR) phenotypes compared to other phenotypes (including BL, PVAN, and NL) (Figure 2B). 7 of the 19 genes assayed (CXCL10, CXCL9, ISG20, LCK, RUNX3, CD20, CD247) showed an increased mRNA level in injury phenotypes (TCMR, ABMR, BL, and PVAN) when compared to NL (p ≤ 0.05). On individual gene level, mRNA transcripts of CXCL10, LCK, and TAP1 were significantly increased in TCMR compared to NL (p ≤ 0.05). mRNA transcripts of CD68 and COL4A were increased in ABMR compared to NL (p ≤ 0.05) (Supplemental Table S3).
The tCRM Gene Composite Score Is Specifically Increased in Acute Rejection, for Both TCMR and ABMR
In the datasets generated by both the platforms used, the CRM scores for injury phenotypes (TCMR, ABMR, and PVAN) were significantly higher than the CRM scores for NL phenotypes (p ≤ 0.05). Even though there was a trend of higher CRM scores for borderline changes (BL), overall these were significantly lower than those in AR (Figure 3).
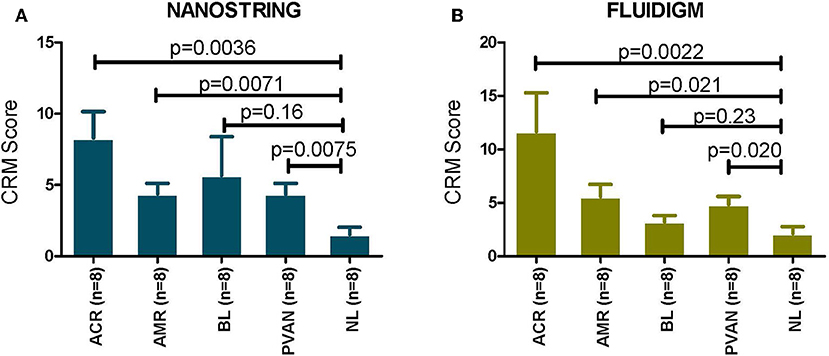
Figure 3. CRM scores are significantly increased in transplant injury. CRM score was used to evaluate difference among different transplant injury phenotypes. (A) The CRM scores calculated from the NanoString (barcoded oligos) data for injury phenotypes (TCMR, AMR, PVAN) were significantly higher than the CRM scores for NL phenotypes (p ≤ 0.05). (B) The CRM scores calculated from the QPCR data for injury phenotypes (TCMR, AMR, PVAN) were significantly higher than the CRM scores for NL phenotypes (p ≤ 0.05). Even though there was a trend of higher CRM scores for borderline changes (BL), they were not significant (p > 0.05) for both platforms.
We also evaluated association (using Jonkheere-Terpstra test) with and correlation (using Spearman's rank-order) of immune injury related genes' expression by both the platforms with biopsy i-score (interstitial inflammation). With NanoString gene expression data, the expression of CD45 (p = 0.006, rho = 0.41), CD68 (p = 0.0001, rho = 0.57), CD4 (p = 1.1E-05, rho = 0.62), and CD8A (p = 1.34E-06, rho = 0.68) were all correlated with i-score significantly. With QPCR gene expression data, the expression of CD45 (p = 8.53E-05, rho = 0.54), CD68 (p = 3.27E-05, rho = 0.60), CD4 (p = 8.53E-05, rho = 0.54), and CD8A (p = 0.0003, rho = 0.52) were all correlated with i-score significantly. Gene expression of COL4A gene was significantly associated with ct (tubular atrophy) and ci (interstitial fibrosis) scores with NanoString data (ct, p = 0.05, rho = 0.27, ci, p = 0.03, rho = 0.30) and QPCR (ct, p = 0.006, rho = 0.39, ci, p = 0.002, rho = 0.46). This demonstrated the potential usefulness of the molecular scores in clinical management of the kidney graft.
Strong Correlation in Between Chromogenic ISH Signal of CXCL9 and CXCL10 Gene-Transcripts With Gene Expression Data
Using RNAscope platform by ACD bio, we quantified gene transcripts of two genes that are highly expressed in infiltrating lymphocytes, for CXCL9 and CXCL10, in situ. Depending on the abundance and distribution of the transcript, the positive signal can be seen as separate dots or fused group(s) of multiple dots (as seen in the representative images from biopsy samples with T-cell mediated rejection). Chromogenic in situ hybridization for CXCL9 and CXCL10 identified tubular epithelial cells as the primary source of these chemokines (Figure 4A) while scattered mononuclear cells also showed some expression (Figure 4B). In addition, rare signal was noted in some glomeruli; however, no definite signal was detected in the vascular compartment or in the interstitium other than the inflammatory cells.
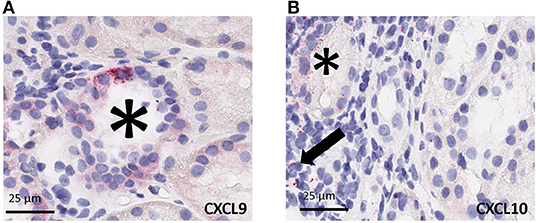
Figure 4. Cell specific gene expression of CXCL9 and CXCL10 by chromogenic in situ hybridization (ciSH) data agrees with gene expression data on bulk tissue. Representative images from biopsy samples with T-cell mediated rejection. Chromogenic in situ hybridization for CXCL9 (A) and CXCL10 (B) shows high-level expression on tubular epithelial cells (asterisks) and some scattered mononuclear cells (arrow), 400×. Rare signal was noted in some glomeruli, however no definite signal was detected in the vascular compartment or in the interstitium other than the inflammatory cells (32, 33).
The same FFPE block of a given case was used for both total RNA isolation and CISH. CISH data for CXCL9 with spot count/1,000 cells showed a strong correlation with the corresponding gene expression levels on both the NanoString platform (r = 0.859, p < 0.0005) (Figure 5A) and the Fluidigm QPCR platform (r = 0.684, p = 0.007) (Figure 5C). CISH data for CXCL10 with spot count/1,000 cells also showed a strong correlation with the corresponding gene expression levels on both the NanoString platform (r = 0.729, p < 0.003) (Figure 5B) and the QPCR Fluidigm platforms (r = 0.643, p = 0.018) (Figure 5D).
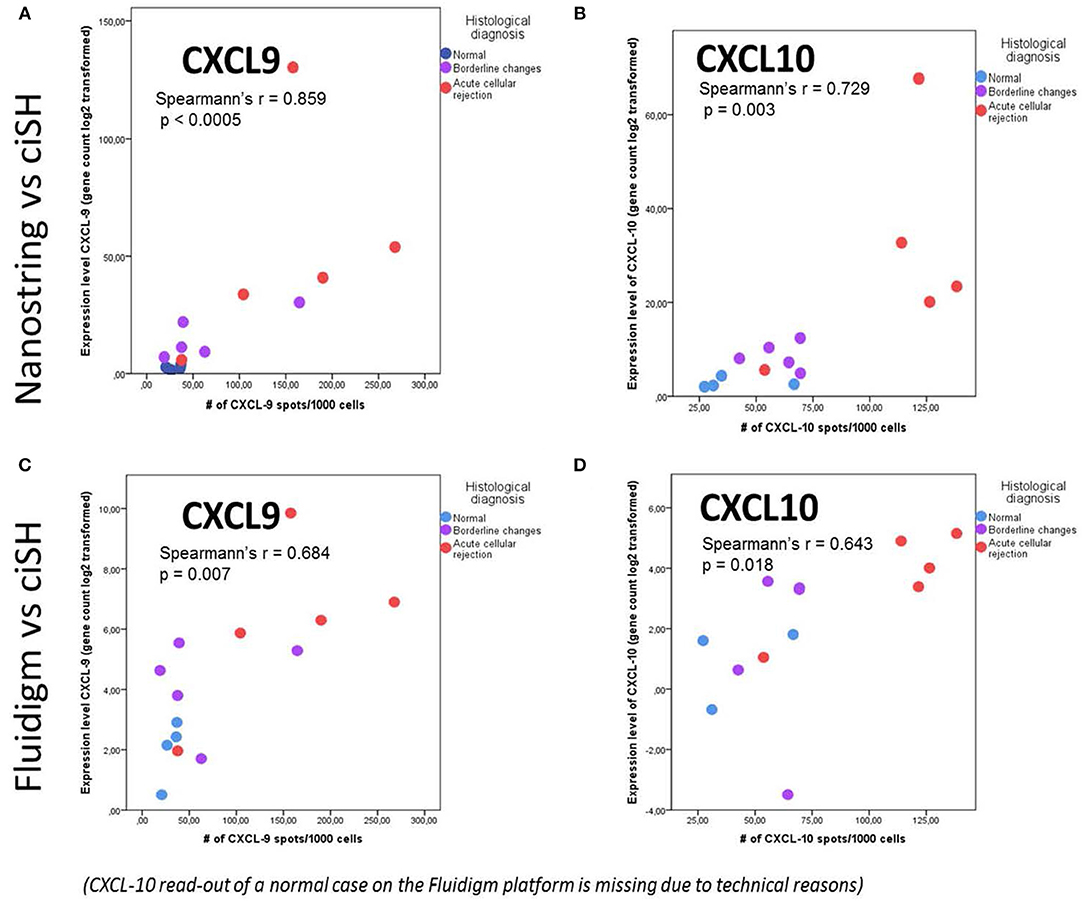
Figure 5. Chromogenic in situ hybridization (ciSH) data correlates with gene expression data on bulk tissue assessed by both Fluidigm and NanoString. We observed a strong correlation between CXCL9 and CXCL10 cISH spot count and the corresponding gene expression data when applied to a subset of 14 cases [NL (n = 4), BL (n = 5), and ACR (n = 5)] assessed with NanoString (A,B) and Fluidigm (C,D). The X- and Y-axis values are different in case of NanoString and Fluidigm because of the different scale of the gene expression values.
Discussion
Molecular quantification of the overall inflammatory burden in the renal allograft is essential to establish at the time of an invasive biopsy. Our proposed method facilitates data collection to real-time results (overall experiment times are 4–6 h for the assays shown) and removes the burden of personnel needed for onsite prospective biobanking needing immediate tissue preservation in RNAlater. As a major benefit, we can now process a valuable clinical set of 19 genes for quantification of tissue inflammation and AR, using minimal tissue, from archived FFPE blocks, preserving most of the parent FFPE block for additional histologic analyses. Understanding the burden of inflammation in an allograft is critical for optimization of therapy, following response to chosen interventions and as a means to predict risk stratification for progressive chronic injury and allograft loss, when persistent. This study confirms that molecular profiling provides an objective assessment of graft inflammation, which can be a very valuable endpoint for observational and interventional clinical trials (26–28). The recognized difficulty in capturing and quantifying subtle differences by the histological scoring system can thus be aided by including a quantitative molecular scoring system on the same archival biopsy section.
QPCR provides an accurate assessment of gene transcripts in biological samples, such as blood, biopsy or urine (4, 6, 11, 29–31). In this study we show that multiplex high-throughput PCR by Fluidigm or a synthetic oligo based NanoString platform can further minimize sample input and handle low quality degraded RNA to amplify a robust set of 19 genes that can be computed to quantitate the inflammatory burden in the renal allograft (11). The parallel experiments on serially cut sections of kidney biopsies demonstrate that there is a strong correlation of gene expression in situ of prominent infiltrating lymphocyte markers (CXCL9 and CXCL10) in terms of CISH score with gene expression data from homogenized tissues. CXCL9 and CXCL10 were highly expressed in renal tubules during ACR, and were also found in infiltrating leukocytes in accordance with the spatial distribution pattern reported previously in a non-human primate model (32), and human renal transplant biopsies (33, 34). Strong correlation of gene expression data on serially sectioned bulk tissue with CISH data provides support of the biological relevance of the transcriptomic studies on bulk tissues based on FFPE specimens. This suggests that transcriptomic profiles preserved in FFPE blocks are both biologically relevant and clinically beneficial.
We acknowledge that the impact of this study would be further strengthened by the application of this technology to a larger number of samples and from its application in other study groups; the adoption of this assay as a primary endpoint for ongoing randomized clinical trial (RCT) is expected to provide additional clinical utility of this assay over time. Nevertheless, the development of the FFPE section processing protocol, its reduction to multiplexed PCR, and the validation of a composite tCRM score as a clinical surrogate endpoint for rejection and projection of future chronic injury decline, make strong arguments for this approach to benefit transplant patients and studies.
Data Availability Statement
All datasets generated for this study are included in the manuscript/Supplementary Files.
Ethics Statement
The studies involving human participants were reviewed and approved by Institutional Review Board and Ethics Committee of the University of California, San Francisco, CA. The patients/participants provided their written informed consent to participate in this study.
Disclosure
Founder, KITBio, Organ-I; Past/Present Consulting: Bristol Meyers Squibb, Natera, Genentech, Novartis, Astellas; Treasurer, The Transplantation Society.
Author Contributions
TS participated in designing the assays, supervising the data generation, analyzing the data, and writing the manuscript. MN participated in data analysis for gene expression assays and contributed in writing the manuscript. DD participated in tissue processing, CISH assays, data analysis for CISH, and contributed in manuscript writing. HJ participated in tissue processing, CISH assays, and data analysis for CISH. JL contributed in gene expression data generation, organization, and manuscript writing. FV provided the study samples, participated in discussions in data analysis strategies, and manuscript writing. ZL was part of the study design, contributed in tissue processing, supervision of CISH assay optimization, data analysis, and manuscript writing. MS contributed in study design, provided supervision on data generation and analysis, data reporting, and manuscript writing.
Conflict of Interest
The authors declare that the research was conducted in the absence of any commercial or financial relationships that could be construed as a potential conflict of interest.
Acknowledgments
The authors would like to acknowledge the funding support from the National Institutes of Health: UO1/CTOT21 (FV), R21 TR001761 (MS), U24AI118675 (ZL), and T32DK007219 (MN). The authors would also like to thank the support from Dr. Sindhu Chandran, UCSF Medical Center, for helping with sample collection, Szu-Chuan Hsieh for the help with sample processing, and Andrew Schroeder for the revision of the manuscript.
Supplementary Material
The Supplementary Material for this article can be found online at: https://www.frontiersin.org/articles/10.3389/fmed.2019.00213/full#supplementary-material
References
1. Laupacis A, Keown P, Pus N, Krueger H, Ferguson B, Wong C, et al. A study of the quality of life and cost-utility of renal transplantation. Kidney Int. (1996) 50:235–42. doi: 10.1038/ki.1996.307
2. Wolfe RA, Ashby VB, Milford EL, Ojo AO, Ettenger RE, Agodoa LY, et al. Comparison of mortality in all patients on dialysis, patients on dialysis awaiting transplantation, and recipients of a first cadaveric transplant. N Engl J Med. (1999) 341:1725–30. doi: 10.1056/NEJM199912023412303
3. Naesens M, Khatri P, Li L, Sigdel TK, Vitalone MJ, Chen R, et al. Progressive histological damage in renal allografts is associated with expression of innate and adaptive immunity genes. Kidney Int. (2011) 80:1364–76. doi: 10.1038/ki.2011.245
4. Li L, Khatri P, Sigdel TK, Tran T, Ying L, Vitalone MJ, et al. A peripheral blood diagnostic test for acute rejection in renal transplantation. Am J Transplant. (2012) 12:2710–8. doi: 10.1111/j.1600-6143.2012.04253.x
5. Khatri P, Roedder S, Kimura N, De Vusser K, Morgan AA, Gong Y, et al. A common rejection module (CRM) for acute rejection across multiple organs identifies novel therapeutics for organ transplantation. J Exp Med. (2013) 210:2205–21. doi: 10.1084/jem.20122709
6. Roedder S, Sigdel T, Salomonis N, Hsieh S, Dai H, Bestard O, et al. The kSORT assay to detect renal transplant patients at high risk for acute rejection: results of the multicenter AART study. PLoS Med. (2014) 11:e1001759. doi: 10.1371/journal.pmed.1001759
7. Halloran PF, Famulski K, Reeve J. The molecular phenotypes of rejection in kidney transplant biopsies. Curr Opin Organ Transplant. (2015) 20:359–67. doi: 10.1097/MOT.0000000000000193
8. Reeve J, Halloran PF. Biopsy transcriptome expression profiling: proper validation is key. Lancet. (2017) 389:600–1. doi: 10.1016/S0140-6736(17)30282-9
9. Wadstrom J, Ericzon BG, Halloran PF, Bechstein WO, Opelz G, Seron D, et al. Advancing transplantation: new questions, new possibilities in kidney and liver transplantation. Transplantation. (2017) 101:S1–41. doi: 10.1097/TP.0000000000001563
10. Sigdel TK, Archila FA, Constantin T, Prins SA, Liberto J, Damm I, et al. Optimizing detection of kidney transplant injury by assessment of donor-derived cell-free DNA via massively multiplex PCR. J Clin Med. (2018) 8:E19. doi: 10.3390/jcm8010019
11. Sigdel TK, Nguyen M, Dobi D, Hsieh SC, Liberto JM, Vincenti F, et al. Targeted transcriptional profiling of kidney transplant biopsies. Kidney Int Rep. (2018) 3:722–31. doi: 10.1016/j.ekir.2018.01.014
12. Pineda S, Sigdel TK, Liberto JM, Vincenti F, Sirota M, Sarwal MM. Characterizing pre-transplant and post-transplant kidney rejection risk by B cell immune repertoire sequencing. Nat Commun. (2019) 10:1906. doi: 10.1038/s41467-019-09930-3
13. Roberts IS, Reddy S, Russell C, Davies DR, Friend PJ, Handa AI, et al. Subclinical rejection and borderline changes in early protocol biopsy specimens after renal transplantation. Transplantation. (2004) 77:1194–8. doi: 10.1097/01.TP.0000118905.98469.91
14. Matoza JR, Danguilan RA, Chicano S. Impact of Banff borderline acute rejection among renal allograft recipients. Transplant Proc. (2008) 40:2303–6. doi: 10.1016/j.transproceed.2008.07.004
15. Henderson LK, Nankivell BJ, Chapman JR. Surveillance protocol kidney transplant biopsies: their evolving role in clinical practice. Am J Transplant. (2011) 11:1570–5. doi: 10.1111/j.1600-6143.2011.03677.x
16. Mehta R, Bhusal S, Randhawa P, Sood P, Cherukuri A, Wu C, et al. Short-term adverse effects of early subclinical allograft inflammation in kidney transplant recipients with a rapid steroid withdrawal protocol. Am J Transplant. (2018) 18:1710–7. doi: 10.1111/ajt.14627
17. Nankivell BJ, Agrawal N, Sharma A, Taverniti A, P'ng CH, Shingde M, et al. The clinical and pathological significance of borderline T cell-mediated rejection. Am J Transplant. (2019) 19:1452–63. doi: 10.1111/ajt.15197
18. Friedewald JJ, Kurian SM, Heilman RL, Whisenant TC, Poggio ED, Marsh C, et al. Development and clinical validity of a novel blood-based molecular biomarker for subclinical acute rejection following kidney transplant. Am J Transplant. (2019) 19:98–109. doi: 10.1111/ajt.15011
19. Sigdel TK, Bestard O, Tran TQ, Hsieh SC, Roedder S, Damm I, et al. A computational gene expression score for predicting immune injury in renal allografts. PLoS ONE. (2015) 10:e0138133. doi: 10.1371/journal.pone.0138133
20. Bruneval P, Angelini A, Miller D, Potena L, Loupy A, Zeevi A, et al. The XIIIth Banff Conference on Allograft Pathology: The Banff 2015 Heart Meeting Report: improving antibody-mediated rejection diagnostics: strengths, unmet needs, and future directions. Am J Transplant. (2017) 17:42–53. doi: 10.1111/ajt.14112
21. Loupy A, Haas M, Solez K, Racusen L, Glotz D, Seron D, et al. The Banff 2015 Kidney Meeting Report: current challenges in rejection classification and prospects for adopting molecular pathology. Am J Transplant. (2017) 17:28–41. doi: 10.1111/ajt.14107
22. Haas M, Loupy A, Lefaucheur C, Roufosse C, Glotz D, Seron D, et al. The Banff 2017 Kidney Meeting Report: revised diagnostic criteria for chronic active T cell-mediated rejection, antibody-mediated rejection, and prospects for integrative endpoints for next-generation clinical trials. Am J Transplant. (2018) 18:293–307. doi: 10.1111/ajt.14625
23. Nickeleit V, Singh HK, Randhawa P, Drachenberg CB, Bhatnagar R, Bracamonte E, et al. The Banff Working Group classification of definitive polyomavirus nephropathy: morphologic definitions and clinical correlations. J Am Soc Nephrol. (2018) 29:680–93. doi: 10.1681/ASN.2017050477
24. Levey AS, Coresh J, Greene T, Stevens LA, Zhang YL, Hendriksen S, et al. Using standardized serum creatinine values in the modification of diet in renal disease study equation for estimating glomerular filtration rate. Ann Intern Med. (2006) 145:247–54. doi: 10.7326/0003-4819-145-4-200608150-00004
25. Naesens M, Kambham N, Concepcion W, Salvatierra O Jr, Sarwal M. The evolution of nonimmune histological injury and its clinical relevance in adult-sized kidney grafts in pediatric recipients. Am J Transplant. (2007) 7:2504–14. doi: 10.1111/j.1600-6143.2007.01949.x
26. Sarwal M, Chua MS, Kambham N, Hsieh SC, Satterwhite T, Masek M, et al. Molecular heterogeneity in acute renal allograft rejection identified by DNA microarray profiling. N Engl J Med. (2003) 349:125–38. doi: 10.1056/NEJMoa035588
27. Reeve J, Sellares J, Mengel M, Sis B, Skene A, Hidalgo L, et al. Molecular diagnosis of T cell-mediated rejection in human kidney transplant biopsies. Am J Transplant. (2013) 13:645–55. doi: 10.1111/ajt.12079
28. Halloran PF, Famulski KS, Chang J. A probabilistic approach to histologic diagnosis of antibody-mediated rejection in kidney transplant biopsies. Am J Transplant. (2017) 17:129–39. doi: 10.1111/ajt.13934
29. Matignon M, Ding R, Dadhania DM, Mueller FB, Hartono C, Snopkowski C, et al. Urinary cell mRNA profiles and differential diagnosis of acute kidney graft dysfunction. J Am Soc Nephrol. (2014) 25:1586–97. doi: 10.1681/ASN.2013080900
30. Nissaisorakarn V, Lee JR, Lubetzky M, Suthanthiran M. Urine biomarkers informative of human kidney allograft rejection and tolerance. Hum Immunol. (2018) 79:343–55. doi: 10.1016/j.humimm.2018.01.006
31. Adam B, Afzali B, Dominy KM, Chapman E, Gill R, Hidalgo LG, et al. Multiplexed color-coded probe-based gene expression assessment for clinical molecular diagnostics in formalin-fixed paraffin-embedded human renal allograft tissue. Clin Transplant. (2016) 30:295–305. doi: 10.1111/ctr.12689
32. Kanmaz T, Feng P, Torrealba J, Kwun J, Fechner JH, Schultz JM, et al. Surveillance of acute rejection in baboon renal transplantation by elevation of interferon-gamma inducible protein-10 and monokine induced by interferon-gamma in urine. Transplantation. (2004) 78:1002–7. doi: 10.1097/01.TP.0000134397.55564.71
33. Tatapudi RR, Muthukumar T, Dadhania D, Ding R, Li B, Sharma VK, et al. Noninvasive detection of renal allograft inflammation by measurements of mRNA for IP-10 and CXCR3 in urine. Kidney Int. (2004) 65:2390–7. doi: 10.1111/j.1523-1755.2004.00663.x
34. Saez A, Andreu FJ, Segui MA, Bare ML, Fernandez S, Dinares C, et al. HER-2 gene amplification by chromogenic in situ hybridisation (CISH) compared with fluorescence in situ hybridisation (FISH) in breast cancer–a study of two hundred cases. Breast. (2006) 15:519–27. doi: 10.1016/j.breast.2005.09.008
Keywords: kidney transplantation, acute rejection, biomarker, transcriptomics analysis, FFPE
Citation: Sigdel T, Nguyen M, Liberto J, Dobi D, Junger H, Vincenti F, Laszik Z and Sarwal MM (2019) Assessment of 19 Genes and Validation of CRM Gene Panel for Quantitative Transcriptional Analysis of Molecular Rejection and Inflammation in Archival Kidney Transplant Biopsies. Front. Med. 6:213. doi: 10.3389/fmed.2019.00213
Received: 31 May 2019; Accepted: 16 September 2019;
Published: 01 October 2019.
Edited by:
Narinder K. Mehra, All India Institute of Medical Sciences, IndiaReviewed by:
Burkhard Tönshoff, Heidelberg University Hospital, GermanyBassam G. Abu Jawdeh, University of Cincinnati, United States
Copyright © 2019 Sigdel, Nguyen, Liberto, Dobi, Junger, Vincenti, Laszik and Sarwal. This is an open-access article distributed under the terms of the Creative Commons Attribution License (CC BY). The use, distribution or reproduction in other forums is permitted, provided the original author(s) and the copyright owner(s) are credited and that the original publication in this journal is cited, in accordance with accepted academic practice. No use, distribution or reproduction is permitted which does not comply with these terms.
*Correspondence: Zoltan Laszik, em9sdGFuLmxhc3ppa0B1Y3NmLmVkdQ==; Minnie M. Sarwal, bWlubmllLnNhcndhbEB1Y3NmLmVkdQ==
†Senior authors