 Yunyan Xie1†
 Qin Yang1†
 Chunhua Liu2
 Qi Zhang2
 Jiehui Jiang2,3,4*
 Ying Han1,5,6* and the Alzheimer's Disease Neuroimaging Initiative
- 1Department of Neurology, Xuanwu Hospital of Capital Medical University, Beijing, China
- 2Key Laboratory of Specialty Fiber Optics and Optical Access Networks, Joint International Research Laboratory of Specialty Fiber Optics and Advanced Communication, School of Communication and Information Technology, Shanghai University, Shanghai, China
- 3Shanghai Institute for Advanced Communication and Data Science, Shanghai University, Shanghai, China
- 4Institute of Biomedical Engineering, Shanghai University, Shanghai, China
- 5Center of Alzheimer's Disease, Beijing Institute for Brain Disorders, Beijing, China
- 6National Clinical Research Center for Geriatric Disorders, Beijing, China
The aim of this study was to determine a pattern associated with longitudinal changes of β-amyloid (Aβ) deposition during cognitively normal(CN) healthy aging. We used 18F-florbetapir (AV-45) PET images of the brains of 207 cognitively normal subjects (CN1), obtained through the Alzheimer's Disease Neuroimaging Initiative (ADNI), to identify the healthy aging pattern and 76 cognitively normal healthy subjects (CN2), obtained through the Xuanwu Hospital of Capital Medical University, Beijing, China, to verify it. A voxel-based correlation analysis of standardized uptake value ratio (SUVR) map image and age was conducted using the DPABI (Data Processing & Analysis of Brain Imaging) software to identify the pattern. The sum of squares due to errors (SSE), R-square (R2) and the root-mean-square error (RMSE) were calculated to assess the quality of curve fitting. Among them, R2 was proposed as the coherence coefficient, which was as an index to assess the correlation between SUVR value of the pattern and subjects' age. The pattern characterized by age-associated longitudinal changes of Aβ deposition was mainly distributed in the right middle and inferior temporal gyrus, the right temporal pole: middle temporal gyrus, the right inferior occipital gyrus, the right inferior frontal gyrus (triangular portion), and the right precentral gyrus. There were a significant positive correlation between the SUVR value of the pattern and age for each CN group (CN1: R2 = 0.120, p < 0.001 for quadratic model; CN2: R2 = 0.152, p = 0.002 for quadratic model). These findings suggest a pattern of changes in Aβ deposition that can be used to distinguish physiological changes from pathophysiological changes, constituting a new method for elucidating the neuropathological mechanism of Alzheimer's disease.
Introduction
Brain aging, which is influenced by various pathological and psychosocial factors (1), comprises two categories: healthy and pathological aging. According to clinical neurology, healthy aging is defined as “the cognitively normal (CN) subjects who maintain their normal cognitive level and ability of daily living as they grow older, without neurological diseases” (2). Pathological aging, which is characterized by the accumulation of extracellular Aβ deposition (3), is considered a major pathological element of Alzheimer's disease (AD) (4). However, the presence of Aβ in the AD brain may also signal a physiological age-associated phenomenon depending on its extent and distribution pattern (5–8). Research evidence suggests that Aβ deposition occurs in the brains of cognitively normal older individuals (9–12). The prevalence of the amyloid burden among cognitively normal older individuals has been estimated to be more than 25% than younger individuals based on the findings of autopsy studies (9, 13, 14). However, given limited knowledge regarding the extent and distribution of Aβ deposition during the healthy aging process, an assessment of changes in Aβ deposition with age is essential for advancing understanding of healthy aging.
Some studies that have measured amyloid deposition in the course of normal aging found a significant linear increase in global Aβ deposition with age (3, 12, 15). One study found a highly significant correlation between increasing age and a reduction in Aβ turnover rates (16). Significant linear increases with age have been observed in the precuneus, temporal cortex, and the anterior and posterior cingulate (3) as well as in the frontal, cingulate and parietal areas, with primary sensory/visual areas being relatively protected from amyloid deposition (17). The findings of the above studies indicate that there may be a linear pattern of brain aging associated with changes in Aβ deposition during healthy aging in cognitively normal adults. However, all above studies were based on western datasets and the repeatability of results was not verified among different ethnic cohorts.
18F-florbetapir (AV-45) is a safe tracer demonstrating high levels of sensitivity and specificity for Aβ detection (18). Aβ deposition in the brain can be quantified within a clinical environment through positron emission computed tomography (PET) scans conducted with 18F-AV-45 (19). Moreover, this technique can be used to study Aβ distribution in vivo, enabling the formation and progression of Aβ aggregates in the brain to be monitored (20, 21). Thus, there were two main objectives in this study: (1) to explore a pattern associated with longitudinal changes of Aβ deposition during healthy aging using 18F-AV-45 PET images to quantify Aβ deposition in vivo. (2) to verify the repeatability of the healthy aging pattern among western and Chinese cohorts.
Materials and Methods
Materials
Two cohorts of neuroimaging data were collected from two independent centers: Cohort A (N = 207, right-handed, CN1) from the Alzheimer's Disease Neuroimaging Initiative (ADNI) database (http://adni.loni.usc.edu/) and cohort B (N = 76, right-handed, CN2) from the Department of Neurology, Xuanwu Hospital of Capital Medical University. Both clinical (Sex, Age, Education, Mini-Mental State Examination (MMSE)) and image (18F-AV-45 PET and MRI image) information were selected for the two cohorts. Montreal Cognitive Assessment (MoCA) and Clinical Dementia Rating Sum of Boxes (CDR-SB) were also selected for Cohort A. Notablly, in total 378 images were included for Cohort A because part of subjects had more than one scan (1.83 ± 0.83 scan times per subject), while each subject had only one scan in Cohort B.
Figure 1 shows the exclusion and inclusion criteria applied to CN subjects of Cohort A. The following inclusion criteria were applied: (1) subjects had no history of stroke, hypertension, brain disease, or mental illness. (2) The PET scan results of individuals were Aβ-negative (Aβ-), with a cerebral-to-whole cerebellar florbetapir SUVR value below 1.18 (22). (3) Mini-Mental State Examination (MMSE) scores for individuals were above or equal to 28, and their Clinical Dementia Rating Sum of Boxes (CDR-SB) scores were all 0. Inclusion criteria for subjects in Cohort B were consistent with those for Cohort A. This study was approved by the institutional review boards of ADNI and the Research Ethics Committee of Xuanwu Hospital, Beijing, China.Written, informed consent had been obtained from each subject.
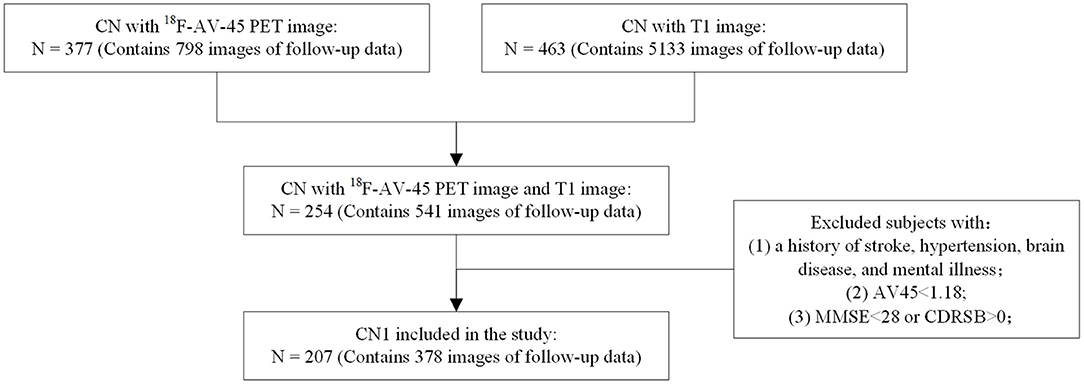
Figure 1. Inclusion and exclusion criteria applied to the ADNI data.
Image Acquisition Protocol
The process of acquiring data for the CN1 group is described in detail in the imaging protocol column of the ADNI database (http://adni.loni.usc.edu/). PET and T1 MRI data were simultaneously obtained for each participant in the CN2 group. All of the participants were invited to undergo optional 18F-florbetapir (AV-45) PET scans in the three-dimensional acquisition mode. A dynamic scan, lasting 35 min, was performed approximately 40 min after participants received an intravenous injection of 7–10 mCi [18F] florbetapir. The PET scan images were analytically reconstructed using a time-of-flight ordered subset expectation maximization (TOF OSEM) algorithm with the following parameters: eight iterations, 32 subsets matrix = 192 × 192, field of view (FOV) = 350 × 350, half-width height = 3.
Three-dimensional T1-weighted magnetization-prepared rapid gradient echo scans were performed using an integrated TOF-capable PET/MR 3.0T imaging device (SIGNA PET/MR, GE Healthcare, Milwaukee, Wisconsin, USA) available at the Xuanwu Hospital of Capital Medical University. The following parameters were applied: SPGR sequence, FOV = 256 × 256 mm2, matrix = 256 × 256, slice thickness = 1 mm, gap = 0, slice number = 192, repetition time (TR) = 6.9 ms, echo time (TE) = 2.98 ms, inversion time (TI) = 450 ms, flip angle = 12°, voxel size = 1 × 1 × 1 mm3.
Image Preprocessing
All 18F-AV-45 PET scan images and corresponding T1 images were preprocessed using statistical parametric mapping software (SPM12; https://www.fil.ion.ucl.ac.uk/spm/software/spm12/) in MATLAB (Version R2014a; MathWorks, Natick, MA, United States). We first used the realigning method to ensure that all frames in the dynamic scans were motion-corrected to the first frame and processed the output single average functional image, reducing system, or head motion errors. Next, we performed a voxel-based partial volume effect (PVE) correction of the functional image using the Müller-Gärtner method (MG), with parameters of white matter (WM), gray matter (GM), and cerebrospinal fluid (CSF) obtained through T1 image segmentation. Then, PVE-corrected image was then normalized with reference to the standard Montreal Neurological Institute (MNI) brain space using the deformation field from the MRI image to the MNI space and smoothed to reduce noise and improve image quality using an isotropic Gaussian smoothing kernel with a gaussian filter of 8 mm full-width at half-maximum (FWHM). Lastly, the smoothed functional image was intensity normalized to the mean uptake of whole cerebellum to obtain SUVR map image.
Voxel-Wise PET Analysis
To explore the effect of age on Aβ deposition in the brains of cognitively normal subjects, a voxel-wise correlation analysis of SUVR map iamges was conducted for CN1, with age applied as the seed series and GM, sex, and years of education considered as the covariates. The DPABI software in MATLAB R2014a was used for the analysis. Accordingly, we obtained a statistical map (false discovery rate (FDR) corrected with q < 0.01) reflecting the change trend and degree of Aβ deposition in the aging brain. Thereby voxels relating to aging were obtaining with the absolute value of the correlation coefficient ≥ 0.3. As a final step, we mapped the voxels on to the MNI standard space to obtain statistical brain regions as ROIs. To verify that ROIs actually reflect the effect of aging on Aβ deposition in cognitively normal individuals, we examined the correlations between the SUVR values of the healthy aging pattern and age for individuals in the CN1 group and compared the results with the SUVR value for the whole brain. SUVR values were plotted against subjects' ages and fitted using three separate models, namely a linear model:
a quadratic model:
and an exponential model:
where t denotes age and a, b, and c are the parameters to be estimated from the data plotted for the SUVR values and ages of subjects in the CN1 group. The sum of squares due to errors (SSE), R-square (R2), and the root-mean-square error (RMSE) values were calculated to assess the quality of fit. Among them, R2 was proposed as the coherence coefficient, which was as an index to assess the correlation between SUVR value of the pattern and subjects' age. Subsequently, the model with the best quality of fit was assigned to the plotted SUVR and age obtained for the CN1 group to evaluate the change trend of Aβ deposition with aging. Forward validation was performed on the CN2 group.
Statistical Analysis
The quantitative results obtained with MATLAB were subjected to a statistical analysis using the SPSS software, version 18.0 (SPSS Inc., IBM Corporation, Chicago, USA). A two-sample t-test was performed to examine differences in continuous variables, and a Chi-square test was conducted to assess categorical variables. p < 0.05 was considered statistically significant. The Gramm toolbox in MATLAB was used for plotting and visualizing all of the statistical data presented in this paper (23).
Results
Demographic Characteristics of the Participants
Cohort A contained 378 time ponts of 207 CN subjects (1.83 ± 0.83 time points per subject). Cohort B included 76 time poits of 76 CN subjects (one time point per subject). Table 1 shows the demographic and clinical details of the two cohorts. As shown in Table 1, significant differences between cohort A and cohort B are observed in age (p < 0.001), sex (p = 0.0488) and education (p < 0.001). A slight difference is observed in sex(p = 0.049) and no significant difference in MMSE (p = 0.119). Considering the impact of brain atrophy and differences relating to the sex and education levels of the participants, we reported the results obtained after regressing the covariates of GM, sex, and the number of years of education.
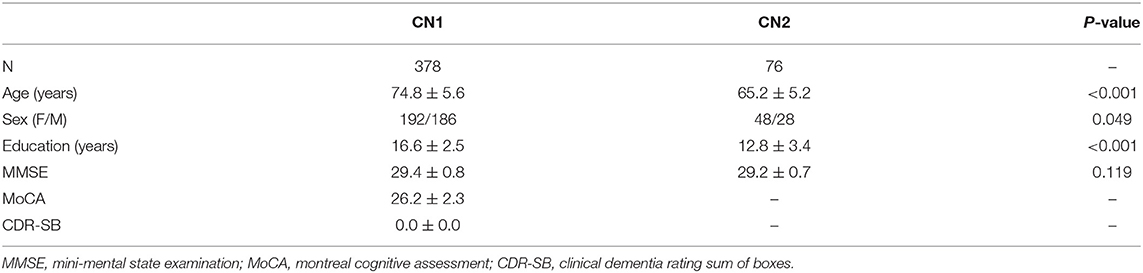
Table 1. Demographic and clinical characteristics of participants.
Voxel-Wise PET Analysis
Healthy Aging Pattern
The health aging pattern was identified in CN1 group. The results of the correlation analysis revealed that there was a healthy aging pattern characterized by age-associated longitudinal changes of Aβ deposition was mainly distributed in the right middle and inferior temporal gyrus, the right temporal pole: middle temporal gyrus, the right inferior occipital gyrus, the right inferior frontal gyrus (triangular portion), and the right precentral gyrus (Figure 2). No areas of the brain evidenced significantly decreased Aβ deposition (see Table 2 for details).
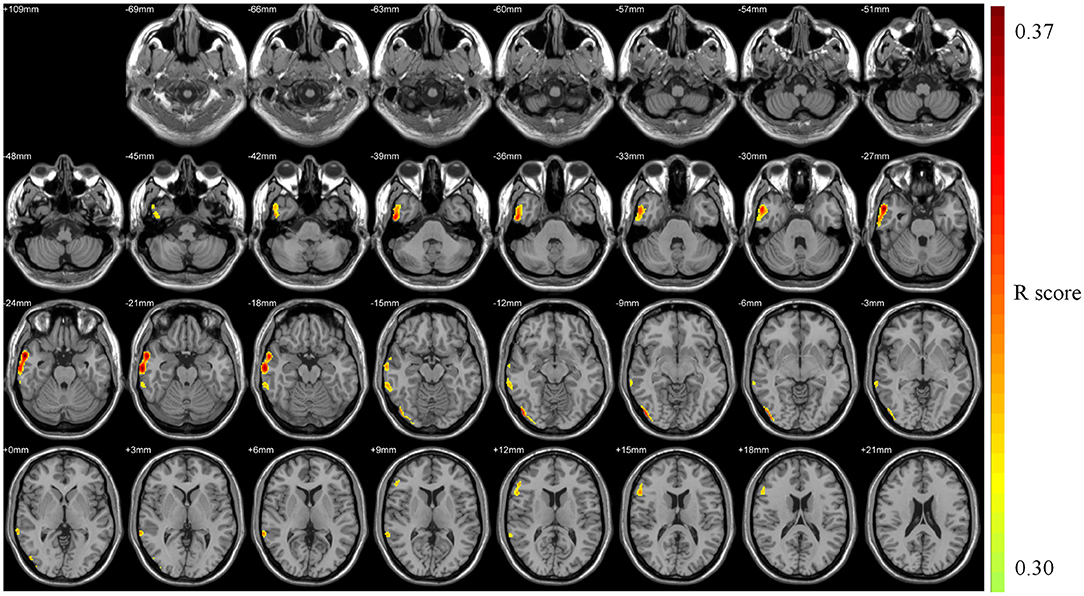
Figure 2. Pattern associated with longitudinal changes of Aβ deposition in cognitively normal adults (CN1) during the healthy aging. The red areas are those with significant increases in Aβ deposition associated with advancing age. No voxels were found that indicated significant decreases in Aβ deposition associated with advancing age.
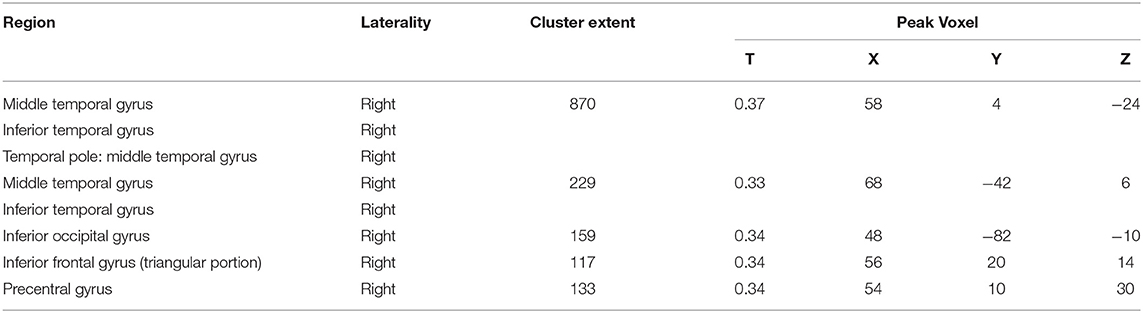
Table 2. Pattern associated with longitudinal changes of Aβ deposition in cognitively normal adults (CN1) during healthy aging.
Pattern Validation
The health aging pattern was further validated in CN2 group. Following the regression of the covariates of GM, sex, and years of education, SUVR value of the pattern showed a significant positive correlation with age (Figure 3), whereas SUVR value of global brain showed a weaker positive correlation with age (Figure 3) in the CN1 group. Table 3 shows the curve fit results for the SUVR of the pattern and age of the three models. Specific results were as follows: SSE = 18.549, R2 = 0.118, and RMSE = 0.222 for the linear model; SSE = 18.505, R2 = 0.120, and RMSE = 0.222 for the quadratic model; and SSE = 18.592, R2 = 0.116, and RMSE = 0.222 for the exponential model. The curve fit results for the SUVR of global brain and age for the three models were as follows: SSE = 12.459, R2 = 0.018, and RMSE = 0.182 for the linear model; SSE = 12.452, R2 = 0.019, and RMSE = 0.182 for the quadratic model; and SSE = 12.461, R2 = 0.018 and RMSE = 0.182 for the exponential model.
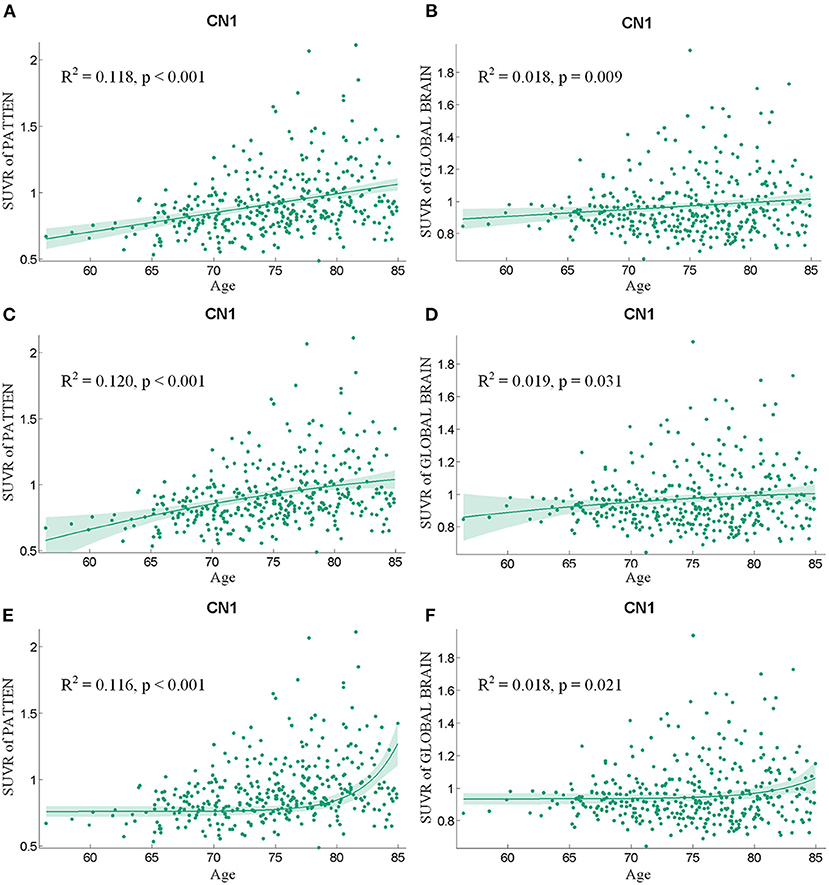
Figure 3. The findings of a correlation analysis of age and the SUVR values of the pattern (A,C,E) and the whole brain (B,D,F) of individuals in the CN1 group using linear, quadratic, and exponential model fitting, respectively.
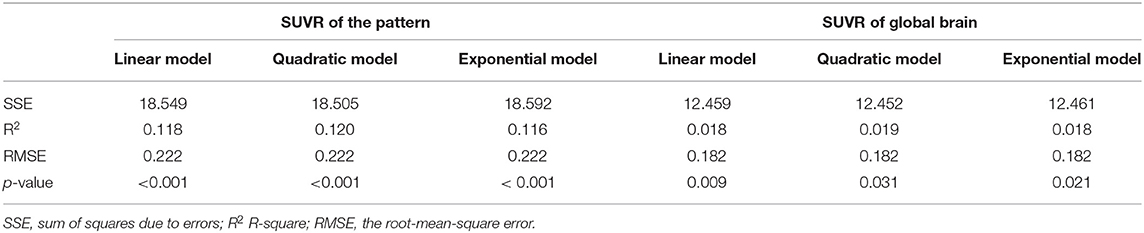
Table 3. The curve-fitting characteristics of SUVR value and age for the CN1 group.
Following the regression of the covariates of GM, sex, and educational years, the SUVR value of the pattern showed a significant positive correlation with age (Figure 4), whereas SUVR value of global brain showed no significant correlation with age (Figure 4) in the CN2 group. Table 4 shows the curve fit results for SUVR of the pattern and age for the three models. Specific results were as follows: SSE = 0.534, R2 = 0.127 and RMSE = 0.085 for the linear model; SSE = 0.526, R2 = 0.152 and RMSE = 0.085 for the quadratic model; SSE = 0.535, R2 = 0.136, and RMSE = 0.085 for the exponential model. The results for the curve fit of the SUVR of global brain and age were as follows: SSE = 0.502, R2 = 0.010, and RMSE = 0.082 for the linear model; SSE = 0.501, R2 = 0.011, and RMSE = 0.083 for the quadratic model; and SSE = 0.502, R2 = 0.010, and RMSE = 0.082 for the exponential model.
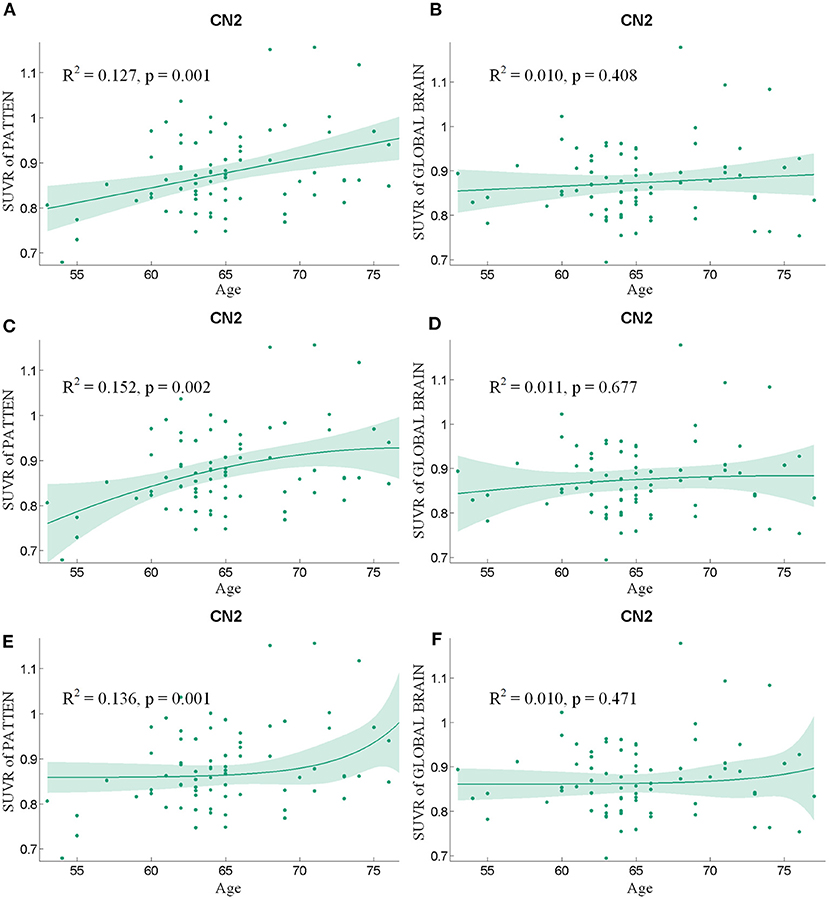
Figure 4. The findings of a correlation analysis of age and the SUVR values of the pattern (A,C,E) and the whole brain (B,D,F) of individuals in the CN2 group using linear, quadratic, and exponential model fitting respectively.
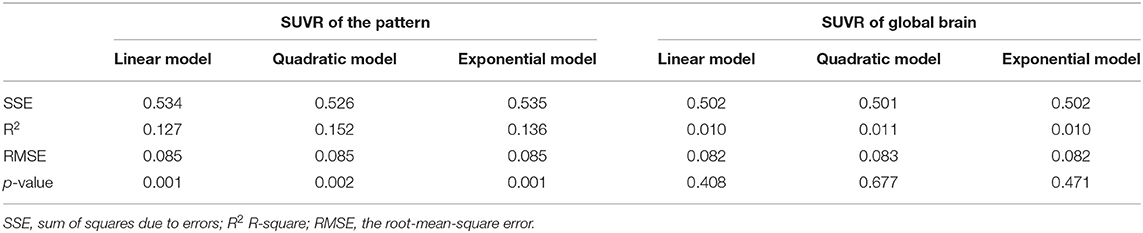
Table 4. The curve-fitting characteristics of SUVR value and age for the CN2 group.
Discussion
During the healthy aging of cognitively normal adults, SUVR value of a healthy aging pattern increased significantly. The pattern was mainly distributed in the right middle and inferior temporal gyrus, the right temporal pole: middle temporal gyrus, the right inferior occipital gyrus, the right inferior frontal gyrus (triangular portion), and the right precentral gyrus. A weak positive correlation was found between SUVR of global brain and age for the CN1 group, with no significant correlation existing for the CN2 group. These results indicate that during the healthy aging process of cognitively normal people, the increase in Aβ deposition is concentrated in specific brain regions rather than being distributed throughout the brain. In addition, the pattern shows a characteristic of asymmetric amyloid accumulation. Alteration in hemispheric asymmetry has been referenced in studies of healthy aging (24, 25). The Right hemi-aging model proposes that the right hemisphere presents greater aging than the left hemisphere (26, 27), so our results were consistent with previous studies.
The best fit curves for the SUVR value of the healthy aging pattern and age within each CN group reflected a change trend of increasing Aβ deposition on the pattern with increasing age and a subsequent decrease in the growth rate of Aβ deposition. This indicated significant changes in Aβ deposition in aging adults with normal cognition. However, when accumulated deposits of Aβ exceeded a certain threshold, leading to cognitive impairment, aging had weaker effect on Aβ deposition. This finding suggests that the baseline level of Aβ may differ for patients with AD. Moreover, as indicated by the findings of other studies, with the advancement of pathological conditions, Aβ deposition may reach a saturation point and will no longer exhibit a linear relationship with age (17, 28). This finding is supported by that of another study, which revealed that Aβ increases significantly in individuals with normal cognitive functions but that the rate of increase of Aβ slows down following the onset of cognitive impairment (16).
Considering our results together with the findings reported in the literature, we posit that the healthy aging pattern associated with longitudinal changes of Aβ deposition and characteristic regions associated with AD partially overlap, mainly including the middle and inferior temporal gyrus (29, 30) (Figure 5). The temporal lobe and occipital cortex are associated with auditory and visual functions (31). The rapid deposition of Aβ in the middle and inferior occipital gyrus and in the middle and inferior temporal gyrus may be one of the reasons why the auditory and visual fields are influenced by age-associated and neurochemical factors (32) and may reflect a decline in the multisensory integration capacity of older individuals (33). It may account for the importance of age as an influencing factor affecting the diagnosis of AD or early AD.
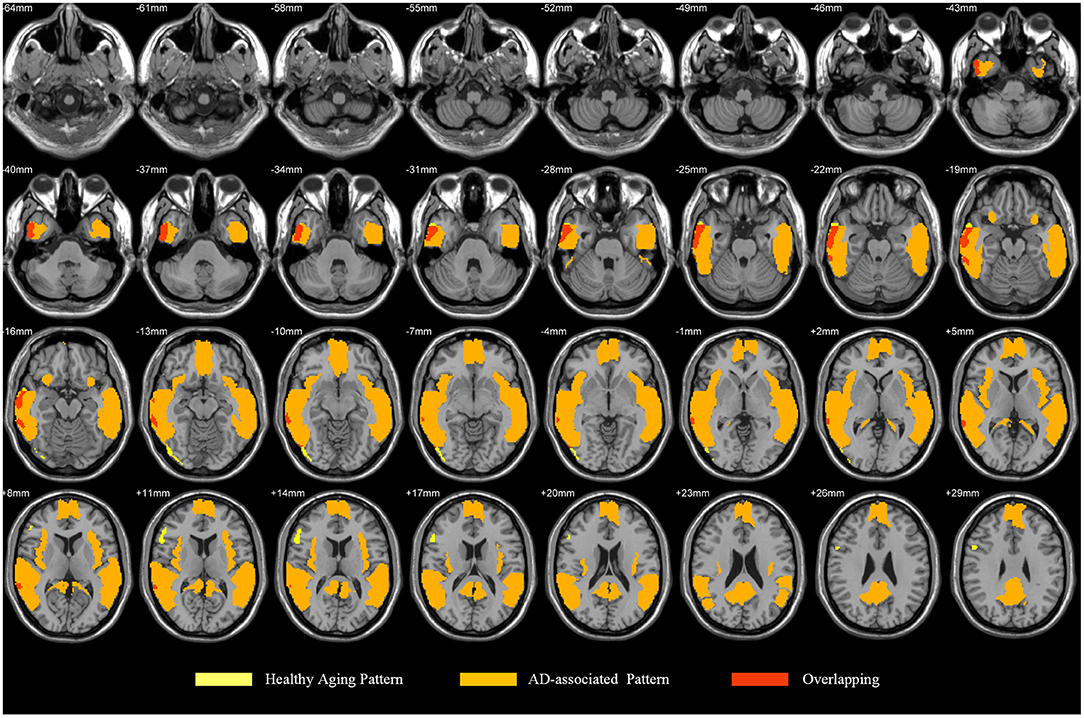
Figure 5. The overlap between our proposed pattern and AD parttern in previous studies.
Moreover, our results on age-associated changes of Aβ deposition could be explained from the perspective of molecular cytology. During the aging process, over-activated microglia may release neurotoxic molecules and pro-inflammatory cytokines, leading to neuronal death and inflammation and an accelerated process of Aβ deposition and accumulation (34, 35). Age-associated increases in microglial activation may contribute to the age-associated increase on Aβ deposition. Past research showed that significant age-associated increases in the total numbers of activated IL-1α+ microglia occurred in mesial temporal lobe (36). And the density of amyloid plaques in the temporal lobe is not related to memory level (37). Our findings on the healthy aging pattern were consistent with previous studies, suggesting that the increase in Aβ deposition promoted by normal aging in the temporal lobe were not caused from cognitive decline.
It should be noted that this study had some limitations. First, the datasets used for the study were limited. Although the pattern were identified and validated using data sourced from the ADNI and Xuanwu Hospital, multicenter research and autopsy results are required to confirm their universality. Second, age differences could be observed between the ADNI and Xuanwu Hospital in this study, and the average age of subjects from Xuanwu hospital was 9.4 years younger than ADNI. Although the correlation between SUVR of pattern and age were found in both cohorts, whether this correlation exsited in older Chinese CN population need be verified in the future. Third, this study was evidently a cross-sectional study, although follow-up data was available for its subjects. A longitudinal study should also be conducted in the future. In addition, the similarities and differences between AD-associated and healthy aging patterns merit further study. Finally, although we chose the entire cerebellum as the reference region for calculating the SUVR values, the selection of the reference region has long been a methodologically challenging issue within studies entailing PET imaging analysis. Future comparative studies of different reference regions are urgently required to develop a comprehensive understanding of this compound.
Conclusion
In summary, we performed a voxel-wise correlation analysis to identify a pattern associated with changes in β-amyloid deposition in cognitively normal adults during healthy aging. An assessment of the pattern advances understanding of processual changes entailed in brain aging. The changes in Aβ deposition associated with healthy aging that are reflected in age-associated longitudinal changes of Aβ deposition on specific brain regions are indicative of opportunities for diagnosis and strategies for decelerating aging. More generally, this study may reveal a pattern of changes in Aβ deposition that can be used to distinguish physiological changes from pathophysiological ones.
Data Availability Statement
The datasets presented in this study can be found in online repositories. The names of the repository/repositories and accession number(s) can be found in the article/supplementary material.
Ethics Statement
The studies involving human participants were reviewed and approved by the institutional review boards of ADNI and the Research Ethics Committee of Xuanwu Hospital, Beijing, China. The patients/participants provided their written informed consent to participate in this study.
Author Contributions
YX and QY are responsible for collecting data, designing experiment and writing article. CL and QZ are responsible for the experimental coding. JJ and YH are responsible for the guidance of the experiment and paper. All authors contributed to the article and approved the submitted version.
Funding
This study was supported by grants received from the National Natural Science Foundation of China (grant numbers 61633018, 82020108013, 61603236, and 81830059); the National Key Research and Development Program of China (grant numbers 2016YFC1306300, 2018YFC1312000, and 2018YFC1707704); the 111 Project (grant number D20031); the Shanghai Municipal Science and Technology Major Project (grant number 2017SHZDZX01); and the Beijing Municipal Commission of Health and Family Planning (grant number PXM2020_026283_000002). Data collection and dissemination for this project were funded by the Alzheimer's Disease Neuroimaging Initiative (ADNI): the National Institutes of Health (grant number U01 AG024904), and the Department of Defense (award number W81XWH-12-2-0012). ADNI is funded by the National Institute of Aging and the National Institute of Biomedical Imaging and Bioengineering as well as through generous contributions from the following organizations: AbbVie, Alzheimer's Association, Alzheimer's Drug Discovery Foundation, Araclon Biotech, BioClinica Inc., Biogen, Bristol-Myers Squibb Company, CereSpir Inc., Eisai Inc., Elan Pharmaceuticals Inc., Eli Lilly and Company, EuroImmun, F. Hoffmann-La Roche Ltd. and its affiliated company Genentech Inc., Fujirebio, GE Healthcare, IXICO Ltd., Janssen Alzheimer Immunotherapy Research & Development LLC., Johnson & Johnson Pharmaceutical Research & Development LLC., Lumosity, Lundbeck, Merck & Co. Inc., Meso Scale Diagnostics LLC., NeuroRx Research, Neurotrack Technologies, Novartis Pharmaceuticals Corporation, Pfizer Inc., Piramal Imaging, Servier, Takeda Pharmaceutical Company, and Transition Therapeutics. The Canadian Institutes of Health Research are providing funds to support ADNI clinical sites in Canada. Private sector contributions are facilitated by the Foundation for the National Institutes of Health (www.fnih.org). The grantee organization is the Northern California Institute for Research and Education, and the study is coordinated by the Alzheimer's Disease Cooperative Study at the University of California, San Diego, CA, USA. ADNI data are disseminated by the Laboratory for Neuro Imaging at the University of Southern California, CA, USA.
Conflict of Interest
The authors declare that the research was conducted in the absence of any commercial or financial relationships that could be construed as a potential conflict of interest.
References
1. Shiels PG, Steinvinkel P, Kooman JP, Mcguinness D. Circulating markers of ageing and allostatic load: a slow train coming. Pract Lab Med. (2017) 7:49–54. doi: 10.1016/j.plabm.2016.04.002
3. Rodrigue KM, Kennedy KM, Devous MD, Rieck JR, Hebrank AC, Diaz-Arrastia R, et al. β-Amyloid burden in healthy aging: regional distribution and cognitive consequences. Neurology. (2012) 78:387. doi: 10.1212/WNL.0b013e318245d295
4. Hardy JA, Higgins GA. Alzheimer's disease: the amyloid cascade hypothesis. Science. (1992) 256:184–5. doi: 10.1126/science.1566067
5. Armstrong RA. β-Amyloid (Aβ) deposition in elderly non-demented patients and patients with Alzheimer's disease. Neurosci Lett. (1994) 178:59–62. doi: 10.1016/0304-3940(94)90289-5
6. Aizenstein HJ, Nebes RD, Saxton JA, Price JC, Mathis CA, Tsopelas ND, et al. Frequent Amyloid Deposition Without Significant Cognitive Impairment Among the Elderly. Arch Neurol. (2008) 65:1509–17. doi: 10.1001/archneur.65.11.1509
7. Shaw LM, Vanderstichele H, Knapik-Czajka M, Clark CM, Trojanowski JQ. Cerebrospinal fluid biomarker signature in Alzheimer's disease neuroimaging initiative subjects. Ann Neurol. (2009) 65:403–13. doi: 10.1002/ana.21610
8. Sojkova J, Zhou Y, An Y, Kraut MA, Resnick SM. Longitudinal patterns of β-amyloid deposition in nondemented older adults. Arch Neurol. (2011) 68:644–9. doi: 10.1001/archneurol.2011.77
9. Price JL, Morris JC. Tangles and plaques in nondemented aging and “preclinical” Alzheimer's disease. Ann Neurol. (1999) 45:358–68. doi: 10.1002/1531-8249(199903)45:3<358::AID-ANA12>3.0.CO;2-X
10. Hélène A, Hélène JG, Jean-Marc O, Le CN, Catherine H, Luc L, et al. The 9 year cognitive decline before dementia of the Alzheimer type: a prospective population-based study. Brain. (2005) 128(Pt 5):1093–101. doi: 10.1093/brain/awh451
11. Rowe CC, Ellis KA, Rimajova M, Bourgeat P, Villemagne VL. Amyloid imaging results from the Australian Imaging, Biomarkers and Lifestyle (AIBL) study of aging. Neurobiol Aging. (2010) 31:1275–83. doi: 10.1016/j.neurobiolaging.2010.04.007
12. Villemagne VL, Burnham S, Bourgeat P, Brown B, Ellis KA, Salvado O, et al. Amyloid β deposition, neurodegeneration, and cognitive decline in sporadic Alzheimer's disease: a prospective cohort study. Lancet Neurol. (2013) 12:357–67. doi: 10.1016/S1474-4422(13)70044-9
13. Haroutunian V, Perl DP, Purohit DP, Marin D, Mohs RC. Regional distribution of neuritic plaques in the nondemented elderly and subjects with very mild Alzheimer disease. Arch Neurol. (1998) 55:1185–91. doi: 10.1001/archneur.55.9.1185
14. Wolf DS, Gearing M, Snowdon DA, Mori H, Markesbery WR, Mirra SS. Progression of regional neuropathology in Alzheimer disease and normal elderly: findings from the Nun study. Alzheimer Dis Assoc Disord. (1999) 13:226–31. doi: 10.1097/00002093-199910000-00009
15. Scheinin NM, Wikman K, Jula A, Perola M, Rinne JO. Cortical 11C-PIB Uptake is Associated with Age, APOE Genotype, and Gender in “Healthy Aging”. J Alzheimers Dis. (2014) 41:193–202. doi: 10.3233/JAD-132783
16. Patterson BW, Elbert DL, Mawuenyega KG, Kasten T, Ovod V, Ma S, et al. Age and amyloid effects on human central nervous system amyloid-beta kinetics. Ann Neurol. (2015) 78:439–53. doi: 10.1002/ana.24454
17. Jack CR, Lowe VJ, Senjem ML, Weigand SD, Kemp BJ, Shiung MM, et al. 11C PiB and structural MRI provide complementary information in imaging of Alzheimer's disease and amnestic mild cognitive impairment. Brain. (2008) 131(Pt 3):665–80. doi: 10.1093/brain/awm336
18. Clark CM, Schneider JA, Bedell BJ, Beach TG, Skovronsky DM. Use of florbetapir-PET for imaging beta-amyloid pathology. JAMA. (2011) 305:275–83. doi: 10.1001/jama.2010.2008
19. Camus V, Payoux P, Barré L, Desgranges B, Voisin T, Tauber C, et al. Using PET with 18F-AV-45 (florbetapir) to quantify brain amyloid load in a clinical environment. Eur J Nucl Med Mol Imaging. (2012) 39:621–31. doi: 10.1007/s00259-011-2021-8
20. Choi SR, Golding G, Zhuang Z, Zhang W, Lim N. Preclinical Properties of 18F-AV-45: a PET agent for Aβ plaques in the brain. J Nucl Med. (2009) 50:1887. doi: 10.2967/jnumed.109.065284
21. Lin KJ, Hsu WC, Hsiao IT, Wey SP, Kung MP. Whole-body biodistribution and brain PET imaging with [18F]AV-45, a novel amyloid imaging agent—a pilot study. Nucl Med Biol. (2010) 37:497–508. doi: 10.1016/j.nucmedbio.2010.02.003
22. Chen K, Roontiva A, Thiyyagura P, Lee W, Liu X, Ayutyanont N, et al. Improved power for characterizing longitudinal amyloid-β PET changes and evaluating amyloid-modifying treatments with a cerebral white matter reference region. J Nucl Med. (2015) 56:560. doi: 10.2967/jnumed.114.149732
23. Morel P. Gramm: grammar of graphics plotting in Matlab. J Open Source Softw. (2018) 3:568. doi: 10.21105/joss.00568
24. Woodard JL, Sugarman MA. Functional magnetic resonance imaging in aging and dementia: detection of age-related cognitive changes and prediction of cognitive decline. Curr Top Behav Neurosci. (2011) 10:113–36. doi: 10.1007/7854_2011_159
25. Long X, Zhang L, Jiang C, Zhang H. Age effect on structural hemispheric asymmetry revealed by multivariate model. J Integration Technol. (2016). Available online at: https://en.cnki.com.cn/Article_en/CJFDTotal-JCJI201603001.html
26. Brown JW, Jaffe J. Hypothesis on cerebral dominance. Neuropsychologia. (1975) 13:107–10. doi: 10.1016/0028-3932(75)90054-8
27. Albert MS. Geriatric neuropsychology. J Consult Clin Psychol. (1981) 49:835–50. doi: 10.1037/0022-006X.49.6.835
28. Henry E, Anton F, Ove A, Gunnar B, Emma L, Irina S, et al. Two-year follow-up of amyloid deposition in patients with Alzheimer's disease. Brain. (2006) 129(Pt 11):2856–66. doi: 10.1093/brain/awl281
29. Shin J, Lee SY, Kim SJ, Kim SH, Cho SJ, Kim YB. Voxel-based analysis of Alzheimer's disease PET imaging using a triplet of radiotracers: PIB, FDDNP, and FDG. NeuroImage. (2010) 52:488–96. doi: 10.1016/j.neuroimage.2010.04.013
30. Cho Y, Um YH, Kim TW, Seo HJ, Jeong JH, Hong SC, et al. A voxel wise analysis of cerebral beta amyloid retention in healthy controls and subjects with amnestic mild cognitive impairment and Alzheimer's Disease. J Korean Geriatr Psychiatry. (2016) 20:75–9. doi: 10.0000/jkgp.2016.20.2.75
31. Micheli C, Schepers IM, Ozker M, Yoshor D, Beauchamp MS, Rieger JW. Electrocorticography reveals continuous auditory and visual speech tracking in temporal and occipital cortex. Eur J Neurosci. (2018) 51:1364–76. doi: 10.1111/ejn.13992
32. Kondo HM, Kochiyama T. Normal aging slows spontaneous switching in auditory and visual bistability. Neuroscience. (2017) 389:152–60. doi: 10.1016/j.neuroscience.2017.04.040
33. Beer AL, Tina P, Georg M, Greenlee MW. Combined diffusion-weighted and functional magnetic resonance imaging reveals a temporal-occipital network involved in auditory-visual object processing. Front Integr Neurosci. (2013) 7:5. doi: 10.3389/fnint.2013.00005
34. Mrak RE, Griffin WST. Glia and their cytokines in progression of neurodegeneration. Neurobiology of Aging. (2005) 26:349–54. doi: 10.1016/j.neurobiolaging.2004.05.010
35. Sastre M, Walter J, Gentleman SM. Interactions between APP secretases and inflammatory mediators. J Neuroinflammation. (2008) 5:25. doi: 10.1186/1742-2094-5-25
36. Sheng JG, Mrak RE, Griffin WST. Enlarged and phagocytic, but not primed, interleukin-1α-immunoreactive microglia increase with age in normal human brain. Acta Neuropathol (Berl). (1998) 95:229–34. doi: 10.1007/s004010050792
Keywords: healthy aging, 18F-AV-45 PET, β-amyloid deposition, brain, pattern
Citation: Xie Y, Yang Q, Liu C, Zhang Q, Jiang J, Han Y and the Alzheimer's Disease Neuroimaging Initiative (2021) Exploring the Pattern Associated With Longitudinal Changes of β-Amyloid Deposition During Cognitively Normal Healthy Aging. Front. Med. 7:617173. doi: 10.3389/fmed.2020.617173
Received: 14 October 2020; Accepted: 14 December 2020;
Published: 13 January 2021.
Edited by:
Xiu Ying Wang, The University of Sydney, AustraliaReviewed by:
Susanne Asenbaum-Nan, Lower Landeskliniken-Holding, AustriaZhen Cheng, Stanford University, United States
Copyright © 2021 Xie, Yang, Liu, Zhang, Jiang, Han and the Alzheimer's Disease Neuroimaging Initiative. This is an open-access article distributed under the terms of the Creative Commons Attribution License (CC BY). The use, distribution or reproduction in other forums is permitted, provided the original author(s) and the copyright owner(s) are credited and that the original publication in this journal is cited, in accordance with accepted academic practice. No use, distribution or reproduction is permitted which does not comply with these terms.
*Correspondence: Jiehui Jiang, amlhbmdqaWVodWlAc2h1LmVkdS5jbg==; Ying Han, aGFueWluZ0B4d2guY2NtdS5lZHUuY24=
†These authors have contributed equally to this work