 Xiao Li1,2†
 Kaichen Zhou1†
 Jingyu Wang1†
 Jiahe Guo1
 Yang Cao3Jie Ren1Tao Guan4Wenchao Sheng1Mingyao Zhang1
 Zhi Yao1,5
 Quan Wang1*
- 1Key Laboratory of Immune Microenvironment and Disease of the Educational Ministry of China, Tianjin Key Laboratory of Cellular and Molecular Immunology, Department of Immunology, School of Basic Medical Sciences, Tianjin Medical University, Tianjin, China
- 2Xuzhou Key Laboratory of Laboratory Diagnostics, School of Medical Technology, Xuzhou Medical University, Xuzhou, China
- 3Department of Clinical Laboratory, The Second Hospital of Tianjin Medical University, Tianjin, China
- 4China Unicom Software Research Institute, Xi'an, China
- 52011 Collaborative Innovation Center of Tianjin for Medical Epigenetics, Tianjin Medical University, Tianjin, China
Urinary tract infections (UTIs) are one of the most common infectious diseases. UTIs are mainly caused by uropathogenic Escherichia coli (UPEC), and are either upper or lower according to the infection site. Fimbriae are necessary for UPEC to adhere to the host uroepithelium, and are abundant and diverse in UPEC strains. Although great progress has been made in determining the roles of different types of fimbriae in UPEC colonization, the contributions of multiple fimbriae to site-specific attachment also need to be considered. Therefore, the distribution patterns of 22 fimbrial genes in 90 UPEC strains from patients diagnosed with upper or lower UTIs were analyzed using PCR. The distribution patterns correlated with the infection sites, an XGBoost model with a mean accuracy of 83.33% and a mean area under the curve (AUC) of the receiver operating characteristic (ROC) of 0.92 demonstrated that fimbrial gene distribution patterns could predict the localization of upper and lower UTIs.
Introduction
Urinary tract infections (UTIs) are one of the most common infectious diseases (1), and are predominantly caused by uropathogenic Escherichia coli (UPEC) (2). UTIs are classified as either upper (pyelonephritis and ureteritis) or lower (cystitis and urethritis) according to the infection site (3–5). Lower UTIs usually induce cystitis and can progress into upper UTIs, resulting in pyelonephritis and ultimately renal failure. A urinalysis positive for elevated leukocytes and a urinary culture positive for bacteria reinforce the clinical diagnosis of a UTI (6). The clinical symptoms are commonly regarded as the standard to differentiate the site of infections (7). UTIs are usually treated with antibiotics (8). Because of many factors such as underlying diseases, status of patient, antibiotic susceptibility, medication history, and infection sites (9), the therapies and medications used for upper and lower UTIs are different, so reasonable and accurate antibiotic use seems particularly important in the clinical treatment.
Machine learning is the core of artificial intelligence (AI) and the fundamental way to make computers intelligent. Artificial intelligence algorithms can go beyond human reasoning and build diagnostic models from a series of complex combinations to provide a more sensitive tool to discriminate among different conditions. In addition to successful application in anatomical (10) and functional imaging (11), machine learning techniques have also been successfully applied to identify bacterial species to differentiate the microbiomes of elders with Alzheimer's disease from those without dementia (12) and to predict personalized glycemic response to exercise by integrating baseline microbial signatures (13). When deep learning approaches were applied to bacterial Raman spectra, 30 common clinically relevant bacterial pathogens and their empiric treatments were accurately identified (14). The combination of LC-MS/MS and machine learning allows rapid and specific identification of 15 bacterial species representing 84% of all urinary tract infections (15). Furthermore, machine learning algorithms combined with a large dataset accurately diagnosed positive urine culture results (16).
UPEC express a variety of virulence factors, including fimbriae, toxins, iron-acquisition systems, metabolic enzymes, flagella, and surface polysaccharide structures (17, 18). Fimbriae are expressed on the bacterial surface and mediate several biological functions, including adhesion, invasion, and biofilm formation. Several types of fimbriae have been described in gram-positive and gram-negative bacteria (19). In gram-negative bacteria, the chaperone-usher (CU) fimbriae are most abundant. Thirty-eight distinct CU fimbrial operons have been identified in E. coli genomes, and 22 fimbrial gene clusters are distributed among the analyzed UPEC strains, with eight to 13 different gene clusters in a single UPEC strain (20). UPEC use a variety of fimbriae to adhere to the urethral epithelium, thereby promoting colonization and exerting its virulence in site-specific UTIs. For example, type 1 fimbriae, encoded by the fim operon, mediate UPEC colonization and invasion of bladder epithelial cells (21, 22), targeted therapeutic small inhibitor molecules and vaccines have fast-acting efficacy in treating UTIs in preclinical murine models (23–25). F9 fimbriae recognize uromodulin on the surface of the bladder epithelium through adhesin FmlH and participated in the occurrence of chronic cystitis (26). Yad fimbrial adhesin YadC promotes acute cystitis by interacting with the receptor ANXA2 on the bladder epithelium (27). In addition, P fimbriae are associated with acute pyelonephritis (28). Ygi fimbriae are necessary for adhesion to kidney epithelium, biofilm formation and in vivo fitness in kidneys (29). In most previous studies, the importance of a single type of fimbriae in lower and upper UTI pathogenesis is demonstrated. However, few studies have examined the combined effect of multiple fimbriae. Notably, deletion of both type 1 and F17-like fimbriae in a single strain produced lower intestinal fitness than either individual deletion (24), suggesting that each type of fimbriae has a different function in adherence or binding to a different site. Due to findings that different fimbriae can be used to type UPEC strains (30–32), this work sought to determine whether combined multiple fimbrial genes of UPEC could be used as targets to identify the localization of upper and lower UTIs.
Most predictive models for UTIs use a few variables such as urine dipstick or urinalysis results (33, 34), however, fimbriae have not been used in the diagnosis of UTI localization. Therefore, in this study, to explore the value of UPEC fimbriae in the diagnosis of infection sites, the distribution patterns of 22 fimbriae genes in clinically isolated UPEC strains and their relations to UTI localization were analyzed. The distribution patterns of the 22 fimbrial genes were correlated with the infection sites, demonstrating predictive value for the localization of upper and lower UTIs. Thus, a new method to identify the site of UTIs was created with innovative use of machine learning regarding UPEC fimbriae.
Materials and Methods
Bacterial Strains
A total of 144 UPEC strains were collected from patients diagnosed with UTIs at the Clinical Microbiology Laboratory of the Second Hospital of Tianjin Medical University (Tianjin, China) from 2014 to 2019. The laboratory criteria for infection were that the growth of a single E. coli strain in number >105 CFU/mL or between 103 and 105 CFU/mL with >30 white blood cells/field in centrifuged urine. The strains were isolated from adult patients who presented with clinical syndromes, and the clinical information about the patients was obtained by review of their medical records. The studies involving human participants were reviewed and approved by the Ethics Committee of Tianjin Medical University. The patients provided their written informed consent to participate in this study.
The lower UTI group included 85 patients with acute uncomplicated cystitis. Diagnostic criteria included dysuria, urgency, and frequency, with or without suprapubic pain and hematuria; absence of flank pain; and fever <38°C.The upper UTI group included 59 patients with acute uncomplicated pyelonephritis. Diagnostic criteria included fever >38°C and flank pain, usually accompanied by lower urinary symptoms and sometimes by nausea, vomiting, and chills. The urine specimens of patients were obtained by clean catch voided midstream urine. Urine samples were cultured at 37°C in 5% CO2 overnight on blood agar plates (Hopebio, Qingdao, China), and then, a single colony was picked and identified using a VITEK MS full-braking microbial mass spectrometry detection system (bioMérieux, Inc., France). All UPEC strains used in this study are listed in Supplementary Table 1. The UPEC strains were cultured at 37°C overnight in Luria-Bertani broth.
DNA Extraction
Two milliliters of the overnight bacterial cultures were collected, and the bacterial genome was extracted using a TIANamp Bacteria DNA kit (DP302, Tiangen, Beijing, China). The extracted genome was dissolved in sterile water, and DNA concentration was measured using a Nanodrop spectrophotometer (Thermo Fisher, Waltham, MA, USA). The DNA was frozen at −20°C until use.
Gene Amplification
The genes encoding the usher proteins were amplified using the primers listed in Table 1, as previously described (31). A total of 30 μL of reaction mixture was used, and the end-point PCR setup was the following: denaturation at 95°C for 50 s, annealing for 45 s, extension at 72°C for 1 min, and a final extension at 72°C for 5 min. The annealing temperatures were different for the 22 genes, as shown in Table 1.
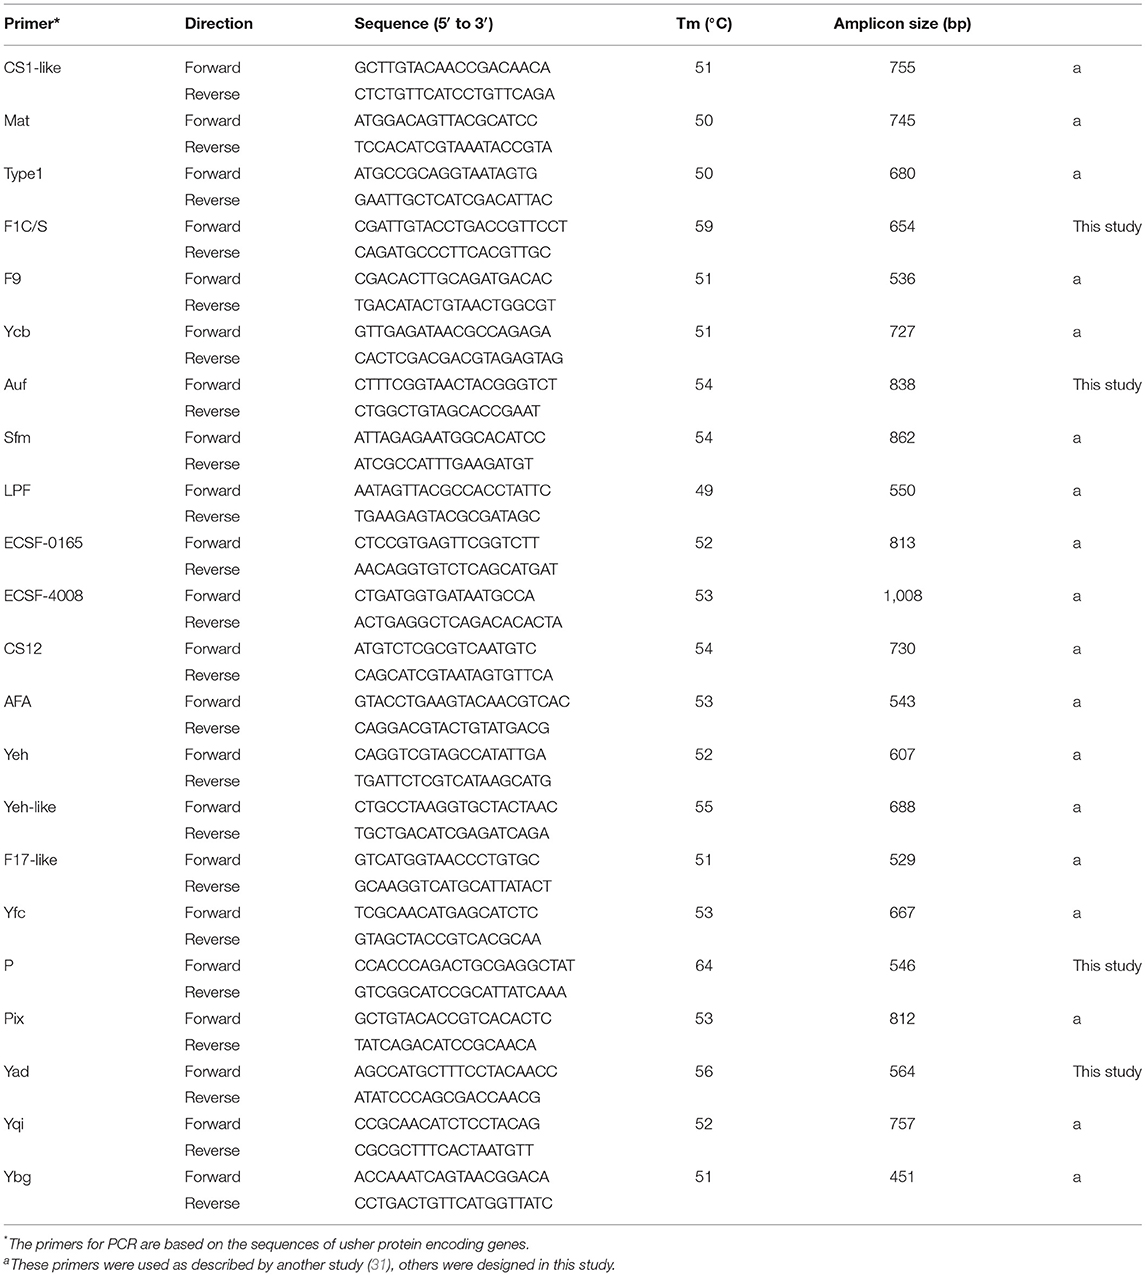
Table 1. Primers for PCR.
Cluster Analysis
The presence or absence of each of the 22 fimbrial genes in each strain was confirmed by PCR, and “presence” and “absence” were scored as “1” and “0,” respectively. A binary matrix was then constructed to investigate whether the distribution patterns of the 22 fimbrial genes were associated with the infection site. Clusters were formed sequentially by starting with the most similar pair of objects and forming higher clusters step-by-step. Then, squared Euclidean distances were used to calculate the difference and Ward's method was used to evaluate the distances between the clusters (35). The cluster analysis was visualized with a dendrogram.
XGBoost
XGBoost (extreme gradient boosting), an implementation of gradient boosting machines, has recently been a dominating algorithm for its ability to model non-linear associations and general acceptance in machine learning (16, 36, 37). Measures including model training and evaluation were performed on Python 3.8.1 with xgboost package. The area under the curve (AUC) of the receiver operating characteristic (ROC) was used as the primary measure of model prediction (38). Diagnostic accuracy was defined as the proportion of all tests that gave a correct result. Five-fold cross-validation was conducted to evaluate the classifier performance, which was the process of rearranging the data so as to ensure that each fold was a good representative of the whole. Briefly, all 90 strains were divided into five equal parts, one of which was used as the validation set and the other four as the training set. Then, each fold was regarded once as the validation set, with the other four parts as the training set; after repeating the process five times, the average value was obtained. The AUC and ROC curve for each fold are presented, with the average AUC and ROC curve shown in black. A permutation test (n = 10,000) was used to determine the statistical significance of the model. The ranking of the real test statistic among the shuffled test statistics determined the p-value.
Statistical Analyses
Descriptive statistics were used for outcomes. To analyze the ratios of different fimbrial genes and the relations with UTI infection sites, chi-square and Fisher tests were used. To account for multiple comparisons, a Bonferroni adjusted p-value (0.05/22 = 0.00227) was used to indicate statistical significance.
Results
Distribution Patterns of 22 Fimbrial Genes Were Correlated With Infection Site
The study design is shown in Figure 1. First, the genomic DNA extracted from the UPEC isolates of patients was examined by PCR for the presence or absence of genes encoding usher proteins of the 22 fimbrial types. The primers are listed in Table 1. Partial agarose gel electrophoresis results are shown in Supplementary Figure 1. The “presence” and “absence” status were regarded as “1” and “0” respectively, in a binary matrix, and the distribution patterns of the 22 fimbrial genes of each strain were changed into a string of numbers (Supplementary Table 1). Therefore, 144 characteristics (number strings) were obtained from the 144 UPEC strains. However, many of the characteristics were duplicated within the upper and lower UTI groups. For example, in the upper UTI group, the No. 3 and No. 5 strains had the same characteristic of “0101111111110001000001upper,” and in the lower UTI group, the No. 88 and No. 90 strains had the same characteristic of “0000011001001001001011lower.” Although the same bacteria were commonly isolated from different patients, the duplicate data could affect the efficiency of the machine learning model. Therefore, a total of 40 strains with the same characteristics were deleted, 19 from the upper UTI group and 21 from the lower UTI group. As a result, 104 UPEC strains remained.
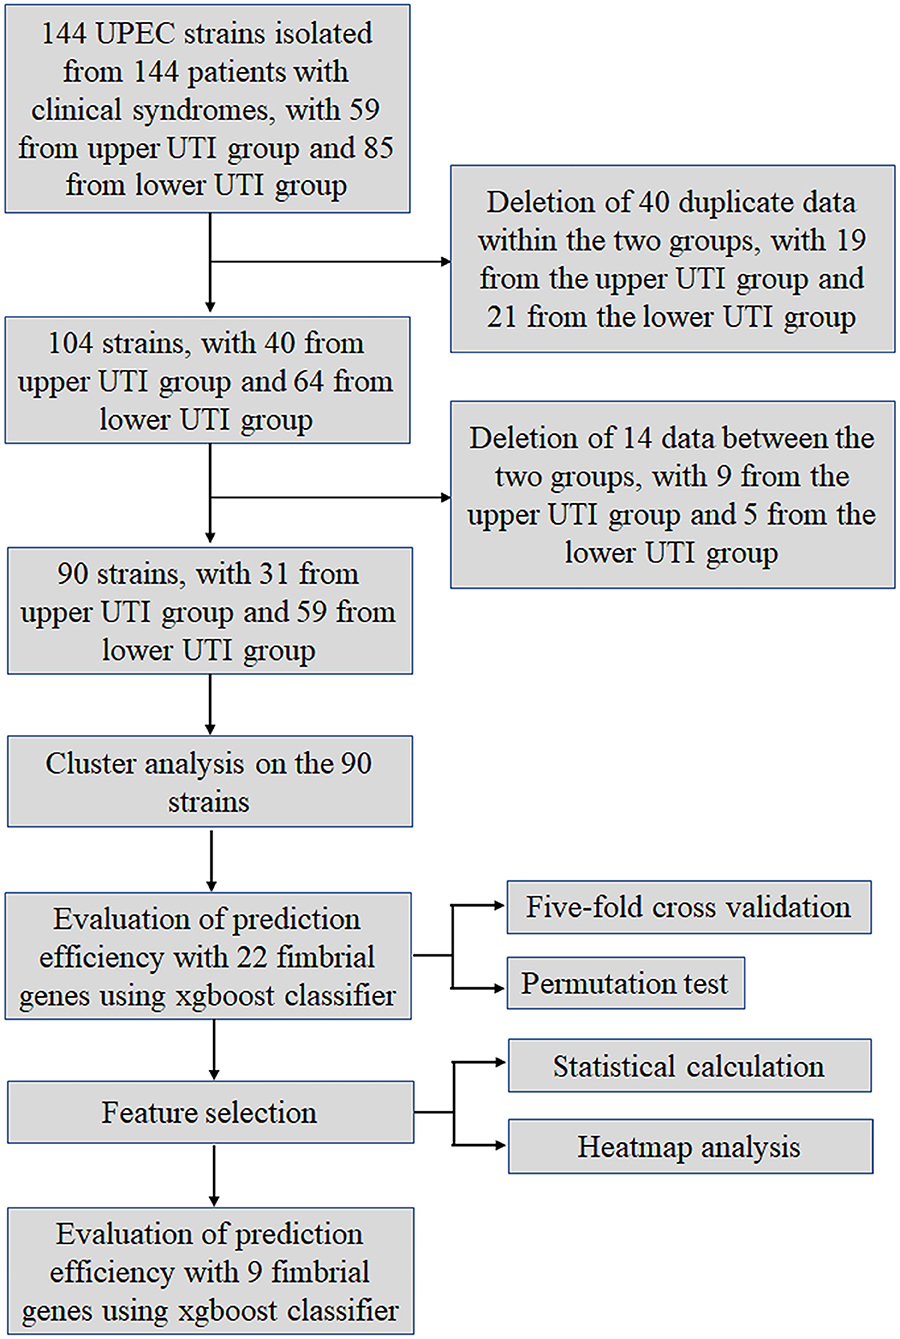
Figure 1. Work flow diagram.
Cluster analysis of the 104 strains was performed using the Euclidean distance and Ward's linkage method (35). The dendrogram of the analysis showed the strains were divided into two groups (Supplementary Figure 2). However, the 104 strains were not completely unique to one of the two groups, that is, some strains in the different groups had the same characteristics, as shown in the red frame. For example, the characteristic of strains No. 7 and No. 63 were shown as “0000011111000001100001upper” and “0000011111000001100001lower,” respectively (Supplementary Table 1). Thus, the distribution of the 22 fimbrial genes was the same, with the only difference that No. 7 came from the upper UTI group, while No. 63 came from the lower UTI group. There were 14 strains from each group that had the same situation. The most likely explanation for this situation was misjudgment by doctors when making the diagnosis. However, although the machine learning model had difficulty analyzing these data, it was not acceptable to simply eliminate all 28 contradictory data sets. Therefore, according to the position of the 28 strains in the dendrogram, five strains were deleted and nine strains were retained in the lower UTI group, while nine strains were deleted and five strains were retained in the upper UTI group. The 14 retained strains are indicated with an asterisk. Thus, 14 strains were deleted, leaving 90 strains for further analysis.
According to the similarity between clusters using Ward's method and Euclidean distance, the 90 strains were classified into two groups (Figure 2). The left cluster contained 31 strains, including 24 from the upper UTI group (77.42%, shown in red) and seven from the lower UTI group (22.58%). The right cluster contained the other 59 strains, including 52 from the lower UTI group (88.14%) and seven from the upper UTI group (11.86%, shown in red). Therefore, on the basis of the distribution patterns of the 22 fimbrial genes, the 90 strains were classified into two UTI groups, indicating distribution patterns could be used to predict the infection site.
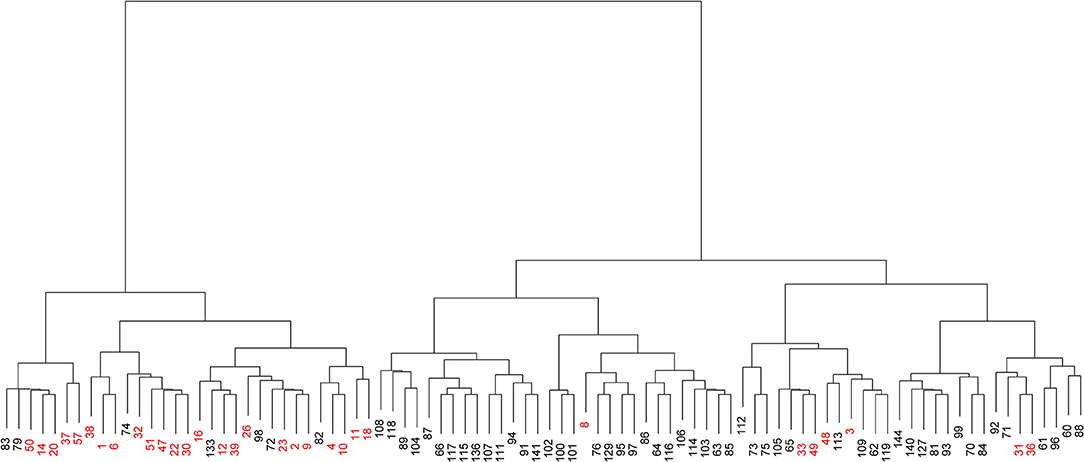
Figure 2. Visualized cluster dendrogram of the distribution patterns of 22 fimbrial genes from 90 strains of uropathogenic Escherichia coli (UPEC). Strains from the upper urinary tract infection (UTI) group are shown in red.
Evaluation of Prediction Efficiency With 22 Fimbrial Genes
To demonstrate the predictive value, the performance of fimbrial genes distribution for discriminating the infection site was evaluated using machine learning. A model using an extreme gradient boosting algorithm was developed (37), and its predictive performance was assessed using ROC analysis and the AUC of the ROC. The effectiveness was evaluated with 5-fold cross validation from the XGBoost classifier, that is, the 90 sets of data were randomly divided into 5-folds. The ROC curves were averaged for each fold, and final mean AUC and accuracy were calculated. As shown, the XGBoost classifier achieved a mean accuracy of 83.33% and a mean AUC of 0.92 (Figure 3A).
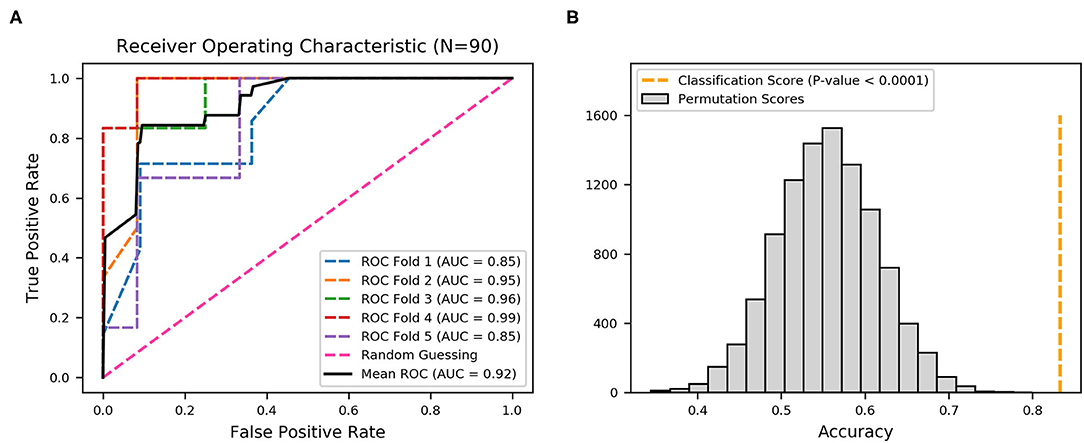
Figure 3. Receiver operating characteristic (ROC) curves produced from 22 fimbrial genes using an XGBoost classifier. (A) Five-fold cross-validation to evaluate classifier performance. Area under the curve (AUC) and ROC curve for each fold are presented in different colors, and the average AUC and ROC curve are in black. (B) Permutation test (n = 10,000) was performed to calculate the statistical significance of the model; the orange dotted line represents the final mean accuracy of the model.
The statistical significance of the analysis was evaluated by permutation test in which the final mean accuracy of the method was compared with an empirical distribution of accuracy values obtained by 10,000 permutations of the random labels. As shown in Figure 3B, the permutation scores were all lower than the classification score (mean accuracy of 83.33%, orange dotted line), with p-value < 0.0001, thereby demonstrating high performance in the classification of the derivation of the UPEC strains. Thus, the distribution patterns of the 22 fimbrial genes had the predictive value in identifying upper and lower UTIs.
Evaluation of Prediction Efficiency After Feature Selection
Moreover, the statistical calculation regarding the ratios of different fimbriae and their relevance to the upper and lower UTIs was performed. The significance level was set as p < 0.05/22 by Bonferroni correction, and the fimbriae F9, Ycb, Sfm, Yeh-like, Yfc, Ygi, Ybg, ECSF-0165, and F17-like were significantly associated with one of the two groups of UTIs (Table 2). A black and white grid was used to directly display the presence or absence of the 22 fimbrial genes, with black representing positive status of a gene and white representing negative status. The fimbrial genes F9, Yfc, Ygi, ECSF-0165, and F17-like mostly occurred in the upper UTI group, whereas Ycb, Sfm, Yeh-like, and Ybg mostly occurred in the lower UTI group (Figure 4). Then, whether these nine fimbrial genes of the 90 strains could achieve better prediction efficiency than that of the 22 fimbrial genes was evaluated. However, using the distributions of these nine fimbrial genes, the classifier achieved a mean accuracy of 83.33% and a mean AUC of 0.88 (Figure 5). Therefore, the prediction efficiency with the nine genes was similar to and not better than that of the model with 22 fimbrial genes.
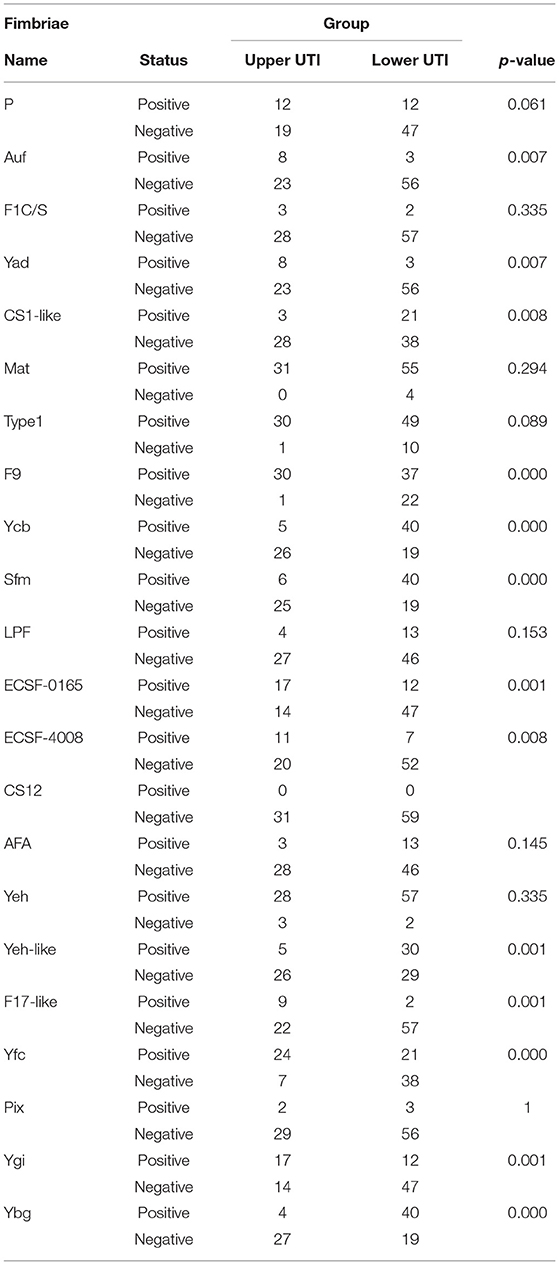
Table 2. Statistical calculation regarding the ratio of different fimbriae and the relevance to the UTIs.
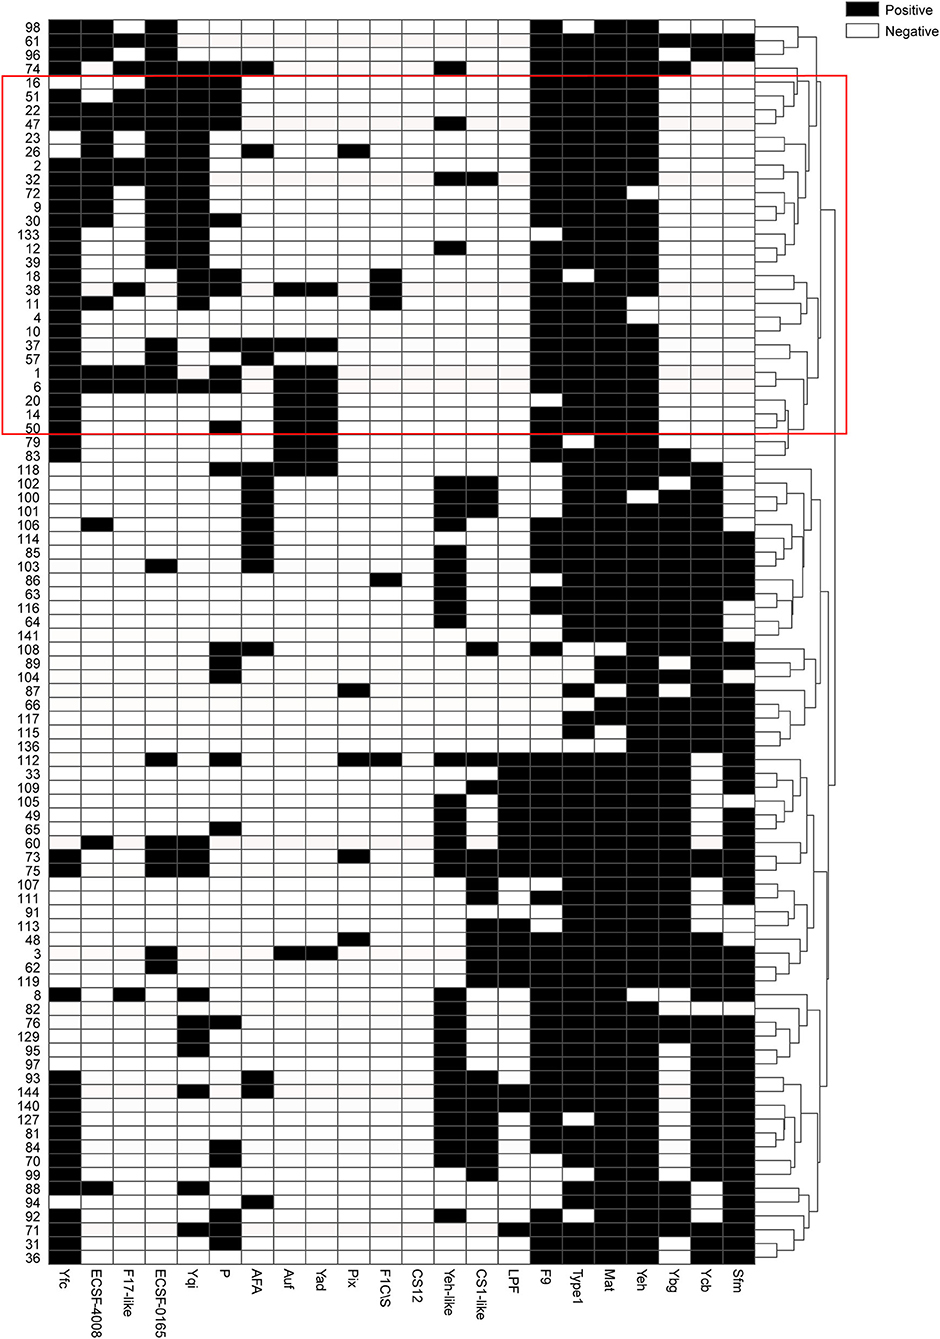
Figure 4. Black and white grid of the distribution patterns of 22 fimbrial genes from 90 strains. Black represents positive status of a gene, whereas white represents negative status of a gene. The 22 fimbrial genes are in columns, and the 90 strains are in rows. The tree on the right shows clustering of the 90 strains, with strains from the upper urinary tract infection group mostly in the red box.
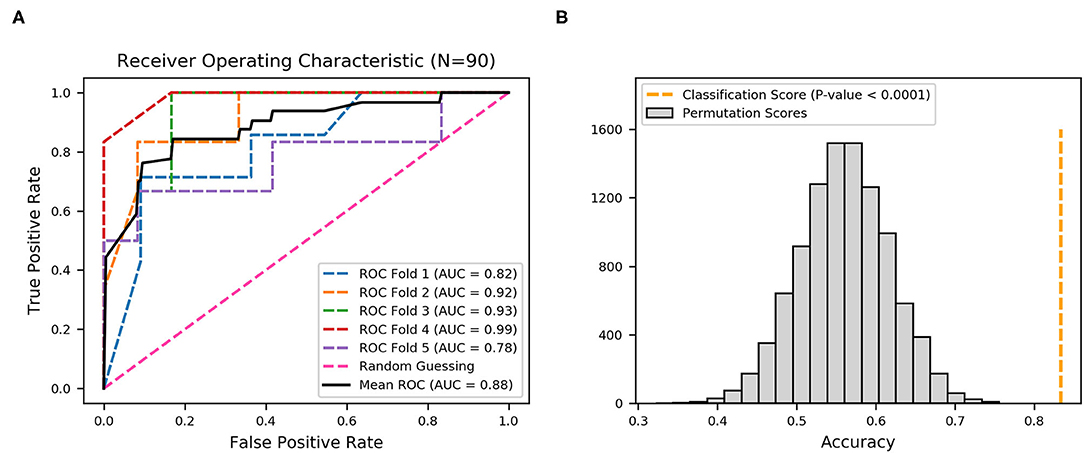
Figure 5. Receiver operating characteristic (ROC) curves produced from nine fimbrial genes after feature selection using XGBoost. (A) Five-fold cross-validation to evaluate classifier performance. Area under the curve (AUC) and ROC curve for each fold are in different colors, and the mean AUC and ROC curve are in black. (B) Permutation test (n = 10,000), with orange dotted line representing the final mean accuracy of the model.
Thus, the distribution patterns of the 22 fimbrial genes could be used to classify upper and lower UTIs. Among the 22 fimbriae types, F9, Yfc, Ygi, ECSF-0165, and F17-like, as well as Ycb, Sfm, Yeh-like, and Ybg, might be critical in distinguishing between upper and lower UTIs. In addition, the characteristic of CS12 was negative in all 90 strains, indicating that CS12 fimbriae rarely exist in UPEC strains causing UTIs.
Discussion
Although clinical symptoms can indicate UTIs, only 50–60% of women with dysuria had bacterial UTIs (39). As noted previously, most predictive models for UTIs use a few variables like urine dipstick, urinalysis, or clinical diagnosis. However, there are many limitations. For example, there is currently no consensus accepted level for a positive urine culture with a range from 102 to 105 CFU/mL, and clinical diagnosis maybe relatively subjective. Urinary tract infections are common infectious diseases primarily caused by UPEC, which use fimbriae to adhere to the urethral epithelium, thereby promoting colonization of host cells (40). Although great progress has been made in determining the roles of some fimbriae types in UPEC colonization, there is also little understanding of the roles of other fimbrial types, and whether the combinations of multiple fimbrial types is meaningful in the pathogenesis of UPEC-induced UTIs.
In this study, initially, the hypothesis whether combined multiple fimbrial genes of UPEC could be used to identify the localization of upper and lower UTIs was tested using Ward's method, which is an unsupervised cluster method. Distinct clusters were identified according to the distribution patterns of the 22 fimbrial genes in the UPEC strains. Unsupervised method, however, with lower interpretability, was not suitable to construct a classification model of upper and lower UTIs. By contrast, machine learning based on an XGBoost algorithm is suitable for handling binary classification with stable performance (41, 42). Therefore, a model based on an XGBoost algorithm and multi-fimbriae of UPEC was creatively developed to discriminate upper and lower UTIs. Whereas, the model with 22 fimbrial genes achieved a mean AUC of 0.92 with average accuracy of 83.33%, the model with nine fimbrial genes had a mean AUC of 0.88 with the same average accuracy. Both two model results were statistically significant, demonstrating that distributions of fimbrial genes could discriminate infection sites. Although the AUC of the model with 22 fimbrial genes (AUC = 0.92) was slightly higher than that of the model with nine fimbrial genes (AUC = 0.88), the performance of the model with nine fimbrial genes was similar while also reducing the number of variables after feature selection. In practice, the model with fewer variables may be more easily accepted. Several distinctive features of machine learning, including high mathematical dependence, great classification functioning, and well-behaved fitting, make it superior to traditional methods in the processing of information. Advances in machine learning, coupled with training on large datasets, can improve the accuracy in diagnosing UTIs. However, to be effective, machine learning-based models require further prospective validation. Moreover, empirical antibiotic therapy in UTI treatment results in the abuse of antibiotics and promotes the emergence of multi-drug resistant bacteria. In the future, machine learning could be used to improve drug sensitivity or screen novel antimicrobial targets to develop next-generation therapeutics, and by increasing understanding of the patterns of fimbrial genes, this work could also contribute to the development of fimbriae-based non-antibiotic treatment strategies.
This study also showed that nine fimbriae types might be critical in distinguishing between upper and lower UTIs, that is, F9, Yfc, Ygi, ECSF-0165, and F17-like were mostly in UPEC strains from upper UTIs, while Ycb, Sfm, Yeh-like, and Ybg were mostly in those from the lower UTIs. Among the nine fimbriae types, UPEC F9 fimbriae promote biofilm formation (43), and the tip adhesin FmlH provides a fitness advantage for UPEC colonization of inflamed bladders during chronic cystitis (26); UPEC Ygi fimbriae are necessary for adherence to a kidney cell line, biofilm formation, and in vivo fitness in kidneys (29); and F17-like fimbriae promote UPEC intestinal colonization (24); when expressed, E. coli K12 yfc, ycb, sfm, and ybg operons promote adhesion to abiotic and epithelial cell surfaces (44). By contrast, the roles of ECSF-0165 and Yeh-like fimbriae have not yet been determined. In most studies, the occurrence of P fimbriae is 60–90%. For example, 91% (33/35) of the urinary strains causing acute pyelonephritis have P fimbriae (45). However, in the current study, P fimbriae were not well-represented. Three possible reasons could explain their absence: (1) samples were obtained from UTI patients in a single clinical center rather than multiple centers; (2) in the US and Europe, most UPEC strains are from the B2 clade, whereas in East Asia, clade D strains predominate in community-acquired UTIs, followed by B2 strains (46); and (3) previous epidemiological data mainly analyzed the spectrum of infection many years ago, and no recent data are available for comparison. In addition to CU fimbriae, the co-occurrence of other fimbriae families may be meaningful in the identification of infection sites. In the future, research should be conducted on the specific roles and mechanisms of these multiple fimbriae families in the pathogenesis of UTIs. An understanding of the interference or synergy between the adhesion of UPEC fimbriae and other surface adhesins may also provide better targeting therapies for UTI treatment.
Urinary tract infections are currently clinically treated with antibiotics, but the excessive use of antibiotics and the emergence of multi-drug resistant bacteria require urgent development of alternative remedies. The effective alternative remedies to fight UPEC include vaccines, probiotics, estrogens, D-mannose, and D-mannose-derived FimH antagonists (47). D-mannose-derived FimH antagonists can markedly prevent the occurrence of UTIs and recurrent UTIs by selectively depleting intestinal UPEC reservoirs (24). Anti-adhesion strategies are considered to be a promising targeted therapy. Understanding the distribution pattern of fimbriae is fundamental to the development of alternative strategies. Although a completely accurate prediction could not be obtained in this study because of the small sample size, a new method was developed that can potentially identify the site of UTIs, representing an innovative attempt to apply machine learning to predict localization of UTIs. However, the models were built on data from a single hospital within a confined geographic region, and therefore require further validation using strains from other institutions. In addition, the study used symptoms to group the patients and conducted the “machine learning,” while lacking an accurate way to confirm whether a UTI was limited to the lower urinary tract or not. Fresh samples should also be collected for further model validation. In the future, models could be developed using large-scale databases, and machine learning could be employed to accurately predict infection sites using the distribution patterns of 22 fimbrial genes in UPEC strains, which would aid clinicians in their diagnoses, as well as reduce testing cost and improve the quality of life.
Data Availability Statement
The original contributions presented in the study are included in the article/Supplementary Material, further inquiries can be directed to the corresponding author.
Ethics Statement
The studies involving human participants were reviewed and approved by the Ethics Committee of Tianjin Medical University. The patients/participants provided their written informed consent to participate in this study.
Author Contributions
XL wrote the main manuscript text. KZ, JW, JG, JR, TG, WS, and MZ performed the experiments. YC provided the UPEC strains. ZY supervised the experimental framework. QW supervised the analyses. All authors have read and agreed to the published version of the manuscript.
Funding
This study was supported by the grant from Tianjin Science and Technology Commissioner Project (18JCZDJC36000, 18JCYBJC93000) and the Science & Technology Development Fund of Tianjin Education Commission for Higher Education (2017ZD12).
Conflict of Interest
The authors declare that the research was conducted in the absence of any commercial or financial relationships that could be construed as a potential conflict of interest.
Acknowledgments
We thank the Second Hospital of Tianjin Medical University for providing the UPEC strains.
Supplementary Material
The Supplementary Material for this article can be found online at: https://www.frontiersin.org/articles/10.3389/fmed.2021.602691/full#supplementary-material
References
1. Stamm WE, Norrby SR. Urinary tract infections: disease panorama and challenges. J Infect Dis. (2001) 183:S1–4. doi: 10.1086/318850
2. Flores-Mireles AL, Walker JN, Caparon M, Hultgren SJ. Urinary tract infections: epidemiology, mechanisms of infection and treatment options. Nat Rev Microbiol. (2015) 13:269–84. doi: 10.1038/nrmicro3432
3. Hannan TJ, Totsika M, Mansfield KJ, Moore KH, Schembri MA, Hultgren SJ. Host-pathogen checkpoints and population bottlenecks in persistent and intracellular uropathogenic Escherichia coli bladder infection. FEMS Microbiol Rev. (2012) 36:616–48. doi: 10.1111/j.1574-6976.2012.00339.x
4. Hooton TM. Clinical practice. Uncomplicated urinary tract infection. N Engl J Med. (2012) 366:1028–37. doi: 10.1056/NEJMcp1104429
5. Foxman B. Urinary tract infection syndromes: occurrence, recurrence, bacteriology, risk factors, disease burden. Infect Dis Clin North Am. (2014) 28:1–13. doi: 10.1016/j.idc.2013.09.003
6. Mehnert-Kay SA. Diagnosis and management of uncomplicated urinary tract infections. Am Fam Physician. (2005) 72:451–6.
7. Lussu M, Camboni T, Piras C, Serra C, Del Carratore F, Griffin J, et al. (1)H NMR spectroscopy-based metabolomics analysis for the diagnosis of symptomatic E. coli-associated urinary tract infection (UTI). BMC Microbiol. (2017) 17:201. doi: 10.1186/s12866-017-1108-1
8. Kronenberg A, Butikofer L, Odutayo A, Muhlemann K, da Costa BR, Battaglia M, et al. Symptomatic treatment of uncomplicated lower urinary tract infections in the ambulatory setting: randomised, double blind trial. BMJ. (2017) 359:j4784. doi: 10.1136/bmj.j4784
9. Asadi Karam MR, Habibi M, Bouzari S. Urinary tract infection: pathogenicity, antibiotic resistance and development of effective vaccines against Uropathogenic Escherichia coli. Mol Immunol. (2019) 108:56–67. doi: 10.1016/j.molimm.2019.02.007
10. Pereira S, Pinto A, Alves V, Silva CA. Brain tumor segmentation using convolutional neural networks in MRI images. IEEE Trans Med Imaging. (2016) 35:1240–51. doi: 10.1109/TMI.2016.2538465
11. Collij LE, Heeman F, Kuijer JP, Ossenkoppele R, Benedictus MR, Möller C, et al. Application of machine learning to arterial spin labeling in mild cognitive impairment and Alzheimer disease. Radiology. (2016) 281:865–75. doi: 10.1148/radiol.2016152703
12. Haran JP, Bhattarai SK, Foley SE, Dutta P, Ward DV, Bucci V, et al. Alzheimer's disease microbiome is associated with dysregulation of the anti-inflammatory p-glycoprotein pathway. mBio. (2019) 10:e00632–19. doi: 10.1128/mBio.00632-19
13. Liu Y, Wang Y, Ni Y, Cheung CKY, Lam KSL, Wang Y, et al. Gut microbiome fermentation determines the efficacy of exercise for diabetes prevention. Cell Metabol. (2020) 31:77–91. doi: 10.1016/j.cmet.2019.11.001
14. Ho CS, Jean N, Hogan CA, Blackmon L, Jeffrey SS, Holodniy M, et al. Rapid identification of pathogenic bacteria using Raman spectroscopy and deep learning. Nat Commun. (2019) 10:4927. doi: 10.1038/s41467-019-12898-9
15. Roux-Dalvai F, Gotti C, Leclercq M, Hélie M-C, Boissinot M, Arrey TN, et al. Fast and accurate bacterial species identification in urine specimens using LC-MS/MS mass spectrometry and machine learning. Mol Cell Proteom. (2019) 18:2492–505. doi: 10.1074/mcp.TIR119.001559
16. Taylor RA, Moore CL, Cheung KH, Brandt C. Predicting urinary tract infections in the emergency department with machine learning. PLoS ONE. (2018) 13:e0194085. doi: 10.1371/journal.pone.0194085
17. Nielubowicz GR, Mobley HL. Host-pathogen interactions in urinary tract infection. Nat Rev Urol. (2010) 7:430–41. doi: 10.1038/nrurol.2010.101
18. Bien J, Sokolova O, Bozko P. Role of uropathogenic Escherichia coli virulence factors in development of urinary tract infection and kidney damage. Int J Nephrol. (2012) 2012:681473. doi: 10.1155/2012/681473
19. Proft T, Baker EN. Pili in Gram-negative and Gram-positive bacteria - structure, assembly and their role in disease. Cell Mol Life Sci. (2009) 66:613–35. doi: 10.1007/s00018-008-8477-4
20. Wurpel DJ, Beatson SA, Totsika M, Petty NK, Schembri MA. Chaperone-usher fimbriae of Escherichia coli. PLoS ONE. (2013) 8:e52835. doi: 10.1371/journal.pone.0052835
21. Mulvey MA, Lopez-Boado YS, Wilson CL, Roth R, Parks WC, Heuser J, et al. Induction and evasion of host defenses by type 1-piliated uropathogenic Escherichia coli. Science. (1998) 282:1494–7. doi: 10.1126/science.282.5393.1494
22. Martinez JJ, Mulvey MA, Schilling JD, Pinkner JS, Hultgren SJ. Type 1 pilus-mediated bacterial invasion of bladder epithelial cells. EMBO J. (2000) 19:2803–12. doi: 10.1093/emboj/19.12.2803
23. Cusumano CK, Pinkner JS, Han Z, Greene SE, Ford BA, Crowley JR, et al. Treatment and prevention of urinary tract infection with orally active FimH inhibitors. Sci Transl Med. (2011) 3:109ra115. doi: 10.1126/scitranslmed.3003021
24. Spaulding CN, Klein RD, Ruer S, Kau AL, Schreiber HL, Cusumano ZT, et al. Selective depletion of uropathogenic E. coli from the gut by a FimH antagonist. Nature. (2017) 546:528–32. doi: 10.1038/nature22972
25. Mydock-McGrane L, Cusumano Z, Han Z, Binkley J, Kostakioti M, Hannan T, et al. Antivirulence C-mannosides as antibiotic-sparing, oral therapeutics for urinary tract infections. J Med Chem. (2016) 59:9390–408. doi: 10.1021/acs.jmedchem.6b00948
26. Conover MS, Ruer S, Taganna J, Kalas V, De G., reve H, Pinkner JS, et al. Inflammation-induced adhesin-receptor interaction provides a fitness advantage to Uropathogenic E. coli during chronic infection. Cell Host Microbe. (2016) 20:482–92. doi: 10.1016/j.chom.2016.08.013
27. Li X, Pei G, Zhang L, Cao Y, Wang J, Yu L, et al. Compounds targeting YadC of uropathogenic Escherichia coli and its host receptor annexin A2 decrease bacterial colonization in bladder. EBioMedicine. (2019) 50:23–33. doi: 10.1016/j.ebiom.2019.11.014
28. Lane MC, Mobley HL. Role of P-fimbrial-mediated adherence in pyelonephritis and persistence of uropathogenic Escherichia coli (UPEC) in the mammalian kidney. Kidney Int. (2007) 72:19–25. doi: 10.1038/sj.ki.5002230
29. Spurbeck RR, Stapleton AE, Johnson JR, Walk ST, Hooton TM, Mobley HL. Fimbrial profiles predict virulence of uropathogenic Escherichia coli strains: contribution of ygi and yad fimbriae. Infect Immun. (2011) 79:4753–63. doi: 10.1128/IAI.05621-11
30. Dias RCS, Moreira BM, Riley LW. Use of fimH single-nucleotide polymorphisms for strain typing of clinical isolates of Escherichia coli for epidemiologic investigation. J Clin Microbiol. (2009) 48:483–8. doi: 10.1128/JCM.01858-09
31. Ren Y, Palusiak A, Wang W, Wang Y, Li X, Wei H, et al. A high-resolution typing assay for uropathogenic Escherichia coli based on fimbrial diversity. Front Microbiol. (2016) 7:623. doi: 10.3389/fmicb.2016.00623
32. Weissman SJ, Johnson JR, Tchesnokova V, Billig M, Dykhuizen D, Riddell K, et al. High-resolution two-locus clonal typing of extraintestinal pathogenic Escherichia coli. Appl Environ Microbiol. (2012) 78:1353–60. doi: 10.1128/AEM.06663-11
33. Little P, Turner S, Rumsby K, Warner G, Moore M, Lowes JA, et al. Developing clinical rules to predict urinary tract infection in primary care settings: sensitivity and specificity of near patient tests (dipsticks) and clinical scores. British J Gen Pract. (2006) 56:606–12.
34. McIsaac WJ, Moineddin R, Ross S. Validation of a decision aid to assist physicians in reducing unnecessary antibiotic drug use for acute cystitis. Arch Intern Med. (2007) 167:2201–6. doi: 10.1001/archinte.167.20.2201
35. Ward JH. Hierarchical grouping to optimize an objective function. J Am Stat Assoc. (1963) 58:236–44. doi: 10.1080/01621459.1963.10500845
36. Urban G, Tripathi P, Alkayali T, Mittal M, Jalali F, Karnes W, et al. Deep learning localizes and identifies polyps in real time with 96% accuracy in screening colonoscopy. Gastroenterology. (2018) 155:1069–78. doi: 10.1053/j.gastro.2018.06.037
37. Chen T, Guestrin C. XGBoost: a scalable tree boosting system. In: Proceedings of the 22nd ACM SIGKDD International Conference on Knowledge Discovery and Data Mining, Association for Computing Machinery. San Francisco, CA (2016). p. 785–94. doi: 10.1145/2939672.2939785
38. Mazurowski MA, Habas PA, Zurada JM, Lo JY, Baker JA, Tourassi GD. Training neural network classifiers for medical decision making: the effects of imbalanced datasets on classification performance. Neural Netw. (2008) 21:427–36. doi: 10.1016/j.neunet.2007.12.031
39. Stamm WE, Counts GW, Running KR, Fihn S, Turck M, Holmes KK. Diagnosis of coliform infection in acutely dysuric women. N Engl J Med. (1982) 307:463–8. doi: 10.1056/NEJM198208193070802
40. Waksman G, Hultgren SJ. Structural biology of the chaperone-usher pathway of pilus biogenesis. Nat Rev Microbiol. (2009) 7:765–74. doi: 10.1038/nrmicro2220
41. Ji X, Tong W, Liu Z, Shi T. Five-feature model for developing the classifier for synergistic vs. antagonistic drug combinations built by XGBoost. Front Genet. (2019) 10:600. doi: 10.3389/fgene.2019.00600
42. Layeghian Javan S, Sepehri MM, Layeghian Javan M, Khatibi T. An intelligent warning model for early prediction of cardiac arrest in sepsis patients. Comput Methods Programs Biomed. (2019) 178:47–58. doi: 10.1016/j.cmpb.2019.06.010
43. Ulett GC, Mabbett AN, Fung KC, Webb RI, Schembri MA. The role of F9 fimbriae of uropathogenic Escherichia coli in biofilm formation. Microbiology. (2007) 153:2321–31. doi: 10.1099/mic.0.2006/004648-0
44. Korea CG, Badouraly R, Prevost MC, Ghigo JM, Beloin C. Escherichia coli K-12 possesses multiple cryptic but functional chaperone-usher fimbriae with distinct surface specificities. Environ Microbiol. (2010) 12:1957–77. doi: 10.1111/j.1462-2920.2010.02202.x
45. Källenius G, Möllby R, Svenson SB, Helin I, Hultberg H, Cedergren B, et al. Occurrence of P-fimbriated Escherichia coli in urinary tract infections. Lancet. (1981) 2:1369–72. doi: 10.1016/S0140-6736(81)92797-5
46. Schreiber Lt H, Conover MS, Chou WC, Hibbing ME, Manson AL, Dodson KW, et al. Bacterial virulence phenotypes of Escherichia coli and host susceptibility determine risk for urinary tract infections. Sci Transl Med. (2017) 9:aaf1283. doi: 10.1126/scitranslmed.aaf1283
Keywords: upper urinary tract infections, lower urinary tract infections, UPEC, fimbriae, machine learning, XGBoost
Citation: Li X, Zhou K, Wang J, Guo J, Cao Y, Ren J, Guan T, Sheng W, Zhang M, Yao Z and Wang Q (2021) Diagnostic Value of the Fimbriae Distribution Pattern in Localization of Urinary Tract Infection. Front. Med. 8:602691. doi: 10.3389/fmed.2021.602691
Received: 05 October 2020; Accepted: 26 May 2021;
Published: 18 June 2021.
Edited by:
Leonardo Neves de Andrade, University of São Paulo, BrazilReviewed by:
Thomas Hannan, Washington University in St. Louis, United StatesJuan Xicohtencatl-Cortes, Instituto Nacional de Salud, Mexico
Jakob Møller-Jensen, University of Southern Denmark, Denmark
Mana Oloomi, Pasteur Institute of Iran (PII), Iran
Copyright © 2021 Li, Zhou, Wang, Guo, Cao, Ren, Guan, Sheng, Zhang, Yao and Wang. This is an open-access article distributed under the terms of the Creative Commons Attribution License (CC BY). The use, distribution or reproduction in other forums is permitted, provided the original author(s) and the copyright owner(s) are credited and that the original publication in this journal is cited, in accordance with accepted academic practice. No use, distribution or reproduction is permitted which does not comply with these terms.
*Correspondence: Quan Wang, d2FuZ3F1YW5AdG11LmVkdS5jbg==
†These authors have contributed equally to this work