 Alessia Blundo
 Arianna Cignoni
 Tommaso Banfi
 Gastone Ciuti
- 1The BioRobotics Institute, Scuola Superiore Sant'Anna, Pisa, Italy
- 2Department of Excellence in Robotics & AI, Scuola Superiore Sant'Anna, Pisa, Italy
Melanoma has the highest mortality rate among skin cancers, and early-diagnosis is essential to maximize survival rate. The current procedure for melanoma diagnosis is based on dermoscopy, i.e., a qualitative visual inspection of lesions with intrinsic limited diagnostic reliability and reproducibility. Other non-invasive diagnostic techniques may represent valuable solutions to retrieve additional objective information of a lesion. This review aims to compare the diagnostic performance of non-invasive techniques, alternative to dermoscopy, for melanoma detection in clinical settings. A systematic review of the available literature was performed using PubMed, Scopus and Google scholar databases (2010-September 2020). All human, in-vivo, non-invasive studies using techniques, alternative to dermoscopy, for melanoma diagnosis were included with no restriction on the recruited population. The reference standard was histology but dermoscopy was accepted only in case of benign lesions. Attributes of the analyzed studies were compared, and the quality was evaluated using CASP Checklist. For studies in which the investigated technique was implemented as a diagnostic tool (DTA studies), the QUADAS-2 tool was applied. For DTA studies that implemented a melanoma vs. other skin lesions classification task, a meta-analysis was performed reporting the SROC curves. Sixty-two references were included in the review, of which thirty-eight were analyzed using QUADAS-2. Study designs were: clinical trials (13), retrospective studies (10), prospective studies (8), pilot studies (10), multitiered study (1); the remain studies were proof of concept or had undefined study type. Studies were divided in categories based on the physical principle employed by each diagnostic technique. Twenty-nine out of thirty-eight DTA studies were included in the meta-analysis. Heterogeneity of studies' types, testing strategy, and diagnostic task limited the systematic comparison of the techniques. Based on the SROC curves, spectroscopy achieved the best performance in terms of sensitivity (93%, 95% CI 92.8–93.2%) and specificity (85.2%, 95%CI 84.9–85.5%), even though there was high concern regarding robustness of metrics. Reflectance-confocal-microscopy, instead, demonstrated higher robustness and a good diagnostic performance (sensitivity 88.2%, 80.3–93.1%; specificity 65.2%, 55–74.2%). Best practice recommendations were proposed to reduce bias in future DTA studies. Particular attention should be dedicated to widen the use of alternative techniques to conventional dermoscopy.
Introduction
Malignant melanoma (MM) represents 4% of all cancerous skin lesions and shows the highest crude mortality rate (i.e., 2.9 (1) in USA and 3.6 (1) in Europe, per 100,000 persons, in 2018). To maximize the survival rate, an early diagnosis is essential as current therapeutic options are very effective if promptly adopted (2). Moreover, treatment costs rise with time as the pathology remains untreated, ranging from $4,648 for an in-situ melanoma to about $159,808 for a stage IV melanoma (3). The current procedure for the inspection of skin lesions, i.e., dermoscopy, is predominantly qualitative and mainly relies on the visual analysis of each lesion's features. To aid clinicians, a set of standardized diagnostic algorithms are available, such as the 7-points checklist (4) or the ABCDE rule (5). It is known that dermoscopy is dependent upon the examiner's experience and upon the geographical area (6–9). Skvara et al. (8) reported that using the conventional thresholds of the ABCD rule (ABCD score >4.75) and the 7-point checklist (7-point score >2), sensitivity of the ABCD rule was 31.7% with a corresponding specificity of 87.3%, and the sensitivity of the 7-point checklist was 11.1% with a corresponding specificity of 95.2%. Another review (10) reported a 90% sensitivity (95% CI: 80–95%) and 90% specificity (95% CI: 57–98%), achieved by a clinical examination aided by dermoscopy, indicating how dermoscopy can improve clinical examination performance in diagnosing of primary melanoma. Recently, dermoscopy benefitted from the technical evolution of imaging and digital cameras. The use of these new technologies allowed the creation of the so called video-dermoscopy (i.e., digital epiluminescence), paving the way to the application of this diagnostic technique for telemedicine approaches, simplifying the sharing of clinical images, and facilitating follow-up of unclear lesions (11). The current gold standard for melanoma diagnosis is the administration of dermoscopy, followed by a biopsy and subsequent histopathological analysis of the excised tissue. To minimize the risk of misdiagnosis of true melanomas, a significant number of dermoscopically ambiguous lesions are biopsied rising the overall diagnostic costs and time to obtain the final diagnosis. A drawback of dermoscopy is that it allows to obtain only morphological information about a lesion. Beside dermoscopy, other non-invasive diagnostic techniques are available (12, 13). These techniques may be exploited to gain additional information about a lesion, possibly enhancing diagnostic accuracy and reliability. The adoption of different techniques in combination with, or as an alternative to dermoscopy, may increase diagnostic accuracy and clinician's ability to correctly classify skin lesions and assure a prompt melanoma diagnosis in clinical settings.
The aim of this review is to compare the diagnostic accuracy of non-invasive techniques for melanoma detection in clinical setting. Included techniques can be used in combination with or as alternatives to dermoscopy.
Materials and Methods
This review of scientific literature followed the methodological guidelines contained in the PRISMA statement (14) for Diagnostic Accuracy Test (DTA) (PROSPERO protocol ID 184123 (15)). A systematic search of the available literature was performed using PubMed, Scopus, and Google scholar databases (time period included 2010-September 2020). The following search query was used: (“melanoma” OR “skin cancer”) AND (“diagnosis” OR “detection”) AND “non-invasive”. The PRISMA diagram outlining the literature review process is presented in Figure 1.
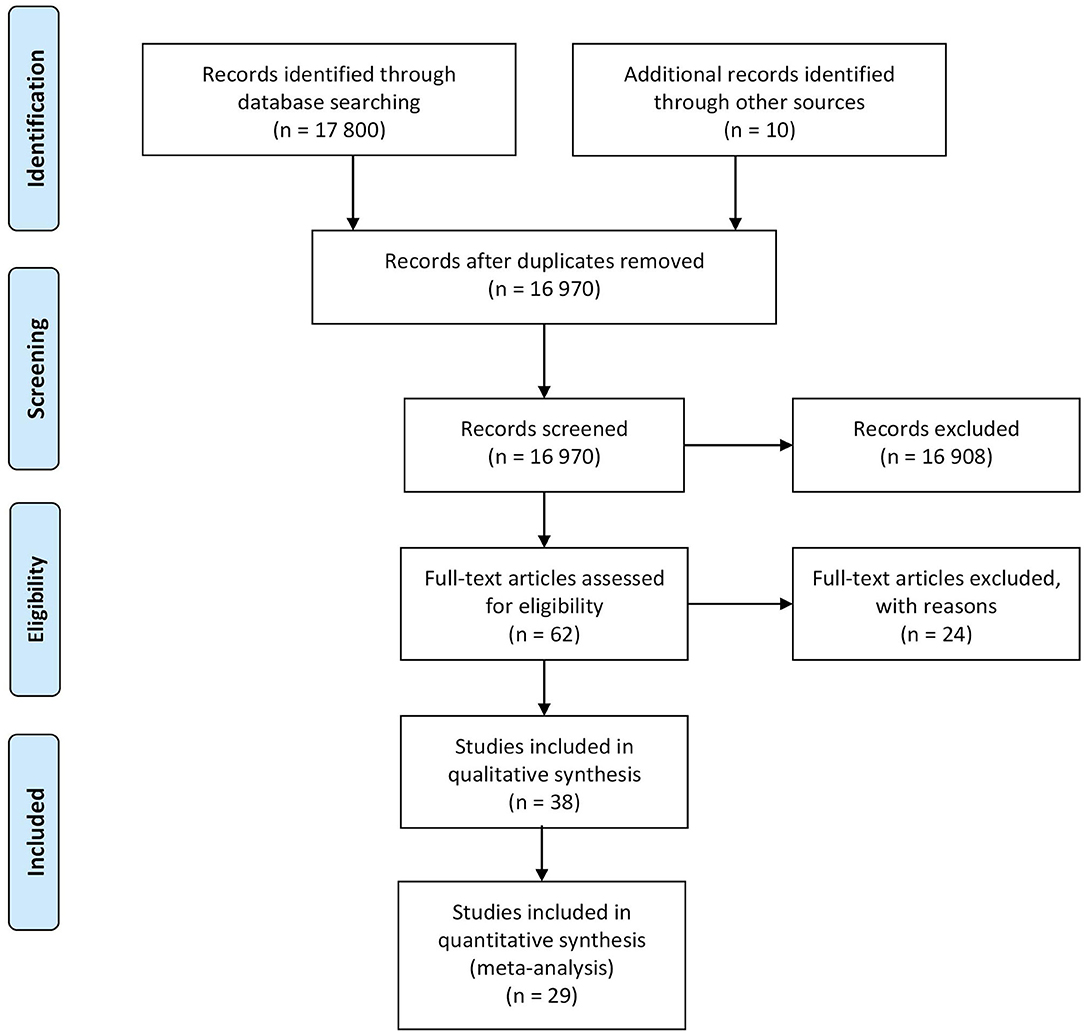
Figure 1. PRISMA diagram outlining the literature review process.
Inclusion Criteria
All studies that use non-invasive techniques alternative to dermoscopy, tested in-vivo on humans for melanoma diagnosis, were included with no restriction on age, sex, or ethnicity of the recruited population. The target condition was cutaneous melanoma. No limits on the number of lesions per patient or on the number of patients included in each study were applied. All types of studies were included except for reviews, case control studies and case reports studies. The diagnostic gold standard adopted as reference was histopathology and dermoscopic diagnosis was accepted as a replacement only for benign lesions. Only article written in English were included. The inclusion criteria were applied by AB and AC to the references based on their abstracts to screen their eligibility, while TB reviewed the selection process. Citations were grouped based on the physical principle employed and categorized according to type of non-invasive technique reported by the original study.
Methodological Analysis
For each included study, experimental design, index test, number of participants and total lesions, inclusion and exclusion criteria, participants' gender and age and reference standard(s) were independently extracted by AB and AC with disagreements solved with discussions. The studies' attributes were reported in Tables 1–3.
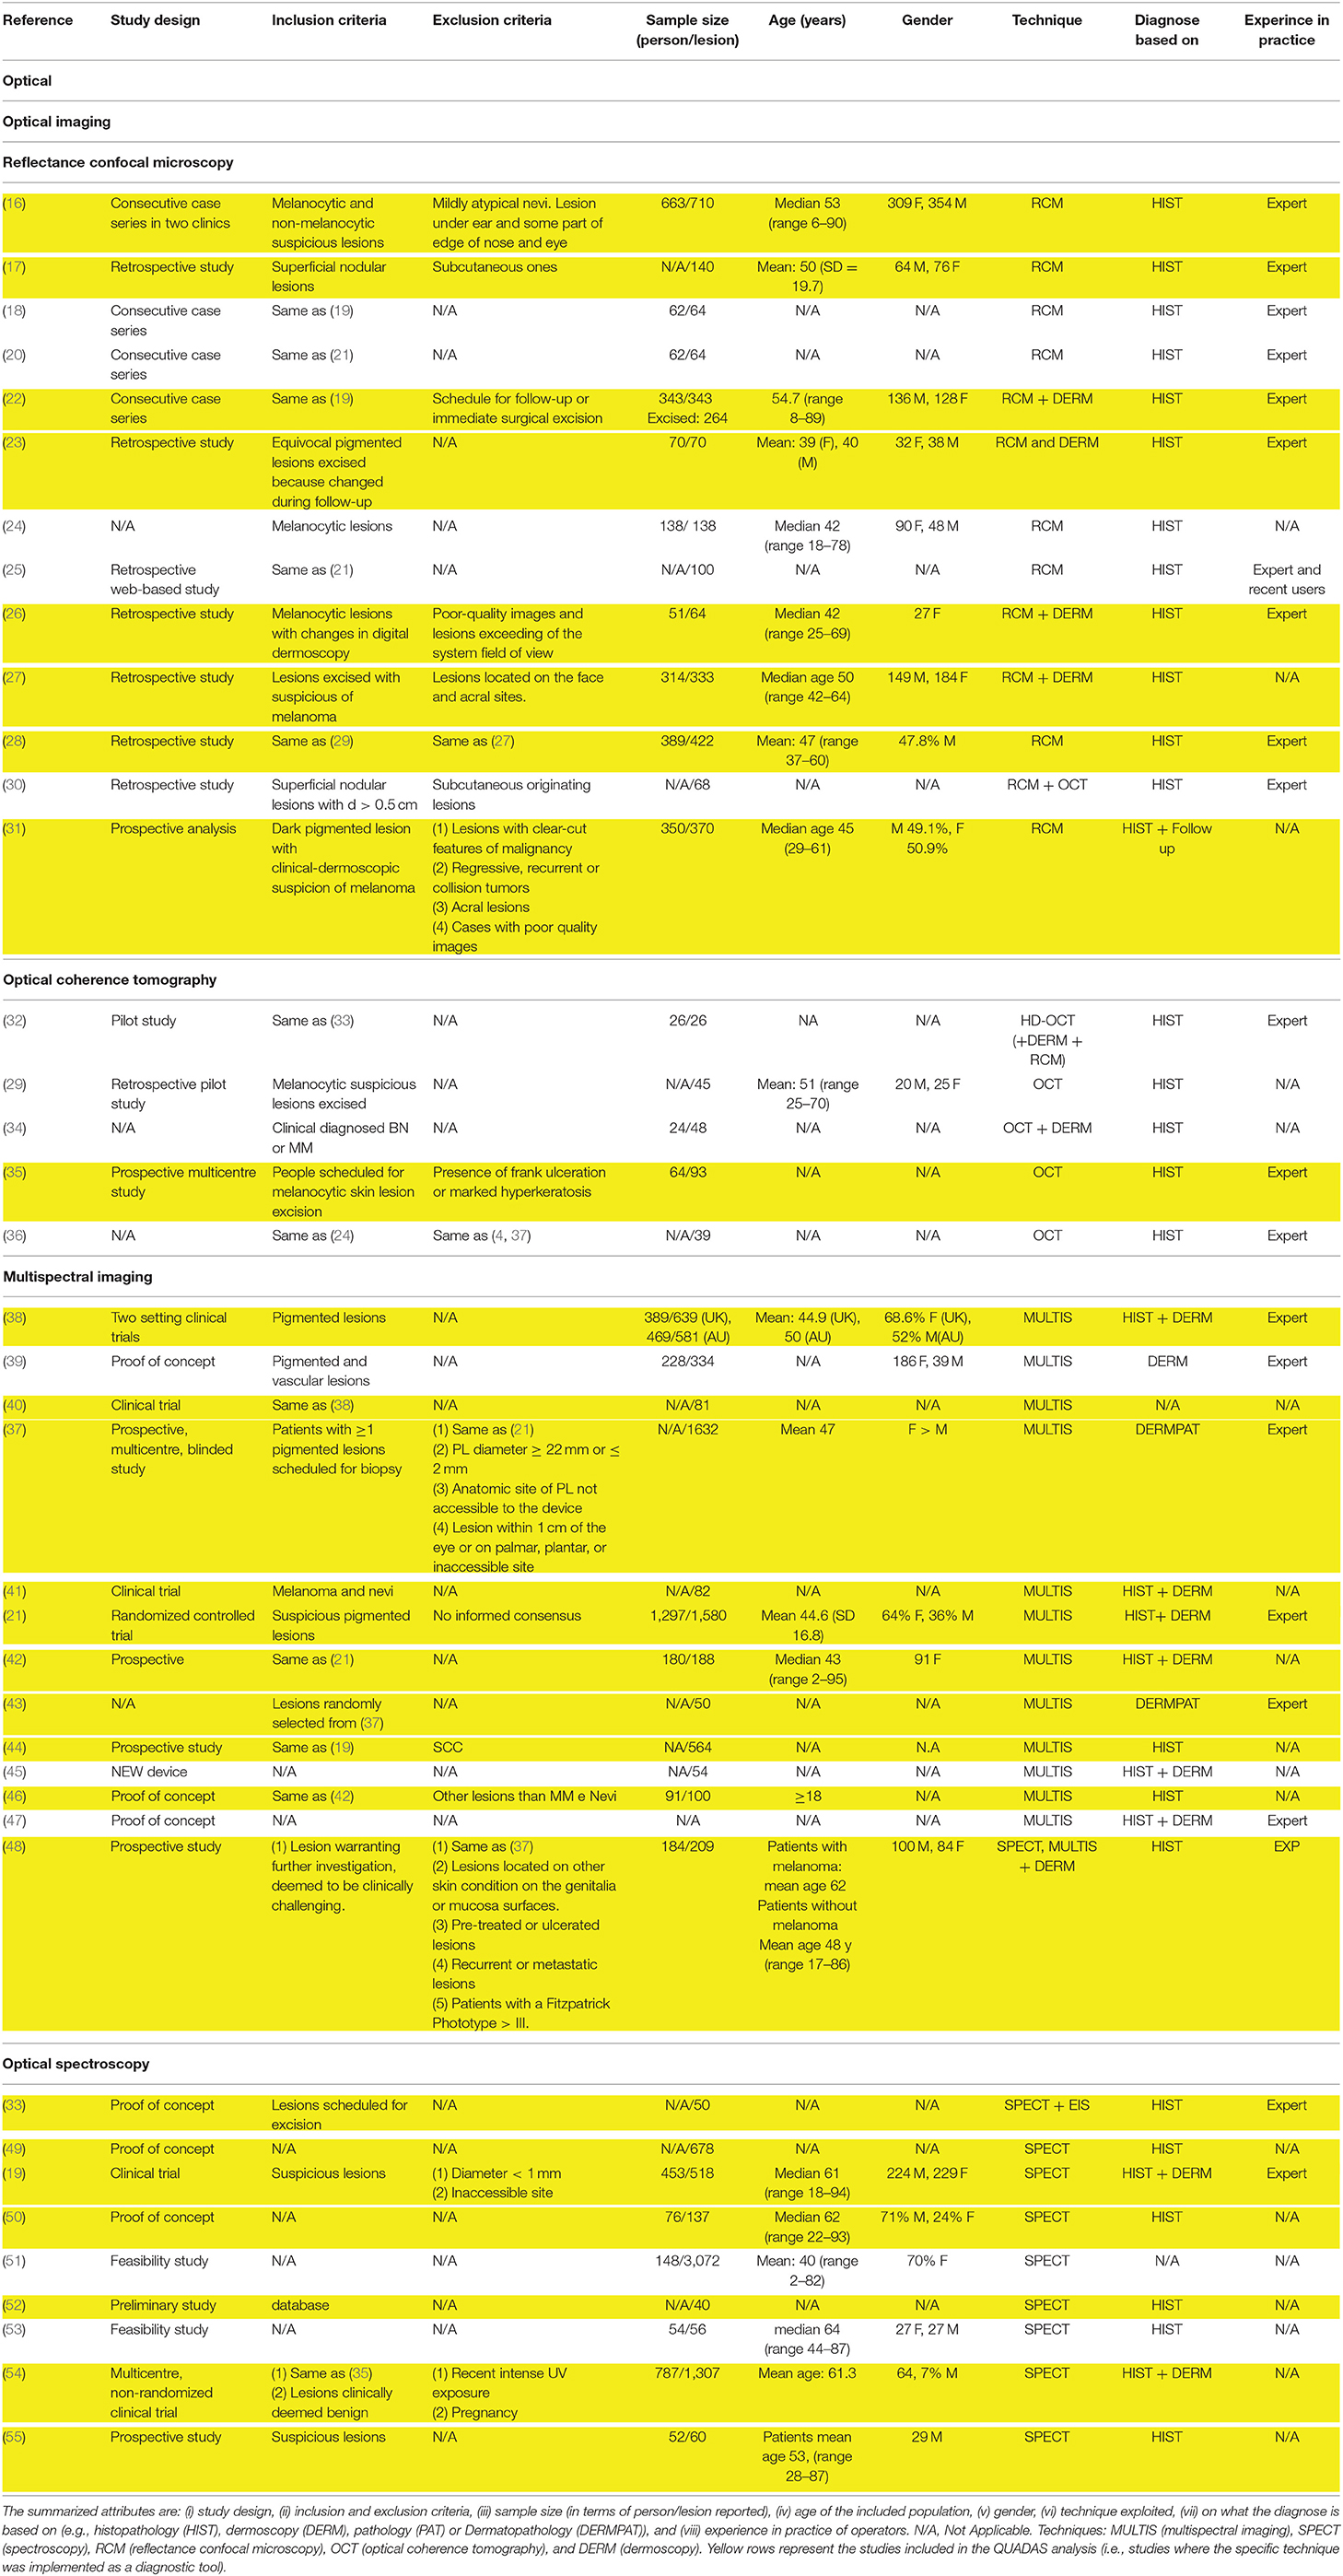
Table 1. Studies attributes of the 40 included studies exploring optical based techniques for melanoma diagnosis.
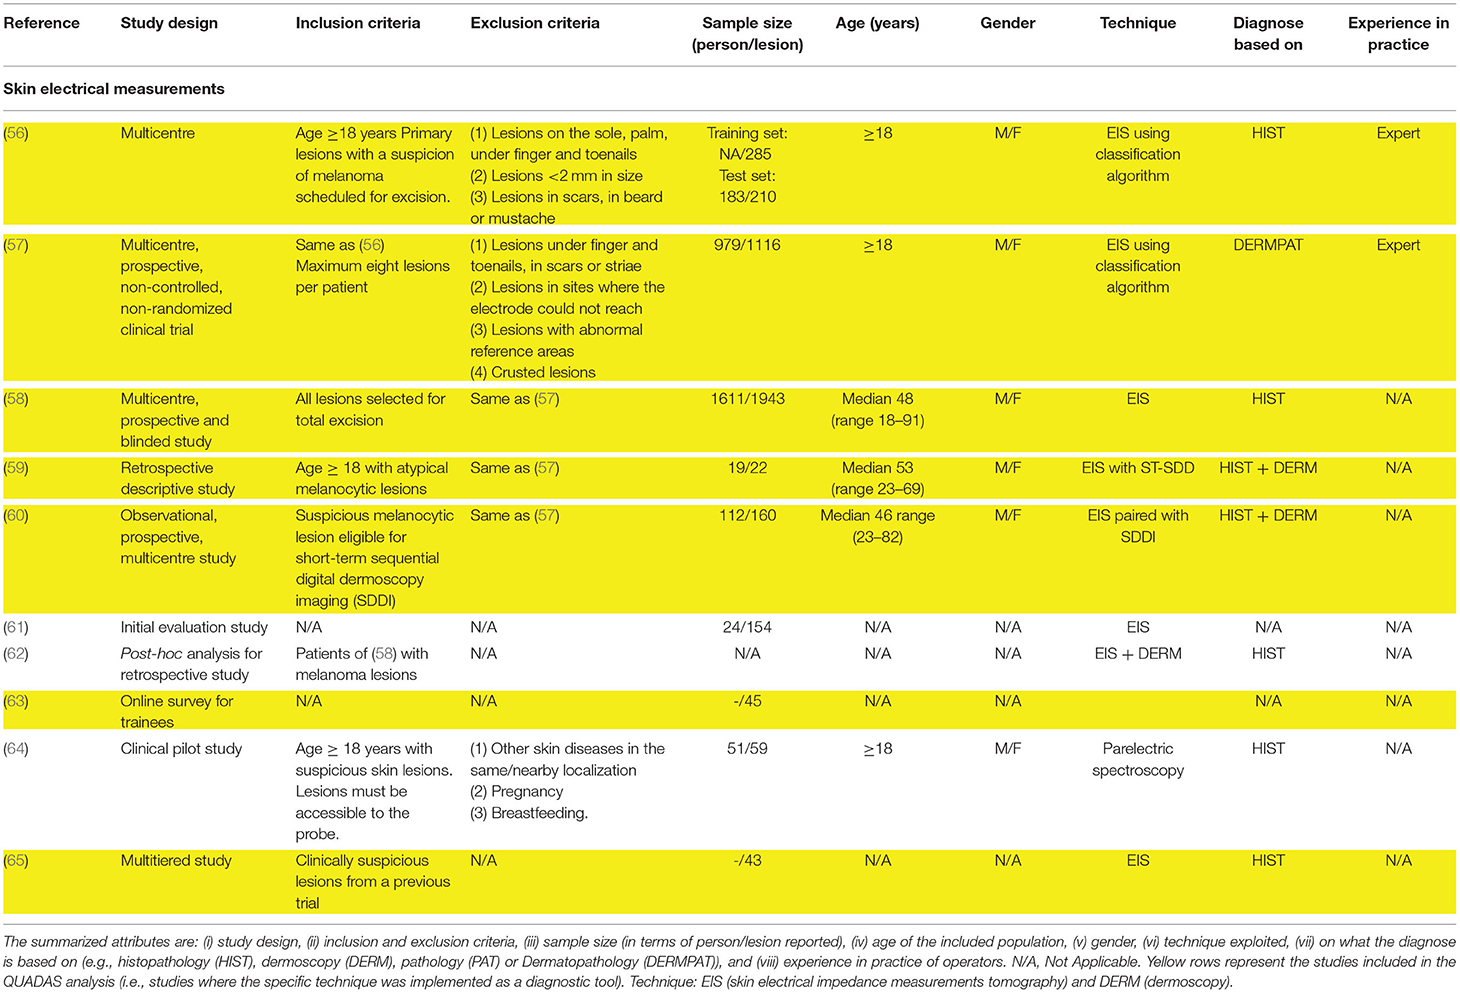
Table 2. Studies attributes of the 10 included studies exploring EIS based techniques for melanoma diagnosis.
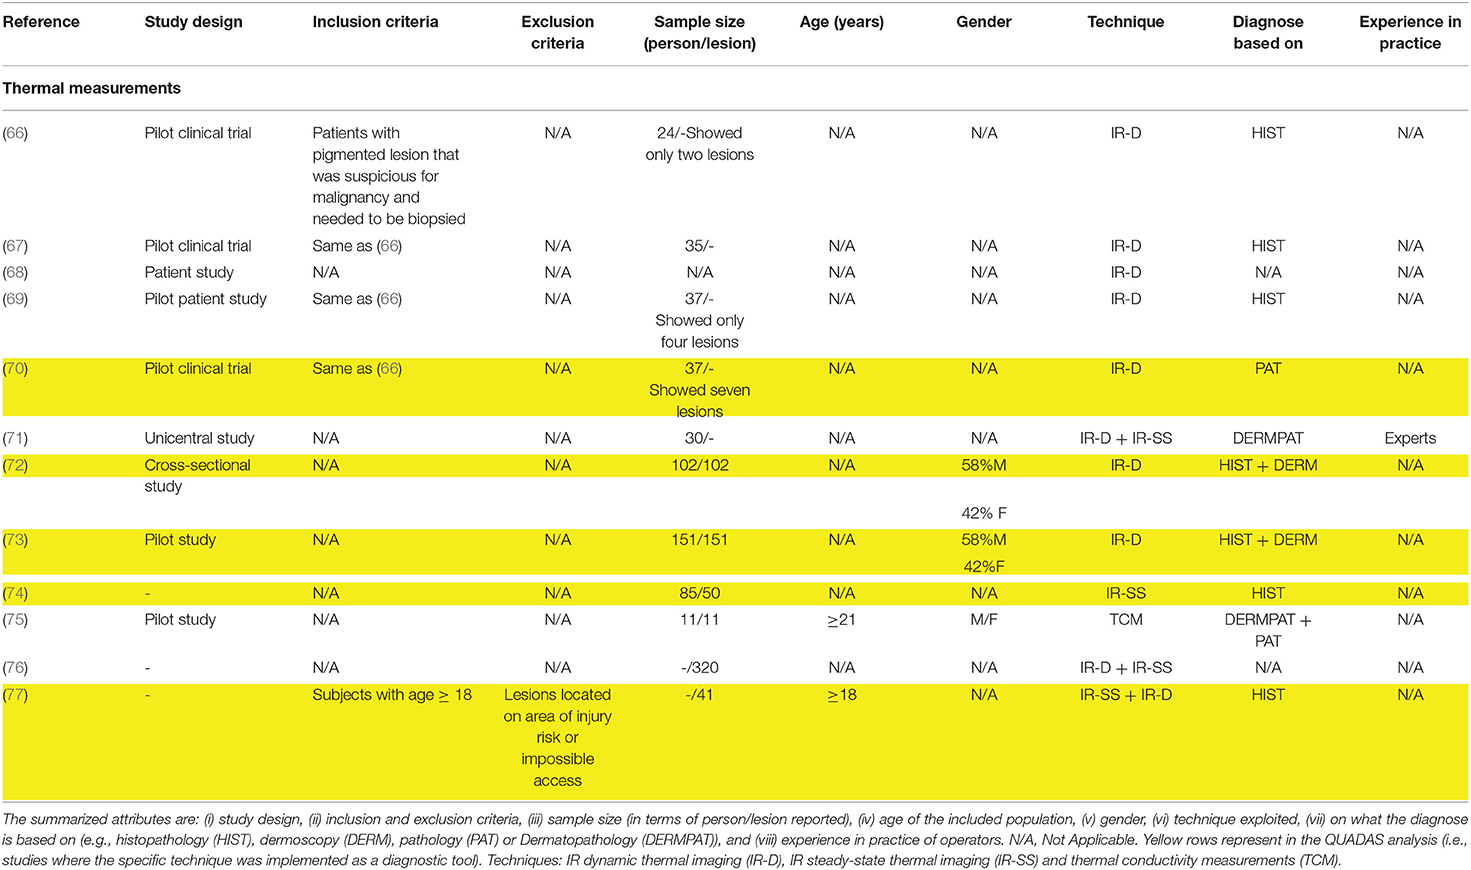
Table 3. Studies attributes of the 12 included studies exploring thermal based techniques for melanoma diagnosis.
To provide a standardized measure of methodological quality of each study, i.e., evaluating criteria such as, the amount of data collected and the appropriateness of data analysis, the CASP Qualitative checklist (78) was employed (excluding point 10 as it is not applicable, Table 4). This checklist was used to compare the quality of the studies within techniques based on different physical principle. For those studies where the specific technique was implemented as a diagnostic tool (i.e., diagnostic results were compared to biopsy results) the assessment of the study's quality was carried on using also the QUADAS-2 tool (79), hence examining bias and applicability of the studies with respect to four separate domains: (i) patient selection, (ii) index test (i.e., diagnostic technique investigated in the study), (iii) reference standard (i.e., the ground truth technique used as reference), and (iv) the patient flow and timing in the study. For each QUADAS2 domain, any concern regarding bias and applicability were scored as “low,” “high,” or “unclear,” based on the information given by the authors in each publication. These results belonging to single studies using the same technique were merged together and were then presented in graphical form (Supplementary Figures 1B,C, 2B,C, 3B,C, 4B,C). Single studies results were presented in the same figures in a table form (Supplementary Figures 1A, 2A, 3A, 4A). Following QUADAS-2 tool guidance, any domain judged at high risk of bias made the whole study considered at high risk of bias. Risk of bias and a concern regarding applicability in patient selection was considered high when only pre-selected patients or patients with lesions with a high concern of melanoma were included in the study. The risk of bias in the index test was considered high in studies where the threshold was selected after the test and a high concern of applicability was considered for studies where the index test was analyzed without all the clinical information or visual examination. A high risk of bias in flow and timing was reported for studies where different reference standard were used. Correlational and feasibility studies were excluded from this analysis. Risk of bias assessment was independently performed by AB and AC, with disagreements solved with discussions.
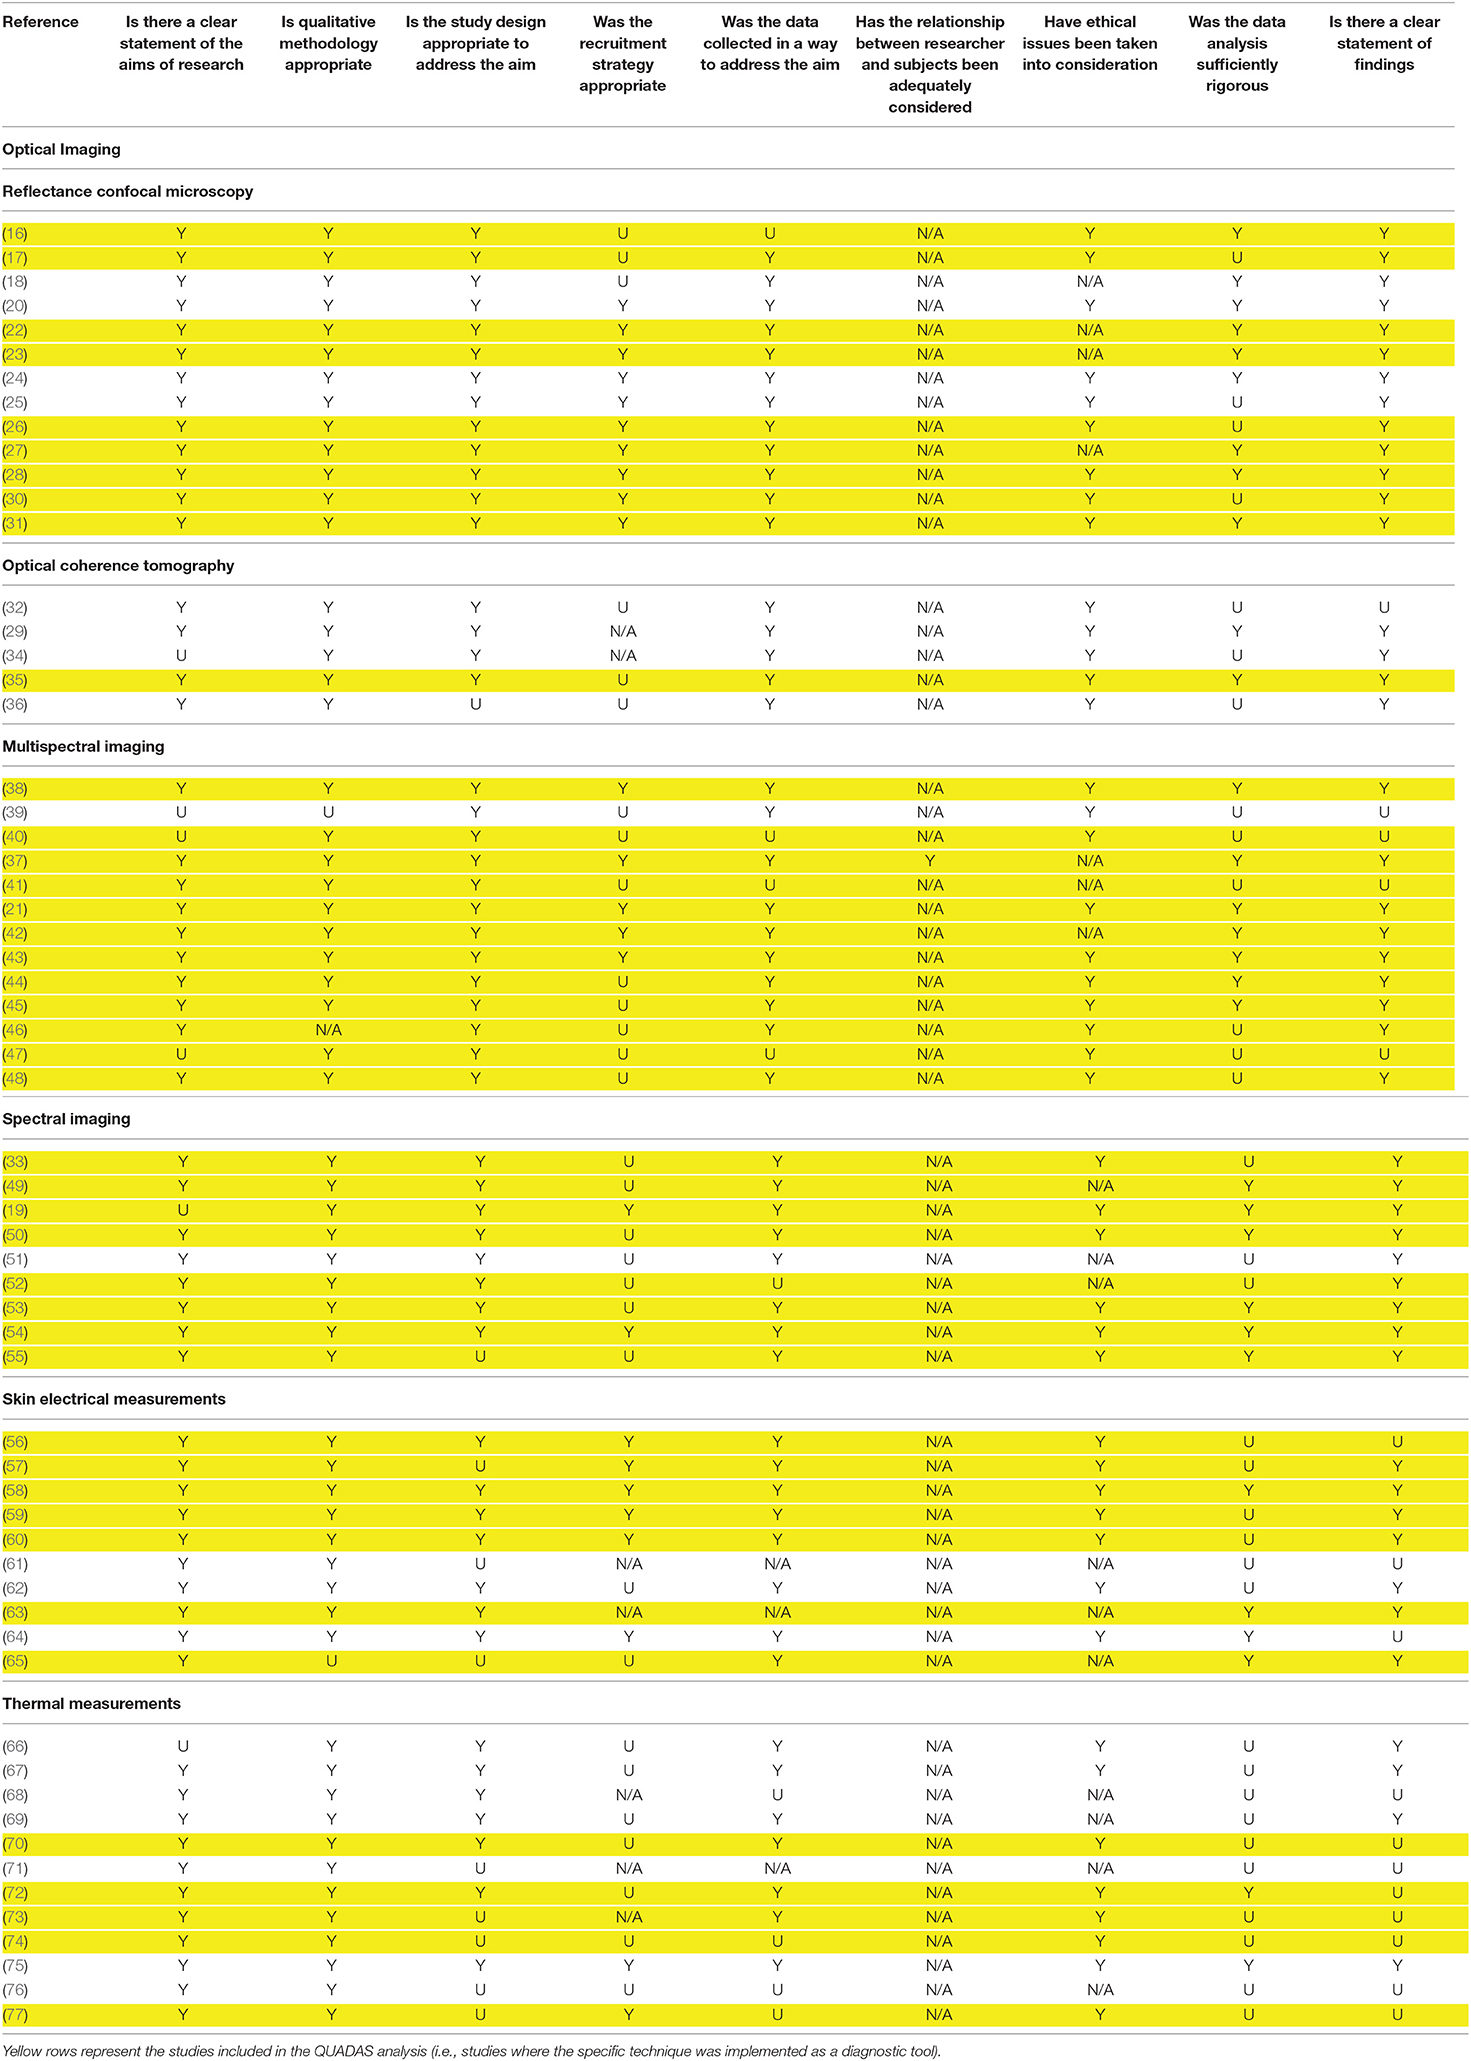
Table 4. CASP Checklist for each study included in this review: Yes (Y), Unclear (U), Can't tell (N/A).
For those studies aimed to report diagnostic performance of a technique, and thus, for those studies included in the QUADAS-2 analysis, the diagnostic accuracy of the reported technique was compared. A confusion matrix was filled for studies that reported the True Positive (TP), False Negative (FN), True Negative (TN), and False Positive (FP) values. TP was considered a diagnosis of melanoma/malignant lesions using the index test confirmed by histopathological examination. TN was considered a diagnosis of banal nevi or other type of benign lesion confirmed by the reference standard. FP was considered a diagnosis of melanoma/malignant lesion by the index test confirmed to be a banal nevi or other benign skin lesion by the reference standard. FN was considered a diagnosis of banal nevi or benign non-melanoma skin lesion by index test confirmed to be a melanoma/malignant lesion by the reference standard. A meta-analysis of DTA studies was conducted using interactive web-based tool MetaDATA (80, 81). Here, starting from the confusion matrix, sensitivity, and specificity per-lesion (i.e., computed on the number of lesions included in the study) of the technique investigated by each study were computed. For both metrics, the 95% confidence interval (CI) was calculated using the Clopper Pearson method (82). To provide a compact representation of both quality and diagnostic performance metrics of reviewed studies, summary receiver operating characteristics (SROC) curves were drawn, and are depicted in Figure 3. Indicators of quality included in the SROC plots were assessed using QUADAS-2 (i.e., overall risk of bias and overall concern regarding applicability). The SROC curves show also a 95% CI region. Only studies that reported the TP, FN, TN, FP values were included. Studies in which the classification task was framed differently from a binary classification between melanoma vs. other benign skin lesions were excluded from the meta-analysis as this inhomogeneity prevented direct comparison of diagnostic performance.
The sensitivity and specificity (paired with their CIs) for each study that reported the aforementioned values were also detailed into a Forest Plot. These information are available in the Supplementary Materials (Supplementary Figures 5–7). In the same figures, DTA studies results excluded from the meta-analysis were reported for completeness.
Results
The database search yielded a total of 17,800 papers of which 16,970 were unique. After the application of the inclusion and exclusion criteria, 62 papers were included in the review, of which 38 (61.3%) papers targeted the evaluation of the diagnostic performance of a technique and were included in the qualitative analysis (i.e., were considered to be DTA studies and were included in the QUADAS-2 analysis and performance comparison). Starting from the initial pool of raw dataset (i.e., 16,970 studies), the majority of studies (99.6%) were excluded based on their abstract since they were non-in-vivo human studies, or did not report the index test in a clinical or pre-clinical setting, or did not include melanoma lesions in their dataset or the reported reference standard was dermoscopy without histopathology results for cancerous lesions. 29 (76.3%) studies of the already selected DTA study list were included in the meta-analysis, indeed, 4 studies (10.5%) were excluded from meta-analysis due to the definition of the classification task into a malignant vs. benign classification instead of the targeted melanoma vs. benign. 5 studies (13.2%) were excluded from the meta-analysis due to the absence of raw values of TN, TP, FN, FP. The PRISMA diagram outlining the literature review process is shown in Figure 1.
The general methodological characteristics of the 62 included papers were reported in Tables 1–3; namely we reported study population inclusion and exclusion criteria, sample size (both for patients and lesions), average age, gender distribution, type of study, index test, and reference standard. Studies were grouped based on the physical principle exploited by the non-invasive technique reported: (1) optical, both imaging and spectroscopy; (2) electrical; and (3) thermal. Figure 2 depicts a schematic representation of the physical principles analyzed in this review.
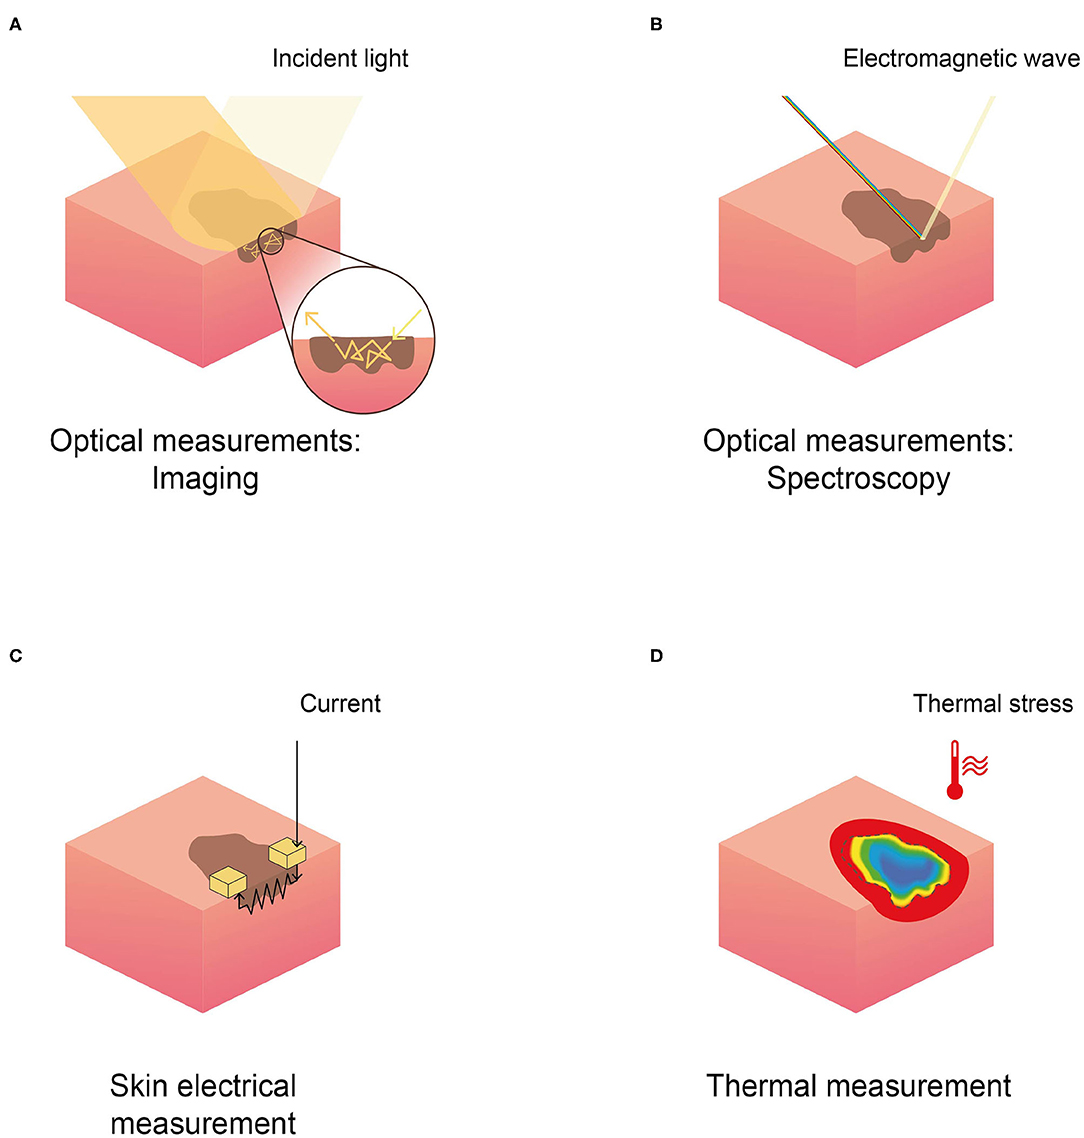
Figure 2. Schematic representation of the physical principles behind different techniques in skin cancer detection, reported in the selected literature. (A) Optical imaging, (B) optical spectroscopy, (C) skin electrical measurement (EIS), and (D) thermal measurement.
Optical Measurements
Optical Imaging
Three different optical imaging techniques for melanoma diagnosis were found: (i) reflectance confocal microscopy (RCM); (ii) multispectral imaging (MI); and (iii) optical coherence tomography (OCT).
Reliable correlates for epidermal and junctional histological features, useful for diagnostic purposes, were identifiable using RCM imaging (18, 20, 24, 25, 30). Four melanoma scoring algorithms based on these features were validated in literature (18, 27, 83, 84). In Borsari et al. (27) the diagnostic score combines dermoscopy and RCM, while the rest relied exclusively on confocal data. The performances of the four scoring systems have been compared retrospectively by Pampena et al. (28), using different thresholds (i.e., number of features that a lesion presented to be considered melanoma using the algorithm) to assess if a lesion belonged to the melanoma class, suggesting that mixed criteria may be the best solution in reducing false positive rate. Another algorithm based on a two-step model was proposed in Guitera et al. (16). RCM image-based diagnosis is user's dependent and experienced users achieve higher sensitivity than novice users (91 vs. 84.8%), even if the specificity was similar (80 vs. 77.9%) (25). RCM used complementarily to dermoscopy, can increase accuracy in melanoma detection (22, 23, 26) and hence may reduce unnecessary biopsies (22, 23). Moreover, a reduction in the number needed to excise (NNE) for melanoma in dermoscopy compared with RCM was reported by Longo et al. (31). The NNE was 2.9 with clinical-dermoscopy alone and dropped to 1.5 thanks to RCM integration, leading to a 60.6% reduction of unnecessary biopsies and to a sensitivity of 98.1%. RCM may be useful also in the diagnosis of nodular lesions (17).
Different MI systems were found in literature, including two commercial devices, i.e., SiaScope (Astron Clinica and Limited, UK), and MelaFind® (MELA Sciences, Irvington, NY). The appropriateness of SiaScope in improving accuracy of referrals in primary care setting is still under investigation (21, 38, 42), but Sguros et al. (42) proposed to use the device as an additional tool in the hands of less experienced users. MelaFind® was validated in aiding dermatologists to provide a more accurate biopsy decision (37, 43), increasing specificity and sensitivity. The use of the multispectral imaging camera Nuance EX (CRi, USA) is reported in three studies (40, 41, 85). More recently, a multispectral imaging device based on LED illuminators, capable of sensing texture information of the lesions, have been proposed as a screening tool to assist physician's decision (44, 45, 47). Finally, the diagnostic utility of LED-based hyperspectral imaging (exploiting 21 wavelengths) in combination with machine learning was demonstrated.
5 papers (29, 32, 34–36) investigated OCT. 4 studies (32, 34, 36) reported the correlation between OCT and histological features and only one (35) validated OCT as a diagnostic tool to differentiate cutaneous melanoma and benign melanocytic lesions. All the studies employed the SkinTell® (Agfa Healthcare, Mortesel, Belgium) high-definition OCT device except one study (36) that employed the Vivosight OCT Scanner (Michelson Diagnostic, Orpington, U.K.).
Optical Spectroscopy
Three different spectroscopy techniques were found in literature: (i) Raman spectroscopy (RS); (ii) diffuse reflectance spectroscopy (DRS); and (iii) fluorescence spectroscopy (FS).
The majority of studies investigated the performance of DRS (33, 49, 50, 52, 54). Lim et al. (50) reported the combination of DRS with other spectroscopic methods (RS, Laser-induced-FS), and Bodén et al. (33) the combination of DRS with skin impedance spectroscopy. Only two studies (19, 55) reported the performance of RS, while no studies mentioned performance of FS alone. A study reported a prototype of a RS-AF system (53). Lui et al. (19) showed that classification based on RS is not influenced by lesions location and also suggested different optimized wavebands for different classification tasks (e.g., cancer and precancerous vs. benign). Only one study (54) reported the performance of an investigational EES device, i.e., Dermasensor™ (DermaSensor, Inc, Miami, FL). The remaining studies used non-commercial tools. 4 studies (19, 33, 50) highlighted the need of reference measurements of healthy skin to process and analyse spectral data. All the studies used a binary classification output and exploited automatic analysis and classification. The latest study (55) reported a reduction of the number needed to treat for melanoma diagnosis from 8.6 to 4.1 when dermatologists followed the RS model recommendation for biopsy. A recent study (48) compared the sensitivity and specificity of different devices exploiting non-invasive imaging techniques (i.e., MelaFind®, Versiante Aura™ and Fotofinder®) in melanoma diagnosis, over a total of 209 lesions. The outcomes suggested that these techniques could assist but not replace clinical decision making.
Skin Electrical Measurements
Electrical impedance spectroscopy (56–63) (EIS) is the leading technique found in literature that involves the measurements of skin electrical properties. For the EIS measurements, the majority of the studies employed the Nevisense system (56–60, 62, 63) (SCIBASE AB, Stockholm, Sweden), while only one study (61) used the Dermasense system. Three studies used the Nevisense to understand its efficacy (58, 62, 63) and safety (58), comparing the diagnostic performance of its decisional score system with the ABCD rule and the 7-point checklist. Gilou et al. (61) collected only two measurements on one melanoma among their data. They compared these measurements with the one of clear skin patches, using paired t-test. In two studies (59, 60), the authors paired the Nevisense with the short-term digital dermoscopy imaging (SDDI), a follow-up procedure where each lesion is checked after 3 months (i.e., t = 3) from the first visit (i.e., t = 0). While Rocha et al. (60) concluded that EIS could avoid the need for follow-up in 46.9% of suspicious benign lesions included in the study, Ceder et al. (59) affirmed that no additional malignant lesions were found with EIS at t = 3, during follow-up procedure. A study (65) detailing the performance of a multitiered system of decision support system reported that the inclusion of the EIS score in clinical decision making led to a reduction in the number of unneeded biopsies and that the amount of the reduction depends on a clinician's experience, i.e., 14.8% for resident, 16.8% for midlevel, and 16% for practicing dermatologist. More recently, a paraelectric spectroscopy technology has been used for skin cancer application in a correlational study (64).
Thermal Measurements
Skin thermal properties depends on tissue metabolic activity that in turn is significantly different among benign and malignant lesions. Thermal imaging (66–77) is the leading technique investigated in literature. Thermal cameras were used to obtain skin lesion features at steady-state (71, 74, 77) and in dynamic thermal conditions (66–70, 72–77). In steady-state studies, thermal images were used to obtain temperature features of the investigated lesion, such as, pixels temperature profiles (74) and temperature difference between several type of lesions and the healthy surrounding skin (71). Some authors suggested that the application of a cooling stress is essential to highlight malignancy: indeed, the thermal recovery of the lesion over time differs between malignant and benign tissues. To guarantee a stable measurement system, some authors implemented a data pre-processing pipeline to limit motion artifacts within the recovery phase (66–70, 72, 73). In five studies (66–70), preliminary results of temperature recovery profiles recorded from 3 melanomas and 34 benign lesions (with respect to the surrounding skin) were presented. Godoy et al. (72, 73) added to this pipeline two different decisional algorithms to enable the automatic classification of a lesion (melanoma vs. other benign skin lesions). In Magalhaes et al. (76, 77) a different cooling and processing pipeline was implemented to extract thermal features from steady-state and dynamic imaging to fed machine learning algorithms for different classification tasks.
A recent approach (75), used punctual temperature measurements to compute the effective conductivity of a skin lesion, highlighting significant differences between measurements of invasive and in-situ melanoma.
Studies Evaluation
Studies generally scored from moderate to unclear quality following the CASP checklist (Table 4). Optical based studies achieved higher quality with respect to other techniques. Thermal based studies scored the lowest quality based on the CASP checklist, indeed only few studies reported sufficiently rigorous data analysis (72, 75) and a clear statement of findings (66–70, 75). Among the various analyzed techniques, optical ones are the most widespread in literature, indicating how these techniques are more consolidated and validated with respect to novel techniques, such as EIS and the thermal based ones.
For 61.3% of included studies (38 over 62 studies), the evaluation of risk of bias and concerns regarding applicability was performed and results were presented in Supplementary Figures 1–4; single study quality assessment using QUADAS-2 tool is reported in the same figures, panel (A). Proportions of studies with low, high, unclear risk of bias and concern regarding applicability for each domain of non-invasive techniques, grouped with respect of the physical principle, are visually summarized in Supplementary Figures 1B,C (optical imaging); Supplementary Figures 2B,C (optical spectroscopy); Supplementary Figures 3B,C (EIS); and Figures 4B,C (thermal).
32 studies out of 38 (84.2%) presented a high risks of bias, 5 studies (17, 26, 50, 55, 63) (13.1%) presented an unclear overall risk of bias, while only one study (58) (2.6%) presented a low overall risk of bias. A similar trend was reported also for concern regarding applicability, where the majority of studies (24, 63.2%) scored a high concern and 10 studies (17, 24, 28, 35, 36, 38, 54, 59, 71, 74, 76) (26.3%) an unclear one. Only 4 studies (21, 38, 42, 72) (10.5%) reported low concerns regarding applicability.
Patient recruitment was mostly performed including dermoscopic pre-selection of suspicious lesions, leading to high risk of bias and concern regarding applicability in patient selection domain. Risk of bias, with respect to flow and timing, was rated high in 15 studies (39.5%, the majority of them exploited thermal and multispectral analysis) since not all patients received the same reference standard and/or not all patients were included in the analysis (e.g., some studies excluded dermoscopically benign lesions from follow up and analysis). Six studies (16, 25, 43, 52, 63, 65) (15.6%) reported interpretation of index tests evaluated remotely without patient analysis or blinding to clinically relevant information, raising concerns regarding the applicability of the index tests in a clinical setting. Sometimes a diagnostic threshold was specified after the diagnostic task itself, introducing a possible bias into the index test (33, 40, 72, 73).
The performance of DTA studies included in the meta-analysis, in terms of specificity and sensitivity, were evaluated based on the confusion matrix (filled with the TP, FN, TN, FP values reported by the investigated study) and visually compared using SROC curves (Figure 3). Different studies are grouped and depicted based on the technique implemented. See Supplementary Figures 5–7 for further details on TN, TP, FN, FP values and 95%CI of each study. Also, DTA studies excluded from the meta-analysis were reported for completeness. The aforementioned figures also showed a forest plot for each technique.
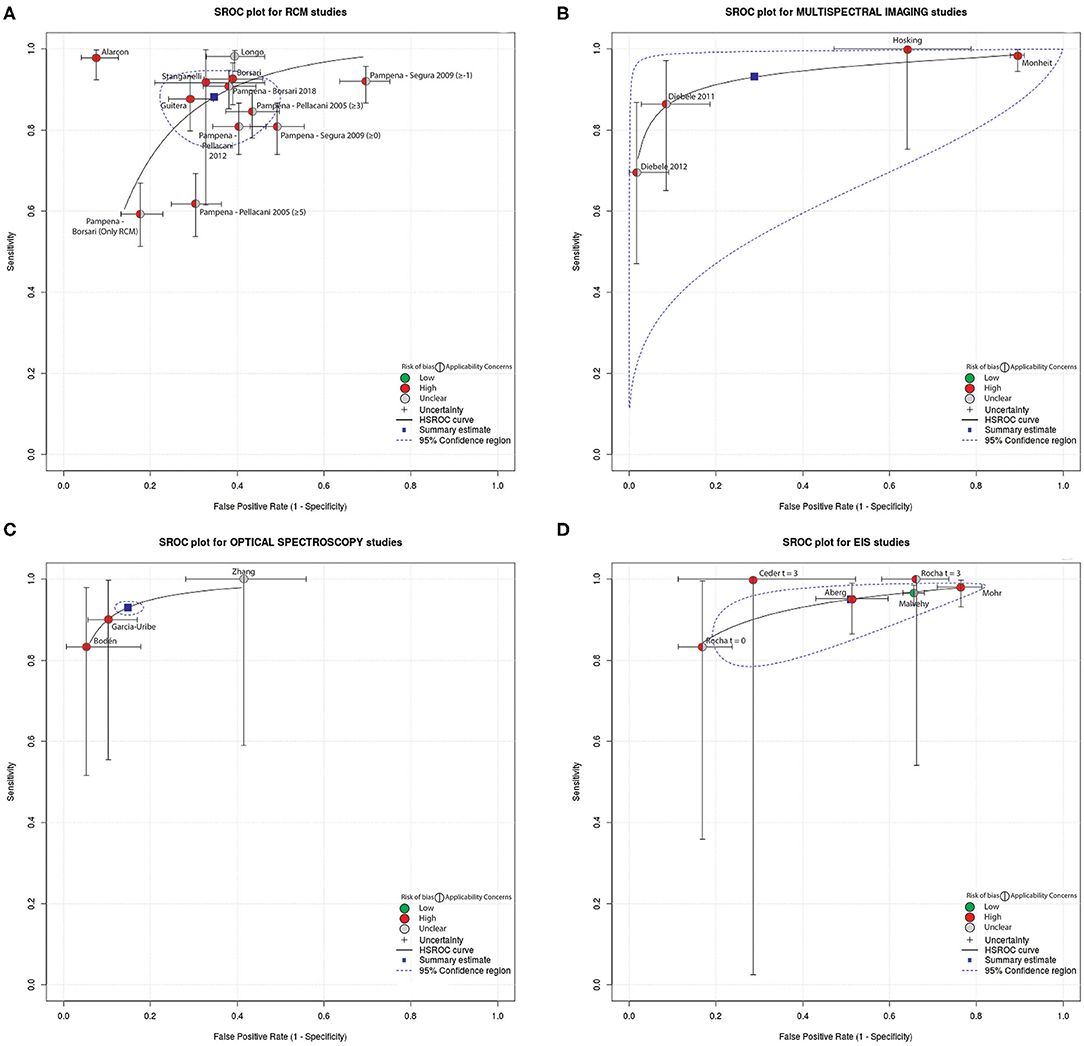
Figure 3. Summary received operating characteristics (SROC) curves which displays the results from the meta-analysis with indicators of quality assessed using QUADAS-2 (i.e., overall risk of bias and overall concern regarding applicability). The curves reported also the 95% Confidence region. Included studies were divided based on the employed technique: (A) RCM, (B) multispectral imaging, (C) spectroscopy, and (D) electrical measurement.
The results of the meta-analysis performed suggests that RCM studies generally report high sensitivity (88.2%, 95%CI 80.3–93.1%) paired with high specificity (65.2%, 95% CI: 55.0–74.2%). Exceptions to this high performance were found in Pampena et al. (28) were the Segura algorithm, with threshold ≥−1 for melanoma diagnosis, reached 92% sensitivity but 30% specificity, while a sensitivity of 81% and a specificity of 51% was achieved with Pellacani-2012 scoring system. Stanganelli et al. (23) reported the largest range in terms of 95% CI.
MI generally presented high sensitivity (93%, 95%CI 75.3–98.3%) and specificity (71.2%, 95% CI 17.6–96.6%) in melanoma vs. other benign skin lesions classification tasks.
The only DTA study exploring OCT for melanoma diagnosis reported 92.4% specificity and 74.1% sensitivity with a 95% CI of (83–97%) and (54–89%), respectively; as only a study reported the use of OCT in clinical setting for melanoma diagnosis, the technique was excluded from meta-analysis, as a single study was not enough to validate the technique and SROC analysis could not be applied.
Overall, spectroscopy presented high sensitivity (93.0%, 95% CI: 92.8–93.2%), and high specificity (85.2%, 95% CI: 84.9–85.5%) in melanoma classification.
EIS studies generally presented high sensitivity (95%, 95% CI: 88.9–97.8%) but low specificity (48.9%, 95% CI: 30.5–67.6%). Ceder et al. (59) and Rocha et al. (60) reported a specificity of 71% and 83%, respectively, employing the same technique in melanoma recognition. Recent studies (63, 65) did not report TP, TN, FP, FN values and performance could not be analyzed. Ceder et al. (59), with follow-up at 3 months, presented a sensitivity of 100% for a 70% specificity but the 95% CI were 3–100% and 48–89%, respectively.
None citations employing thermal measurements for melanoma diagnosis reported TN, TP, FP, FN values, thus, performances in terms of specificity and sensitivity in melanoma diagnosis of thermal technique were not analyzed (i.e., studies were not included in the meta-analysis and in the forest plot, in the Supplementary Figure 7, were depicted using red lines).
Discussion
The aim of this review is to compare the diagnostic performance of non-invasive techniques (Figure 2) in combination with or as an alternative to dermoscopy for melanoma detection. A comprehensive literature review yielded 62 results. Of those studies, 38 evaluated the diagnostic performance of a specific technique and were included in the Quadas-2 analysis, of which 29 were included in the meta-analysis (i.e., SROC evaluation highlighting Quadas-2 results, as described Methodological analysis).
Comparing SROC curves (Figure 3), optical spectroscopy achieved the best diagnostic performance in terms of specificity (85.2%) and sensitivity (93%) among all the investigated techniques in melanoma diagnosis (Figure 3C). Only three studies reported the use of this technique for the task of interest (i.e., diagnosis of melanoma vs. benign lesions) and were characterized by wide CIs of specificity and sensitivity. RCM technique instead, was used by several studies, where both sensitivity and specificity CIs are the smallest across all techniques included in this review. Moreover, Alarcon et al. (22) achieved the highest diagnostic performance among all techniques, maximizing specificity and sensitivity (92% and 98%, respectively) with a narrower CI (9% and 7%, respectively) when pairing RCM with dermoscopy. In general, most studies maximized sensitivity with respect to specificity. Moreover, all diagnostic non-invasive techniques, except OCT, reported lower values for specificity than sensitivity. The need to achieve higher sensitivity is intrinsic in a cancer screening procedure as a misdiagnosis of a malignant lesion negatively affects patients' prognosis. OCT could not be considered the best implemented technique as only one study was found and included in the QUADAS 2-tool analysis, hence inclusion in the meta-analysis was not possible.
As it could be seen from QUADAS-2 quality assessment summary reported in Supplementary Figures 1–4, the majority of studies (including the RCM ones) scored high overall risk of bias and concerns regarding applicability, decreasing overall results robustness. Many of the analyzed studies chose an ad hoc threshold to maximize sensitivity (e.g., Bodén et al. (33), Godoy et al. (73)) unbalancing the classification output and skewing the performance of the classifier in a biased way. Moreover, this threshold was specified after the diagnostic task (as described in the Results section), biasing the final test results as reported in the index test domain (Supplementary Figures 2, 4). In some cases, the diagnosis was performed by automatic classification algorithms. These were mostly simple machine learning algorithms (19, 33, 40, 41, 50, 52, 55–57, 61, 72–74, 76, 77). Other studies (44, 46, 49, 54, 56) implemented artificial neural networks, however, scarce details on layers, hyperparameters and training regimen were reported hampering reproducibility. Among these 19 studies, the datasets used were usually limited in terms of sample size, i.e., median 137, mean amplitude deviant ±292. Almost 63% of the studies had a dataset with a sample size lower than 200 samples, possibly limiting the performance of the implemented classification algorithms. Four studies (19, 33, 50, 55) implemented a leave-one-out cross validation due to their small sample size. The data splitting strategy in training and test set was not properly reported in three studies (40, 41, 46). In few cases, some data included in the training phase were also used as part of the test set (52, 57), biasing the reported performance. In other cases (44, 74), the datasets were equally split in training and test set. Some studies (57, 73, 74, 76, 77) used features extracted from the original data to feed their algorithms. Although this operation could reduce computational cost, the resulting classification performance could be affected since the features extracted manually might not represent most of the information content of the original dataset. The classification performances of the algorithms belonging to different studies cannot be directly compared since different classification tasks were implemented. Most studies aimed to distinguish MM lesions from benign lesions and thus, were included in the meta-analysis as this is the clinically relevant scenario to which the focus of this review is addressed. Four studies were excluded from our meta-analysis due to the different classification tasks implemented (i.e., malignant vs. benign or melanoma vs. “skin”). Rodriguez Diaz et al. (54) evaluated elastic scattering spectroscopy diagnostic performance in malignant lesions detection against benign lesions in a dataset composed of 357 lesions, of which 126 malignant (14 MM and 112 non-melanoma skin cancers). The achieved performances were 94% (89–98% CI) sensitivity and 36% (30–43% CI) specificity. Although, the number of TP is high (119 with respect to 126, i.e., the total malignant lesions), there are few samples related to melanoma type, thus, this performance cannot be compared accurately with the other techniques presented in this review. Sgouros et al. (42) used the MI technique to distinguish malignant lesions (31, of which 18 MM, 10 basal cell carcinomas and 3 squamous cell carcinoma) from benign skin lesions (157). The used algorithm achieved 84% (66–95% CI) sensitivity and 46% (19–75% CI) specificity when the outcome was compared with histopathological results while an 86% (57–95% CI) sensitivity and a 65% (57–73% CI) specificity when compared with dermoscopy. A similar approach was implemented by Delpueyo et al. (44), reaching a sensitivity of 91% (82–97% CI) and specificity of 54% (46–63% CI) using a lesion dataset of 95 MM, 44 basal cell carcinomas and 290 banal nevi. Although, the number of MM is higher in these two studies with respect to the Rodriguez Diaz one, including other type of skin cancers could impair the final evaluation of the techniques' performance in the detection of MM with respect to benign lesions. Eventually, Shirkavand et al. (52) aimed to distinguish MM from healthy skin using elastic scattering spectroscopy, reaching a good performance in terms of sensitivity (80%, 56–94% CI) and specificity (95%, 75–99% CI). The achieved specificity is the highest reached among all spectroscopic techniques. Nevertheless, no information was collected in the detection of MM with respect to other skin lesions (that represents the clinical scenario investigated by this review).
The QUADAS-2 analysis of the included studies concluded that the risk of including biases in experimental protocols and patient's selection is high among all the investigated diagnostic techniques (Supplementary Figures 1–4). The most common bias shared among studies is a lack or sub-optimal participant recruitment procedure. Some studies (33, 40, 72, 73) aimed to maximize performance metric specifying diagnostic threshold after the diagnostic task itself, introducing a significant bias into the index test domain. Inclusion and exclusion criteria in participant selection are not standardized and unclear or missing in 30 studies out of 38. The inclusion of only dermatological pre-selected lesions in all studies except six (19, 28, 38, 44, 50, 58), leaded to a high incidence melanoma setting and made extrapolation of performance results, to a primary care setting, challenging. Half of the studies, evaluating RCM, are retrospective analysis (Table 1). One of the main characteristics of retrospective studies is that the lesions were already targeted and treated at the time in which the study was carried on, hence an operator misdiagnosis has no consequences on the patient outcomes. The lack of responsibility in missing a melanoma may lead to higher specificity than the one achieved in an earlier clinical scenario.
The diagnostic performance evaluated and compared in the review did not take into account the integration of anamnestic information in the diagnostic process, due to the absence of those data in all the evaluated papers, even if those information might have some effect on the final diagnostic performance. Hence, it is currently difficult to quantify the contribution of those information in the diagnostic process itself.
RCM and OCT are considered to provide an in-vivo “virtual biopsy” of the lesion. Since RCM enables the visualization of characteristic features with cell-level resolution (such as, honeycomb pattern and pagetoid cells), it may be adopted especially in those clinical scenarios where a difficult to diagnose lesion is examined, as with lentigo maligna melanoma vs. benign macules of the face (87–91). The scoring systems of these techniques are based on features recognition that are then analyzed by an expert user to attain an accurate diagnosis. Hence, these scoring systems are user-dependent, and the informative content of the images may not be completely exploited by visual examination. Both RCM and OCT required a reconstruction following a mosaic like composition techniques that merges several images depicting a small part of a lesion. In fact, this approach is characterized by instruments with a small field of view. This characteristic and the associated reconstruction procedure might lead to artifacts and misalignments. The initial cost of these instruments and the time required to achieve a diagnosis are higher when compared to homologous metrics recorded using dermoscopy. More recent studies (44, 46), concerning MI, reported the use of arrays of LEDs illumination systems that shows promising characteristics as this kind of system can measure biochemical information with high spatial resolution while reducing instrument dimensions, costs and acquisition time. These studies (44, 46) reported preliminary results on melanoma-nevi differentiation, unfortunately counting no clinical trials study yet.
Spectroscopy, such as, MI, employs different wavelengths to detect biochemical information (e.g., hemoglobin and melanin content) on a single point-like spot, thus, several measurements are needed. Currently, neither an optimal experimental design nor a standardization among setups for spectroscopic measurements has been defined. Moreover, basic validation studies to identify spectral features and relative histopathological correlates are needed to define a robust and/or interpretable scoring system. Given these characteristics and hence the relative complexity in interpreting spectral features, all the current approaches used automatic algorithms to classify spectra and reduce output variability. DermaSensor™ achieved 100% sensitivity in the detection of MM, but the tool showed low specificity, i.e., 36%, possibly leading to a rise the number of unnecessary biopsies to provide support for the diagnosis of ambiguous lesions.
While the correlation between optical-based techniques and histological features is well-validated in literature, the biological correlation with EIS measurements is still unclear. EIS studies employed the commercially-available Nevisense with a dedicated scoring system (57, 58). However, it is unclear how this score is assigned to the investigated lesion, furthermore, most of the misdiagnosis were done on early-stage melanomas (58, 63). A limitation of this technique is the need to take multiple measures of the same lesion, as the instrument's electrodes area does not cover the entire lesion.
Studies involving thermal measurements show mainly preliminary and qualitative results. Thermal images of the entire area can be acquired without skin contact and in <5 min (66, 67, 69, 70, 72, 73). The diagnostic performance of this technique is still unclear since few studies (69, 72–74, 76) used the technology with the aim of making a diagnosis, moreover the results reported were not exhaustively detailed from a methodological point of view. Further studies are needed to uncover the histopathological underpinnings on which this system acts. System integration was not considered except for Okabe et al. (75) where the external thermal stress and the measurement sensors were integrated in a single pen-shaped device.
Conclusions
This review reports the diagnostic performances of available non-invasive techniques alternative to dermoscopy for the diagnosis of skin melanoma. Overall, optical spectroscopy scored the highest diagnostic performances (average sensitivity and specificity, 93% and 82.2%, respectively, see Figure 3). Although, only three studies reported the performance metrics in the diagnostic task analyzed, leaving possible concerns about the robustness and variability associated with these metrics. MI achieved high diagnostic performance (average sensitivity and specificity, 93% and 71.2%, respectively, computed using only four studies) but reported the widest CIs range (17.6–96.6% for specificity and 75.3–98.3% for sensitivity). EIS, evaluated on five studies, achieved 95% average sensitivity paired with the lowest average specificity among the investigated techniques (48.9%), which also reported a wide CI (30.5–67.6%). RCM performances, instead, was computed analyzing six different studies, of which one compared six diagnostic algorithms (average sensitivity and specificity, 88.2% and 65.2%, respectively) and displayed also small 95% CIs, 80.3–93.1% and 55–74.2%, respectively. Moreover, RCM scored the highest performance when paired with dermoscopy (Alarcon et al. (22) sensitivity 98%, 95% CI 92%–99%; and specificity 92%, 87–96%; see Supplementary Figure 5) and thus, exceeding dermoscopy-alone diagnostic performance (8). Analyzing SROC curves, highlighted the presence of relatively wide sensitivity and specificity CIs across all the techniques (especially optical spectroscopy and multispectral imaging), rising concerns about the reliability of reported performances. Regarding the QUADAS evaluation, 84.2% of studies were classified at high risk of bias and 63.2% had applicability concerns.
Beyond the reported metrics, other unmeasurable but crucial factors, such as, technique usability, ease of use, results interpretability, and clinical acceptance, may hamper the adoption and clinical usage of a technique. Meta-analytical evidence, stemming from the analysis of the literature provided in this review, may be used as a quantitative and methodologically sound support for the selection of the most suitable technique for a specific clinical case, timing or workflow, considering always the clinician at the center of the decision process. The most relevant limiting factors that precluded a systematic comparison of all the presented techniques were (i) heterogeneity in the type of studies implemented (e.g., retrospective analysis, clinical trials); (ii) differences in testing strategy (as highlighted by the QUADAS analysis); and (iii) the definition of the diagnostic tasks (e.g., melanoma vs. nevus or benign vs. malignant). These methodological biases may affect results and invalidate performance comparison. Given these limitations, future studies, addressing the performance evaluation of an alternative technique to dermoscopy for melanoma diagnosis, may benefit from following best practice recommendations, as those suggested in Figure 4. These suggestions are tailored to better validate and compare the diagnostic performance of the investigated technique and should always be applied favoring patient protection over any other circumstance. In addition, the aforementioned best practices are not designed to be adopted as common clinical practice.
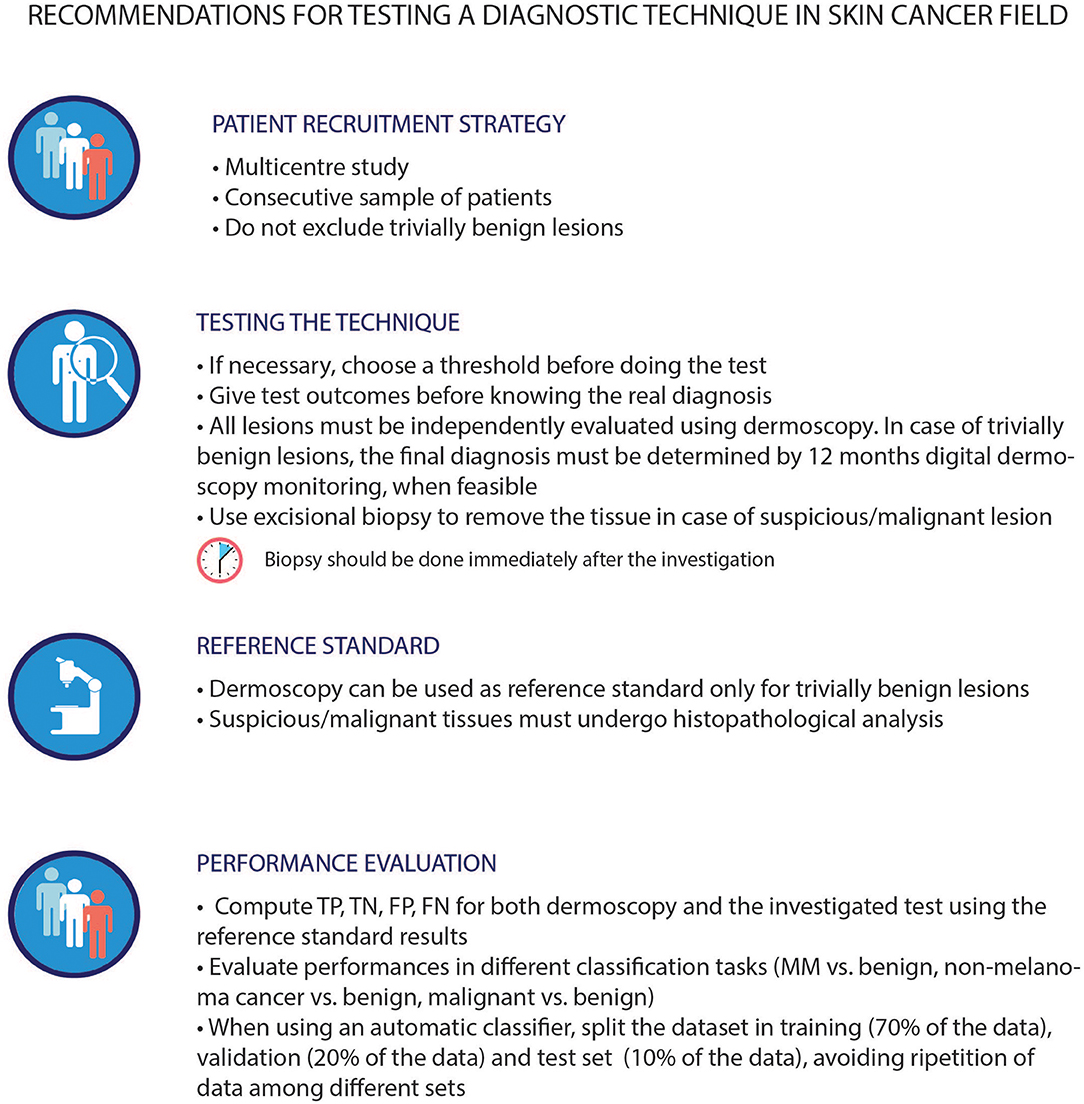
Figure 4. Best practice in assessing techniques performances within the dermatological field. The first three guidelines were proposed based on the QUADAS-2 tool requirements, while the last one was derived by the literature review. The lesions chosen for the investigation should belong to a study population that reflects the standard population. The outcomes of a technique should be compared to the histopathological analysis of the lesion itself, except for trivially benign lesions, (in this case, dermoscopy can be used as an alternative). Indeed, histopathology is the current reference gold standard in this field, even if with its own limitations. As described in literature (86) the failure rate of histopathological analysis depends on the type of biopsy involved. Thus, excisional biopsy is advised. This approach stems from common clinical practice, albeit it may introduce possible biases in the classification trustworthiness of this type of lesions. It is known that the use of different reference standard for different lesion types may hamper the final evaluation of the performances of each technique, as well as the comparison with dermoscopy itself. The proposed dataset splitting is one of the main splitting methods used in this field, however, there can be others suitable for the specific task under investigation. MM, malignant melanoma; TP, True Positive; TN, True Negative; FP, False Positive; FN, False Negative.
Moving further, some of the included techniques (e.g., RCM) are extensively validated in literature but their usage within the clinical setting is still limited due to their high costs and low clinical acceptance. To widen the adoption of those techniques, a significant effort should be done to increase technology accessibility, mainly reducing the overall costs and expertise needed to use those technologies. Moreover, to maximize reproducibility, an optimal diagnostic technique should: (i) acquire data in a short period of time (e.g., minute or less), ultimately limiting artifact induced by patient's movements; and (ii) minimize errors induced by operators due to suboptimal data acquisition or erroneous subjective evaluation of gathered data. Finally, to increase clinical acceptance and adoption of new solutions, the ideal technology should display a balanced trade-off between diagnostic accuracy and overall complexity of use. Indeed, the ideal technique should provide objective information related to a well-known biological correlate in an easy-to-understand manner for the clinician.
Data Availability Statement
The raw data supporting the conclusions of this article will be made available by the authors, without undue reservation.
Author Contributions
AB, AC, and TB contributed in the conception and design of the study. AB and AC performed the literature review, data extraction, statistical analysis, and wrote the first draft of the manuscript. GC and TB contributed to the writing of the manuscript and supervised the entire research effort. All authors contributed to the article and approved the submitted version.
Funding
This work was carried on in the framework of the Advanced Laboratory Automation project funded by INPECO SA (Novazzano, Switzerland).
Conflict of Interest
This work was carried on in the framework of a joint project (Advanced Laboratory Automation) between Scuola Superiore Sant'Anna and Inpeco SA, which was funded by the latter.
The authors declare that the research was conducted in the absence of any commercial or financial relationships that could be construed as a potential conflict of interest.
Acknowledgments
The authors would like to thank INPECO SA (Novazzano, Switzerland - www.inpeco.com) as formal promoter of a strategic industrial initiative on P5 medicine applied to dermatology.
Supplementary Material
The Supplementary Material for this article can be found online at: https://www.frontiersin.org/articles/10.3389/fmed.2021.637069/full#supplementary-material
Supplementary Figure 1. QUADAS-2 tool analysis of bias and applicability of optical imaging techniques. Nineteen studies were included in optical imaging, of which 8 for RCM, 1 for OCT, and 10 for multispectral. The Index test is the diagnostic test that is evaluated against a reference standard test (dermoscopy or histopathology) in a study of test accuracy. The risk of bias of the reference standard was considered low since both dermoscopy and histopathology are well-validated in literature, however, those studies using different reference standards for different types of lesions were scored with high risk of bias in flow and timing. (A) Table form reporting scoring for each domain for optical imaging DTA studies. (B) Proportion of optical imaging studies with low, high, unclear risk of bias. Number of studies is reported on the graph. (C) Proportion of optical imaging studies with low, high, unclear concerns regarding applicability. Number of studies is reported on the graph.
Supplementary Figure 2. QUADAS-2 tool analysis of bias and applicability of optical spectroscopy techniques. Seven studies were included in the analysis. The Index test is the diagnostic test that is evaluated against a reference standard test (dermoscopy or histopathology) in a study of test accuracy. The risk of bias of the reference standard was considered low since both dermoscopy and histopathology are well-validated in literature, however, those studies using different reference standards for different types of lesions were scored with high risk of bias in flow and timing. (A) Table form reporting scoring for each domain for optical spectroscopy DTA studies. (B) Proportion of optical spectroscopy studies with low, high, unclear risk of bias. Number of studies is reported on the graph. (C) Proportion of optical spectroscopy studies with low, high, unclear concerns regarding applicability. Number of studies is reported on the graph.
Supplementary Figure 3. QUADAS-2 tool analysis of bias and applicability of electrical skin impedance (EIS) techniques. Seven studies were included. The Index test is the diagnostic test that is evaluated against a reference standard test (dermoscopy or histopathology) in a study of test accuracy. The risk of bias of the reference standard was considered low since both dermoscopy and histopathology are well-validated in literature, however, those studies using different reference standards for different types of lesions were scored with high risk of bias in flow and timing. (A) Table form reporting scoring for each domain for EIS DTA studies. (B) Proportion of EIS studies with low, high, unclear risk of bias. Number of studies is reported on the graph. (C) Proportion of EIS studies with low, high, unclear concerns regarding applicability. Number of studies is reported on the graph.
Supplementary Figure 4. QUADAS-2 tool analysis of bias and applicability of thermal measurements techniques. Five studies were included. The Index test is the diagnostic test that is evaluated against a reference standard test (dermoscopy or histopathology) in a study of test accuracy. The risk of bias of the reference standard was considered low since both dermoscopy and histopathology are well-validated in literature, however, those studies using different reference standards for different types of lesions were scored with high risk of bias in flow and timing. (A) Table form reporting scoring for each domain for thermal DTA studies. (B) Proportion of thermal studies with low, high, unclear risk of bias. Number of studies is reported on the graph. (C) Proportion of thermal studies with low, high, unclear concerns regarding applicability. Number of studies is reported on the graph.
Supplementary Figure 5. Forest plot of specificity and sensitivity of techniques investigated in those studies analyzed using the QUADAS-2 tool for optical based techniques (both imaging and spectroscopy). These metrics were evaluated based on the reported values of True Positive (TP), False Negative (FN), True Negative (TN), and False Positive (FP). Sensitivity and specificity were depicted with the corresponding 95% confidence interval calculated using the Clopper-Pearson method. A red dashed line in the Forest Plot represents studies analyzed using the QUADAS-2 that did not explicit TP, FN, TN, FP values. Studies were listed based on the technique exploited: Reflectance confocal microscopy (RCM, a-b), Multispectral imaging (MULTISP, c-d), Optical Coherence Tomography (OCT, e-f), Spectroscopy (SPECT, g-h). The same study is listed more than once if different thresholds, classification tasks or timing were reported in the study. For Pampena et al. (28) seven rows were reported indicating the algorithm tested (i.e., Pellacani 2005, Segura 2009, Pellacani 2021, Borsari 2018 and Borsari 2018 using only RCM) and the threshold used within the algorithm is reported in round brackets. In multispectral imaging, for Sgouros et al. (42) two different reference standards were evaluated and reported: Histology and dermoscopy. For Garcia-Urbe et al. (49) only the performance achieved in melanoma vs. benign pigmented lesions was reported in the graph.
Supplementary Figure 6. Forest plot of specificity and sensitivity of techniques investigated in those studies analyzed using the QUADAS-2 tool for skin electrical measurements techniques (EIS). These metrics were evaluated based on the reported values of True Positive (TP), False Negative (FN), True Negative (TN), and False Positive (FP). Sensitivity and specificity were depicted with the corresponding 95% confidence interval calculated using the Clopper-Pearson method. A red dashed line in the Forest Plot represents studies analyzed using the QUADAS-2 that did not explicit TP, FN, TN, FP values. The same study is listed more than once if different thresholds, classification tasks or timing were reported in the study. In particular, Rocha et al. (60), t = 0 is referred to the diagnosis done at the first time the clinician had seen the patient, while t = 3 is referred to results obtained during the 3 months follow up. Ceder et al. (59) t = 3 is referred to results obtain by the authors during the follow up. Mohr et al. (57) and Malvehy et al. (58) instead achieved two performances using different classification tasks (melanoma: melanomas vs. benign lesions, all: all malignant lesions vs. benign lesions).
Supplementary Figure 7. Forest plot of specificity and sensitivity of techniques investigated in those studies analyzed using the QUADAS-2 tool for thermal measurements techniques (THERMAL). These metrics were evaluated based on the reported values of True Positive (TP), False Negative (FN), True Negative (TN), and False Positive (FP). Sensitivity and specificity were depicted with the corresponding 95% confidence interval calculated using the Clopper-Pearson method. A red dashed line in the Forest Plot represents studies analyzed using the QUADAS-2 that did not explicit TP, FN, TN, FP values.
References
2. Melanoma Research Alliance. Washington, DC: Melanoma staging (2005) 202:336–8935. Available online at: https://www.curemelanoma.org/
3. Matsumoto M, Secrest A, Anderson A, Saul MI, Ho J, Kirkwood JM, et al. Estimating the cost of skin cancer detection by dermatology providers in a large health care system. J Am Acad Dermatol. (2018) 78:701–9.e1. doi: 10.1016/j.jaad.2017.11.033
4. Argenziano G, Fabbrocini G, Carli P, De Giorgi V, Sammarco E, Delfino M. Epiluminescence microscopy for the diagnosis of doubtful melanocytic skin lesions. Arch Dermatol. (1998) 134:1563–70. doi: 10.1001/archderm.134.12.1563
5. Stolz W, Reimann A, Cognetta A. ABCD rule of dermatoscopy: a new practical method for early recognition of malignant melanoma. Eur J Dermatol. (1994) 4:521:527.
6. Wilson RL, Yentzer BA, Isom SP, Feldman SR, Fleischer AB. How good are US dermatologists at discriminating skin cancers? A number-needed-to-treat analysis. J Dermatolog Treat. (2012) 23:65–9. doi: 10.3109/09546634.2010.512951
7. Kittler H, Pehamberger H, Wolff K, Binder M. Diagnostic accuracy of dermoscopy. Lancet Oncol. (2002) 3:159–65. doi: 10.1016/S1470-2045(02)00679-4
8. Skvara H, Teban L, Fiebiger M, Binder M, Kittler H. Limitations of dermoscopy in the recognition of melanoma. Arch Dermatol. (2005) 141:155–60. doi: 10.1001/archderm.141.2.155
9. Papageorgiou V, Apalla Z, Sotiriou E, Papageorgiou C, Lazaridou E, Vakirlis S, et al. The limitations of dermoscopy: false-positive and false-negative tumours. J Eur Acad Dermatol Venereol. (2018) 32:879–88. doi: 10.1111/jdv.14782
10. Vestergaard ME, Macaskill P, Holt PE, Menzies SW. Dermoscopy compared with naked eye examination for the diagnosis of primary melanoma: A meta-analysis of studies performed in a clinical setting. Br J Dermatol. (2008) 159:669–76. doi: 10.1111/j.1365-2133.2008.08713.x
11. Robinson JK, Nickoloff BJ. Digital epiluminescence microscopy monitoring of high-risk patients. Arch Dermatol. (2004) 140:49–56. doi: 10.1001/archderm.140.1.49
12. Narayanamurthy V, Padmapriya P, Noorasafrin A, Pooja B, Hema K, Firus Khan AY, et al. Skin cancer detection using non-invasive techniques. RSC Adv. (2018) 8:28095–130. doi: 10.1039/C8RA04164D
13. Waterhouse DJ, Fitzpatrick CRM, Pogue BW, O'Connor JPB, Bohndiek SE. A roadmap for the clinical implementation of optical-imaging biomarkers. Nat Biomed Eng. (2019) 3:339–53. doi: 10.1038/s41551-019-0392-5
14. Salameh JP, Bossuyt PM, McGrath TA, Thombs BD, Hyde CJ, MacAskill P, et al. Preferred reporting items for systematic review and meta-analysis of diagnostic test accuracy studies (PRISMA-DTA): explanation, elaboration, and checklist. BMJ. (2020) 370: m2632. doi: 10.1136/bmj.m2632
15. PROSPERO. Available online at: https://www.curemelanoma.org/
16. Guitera P, Menzies SW, Longo C, Cesinaro AM, Scolyer RA, Pellacani G. In vivo confocal microscopy for diagnosis of melanoma and basal cell carcinoma using a two-step method: analysis of 710 consecutive clinically equivocal cases. J Invest Dermatol. (2012) 132:2386–94. doi: 10.1038/jid.2012.172
17. Longo C, Farnetani F, Ciardo S, Cesinaro AM, Moscarella E, Ponti G, et al. Is confocal microscopy a valuable tool in diagnosing nodular lesions? A study of 140 cases. Br J Dermatol. (2013) 169:58–67. doi: 10.1111/bjd.12259
18. Pellacani G, Farnetani F, Gonzalez S, Longo C, Cesinaro AM, Casari A, et al. In vivo confocal microscopy for detection and grading of dysplastic nevi: a pilot study. J Am Acad Dermatol. (2012) 66:e109–21. doi: 10.1016/j.jaad.2011.05.017
19. Lui H, Zhao J, McLean D, Zeng H. Real-time raman spectroscopy for in vivo skin cancer diagnosis. Cancer Res. (2012) 72:2491–500. doi: 10.1158/0008-5472.CAN-11-4061
20. Gill M, Longo C, Farnetani F, Cesinaro AM, González S, Pellacani G. Non-invasive in vivo dermatopathology: identification of reflectance confocal microscopic correlates to specific histological features seen in melanocytic neoplasms. J Eur Acad Dermatol Venereol. (2014) 28:1069–78. doi: 10.1111/jdv.12285
21. Walter FM, Morris HC, Humphrys E, Hall PN, Prevost AT, Burrows N, et al. Effect of adding a diagnostic aid to best practice to manage suspicious pigmented lesions in primary care: Randomised controlled trial. BMJ. (2012) 345:1–14. doi: 10.1136/bmj.e4110
22. Alarcon I, Carrera C, Palou J, Alos L, Malvehy J, Puig S. Impact of in vivo reflectance confocal microscopy on the number needed to treat melanoma in doubtful lesions. Br J Dermatol. (2014) 170:802–8. doi: 10.1111/bjd.12678
23. Stanganelli I, Longo C, Mazzoni L, Magi S, Medri M, Lanzanova G, et al. Integration of reflectance confocal microscopy in sequential dermoscopy follow-up improves melanoma detection accuracy. Br J Dermatol. (2015) 172:365–71. doi: 10.1111/bjd.13373
24. Vaišnoriene I, Rotomskis R, Kulvietis V, Eidukevičius R, Žalgevičiene V, Laurinavičiene A, et al. Nevomelanocytic atypia detection by in vivo reflectance confocal microscopy. Medicina. (2014) 50:209–15. doi: 10.1016/j.medici.2014.09.008
25. Farnetani F, Scope A, Braun RP, Gonzalez S, Guitera P, Malvehy J, et al. Skin cancer diagnosis with reflectance confocal microscopy: reproducibility of feature recognition and accuracy of diagnosis. JAMA Dermatol. (2015) 151:1075–80. doi: 10.1001/jamadermatol.2015.0810
26. Lovatto L, Carrera C, Salerni G, Alõs L, Malvehy J, Puig S. In vivo reflectance confocal microscopy of equivocal melanocytic lesions detected by digital dermoscopy follow-up. J Eur Acad Dermatol Venereol. (2015) 29:1918–25. doi: 10.1111/jdv.13067
27. Borsari S, Pampena R, Benati E, Bombonato C, Kyrgidis A, Moscarella E, et al. In vivo dermoscopic and confocal microscopy multistep algorithm to detect in situ melanomas. Br J Dermatol. (2018) 179:163–72. doi: 10.1111/bjd.16364
28. Pampena R, Borsari S, Lai M, Benati E, Longhitano S, Mirra M, et al. External validation and comparison of four confocal microscopic scores for melanoma diagnosis on a retrospective series of highly suspicious melanocytic lesions. J Eur Acad Dermatol Venereol. (2019) 33:1541–6. doi: 10.1111/jdv.15617
29. Boone MALM, Suppa M, Dhaenens F, Miyamoto M, Marneffe A, Jemec GBE, et al. In vivo assessment of optical properties of melanocytic skin lesions and differentiation of melanoma from non-malignant lesions by high-definition optical coherence tomography. Arch Dermatol Res. (2015) 308:7–20. doi: 10.1007/s00403-015-1608-5
30. Garbarino F, Migliorati S, Farnetani F, De Pace B, Ciardo S, Manfredini M, et al. Nodular skin lesions: correlation of reflectance confocal microscopy and optical coherence tomography features. J Eur Acad Dermatol Venereol. (2020) 34:101–11. doi: 10.1111/jdv.15953
31. Longo C, Mazzeo M, Raucci M, Cornacchia L, Lai M, Bianchi L, et al. Dark pigmented lesions: diagnostic accuracy of dermatoscopy and reflectance confocal microscopy in a tertiary referral center for skin cancer diagnosis. J Am Acad Dermatol. (2020). doi: 10.1016/j.jaad.2020.07.084
32. Boone MALM, Norrenberg S, Jemec GBE, Del Marmol V. High-definition optical coherence tomography imaging of melanocytic lesions: A pilot study. Arch Dermatol Res. (2014) 306:11–26. doi: 10.1007/s00403-013-1387-9
33. Bodén I, Nyström J, Lundskog B, Zazo V, Geladi P, Lindholm-Sethson B, et al. Non-invasive identification of melanoma with near-infrared and skin impedance spectroscopy. Ski Res Technol. (2013) 19:1–6. doi: 10.1111/j.1600-0846.2012.00668.x
34. Gambichler T, Plura I, Schmid-Wendtner M, Valavanis K, Kulichova D, Stücker M, et al. High-definition optical coherence tomography of melanocytic skin lesions. J Biophotonics. (2015) 8:681–6. doi: 10.1002/jbio.201400085
35. Gambichler T, Schmid-Wendtner MH, Plura I, Kampilafkos P, Stücker M, Berking C, et al. A multicentre pilot study investigating high-definition optical coherence tomography in the differentiation of cutaneous melanoma and melanocytic naevi. J Eur Acad Dermatol Venereol. (2015) 29:537–41. doi: 10.1111/jdv.12621
36. Moraes Pinto Blumetti TC, Cohen MP, Gomes EE, Petaccia De Macedo M, Ferreira De Souza Begnami MD, Tavares Guerreiro Fregnani JH, et al. Optical coherence tomography (OCT) features of nevi and melanomas and their association with intraepidermal or dermal involvement: A pilot study. J Am Acad Dermatol. (2015) 73:315–7. doi: 10.1016/j.jaad.2015.05.009
37. Monheit G, Cognetta AB, Ferris L, Rabinovitz H, Gross K, Martini M, et al. The performance of MelaFind: a prospective multicenter study. Arch Dermatol. (2011) 147:188–94. doi: 10.1001/archdermatol.2010.302
38. Emery JD, Hunter J, Hall PN, Watson AJ, Moncrieff M, Walter FM. Accuracy of SIAscopy for pigmented skin lesions encountered in primary care: Development and validation of a new diagnostic algorithm. BMC Dermatol. (2010) 10:9. doi: 10.1186/1471-5945-10-9
39. Kuzmina I, Diebele I, Jakovels D, Spigulis J, Valeine L, Kapostinsh J, et al. Towards non-contact skin melanoma selection by multispectral imaging analysis. J Biomed Opt. (2011) 16:060502. doi: 10.1117/1.3584846
40. Diebele I, Kuzmina I, Kapostinsh J, Derjabo A, Spigulis J. Melanoma-nevus differentiation by multispectral imaging. Opt InfoBase Conf Pap. (2011):80872G. doi: 10.1364/ECBO.2011.80872G
41. Diebele I, Kuzmina I, Lihachev A, Kapostinsh J, Derjabo A, Valeine L, et al. Clinical evaluation of melanomas and common nevi by spectral imaging. Biomed Opt Express. (2012) 3:467. doi: 10.1364/BOE.3.000467
42. Sgouros D, Lallas A, Julian Y, Rigopoulos D, Zalaudek I, Longo C, et al. Assessment of SIAscopy in the triage of suspicious skin tumours. Ski Res Technol. (2014) 20:440–4. doi: 10.1111/srt.12138
43. Farberg AS, Winkelmann RR, Tucker N, White R, Rigel DS. The impact of quantitative data provided by a multi-spectral digital skin lesion analysis device on dermatologists' decisions to biopsy pigmented lesions. J Clin Aesthet Dermatol. (2017) 10:24–6.
44. Delpueyo X, Vilaseca M, Royo S, Ares M, Rey-Barroso L, Sanabria F, et al. Multispectral imaging system based on light-emitting diodes for the detection of melanomas and basal cell carcinomas: a pilot study. J Biomed Opt. (2017) 22:065006. doi: 10.1117/1.JBO.22.6.065006
45. Rey-Barroso L, Burgos-Fernández FJ, Delpueyo X, Ares M, Royo S, Malvehy J, et al. Visible and extended near-infrared multispectral imaging for skin cancer diagnosis. Sensors. (2018) 18:1–15. doi: 10.3390/s18051441
46. Hosking AM, Coakley BJ, Chang D, Talebi-Liasi F, Lish S, Lee SW, et al. Hyperspectral imaging in automated digital dermoscopy screening for melanoma. Lasers Surg Med. (2019) 51:214–22. doi: 10.1002/lsm.23055
47. Lange M, Kiss N, Fesus L, Plorina EV, Derjabo A, Spigulis J. Non-invasive LED-based screening solution for skin cancer. (2019) 11073:17. doi: 10.1117/12.2526386
48. MacLellan AN, Price EL, Publicover-Brouwer P, Matheson K, Ly TY, Pasternak S, et al. The use of non-invasive imaging techniques in the diagnosis of melanoma: a prospective diagnostic accuracy study. J Am Acad Dermatol. (2020) doi: 10.1016/j.jaad.2020.04.019
49. Garcia-Uribe A, Zou J, Duvic M, Cho-Vega JH, Prieto VG, Wang LV. In vivo diagnosis of melanoma and nonmelanoma skin cancer using oblique incidence diffuse reflectance spectrometry. Cancer Res. (2012) 72:2738–45. doi: 10.1158/0008-5472.CAN-11-4027
50. Lim L, Nichols B, Migden MR, Rajaram N, Reichenberg JS, Markey MK, et al. Clinical study of non-invasive in vivo melanoma and non-melanoma skin cancers using multimodal spectral diagnosis. J Biomed Opt. (2014) 19:117003. doi: 10.1117/1.JBO.19.11.117003
51. Saf A, Ziauddin S, Horsch A, Ziai M, Castaneda V, Lasser T, et al. Feasibility study of optical spectroscopy as a medical tool for diagnosis of skin lesions. Int J Adv Comput Sci Appl. (2016) 7. doi: 10.14569/IJACSA.2016.071052
52. Shirkavand A, Sarkar S, Ataie-Fashtami L, Mohammadreza H. Detection of melanoma skin cancer by elastic scattering spectra: a proposed classification method. Iran J Med Phys. (2017) 14:162–166. doi: 10.22038/ijmp.2017.21367.1203
53. Khristoforova YA, Bratchenko IA, Myakinin OO, Artemyev DN, Moryatov AA, Orlov AE, et al. Portable spectroscopic system for in vivo skin neoplasms diagnostics by Raman and autofluorescence analysis. J Biophotonics. (2019) 12:1–11. doi: 10.1002/jbio.201800400
54. Rodriguez-Diaz E, Manolakos D, Christman H, Bonning MA, Geisse JK, A'Amar OM, et al. Optical Spectroscopy as a method for skin cancer risk assessment. Photochem Photobiol. (2019) 95:1441–5. doi: 10.1111/php.13140
55. Zhang Y, Moy AJ, Feng X, Nguyen HTM, Sebastian KR, Reichenberg JS, et al. Assessment of Raman spectroscopy for reducing unnecessary biopsies for melanoma screening. Molecules. (2020) 25:1–9. doi: 10.3390/molecules25122852
56. Åberg P, Birgersson U, Elsner P, Mohr P, Ollmar S. Electrical impedance spectroscopy and the diagnostic accuracy for malignant melanoma. Exp Dermatol. (2011) 20:648–52. doi: 10.1111/j.1600-0625.2011.01285.x
57. Mohr P, Birgersson U, Berking C, Henderson C, Trefzer U, Kemeny L, et al. Electrical impedance spectroscopy as a potential adjunct diagnostic tool for cutaneous melanoma. Ski Res Technol. (2013) 19:75–83. doi: 10.1111/srt.12008
58. Malvehy J, Hauschild A, Curiel-Lewandrowski C, Mohr P, Hofmann-Wellenhof R, Motley R, et al. Clinical performance of the nevisense system in cutaneous melanoma detection: an international, multicentre, prospective and blinded clinical trial on efficacy and safety. Br J Dermatol. (2014) 171:1099–107. doi: 10.1111/bjd.13121
59. Ceder H, Sjoholm Hylen A, Wennberg Larko A-M, Paoli J. Evaluation of electrical impedance spectroscopy as an adjunct to dermoscopy in short-term monitoring of atypical melanocytic lesions. Dermatol Pract Concept. (2016) 6:1–6. doi: 10.5826/dpc.0604a01
60. Rocha L, Menzies SW, Lo S, Avramidis M, Khoury R, Jackett L, et al. Analysis of an electrical impedance spectroscopy system in short-term digital dermoscopy imaging of melanocytic lesions. Br J Dermatol. (2017) 177:1432–8. doi: 10.1111/bjd.15595
61. Gilou S, Dimitrousis C, Zogkas A, Kemanetzi C, Korfitis C, Lazaridou E, et al. Artificial neural networks and statistical classification applied to electrical impedance spectroscopy data for melanoma diagnosis in dermatology (DermaSense). In: 2018 14th Symposium on Neural Networks and Applications (NEUREL). Belgrade: IEEE (2018). p. 1–5. doi: 10.1109/NEUREL.2018.8586995
62. Svoboda RM, Franco AI, Rigel DS. Electrical impedance spectroscopy versus clinical inspection approaches: melanoma efficacy detection comparison. Ski J Cutan Med. (2018) 2:162–7. doi: 10.25251/skin.2.3.2
63. Svoboda RM, Prado G, Mirsky RS, Rigel DS. Assessment of clinician accuracy for diagnosing melanoma on the basis of electrical impedance spectroscopy score plus morphology versus lesion morphology alone. J Am Acad Dermatol. (2019) 80:285–7. doi: 10.1016/j.jaad.2018.08.048
64. Arnold-Brüning FS, Blaschke T, Kramer K, Lademann J, Thiede G, Fluhr JW, et al. Application of parelectric spectroscopy to detect skin cancer—a pilot study. Ski Res Technol. (2020) 26:234–40. doi: 10.1111/srt.12785
65. Litchman GH, Marson JW, Svoboda RM, Rigel DS. Integrating electrical impedance spectroscopy into clinical. Skin. (2020) 4:424–30. doi: 10.25251/skin.4.5.5
66. Pirtini Çetingül M, Herman C. Quantification of the thermal signature of a melanoma lesion. Int J Therm Sci. (2011) 50:421–31. doi: 10.1016/j.ijthermalsci.2010.10.019
67. Pirtini Çetingül M, Alani RM, Herman C. Quantitative evaluation of skin lesions using transient thermal imaging. In: 2010 14th International Heat Transfer Conference. Washington, DC (2010). p. 31–39.
68. Herman C, Cetingul MP. Quantitative visualization and detection of skin cancer using dynamic thermal imaging. J Vis Exp. (2011):2679. doi: 10.3791/2679
69. Pirtini Çetingül M, Çetingül HE, Herman C. Analysis of transient thermal images to distinguish melanoma from dysplastic nevi. Med Imaging 2011 Comput Diagnosis. (2011) 7963:79633N. doi: 10.1117/12.877858
70. Pirtini Çetingül M, Herman C. The assessment of melanoma risk using the dynamic infrared imaging technique. J Therm Sci Eng Appl. (2011) 3:1–9. doi: 10.1115/1.4004424
71. González FJ, Castillo-Martínez C, Valdes-Rodríguez R, Kolosovas-Machuca ES, Villela-Segura U, Moncada B. Thermal signature of melanoma and non-melanoma skin cancers. 11th International Conference on Quantitative InfraRed Thermography. Naples: (2012). vol. 3. doi: 10.21611/qirt.2012.276
72. Godoy SE, Ramirez DA, Myers SA, Von Winckel G, Krishna S, Berwick M, et al. Dynamic infrared imaging for skin cancer screening. Infrared Phys Technol. (2015) 70:147–52. doi: 10.1016/j.infrared.2014.09.017
73. Godoy SE, Hayat MM, Ramirez DA, Myers SA, Padilla RS, Krishna S. Detection theory for accurate and non-invasive skin cancer diagnosis using dynamic thermal imaging. Biomed Opt Express. (2017) 8:2301. doi: 10.1364/BOE.8.002301
74. Magalhaes C, Vardasca R, Mendes J. Classifying skin neoplasms with infrared thermal images. 14th Quantitative InfraRed Thermography Conference. Berlin:. (2018). p. 1–6. doi: 10.21611/qirt.2018.013
75. Okabe T, Fujimura T, Okajima J, Kambayashi Y, Aiba S, Maruyama S. First-in-human clinical study of novel technique to diagnose malignant melanoma via thermal conductivity measurements. Sci Rep. (2019) 9:1–7. doi: 10.1038/s41598-019-40444-6
76. Magalhaes C, Mendes J, Valenca Filipe R, Vardasca R. Skin neoplasms dynamic thermal assessment. In: 2019 IEEE 6th Portuguese Meeting on Bioengineering (ENBENG). Lisbon: IEEE (2019). p. 1–4. doi: 10.1109/ENBENG.2019.8692482
77. Magalhaes C, Vardasca R, Rebelo M, Valenca-Filipe R, Ribeiro M, Mendes J. Distinguishing melanocytic nevi from melanomas using static and dynamic infrared thermal imaging. J Eur Acad Dermatol Venereol. (2019) 33:1700–5. doi: 10.1111/jdv.15611
78. Critical Appraisal Skills Programme. CASP Qualitative Checklist. (2018). Available online at: https://casp-uk.net/casp-tools-checklists/ (accessed September 15, 2020).
79. Whiting PF, Rutjes AWS, Westwood ME, Mallett S, Deeks JJ, Reitsma JB, et al. QUADAS-2: a revised tool for the quality assessment of diagnostic accuracy studies. Ann Intern Med. (2011) 155:529–36. doi: 10.7326/0003-4819-155-8-201110180-00009
80. Freeman SC, Kerby CR, Patel A, Cooper NJ, Quinn T, Sutton AJ. Development of an interactive web-based tool to conduct and interrogate meta-analysis of diagnostic test accuracy studies: MetaDTA. BMC Med Res Methodol. (2019) 19:81. doi: 10.1186/s12874-019-0724-x
81. Patel A, Cooper N, Freeman S, Sutton A. Graphical enhancements to summary receiver operating characteristic plots to facilitate the analysis and reporting of meta-analysis of diagnostic test accuracy data. Res Synth Methods. (2020) 12:34–44. doi: 10.1002/jrsm.1439
82. Clopper CJ, Pearson ES. The use of confidence or fiducial limits illustrated in the case of the binomial. Biometrika. (1934) 26:404. doi: 10.1093/biomet/26.4.404
83. Pellacani G, Cesinaro AM, Seidenari S. Reflectance-mode confocal microscopy of pigmented skin lesions-improvement in melanoma diagnostic specificity. J Am Acad Dermatol. (2005) 53:979–85. doi: 10.1016/j.jaad.2005.08.022
84. Segura S, Puig S, Carrera C, Palou J, Malvehy J. Development of a two-step method for the diagnosis of melanoma by reflectance confocal microscopy. J Am Acad Dermatol. (2009) 61:216–29. doi: 10.1016/j.jaad.2009.02.014
85. Kuzmina I, Diebele I, Valeine L, Jakovels D, Kempele A, Kapostinsh J, et al. Multi-spectral imaging analysis of pigmented and vascular skin lesions: results of a clinical trial. Photonic Ther Diagnostics VII. (2011) 7883:788312. doi: 10.1117/12.887207
86. Ng JC, Swain S, Dowling JP, Wolfe R, Simpson P, Kelly JW. The impact of partial biopsy on histopathologic diagnosis of cutaneous melanoma: experience of an Australian tertiary referral service. Arch Dermatol. (2010) 146:234–9. doi: 10.1001/archdermatol.2010.14
87. Guitera P, Pellacani G, Crotty KA, Scolyer RA, Li LXL, Bassoli S, et al. The impact of in vivo reflectance confocal microscopy on the diagnostic accuracy of lentigo maligna and equivocal pigmented and non-pigmented macules of the face. J Invest Dermatol. (2010) 130:2080–91. doi: 10.1038/jid.2010.84
88. Alarcón I, Carrera C, Puig S, Malvehy J. Clinical usefulness of reflectance confocal microscopy in the management of facial lentigo maligna melanoma | Elsevier enhanced reader. Actas Dermosigiliogr. (2014)105:e13–7. doi: 10.1016/j.adengl.2013.02.019
89. Gamo R, Pampín A, Floristán U. Reflectance confocal microscopy in lentigo maligna. Actas Dermosigiliogr. (2016) 107:830–5. doi: 10.1016/j.adengl.2016.09.014
90. Guitera P, Moloney FJ, Menzies SW, Stretch JR, Quinn MJ, Hong A, et al. Improving management and patient care in lentigo maligna by mapping with in vivo confocal microscopy. JAMA Dermatol. (2013) 149:692–8. doi: 10.1001/jamadermatol.2013.2301
Keywords: melanoma, diagnosis, non-invasive technique, diagnostic performance, skin cancer, meta-analysis
Citation: Blundo A, Cignoni A, Banfi T and Ciuti G (2021) Comparative Analysis of Diagnostic Techniques for Melanoma Detection: A Systematic Review of Diagnostic Test Accuracy Studies and Meta-Analysis. Front. Med. 8:637069. doi: 10.3389/fmed.2021.637069
Received: 02 December 2020; Accepted: 17 March 2021;
Published: 21 April 2021.
Edited by:
Mitchell Stark, The University of Queensland, AustraliaReviewed by:
Giovanni Pellacani, University of Modena and Reggio Emilia, ItalyPiergiacomo Calzavara-pinton, University of Brescia, Italy
Copyright © 2021 Blundo, Cignoni, Banfi and Ciuti. This is an open-access article distributed under the terms of the Creative Commons Attribution License (CC BY). The use, distribution or reproduction in other forums is permitted, provided the original author(s) and the copyright owner(s) are credited and that the original publication in this journal is cited, in accordance with accepted academic practice. No use, distribution or reproduction is permitted which does not comply with these terms.
*Correspondence: Alessia Blundo, YWxlc3NpYS5ibHVuZG9Ac2FudGFubmFwaXNhLml0; Gastone Ciuti, Z2FzdG9uZS5jaXV0aUBzYW50YW5uYXBpc2EuaXQ=