 Vanda Marques1
 Marta B. Afonso1
 Nina Bierig2
 Filipa Duarte-Ramos1,3Álvaro Santos-Laso4Raul Jimenez-Agüero4Emma Eizaguirre4Luis Bujanda4,5Maria J. Pareja6Rita Luís7Adília Costa7
 Mariana V. Machado8,9
 Cristina Alonso10
 Enara Arretxe10José M. Alustiza4,11Marcin Krawczyk12,13
 Frank Lammert12
 Dina G. Tiniakos14,15Bertram Flehmig2Helena Cortez-Pinto8,9
 Jesus M. Banales4,5,16
 Rui E. Castro1
 Andrea Normann2
 Cecília M. P. Rodrigues1*
- 1Research Institute for Medicines (iMed.ULisboa), Faculty of Pharmacy, Universidade de Lisboa, Lisbon, Portugal
- 2Mediagnost, GmbH, Reutlingen, Germany
- 3EPIUnit–Instituto de Saúde Pública, Universidade do Porto, Oporto, Portugal
- 4Department of Liver and Gastrointestinal Diseases, Biodonostia Health Research Institute, Donostia University Hospital, University of the Basque Country (UPV/EHU), San Sebastian, Spain
- 5National Institute for the Study of Liver and Gastrointestinal Diseases (CIBERehd, Instituto de Salud Carlos III), Madrid, Spain
- 6Hospital de Valme, Sevilla, Spain
- 7Department of Pathological Anatomy, Hospital de Santa Maria, Centro Hospitalar Universitário Lisboa Norte, Lisbon, Portugal
- 8Faculdade de Medicina, Clinica Universitária de Gastrenterologia, Universidade de Lisboa, Lisbon, Portugal
- 9Department of Gastroenterology, Hospital de Santa Maria, Centro Hospitalar Universitário Lisboa Norte, Lisbon, Portugal
- 10OWL Metabolomics, Bizkaia Technology Park, Derio, Spain
- 11Radiology Service, Osatek, Donostia, Spain
- 12Department of Medicine II, Saarland University Medical Center, Homburg, Germany
- 13Laboratory of Metabolic Liver Diseases, Department of General, Transplant and Liver Surgery, Centre for Preclinical Research, Medical University of Warsaw, Warsaw, Poland
- 14Faculty of Medical Sciences, Translational and Clinical Research Institute, Newcastle University, Newcastle upon Tyne, United Kingdom
- 15Department of Pathology, Aretaieio Hospital, National and Kapodistrian University of Athens, Athens, Greece
- 16IKERBASQUE, Basque Foundation for Science, Bilbao, Spain
Background: Nonalcoholic fatty liver disease (NAFLD) is the most common chronic liver disease where liver biopsy remains the gold standard for diagnosis. Here we aimed to evaluate the role of circulating adiponectin, leptin, and insulin-like growth factor 1 (IGF-1) levels as non-invasive NAFLD biomarkers and assess their correlation with the metabolome.
Materials and Methods: Leptin, adiponectin, and IGF-1 serum levels were measured by ELISA in two independent cohorts of biopsy-proven obese NAFLD patients and healthy-liver controls (discovery: 38 NAFLD, 13 controls; validation: 194 NAFLD, 31 controls) and correlated with clinical data, histology, genetic parameters, and serum metabolomics.
Results: In both cohorts, leptin increased in NAFLD vs. controls (discovery: AUROC 0.88; validation: AUROC 0.83; p < 0.0001). The leptin levels were similar between obese and non-obese healthy controls, suggesting that obesity is not a confounding factor. In the discovery cohort, adiponectin was lower in non-alcoholic steatohepatitis (NASH) vs. non-alcoholic fatty liver (AUROC 0.87; p < 0.0001). For the validation cohort, significance was attained for homozygous for PNPLA3 allele c.444C (AUROC 0.63; p < 0.05). Combining adiponectin with specific serum lipids improved the assay performance (AUROC 0.80; p < 0.0001). For the validation cohort, IGF-1 was lower with advanced fibrosis (AUROC 0.67, p < 0.05), but combination with international normalized ratio (INR) and ferritin increased the assay performance (AUROC 0.81; p < 0.01).
Conclusion: Serum leptin discriminates NAFLD, and adiponectin combined with specific lipids stratifies NASH. IGF-1, INR, and ferritin distinguish advanced fibrosis.
Introduction
Non-alcoholic fatty liver disease (NAFLD) is one of the most prevalent chronic liver conditions and an important risk factor for liver cirrhosis and hepatocellular carcinoma. The NAFLD spectrum varies from simple fat accumulation to non-alcoholic steatohepatitis (NASH), characterized by hepatocellular injury, inflammation, and, eventually, fibrosis (1). In fact, the increasing prevalence of NAFLD parallels that of obesity and is accompanied by rising liver-related morbidity and mortality and, consequently, increased socio-economic burden (2). Clinical practice guidelines recommend NAFLD screening in individuals with metabolic risk factors, such as obesity, type 2 diabetes, and hypertension (metabolic syndrome) (3, 4). Most NAFLD patients are clinically asymptomatic, and when present, the symptoms are unspecific and associated with advanced disease. Furthermore, liver function tests may be within normal range or only slightly increased. Thus, panels composed by anthropometric and blood biochemistry data have been proposed to assess hepatic steatosis (fatty liver index, hepatic steatotic index, NAFLD liver fat score, SteatoTest), although with modest performance compared with imaging biomarkers. In turn, imaging techniques [ultrasonography, magnetic resonance imaging (MRI)] are not fully conclusive at identifying liver inflammation and hepatocyte injury typical of NASH or distinguishing NASH from fatty liver (3, 4). Indeed differential diagnosis between non-alcoholic fatty liver (NAFL) and NASH is an important indicator of increased risk of cirrhosis and other hepatic co-morbidities, although the stage of fibrosis is increasingly recognized as the most relevant NASH prognostic marker (5).
Caspase-3-generated cytokeratin-18 is the most studied biomarker for NASH diagnosis but has limited sensitivity for NASH stage screening (6); hence, other putative biomarkers (inflammatory markers, adipokines, and others) are emerging (7). In parallel, biomarker panels combining several blood parameters are being proposed for fibrosis staging, such as aspartate aminotransferase (AST) to alanine aminotransferase (ALT) ratio, AST/platelet ratio index (APRI), fibrosis-4 index (Fib-4), or FibroTest, but accuracy has been limited as they mostly rely on liver injury markers (8). To date, liver biopsy is the gold-standard method to accurately discriminate NAFL from NASH, to evaluate the extent of tissue damage and fibrosis, and to rule out other etiologies. However, this is an expensive and invasive procedure with potential for serious complications (9). Moreover, liver biopsy lacks the ability to provide a complete 3D liver overview and is limited by sampling variability. Hence, identification and validation of simple, specific, reproducible, and non-invasive biomarkers that accurately diagnose and monitor NAFLD patients constitute an urgent unmet medical need. NAFLD is generally regarded as a hepatic manifestation of metabolic syndrome (10). Although not yet fully understood, the disease pathogenesis involves disturbances in adipose tissue, insulin resistance, and inflammation (11). Thus, adipokines' and related cytokines' role in NAFLD pathogenesis and severity has been equated (12), and their potential as non-invasive biomarkers of diagnosis and staging deserves further investigation. Moreover, lipid and metabolite signatures in plasma and in liver tissue associated with NAFLD and/or fibrosis (13–15) may further support non-invasive NAFLD diagnosis (16).
We hypothesize that serum adipokines—leptin and adiponectin—and liver-produced insulin-like growth factor 1 (IGF-1) are useful circulating biomarkers for NAFLD diagnosis and stratification. We assessed their potential as non-invasive biomarkers in the discovery and validation cohorts of biopsy-proven NAFLD patients and evaluated their impact on the metabolome.
Materials and Methods
Patient Cohorts
Human serum samples were collected from two independent cohorts of morbidly obese adult patients with biopsy-proven diagnosis of NAFLD, who were undergoing bariatric surgery [body mass index (BMI) ≥35 kg/m2], and healthy-liver individuals (17) (BMI <35 kg/m2) from Santa Maria Hospital (Lisbon, Portugal; discovery cohort) and Donostia University Hospital (San Sebastian, Spain; validation cohort). Up to 20% of the patients were taking statins. The patient inclusion criteria consisted in liver biopsy-proven NAFLD diagnosis and BMI ≥35 kg/m2. The exclusion criteria included alcohol consumption ≥20 (females) or ≥30 g/day (males), viral hepatitis B and C, and other causes of chronic liver disease. The liver biopsies were obtained during bariatric surgery, under standard procedures. Fibrosis was assessed from a distance >0.5 cm from the liver capsule. Blood and tissue samples were collected at a maximum of 1-week interval, while liver imaging was performed within 24 h of surgery. Sample collection was performed after receipt of the patient's informed consent and the Institutional Review Board's approval, in accordance with the Declaration of Helsinki. For histology purposes, formalin-fixed paraffin-embedded tissue sections were routinely stained with hematoxylin–eosin method and with Masson's trichrome for fibrosis evaluation. Histological evaluation was performed by experienced pathologists in a blinded fashion following agreement on the histological features of NAFLD/NASH assessment and NASH diagnosis. NAFLD activity score (NAS 0–8) and fibrosis stage (F0–4) were assigned to each biopsy according to the NASH Clinical Research Network histological scoring system (18). Fibrosis extent was dichotomized as early (F0–2) and advanced (F3–4) fibrosis. Where possible, fibrosis scores APRI (19), Fib-4 (20), and NAFLD fibrosis score (NFS) (21) were calculated. Individuals were classified as healthy non-obese controls (BMI <35 kg/m2), healthy obese controls [BMI ≥35 kg/m2, maximum NAS = 1 (if steatosis = 0) and maximum fibrosis score = 1], NAFL (NAS ≤ 4), or NASH (NAS ≥5). Liver biopsies were obtained from healthy non-obese individuals that were referred for hepatic surgery without an underlying liver disease (17).
The discovery cohort (n = 51) included three groups: healthy non-obese controls (n = 13), NAFL (n = 26), and NASH patients (n = 12). Routine biochemical parameters were available; however, detailed histological data was not fully disclosed.
The validation cohort (n = 225) encompassed four groups: healthy non-obese controls (n = 20), healthy obese controls (n = 11), NAFL (n = 100), and NASH patients (n = 94). Routine biochemical parameters were available, and detailed histological data is described in Supplementary Table 1. Information on co-morbidities (arterial hypertension, diabetes, dyslipidemia, and cholelithiasis), genetic polymorphisms [PNPLA3 rs738409 (c.444C>G, p.I148M), MBOAT7 rs641738 (c.50G>A, p.G17E), and TM6SF2 rs58542926 (c.449C>T, p.E167K)], liver hepatic triglyceride (TG) content evaluation by Folch method (17) (n = 140), and imaging assessment of liver steatosis (MRI; n = 122) were also available.
Serum Hormones and Data Analysis
The serum levels of leptin, adiponectin, and IGF-1 were measured in single determination using specific enzyme-linked immunosorbent assay kits according to the manufacturer's instructions (Mediagnost GmbH, Reutlingen, Germany) and correlated with NAFLD activity score, fibrosis stage, biochemical parameters, genotypes, imaging data, and co-morbidities. Data analysis was first performed in the discovery cohort and then expanded to the validation cohort. The normality of values distribution was tested with Kolmogorov–Smirnov (n ≥ 50) or Shapiro–Wilk (n < 50) tests. According to the normality of values distribution, one-way ANOVA or Kruskal–Wallis test followed by Bonferroni or Dunn's multiple-comparison test were used to determine differences between sample groups according to NAS score, steatosis, lobular inflammation and ballooning stages, and genotypes. Differences according to fibrosis dichotomy and presence of co-morbidities were determined with unpaired t-test or Mann–Whitney U-test. To correlate hormone serum levels and biochemical parameters or imaging data, Pearson or Spearman correlation coefficient and linear regression analysis were applied. Uniparameter receiver operating characteristic (ROC) curve analysis tested the hormones' discriminatory power. Cutoff values were retrieved from Youden index. Variables presenting an area under the ROC curve (AUROC) value superior to 0.60 and p < 0.05 were selected for binomial logistic regression analysis. Multi-parameter ROC curves were established for relevant parameter combinations, where an AUROC value >0.80 was considered a very good assay performance. Associated sensitivity, specificity, and positive predictive value (PPV) and negative predictive value (NPV) were estimated. A p-value <0.05 was considered significant. All statistical analysis were performed using GraphPad Prism, version 8.0.2 (La Jolla, California, USA) and IBM SPSS Statistics, version 26 (Armonk, New York, USA).
Metabolomic Analysis
Serum samples from 198 patients in the validation cohort were randomly selected for metabolomic analysis by liquid chromatography–time of flight–mass spectrometry. Two separate liquid chromatography–time of flight–mass spectrometry-based platforms were used: platform 1 to analyze methanol lipid extracts [including fatty acids (FA), acyl carnitines, bile acids, lysoglycerophospholipids, N-acyl ethanolamines, and oxidized FA] and platform 2 for methanol/chloroform lipid extracts (including glycerolipids, cholesterol esters, sphingolipids, and glycerophospholipids) (22). Quality control calibration and validation samples were used to assess data quality. The spectra were mass-corrected by reference to leucine enkephalin. System control and data pre-processing were performed using Masslynx 4.1 software and TargetLynx application manager (Waters Corp., Milford, USA). Peak detection, noise reduction, and data normalization were performed as previously described (23). For univariate analyses, the samples were grouped according to the median serum level of each hormone (leptin = 39.61 ng/ml; adiponectin = 4.84 μg/ml; IGF-1 = 103.65 ng/ml). Log2 fold change for metabolite levels between higher than median vs. lower than median hormone level groups was determined and compared using unpaired Student's t-test (p < 0.05) using R v.3.4.1 (R Development Core Team, 2017; http://cran.r-project.org). A p-value <0.05 was considered significant.
Results
Clinical and Biochemical Features of Patient Cohorts
In both cohorts, the NAFL and NASH patients were similar with respecting to age, gender, BMI, gamma-glutamyl transferase (GGT), serum glucose, triglycerides, and cholesterol [total, high-density lipoprotein (HDL) or low-density lipoprotein (LDL)] concentrations (Tables 1, 2). While in the discovery cohort the NAFL and NASH patients had similar circulating AST and ALT, in the validation cohort these liver injury markers and liver fat content evaluated by magnetic resonance imaging and Folch method were increased in NASH vs. NAFL (p < 0.05). The prevalence of co-morbidities was similar between NAFL and NASH patients, except for dyslipidemia (higher in NASH vs. NAFL; p < 0.05). PNPLA3 risk allele c.444G frequency vs. wild-type allele was lower in both controls (12.5 vs. 87.5%) and NAFLD (23.7 vs. 76.3%), consistent with previous reports (24). Similarly to previous literature (25), in NAFLD patients, TM6SF2 risk allele c.499T showed a frequency of 5.7%, while MBOAT7 risk allele c.50>A presented a frequency of 45.7%.
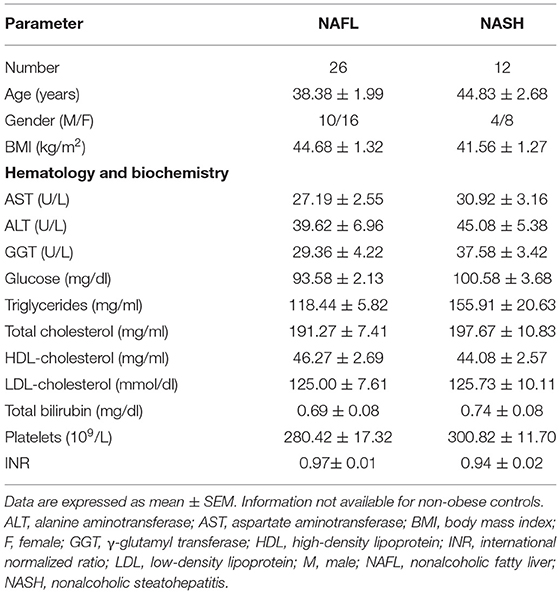
Table 1. Patient demographic and clinical and laboratory data for the discovery cohort.
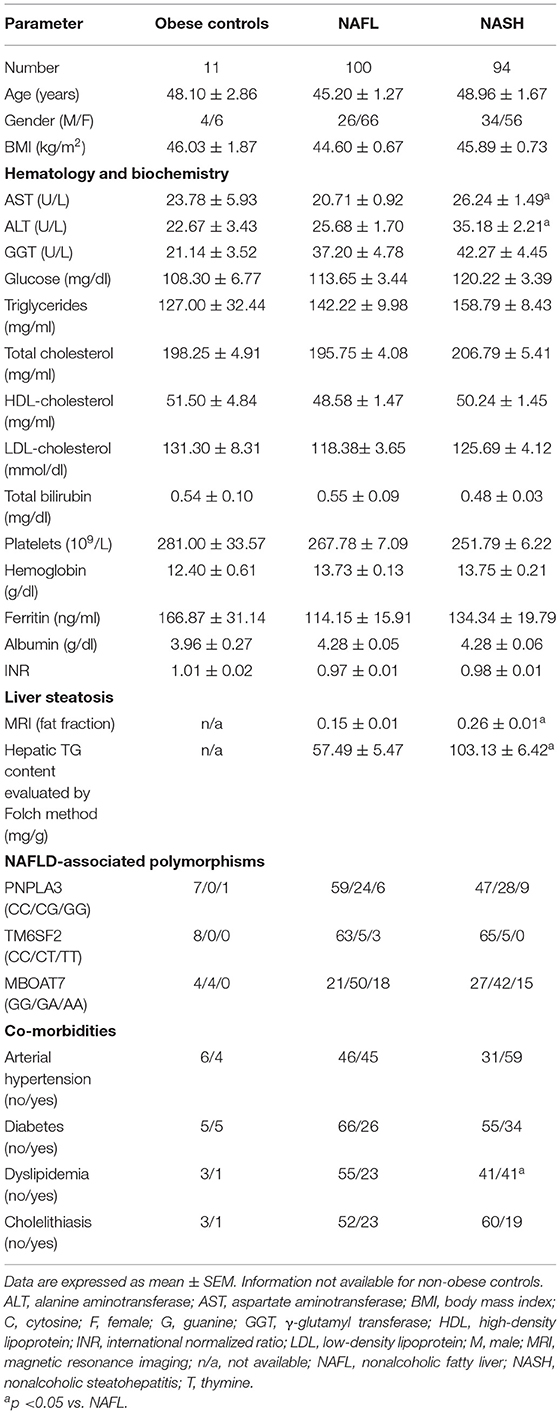
Table 2. Patient demographic, clinical and laboratory data for validation cohort.
Leptin Predicts NAFLD and Correlates With Serum Content
The impact of BMI on leptin and its influence on liver fibrosis remain controversial (26). We observed lower leptin levels in men than in women (discovery cohort: 20.63 ± 3.57 vs. 40.63 ± 4.00 ng/ml, p < 0.01; validation cohort: 25.8 ± 2.03 vs. 49.55 ± 1.99 ng/ml, p < 0.0001) as reported before (27). In the discovery cohort, serum leptin was higher in NAFL (31.43 ± 3.59 ng/ml, p < 0.01) and NASH (37.62 ± 5.12 ng/ml, p < 0.001) vs. in non-obese controls (8.92 ± 2.88 ng/ml), showing a good performance when distinguishing non-obese controls from NAFLD patients, with AUROC = 0.88 (95% CI, 0.77–0.98; p < 0.0001) and an overall accuracy of 0.81 (95% CI, 0.68–0.91), considering 25% disease prevalence (Figure 1A). By applying a leptin cutoff value >9.33 ng/ml for NAFLD inclusion, the assay sensitivity and specificity were 94 and 77%, respectively, and the NPV for ruling out NAFLD diagnosis was 98% (Figure 1A). No correlations were found between serum leptin and BMI or any biochemical parameter.
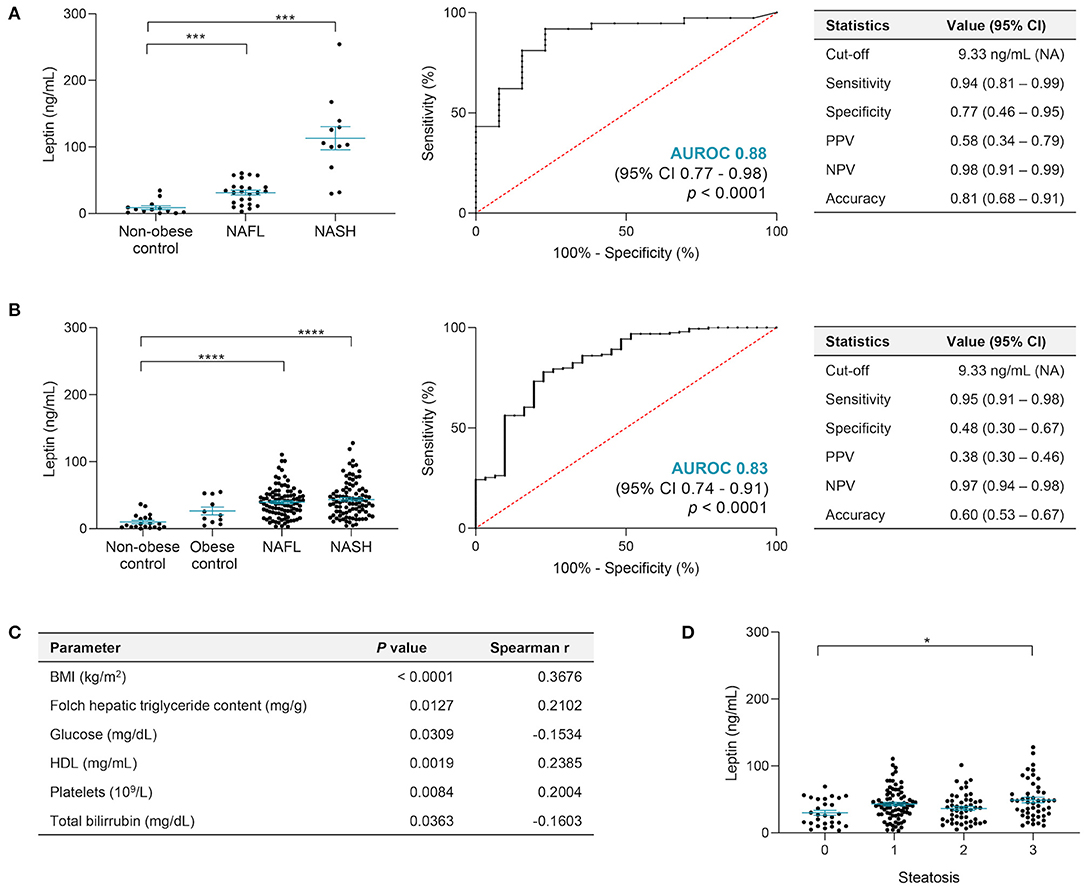
Figure 1. Leptin serum levels allow to distinguish NAFLD. (A) In the discovery cohort, leptin levels were significantly higher in NAFL and NASH patients compared with non-obese, healthy-liver controls, presenting an AUROC value of 0.88 when distinguishing controls (n = 13) from NAFLD patients (n = 36), with very high general accuracy and NPV. (B) In the validation cohort, the leptin levels did not show differences among healthy controls, non-obese or obese, and confirmed increased levels in NAFL and NASH. Leptin presented good performance assay results when distinguishing healthy controls (n = 31) from NAFLD (n = 194), with an AUROC value of 0.83 and overall accuracy of 0.60 when applied the cutoff value of >9.33 ng/ml leptin for NAFLD diagnosis established in the discovery cohort. (C) Main correlations found between leptin and other parameters in the validation cohort: BMI values (n = 199), hepatic TG evaluated by Folch method (n = 140; mg TG/g liver tissue), glucose (n = 198), HDL (n = 167), platelets (n = 172), and total bilirubin (n = 171). (D) Leptin levels increased with steatosis severity in the validation cohort. The x-axis represents the histological grade of steatosis, ranging from 0 to 3. There was a significant difference between grade 0 vs. 3 (n = 28, grade 0; n = 80, grade 1; n = 49, grade 2; n = 48, grade 3). Leptin levels depicted as mean ± SEM. BMI, body mass index; CI, confidence interval; HDL, high-density lipoprotein; NAFL, non-alcoholic fatty liver; NAFLD, nonalcoholic fatty liver disease; NASH, nonalcoholic steatohepatitis; NPV, negative predictive value; PPV, positive predictive value. *p < 0.05; ***p < 0.001; ****p < 0.0001.
In the validation cohort, leptin was higher again in NAFL (39.74 ± 2.25 ng/ml) and NASH (43.72 ± 2.70 ng/ml) vs. non-obese controls (6.21 ± 0.97 ng/ml; p < 0.0001) (Figure 1B). Although a positive correlation was found between serum leptin levels and BMI (p < 0.0001) (Figure 1C), no significant differences were evident between non-obese and obese controls (26.52 ± 5.82 ng/ml), suggesting that obesity might not be a confounding factor (Figure 1B). Serum leptin showed a good performance again when distinguishing controls (both non-obese and obese) from NAFLD patients (both NAFL and NASH), with AUROC = 0.83 (95%, CI 0.74–0.91; p < 0.0001). Considering 25% disease prevalence and by applying the cutoff value >9.33 ng/ml for NAFLD inclusion determined in the discovery cohort, an overall accuracy of 0.60 (95% CI, 0.53–0.67) was achieved, with sensitivity of 95% and specificity of 48% (Figure 1B). Serum leptin positively correlated with hepatic TG content (p < 0.05), HDL (p < 0.01), platelets (p < 0.01), and total bilirubin (p < 0.01) (Figure 1C). Curiously, diabetic NAFLD patients had significantly lower leptin compared with those who were non-diabetic (34.90 ± 2.87 vs. 45.39 ± 2.17 ng/ml; p < 0.01; Supplementary Figure 1), supported by the negative correlation between leptin and fasting glucose (p < 0.05; Figure 1C). Leptin was increased in patients with severe liver steatosis (stage 0 vs. 3, p < 0.05) (Figure 1D) and tended to increase with lobular inflammation and hepatic ballooning, while no significant differences were found with other co-morbidities, fibrosis stage, or NAFLD-associated polymorphisms (Supplementary Figure 1).
Given leptin's association with hepatic fat accumulation, its impact on the serum metabolic signatures of NAFLD patients was further evaluated. Levels of circulating lipids and other metabolites in NAFLD patients were compared between high/low levels of circulating leptin. Higher serum leptin was associated with a general increase in serum lipids, namely, FA (p < 0.05), monounsaturated FA (p < 0.05), and FA containing palmitoleic acid (16:1; p < 0.01) and linolenic acid (18:3; p < 0.001), while diglycerides (DG) and TG were decreased (for TG, p < 0.05) (Figure 2). Other lipid classes such as phosphatidylcholines (PC), lysophosphatiylcholines, phosphatidylinositols (p < 0.05), lysophosphatidylinositols, phosphatidylethanolamines (PE), lysophosphatidylethanolamines (LPE), or sphingomyelin (SM; p < 0.01) were increased in the serum of NAFLD patients with high circulating leptin levels (Figure 2).
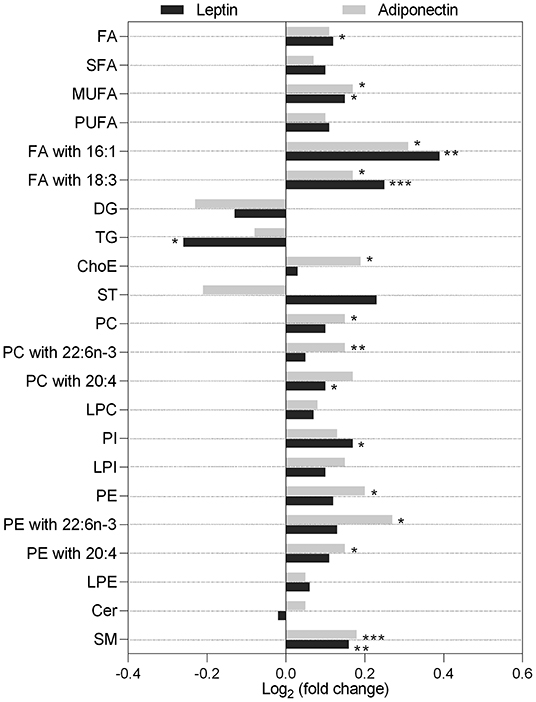
Figure 2. Serum lipidomic signatures associated with higher circulating levels of leptin (dark gray) and adiponectin (light gray). Data presented as log2 of the lipid level fold change between patients with hormone levels higher than the median vs. lower than the median. Leptin median level = 39.61 ng/ml; higher, n = 99; lower, n = 99. Adiponectin median level = 4.84 μg/ml; higher, n = 95; lower, n = 99. Cer, ceramide; ChoE, cholesteryl ester; DG, diglyceride; FA, fatty acid; LPC, lysophosphatidylcholines; LPE, lysophosphatidylethanolamines; LPI, lysophosphatidylinositols; MUFA, monounsaturated FA; PC, phosphatidylcholines; PE, phosphatidylethanolamines; PI, phosphatidylinositols; PUFA, polyunsaturated FA; SFA, saturated FA; SM, sphingomyelins; ST, steroids; TG, triglycerides; 16:0, palmitic acid; 18:3, linolenic acid; 20:4, arachidonic acid; 22:6n-3, docosahexaenoic acid (DHA). *p < 0.05; **p < 0.01; ***p < 0.001.
Overall, serum leptin predicts NAFLD, correlates with serum lipid changes, and is a potentially valuable tool for NAFLD diagnosis.
Adiponectin and Specific Lipid Species Distinguish NASH
In the discovery cohort, adiponectin was similar among men and women (6.55 ± 0.98 vs. 7.79 ± 1.04 μg/ml) and significantly lower in NASH vs. NAFL (non-obese controls: 8.51 ± 1.94 μg/ml; NAFL: 9.23 ± 0.85 μg/ml; NASH: 4.45 ± 0.58 μg/ml; p < 0.01) (Figure 3A). Serum adiponectin showed a good assay performance when distinguishing NAFL vs. NASH (AUROC = 0.87; 95% CI, 0.77–0.99; p < 0.0001). This allowed us to establish a cutoff value <7.32 μg/ml for diagnosing NASH, with an overall accuracy of 77%, sensitivity of 100%, and NPV (Figure 3A). Additionally, the adiponectin serum levels negatively correlated with the serum markers of liver injury ALT (Spearman r = −0.46, p < 0.01) and GGT (Spearman r = −0.42, p < 0.05).
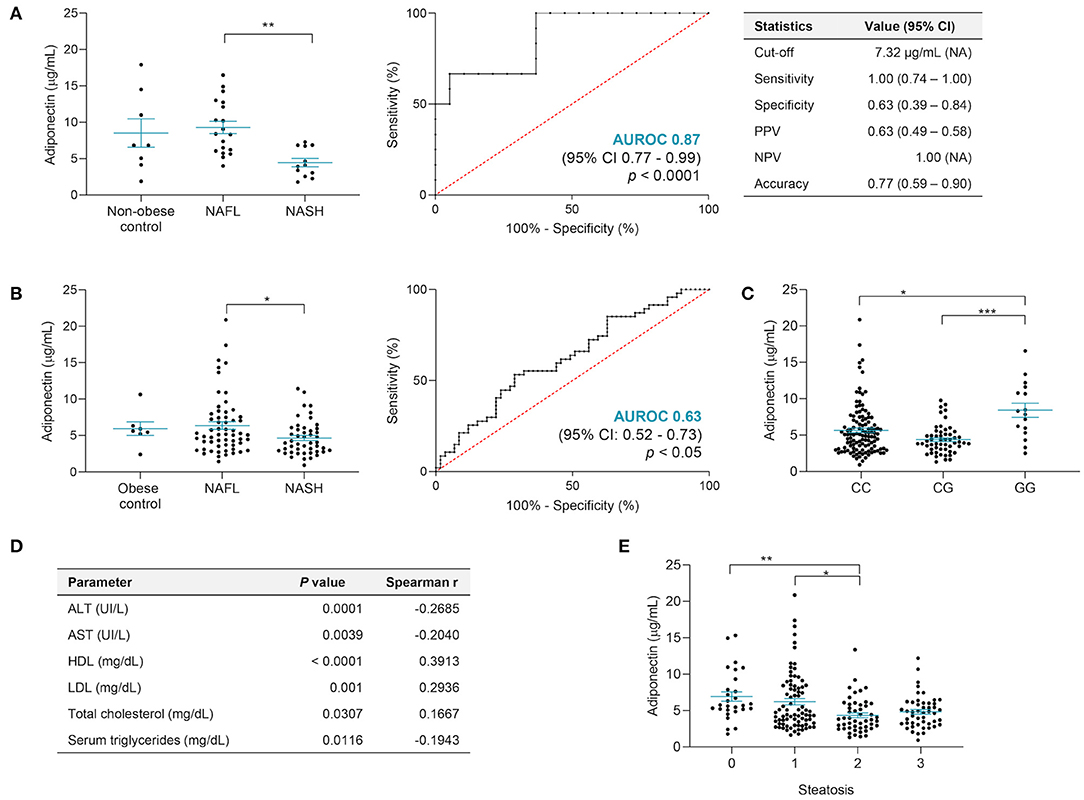
Figure 3. Adiponectin serum levels differentiate NAFL and NASH, but PNPLA3 genotype may be a confounding factor. (A) In the discovery cohort, the adiponectin serum levels were significantly lower in NASH when compared to NAFL, presenting an AUROC value of 0.87 and very high sensitivity and NPV (non-obese control, n = 8; NAFL, n = 19; NASH, n = 12). (B) In the validation cohort, adiponectin distinguishes NAFL from NASH only within PNPLA3 CC allele carriers, with an AUROC value superior to 0.6 obese controls, n = 7; NAFL, n = 59, NASH, n = 47). (C) In the validation cohort, NAFLD patients with PNPLA3 GG genotype also showed increased levels of adiponectin. The x-axis represents the three possible genotypes for rs738409 polymorphism: CC allele, n = 117; CG allele, n = 55; GG allele, n = 16). (D) Correlations between adiponectin serum levels and several parameters: AST and ALT serum levels (both n = 199), HDL and LDL serum levels (both n = 167), total cholesterol levels (n = 168), and triglyceride serum levels (n = 168). (E) The adiponectin levels decreased with higher grades of steatosis. The x-axis represents the histological grade of steatosis, ranging from 0 to 3. There was a significant difference between grade 2 vs. grade 1 and vs. grade 0 (n = 28, grade 0; n = 80, grade 1; n = 49, grade 2; n = 48, grade 3). Adiponectin levels depicted as mean ± SEM. ALT, alanine aminotransferase; AST, aspartate aminotransferase; CI, confidence interval; HDL, high-density lipoprotein; LDL, low-density lipoprotein; NAFL, non-alcoholic fatty liver; NASH, non-alcoholic steatohepatitis. *p < 0.05; **p < 0.01; ***p < 0.001.
In the validation cohort, adiponectin was lower in men (4.4 ± 0.32 vs. 6.07 ± 0.29 μg/ml, p < 0.0001) and, although not significant, were lower in NASH (4.94 ± 0.27 μg/ml) vs. both non-obese (6.21 ± 0.97 μg/ml) and obese (6.56 ± 0.93 μg/ml) controls or NAFL (6.22 ± 0.45 μg/ml). In this cohort, serum adiponectin was only able to distinguish NAFL vs. NASH when NAFLD patients homozygous for PNPLA3 wild-type allele c.444C were considered, even though with a suboptimal performance (AUROC = 0.63; p < 0.05) (Figure 3B). By applying the previously established cutoff value of adiponectin <7.32 μg/ml for NASH diagnosis, the PPV and NPV were 49 and 71%, respectively. This AUROC value was paralleled by AST/ALT ratio and only overcome by MRI or Folch method AUROCs, however with lower specificity values (Table 3). Curiously, NAFLD patients homozygous for PNPLA3 risk allele c.444G presented significantly higher adiponectin (GG vs. CC, p < 0.05; GG vs. CG, p < 0.0001; Figure 3C). In the validation cohort, no differences were found between adiponectin and fibrosis stage and ballooning and lobular inflammation, neither for the presence/absence of co-morbidities nor for the other NAFLD risk-associated polymorphisms (Supplementary Figure 2). Adiponectin still negatively correlated with AST (p < 0.01) and ALT (p < 0.001) and positively correlated with total cholesterol (p < 0.05), HDL (p < 0.001), and LDL (p < 0.01), regardless of PNPLA3 genotype (Figure 3D). Adiponectin decreased with severity of steatosis and negatively correlated with serum TG (p < 0.05; Figures 3D,E).
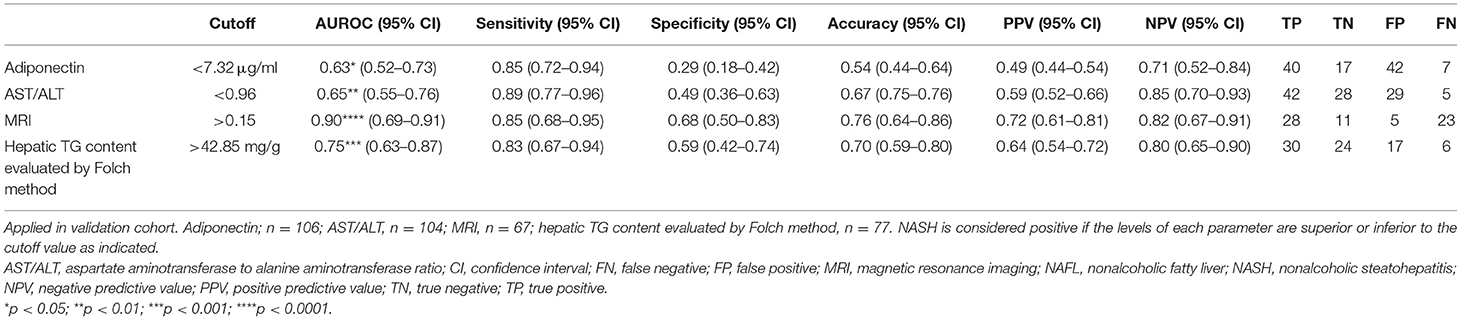
Table 3. Performance of serum adiponectin in the differential diagnosis of NAFL vs. NASH in patients homozygous for the wild-type allele CC in the PNPLA3 rs738409 polymorphism.
Although not significant, higher serum adiponectin positively correlated with serum lipid classes, except for DG, TG, and steroids (Figure 2). Both PE and PC containing arachidonic (20:4) or docosahexaenoic (DHA; 22:6n-3) acids were increased in patients with high circulating adiponectin (p < 0.05 and p < 0.01). Moreover, the serum levels of 147 metabolites were significantly different between NAFL and NASH, of which 35 were highly correlated with serum adiponectin (Supplementary Table 2). Among those, nine TG were already described as capable of distinguishing NAFL from NASH (16). Sixty-five out of the 147 metabolites presented AUROC >0.60 and were considered for binomial regression analysis. This allowed establishing a panel combining adiponectin and nine serum lipids (mainly TG, PC, and SM), reaching an AUROC value of ~0.80 and an overall accuracy of 74% in distinguishing NAFL from NASH in all patients, regardless of PNPLA3 genotype. When this panel was applied to homozygous carriers of the PNPLA3 c.444C allele, the AUROC value increased to 0.83 and the accuracy to 80% (Table 4).
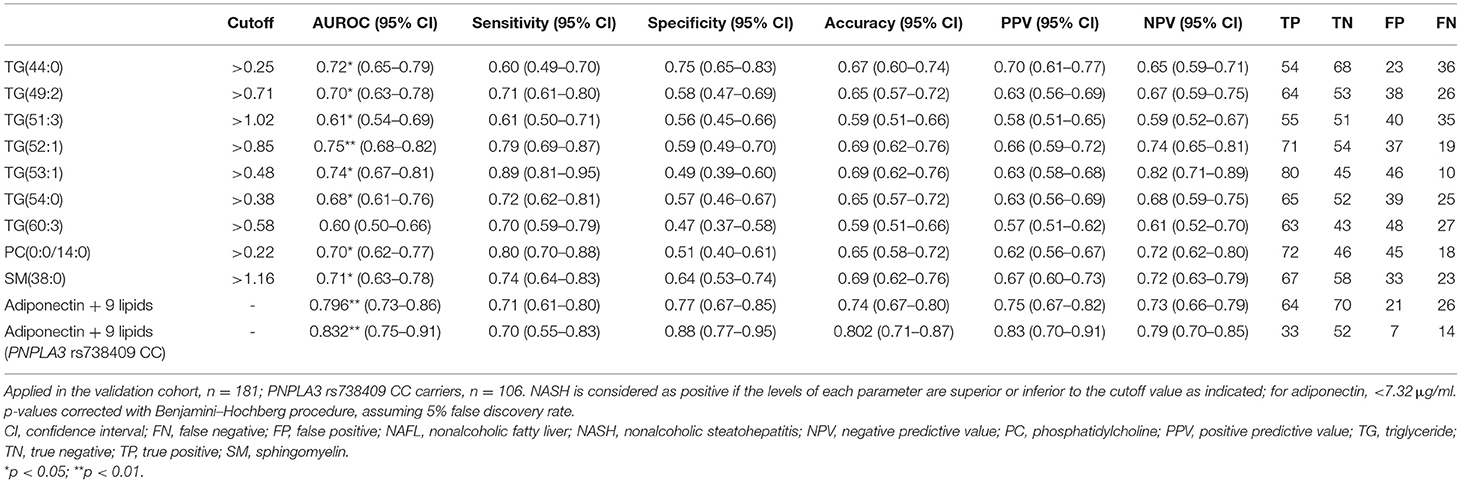
Table 4. Performance of serum lipids and combination panel with serum adiponectin in the differential diagnosis of NAFL vs. NASH.
Overall, serum adiponectin inversely correlated with liver injury markers and, when combined with nine specific lipids, distinguished NAFL from NASH patients with high accuracy.
IGF-1 Predicts Advanced Fibrosis in NAFLD
IGF-1 was higher in men in both cohorts (discovery cohort: 152.08 ± 20.78 vs. 81.04 ± 12.24 ng/ml, p < 0.01; validation cohort: 126.5 ± 6.78 vs. 103.4 ± 3.87 ng/ml, p < 0.01). In the discovery cohort, the IGF-1 levels decreased in NAFL (109.95 ± 16.55 ng/ml) and NASH (113.19 ± 17.39 ng/ml) when compared to non-obese controls (167.42 ± 17.55 ng/ml), although not significantly. In the validation cohort, there were no significant changes in IGF-1 between non-obese controls (115.75 ± 15.69 ng/ml), obese controls (105.83 ± 15.62 ng/ml), NAFL (122.30 ± 6.05 ng/ml), and NASH (103.50 ± 3.98 ng/ml), although an inverse correlation with BMI was observed (n = 199; Spearman r = −0.1647; 95% CI, 0.30-−0.02; p < 0.05) (Figures 4A,B). In agreement, in the validation cohort, there were also no significant differences in IGF-1 relating to liver steatosis, lobular inflammation, or hepatocyte ballooning severity (Supplementary Figure 3), yet IGF-1 was significantly lower in NAFLD patients with advanced fibrosis (F3–4; p < 0.05) (Figure 4C). By establishing a cutoff value of IGF-1 inferior to 98.83 ng/ml for the presence of advanced fibrosis, 70% sensitivity, 61% specificity, and 63% overall accuracy were obtained (Figure 4C and Table 5). Overall, IGF-1, as well as the pre-established biomarker fibrosis panels APRI, Fib-4, and NFS, displayed a suboptimal performance in F0–2 vs. F3–4 discrimination. However, by combining serum IGF-1, ferritin, and INR, the discriminatory power was significantly improved, resulting in AUROC value of 0.81 and overall accuracy of 93%, considering the ~10% prevalence of advanced fibrosis in this cohort (Table 5). Importantly, besides a robust NPV, this panel displayed 71% PPV value, contrasting with the low PPV values from APRI, Fib-4, and NFS. Circulating IGF-1 did not correlate with other parameters or co-morbidities (Supplementary Figure 3).
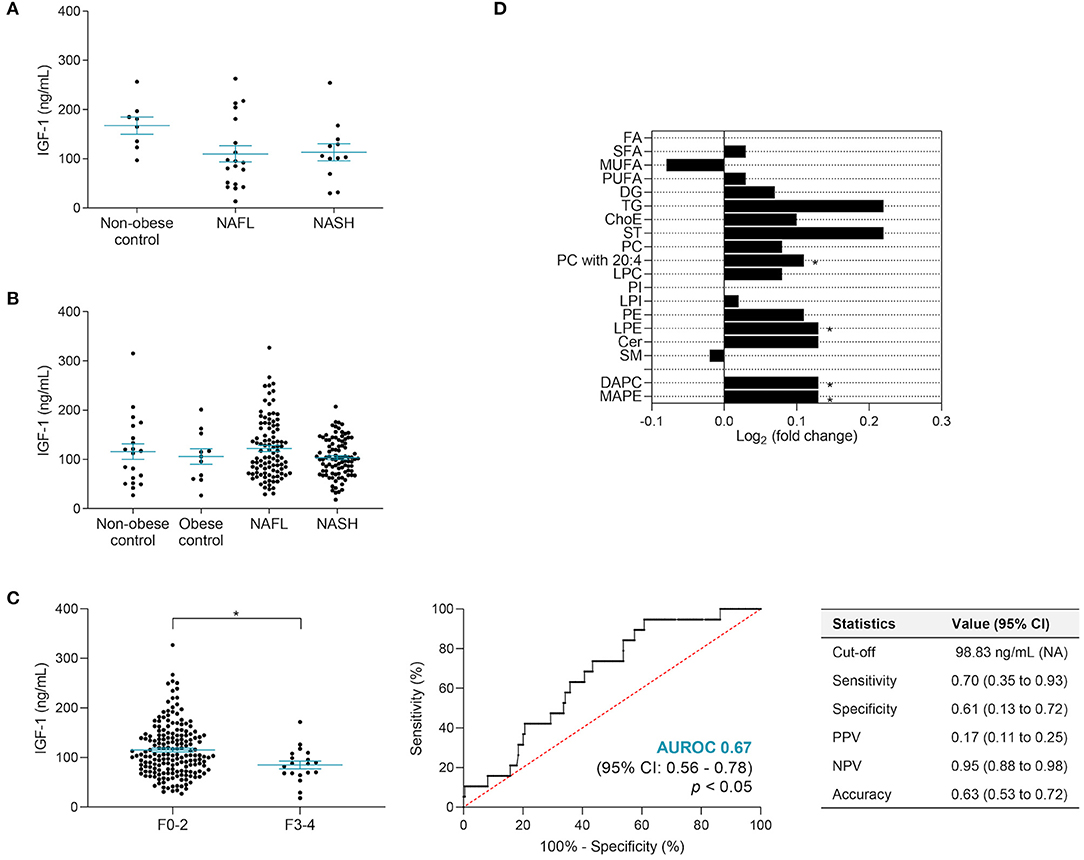
Figure 4. IGF-1 serum levels correlated with liver fibrosis score. (A) In the discovery cohort, the IGF-1 serum levels were slightly lower in NASH patients compared to NAFL and non-obese contros. (B) No significant differences in IGF-1 levels were found among controls and patients with NAFLD in the validation cohort. (C) In the validation cohort, NAFLD patients with advanced fibrosis presented significantly lower levels of IGF-1. The x-axis represents fibrosis score dichotomy: none to moderate fibrosis (F0-2; n = 184) and advanced fibrosis to cirrhosis (F3-4; n = 19). IGF-1 alone presents an AUROC value of 0.67 when distinguishing F0-2 vs. F3-4. (D) Serum lipidomic signature associated with higher IGF-1 circulating levels. Data presented as log2 of the fold change between higher vs. lower than the median IGF-1 level (103.65 ng/ml). Higher, n = 97; lower, n = 97. IGF-1 levels depicted as mean ± SEM. Cer, ceramide; ChoE, cholesteryl ester; CI, confidence interval; DAPC, diacylglycerophosphocholine; DG, diglyceride; FA, fatty acid; IGF-1, insulin-like growth factor 1; LPC, lysophosphatidylcholines; LPE, lysophosphatidylethanolamines; LPI, lysophosphatidylinositols; MAPE, monoacylglycerophosphoethanolamine; MUFA, monounsaturated FA; NAFL, non-alcoholic fatty liver; NASH, non-alcoholic steatohepatitis; NPV, negative predictive value; PPV, positive predictive value; PC, phosphatidylcholines; PE, phosphatidylethanolamines; PI, phosphatidylinositols; PUFA, polyunsaturated FA; SFA, saturated FA; SM, sphingomyelins; ST, steroids; TG, triglycerides; 20:4, arachidonic acid. *p < 0.05.
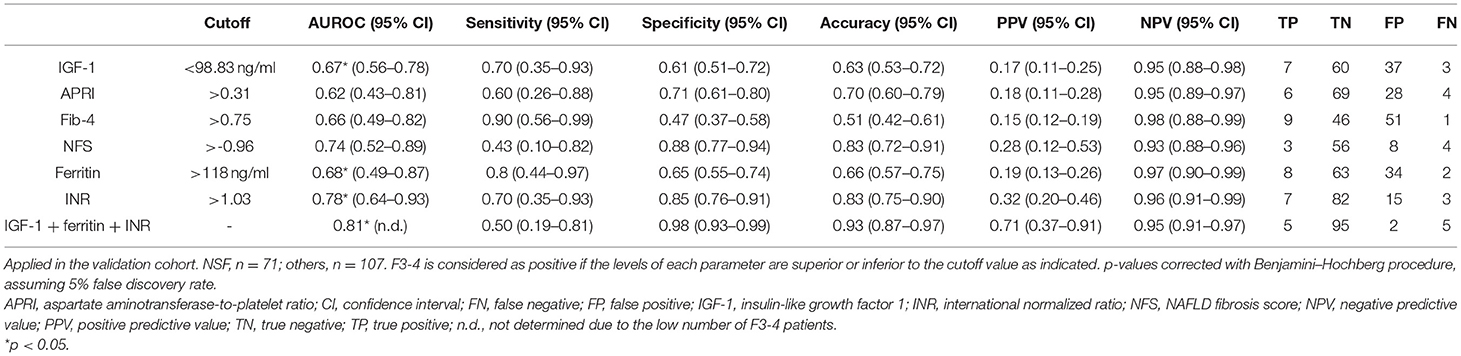
Table 5. Performance of IGF-1, alone or in a combination panel, and classical fibrosis scores in distinguishing F0-2 vs. F3-4 grades of fibrosis.
Serum metabolomic analysis showed that higher IGF-1 was associated with an overall increase in main lipid classes, significant for LPE (p < 0.05), PC containing arachidonic acid (20:4; p < 0.05), diacylglycerophosphocholine (p < 0.05), and monoacylglycerophosphoethanolamine (p < 0.05) (Figure 4D). Moreover, 26 specific serum metabolites were able to distinguish advanced fibrosis, with several bile acids increased in advanced fibrosis, and both cholic acid and PC (17:0/18:2) positively correlated with IGF-1 (Supplementary Table 3).
IGF-1 altogether could identify advanced fibrosis, particularly in combination with INR and ferritin, and correlates with serum lipid changes associated with fibrosis.
Discussion
The strong association between obesity and NAFLD, parallel with the continuous rise in the prevalence of obesity, prompts a more detailed study of the role of adipokines and other hormones as potential non-invasive biomarkers for NAFLD (1). Therefore, we measured serum leptin, adiponectin, and IGF-1 in two independent cohorts, comprising both biopsy-proven healthy-liver controls as well as obese NAFL and NASH patients. In the discovery cohort, the serum hormones were correlated with clinical and histological information, including NAS, fibrosis stage, and biochemical parameters. Results were then validated in a second cohort, which further allowed us to explore the role of obesity as a confounding factor by including a control group of obese healthy-liver individuals. Additionally, in this validation cohort, hormone serum levels were correlated with liver imaging, co-morbidities, and NAFLD risk-associated polymorphisms. For a subset of patients, serum metabolomic analysis was also performed. This strategy showed that particularly leptin and adiponectin can be potential diagnosis and stratification biomarkers in NAFLD. The role of these two adipokines in NAFLD pathophysiology, diagnosis, and even treatment has attracted significant attention despite the controversial results.
Leptin is a 16-kDa pro-inflammatory adipokine produced by adipocytes. Serum leptin levels reflect total body mass. Leptin may exert an anti-steatotic action in early NAFLD by promoting FA oxidation and decreased lipogenesis and a pro-inflammatory and pro-fibrotic action at later disease stages by increasing hepatic reactive oxygen species generation, pro-inflammatory cytokine release, and enhanced fibrinogenesis (28, 29). Previous reports have generally found increased serum leptin in NAFLD patients (12, 29, 30). Still the role of obesity as a bias remains poorly explored. Our results in the discovery cohort showed that leptin accurately identified NAFLD patients, where there was no correlation with BMI. Moreover, in the validation cohort, although leptin levels positively correlated with BMI, they were higher in NAFL and NASH compared with both non-obese and obese controls, suggesting that the association between NAFLD and leptin is more robust than the effect of obesity on leptin levels. In this cohort, serum leptin showed again a very good performance as a potential biomarker to distinguish NAFLD patients from healthy individuals. After applying the cutoff value of leptin at >9.33 ng/ml for diagnosing NAFLD in the validation cohort, despite having a lower general accuracy, it still presented sensitivity, specificity, and NPV values far superior than those previously reported (31, 32).
In turn, adiponectin, a 30-kDa protein mainly secreted by adipose tissue, is the most well-studied adipokine in the pathogenesis of NAFLD (30, 33). It is considered to have anti-inflammatory, anti-steatotic, and anti-fibrotic effects. In the liver, adiponectin prevents lipid accumulation by promoting FA oxidation via peroxisome proliferator-activated receptor alpha (33). Adiponectin also downregulates pro-inflammatory cytokines produced by Kupffer cells and hepatic stellate cells, thus inhibiting their transformation into myofibroblasts and consequently decreasing liver fibrosis (30, 34–36). Several reports have shown a reverse relation between adiponectin circulating levels and body fat mass and its decrease in obesity, type 2 diabetes, insulin resistance, and dyslipidemia (30, 34). A meta-analysis showed that adiponectin decreases in healthy controls compared to NAFL, and in the latter compared to NASH (37). However, there is significant heterogeneity among studies, and the importance of including biopsy-proven healthy controls is underlined; most differences in adiponectin between individuals with NAFLD and controls were observed when the controls were not subjected to liver biopsy (37). In the discovery cohort, adiponectin presented a very promising performance in distinguishing NAFL vs. NASH. However, when tested in the larger validation cohort, adiponectin only presented a fair discriminatory power in this stratification when homozygous carriers of the PNPLA3 c.444C allele were considered. Importantly, the discriminatory power of adiponectin regarding NAFL vs. NASH patients was improved when combined with nine specific lipids. Previously, others have shown that combining adiponectin with homeostatic model assessment for insulin resistance and type IV collagen 7S increased the assay sensitivity from 68 to 94% in early-stage NASH prediction (38), while combining adiponectin, resistin, and cleaved cytokeratin-18 predicted NASH with an AUROC of 0.90 (39). Similar approaches combining adiponectin serum levels with a panel of serum lipids, mainly PC species, have been shown to discriminate between healthy individuals, NAFL, and NASH with high accuracy (40). Curiously, previous observations showed that NAFLD patients homozygous for the c.444G allele presented decreased adiponectin (41); however, the opposite was observed here. Nonetheless, these results could explain how this subgroup of NAFLD patients has an improved response to treatment and lifestyle interventions, including bariatric surgery, when compared to CG and CC carriers (42). Additionally, we showed that lower levels of serum adiponectin associated with higher AST and ALT, thus suggesting a role of adiponectin in preventing liver damage. Overall, our observations suggest that adiponectin might be a valuable tool in NAFL vs. NASH stratification; however, its role as a biomarker in NAFLD can be challenged by risk-conferring genetic variants, such as the PNPLA3 c.444G allele, and can benefit from combination panels, such as the one presented comprising serum lipids.
In fact, NAFLD has been associated with increased lipids in both liver tissue and plasma. Here we observed that higher circulating leptin associated with increased serum lipid profile and increased hepatic steatosis as assessed by histology and imaging. Similarly, higher circulating adiponectin associated with an increased serum lipid profile. The fact that adiponectin is inversely correlated with liver fat contents, as evaluated by MRI, might suggest a protective action for adiponectin by promoting lipid removal from the liver into circulation. For instance, higher adiponectin associated with higher serum PE containing arachidonic acid (C20:4n-6), while lower liver levels of this acid have been observed in NAFLD due to active conversion into pro-inflammatory prostaglandins (13). Furthermore, increased serum PE containing DHA also followed higher adiponectin. DHA, whose lower levels have been associated with both NAFL and NASH, is believed to have anti-inflammatory and metabolic effects and to be able to lower liver TG (13, 14, 43, 44). This might also explain why higher adiponectin inversely correlates with TG as measured by blood biochemistry and serum metabolomics.
In turn, IGF-1, mainly produced in the liver in response to growth hormone stimulation, is known to regulate insulin sensitivity and decrease hepatic TG accumulation in the liver (45). While a few clinical studies have associated low serum IGF-1 with increased severity of steatosis (46, 47) or lobular inflammation (48), our results and those of others (49) failed to show any association. On the other hand, clinical studies are consensual when reporting low serum IGF-1 association with the severity of fibrosis (46, 48–50). In fact, in vitro and in vivo studies showed that IGF-1 can induce cellular senescence and hepatic stellate cell inactivation through a p53-dependent manner, thus improving experimental fibrosis (51). Accordingly, here we showed that patients with NAFLD and advanced fibrosis presented significantly lower serum IGF-1. More importantly, we found that the 63% accuracy of serum IGF-1 alone in distinguishing low/mild fibrosis from advanced fibrosis is further improved to 93% if IGF-1 is combined with ferritin and INR. These results are very similar to those determined for the Enhanced Liver Fibrosis (ELF) test, recommended by the NICE guidelines for the evaluation of fibrosis in NAFLD (9). A poor PPV value has still been reported for the generality of fibrosis tests, including ELF (52). The panel here proposed displayed high PPV value, being matched by the recent Hepamet fibrosis scoring system where a PPV of 76% was achieved (53). Recent reports suggest that IGF-1 biodisponibility might be decreased during disease progression toward NASH and liver fibrosis and advance IGF-1/intact IGFBP3 ratio as a fibrosis predictor (54). Moreover, IGF-1 might associate with a fibrosis-specific serum metabolite profile, where many bile acids were found increased in advanced fibrosis, namely, cholic acid, which also correlated with serum IGF-1. Increased levels of many bile acids, including cholic acid, have already been associated with liver fibrosis (55).
Inclusion of a patient group comprising lean-NAFLD would allow further inquiries on adipokines as NAFLD biomarkers, particularly for leptin. It is also recognized that the number of healthy non-obese controls is relatively small, mostly due to the difficulty in obtaining biopsies from healthy-liver individuals. Lastly, the performance of the proposed biomarker panels comprising serum adiponectin and lipids for NAFL vs. NASH stratification and serum IGF-1 with INR and ferritin for identification of advanced fibrosis should be prospectively tested in a different cohort.
Conclusion
In conclusion, we suggest that serum leptin can identify NAFLD without obesity as a confounding factor, whereas adiponectin combined with specific serum lipids might be advantageous for NAFL vs. NASH stratification. In turn, IGF-1, together with ferritin and INR, could embody a valuable biomarker panel to identify advanced fibrosis, which could be easily implemented in clinics and presents a better PPV than the regularly used algorithms. Serum metabolomics correlate with hormone levels and offer new opportunities for improved non-invasive biomarker panels.
Data Availability Statement
The data that support the current study are available within the article/Supplementary Materials, and from the corresponding author upon reasonable request.
Ethics Statement
The studies involving human participants were reviewed and approved by sample collection was performed after patient informed consent and Institutional Review Board approval, in accordance with the Declaration of Helsinki, by the ethics committees of Hospital de Santa Maria (Lisbon, Portugal) and Donostia University Hospital (San Sebastian, Spain). The patients/participants provided their written informed consent to participate in this study.
Author Contributions
VM contributed to the methodology, validation, formal analysis, investigation, writing—original draft, writing—review and editing, and visualization. MA contributed to the supervision, methodology, writing–review and editing, and visualization. NB, MP, RL, AC, EA, and JA conducted the investigation. FD-R contributed to the formal analysis, writing—review, and editing. AS-L contributed to data curation, writing—review, and editing. RJ-A and EE contributed to data curation. LB, DT, and BF contributed to writing—review and editing. MM contributed to data curation. CA, MK, and FL contributed to the investigation and writing—review and editing. HC-P contributed to the resources, data curation, and writing—review and editing. JB contributed to the resources, data curation, supervision, funding acquisition, writing—review, and editing. RC contributed to writing—review and editing. AN contributed to the conceptualization, resources, writing—review, and editing. CR contributed to the supervision, conceptualization, funding acquisition, resources, writing—review, and editing. All the authors read and approved the final manuscript.
Funding
CR was funded by FEDER through the COMPETE program and by national funds through Fundação para a Ciência e a Tecnologia (PTDC/MED-FAR/29097/2017—LISBOA-01-0145-FEDER-029097) and by European Horizon 2020 (H2020-MSCA-RISE-2016-734719). This work was also supported by Fundação para a Ciência e Tecnologia (PD/BD/135467/2017) and Portuguese Association for the Study of Liver/MSD 2017. JB was funded by Spanish Carlos III Health Institute (ISCIII) (PI15/01132, PI18/01075 and Miguel Servet Program CON14/00129 and CPII19/00008), co-financed by Fondo Europeo de Desarrollo Regional (FEDER), Instituto de Salud Carlos III (CIBERehd, Spain), La Caixa Scientific Foundation (HR17-00601), Fundación Científica de la Asociación Española Contra el Cáncer, and European Horizon 2020 (ESCALON project: H2020-SC1-BHC-2018-2020).
Conflict of Interest
NB, BF, and AN are employees at Mediagnost, GmbH. CA and EA are employees at One Way Liver, S.L. (OWL Metabolomics). JB is scientific advisor for OWL Metabolomics.
The remaining authors declare that the research was conducted in the absence of any commercial or financial relationships that could be construed as a potential conflict of interest.
Acknowledgments
We thank all the members of the laboratory for insightful discussions.
Supplementary Material
The Supplementary Material for this article can be found online at: https://www.frontiersin.org/articles/10.3389/fmed.2021.683250/full#supplementary-material
Abbreviations
ALT, alanine aminotransferase; AHT, arterial hypertension; APRI, AST/platelet ratio index; AST, aspartate aminotransferase; AUROC, area under the ROC curve; DG, diglycerides; DHA, docosahexaenoic; ELF, enhanced liver fibrosis; ELISA, enzyme-linked immunosorbent assay; FA, fatty acids; Fib-4, fibrosis-4 index; GGT, gamma-glutamyl transferase; HDL, high-density lipoprotein; IGF-1, insulin-like growth factor 1; INR, international normalized ratio; LDL, low-density lipoprotein; LPC, lysophosphatiylcholines; LPE, lysophosphatidylethanolamines; LPI, lysophosphatidylinositols; MRI, magnetic resonance imaging; NAFL, non-alcoholic fatty liver; NAFLD, non-alcoholic fatty liver disease; NAS, NAFLD activity score; NASH, non-alcoholic steatohepatitis; NFS, NAFLD fibrosis score; NPV, negative predictive value; PC, phosphatidylcholines; PE, phosphatidylethanolamines; PI, phosphatidylinositols; PPV, positive predictive value; ROC, uniparameter receiver operating characteristic; SM, sphingomyelin; TG, triglycerides.
References
1. Younossi Z, Anstee QM, Marietti M, Hardy T, Henry L, Eslam M, et al. Global burden of NAFLD and NASH: trends, predictions, risk factors and prevention. Nat Rev Gastroenterol Hepatol. (2018) 15:11–20. doi: 10.1038/nrgastro.2017.109
2. Younossi ZM. Non-alcoholic fatty liver disease–a global public health perspective. J Hepatol. (2019) 70:531–44. doi: 10.1016/j.jhep.2018.10.033
3. Chalasani N, Younossi Z, Lavine JE, Charlton M, Cusi K, Rinella M, et al. The diagnosis and management of nonalcoholic fatty liver disease: practice guidance from the American Association for the Study of Liver Diseases. Hepatology. (2018) 67:328–57. doi: 10.1002/hep.29367
4. European Association for the Study of the Liver (EASL). EASL–EASD–EASO clinical practice guidelines for the management of non-alcoholic fatty liver disease. Diabetologia. (2016) 59:1121–40. doi: 10.1007/s00125-016-3902-y
5. Eslam M, Newsome PN, Sarin SK, Anstee QM, Targher G, Romero-Gomez M, et al. A new definition for metabolic dysfunction-associated fatty liver disease: An international expert consensus statement. J Hepatol. (2020) 73:202–9. doi: 10.1016/j.jhep.2020.03.039
6. Cusi K, Chang Z, Harrison S, Lomonaco R, Bril F, Orsak B, et al. Limited value of plasma cytokeratin-18 as a biomarker for NASH and fibrosis in patients with non-alcoholic fatty liver disease. J Hepatol. (2014) 60:167–74. doi: 10.1016/j.jhep.2013.07.042
7. Sahebkar A, Sancho E, Abelló D, Camps J, Joven J. Novel circulating biomarkers for non-alcoholic fatty liver disease: a systematic review. J Cell Physiol. (2018) 233:849–55. doi: 10.1002/jcp.25779
8. Nallagangula KS, Nagaraj SK, Venkataswamy L, Chandrappa M. Liver fibrosis: a compilation on the biomarkers status and their significance during disease progression. Futur Sci OA. (2018) 4:FSO250. doi: 10.4155/fsoa-2017-0083
10. Yilmaz Y. Is nonalcoholic fatty liver disease the hepatic expression of the metabolic syndrome? World J Hepatol. (2012) 4:332–4. doi: 10.4254/wjh.v4.i12.332
11. Friedman SL, Neuschwander-Tetri BA, Rinella M, Sanyal AJ. Mechanisms of NAFLD development and therapeutic strategies. Nat Med. (2018) 24:908–22. doi: 10.1038/s41591-018-0104-9
12. Tsochatzis EA, Papatheodoridis GV, Archimandritis AJ. Adipokines in nonalcoholic steatohepatitis: from pathogenesis to implications in diagnosis and therapy. Mediators Inflamm. (2009) 2009:831670. doi: 10.1155/2009/831670
13. Puri P, Baillie RA, Wiest MM, Mirshahi F, Choudhury J, Cheung O, et al. A lipidomic analysis of nonalcoholic fatty liver disease. Hepatology. (2007) 46:1081–90. doi: 10.1002/hep.21763
14. Puri P, Wiest MM, Cheung O, Mirshahi F, Sargeant C, Min HK, et al. The plasma lipidomic signature of nonalcoholic steatohepatitis. Hepatology. (2009) 50:1827–38. doi: 10.1002/hep.23229
15. Caussy C, Ajmera VH, Puri P, Hsu CLS, Bassirian S, Mgdsyan M, et al. Serum metabolites detect the presence of advanced fibrosis in derivation and validation cohorts of patients with non-alcoholic fatty liver disease. Gut. (2019) 68:1884–92. doi: 10.1136/gutjnl-2018-317584
16. Mayo R, Crespo J, Martínez-Arranz I, Banales JM, Arias M, Mincholé I, et al. Metabolomic-based noninvasive serum test to diagnose nonalcoholic steatohepatitis: results from discovery and validation cohorts. Hepatol Commun. (2018) 2:807–20. doi: 10.1002/hep4.1188
17. Jiménez-Agüero R, Emparanza JI, Beguiristain A, Bujanda L, Alustiza JM, García E, et al. Novel equation to determine the hepatic triglyceride concentration in humans by MRI: diagnosis and monitoring of NAFLD in obese patients before and after bariatric surgery. BMC Med. (2014) 12:1–14. doi: 10.1186/s12916-014-0137-y
18. Juluri R, Vuppalanchi R, Olson J, Ünalp A, Natta ML Van, Cummings OW, et al. Generalizability of the NASH CRN histological scoring system for nonalcoholic fatty liver disease. J Clin Gastroenterol. (2011) 45:55–8. doi: 10.1097/MCG.0b013e3181dd1348
19. Loaeza-del-Castillo A, Paz-Pineda F, Oviedo-Cárdenas E, Sánchez-Ávila F, Vargas-Vorácková F. AST to platelet ratio index (APRI) for the noninvasive evaluation of liver fibrosis. Ann Hepatol. (2008) 7:350–7. doi: 10.1016/s1665-2681(19)31836-8
20. Vallet-Pichard A, Mallet V, Nalpas B, Verkarre V, Nalpas A, Dhalluin-Venier V, et al. FIB-4: an inexpensive and accurate marker of fibrosis in HCV infection. Comparison with liver biopsy and FibroTest. Hepatology. (2007) 46:32–6. doi: 10.1002/hep.21669
21. Angulo P, Hui JM, Marchesini G, Bugianesi E, George J, Farrell GC, et al. The NAFLD fibrosis score: A noninvasive system that identifies liver fibrosis in patients with NAFLD. Hepatology. (2007) 45:846–54. doi: 10.1002/hep.21496
22. Barr J, Caballería J, Martínez-Arranz I, Domínguez-Díez A, Alonso C, Muntané J, et al. Obesity dependent metabolic signatures associated with nonalcoholic fatty liver disease progression. J Proteome Res. (2012) 11:2521–32. doi: 10.1021/pr201223p
23. Martínez-Arranz I, Mayo R, Pérez-Cormenzana M, Mincholé I, Salazar L, Alonso C, et al. Enhancing metabolomics research through data mining. J Proteomics. (2015) 127:275–88. doi: 10.1016/j.jprot.2015.01.019
24. Xu R, Tao A, Zhang S, Deng Y, Chen G. Association between patatin-like phospholipase domain containing 3 gene (PNPLA3) polymorphisms and nonalcoholic fatty liver disease: a HuGE review and meta-analysis. Sci Rep. (2015) 5:9284. doi: 10.1038/srep09284
25. Sherry ST, Ward MH, Kholodov M, Baker J, Phan L, Smigielski EM, et al. DbSNP: the NCBI database of genetic variation. Nucleic Acids Res. (2001) 29:308–11. doi: 10.1093/nar/29.1.308
26. Hadizadeh F, Faghihimani E, Adibi P. Nonalcoholic fatty liver disease: diagnostic biomarkers. World J Gastrointest Pathophysiol. (2017) 8:11. doi: 10.4291/wjgp.v8.i2.11
27. Machado MV, Coutinho J, Carepa F, Costa A, Proença H, Cortez-Pinto H. How adiponectin, leptin, and ghrelin orchestrate together and correlate with the severity of nonalcoholic fatty liver disease. Eur J Gastroenterol Hepatol. (2012) 24:1166–72. doi: 10.1097/MEG.0b013e32835609b0
28. Polyzos SA, Kountouras J, Mantzoros CS. Leptin in nonalcoholic fatty liver disease: a narrative review. Metabolism. (2015) 64:60–78. doi: 10.1016/j.metabol.2014.10.012
29. Polyzos SA, Aronis KN, Kountouras J, Raptis DD, Vasiloglou MF, Mantzoros CS. Circulating leptin in non-alcoholic fatty liver disease: a systematic review and meta-analysis. Diabetologia. (2016) 59:30–43. doi: 10.1007/s00125-015-3769-3
30. Adolph TE, Grander C, Grabherr F, Tilg H. Adipokines and non-alcoholic fatty liver disease: multiple interactions. Int J Mol Sci. (2017) 18:1649. doi: 10.3390/ijms18081649
31. Pirvulescu I, Gheorghe L, Csiki I, Becheanu G, Dumbravã M, Fica S, et al. Noninvasive clinical model for the diagnosis of nonalcoholic steatohepatitis in overweight and morbidly obese patients undergoing to bariatric surgery. Chirurgia. (2012) 109:772–9.
32. Zelber-Sagi S, Ratziu V, Zvibel I, Goldiner I, Blendis L, Morali G, et al. The association between adipocytokines and biomarkers for nonalcoholic fatty liver disease-induced liver injury: a study in the general population. Eur J Gastroenterol Hepatol. (2012) 24:262–9. doi: 10.1097/MEG.0b013e32834f15dd
33. Achari AE, Jain SK. Adiponectin, a therapeutic target for obesity, diabetes, and endothelial dysfunction. Int J Mol Sci. (2017) 18:1321. doi: 10.3390/ijms18061321
34. Polyzos SA, Kountouras J, Zavos C, Tsiaousi E. Role of adiponectin in the pathogenesis and treatment of nonalcoholic fatty liver disease. Diabetes, Obes Metab. (2010) 12:365–83. doi: 10.1111/j.1463-1326.2009.01176.x
35. Finelli C, Tarantino G. What is the role of adiponectin in obesity related non-alcoholic fatty liver disease? World J Gastroenterol. (2013) 19:802–12. doi: 10.3748/wjg.v19.i6.802
36. Buechler C, Wanninger J, Neumeier M. Adiponectin, a key adipokine in obesity related liver diseases. World J Gastroenterol. (2011) 17:2801–11. doi: 10.3748/wjg.v17.i23.2801
37. Polyzos SA, Toulis KA, Goulis DG, Zavos C, Kountouras J. Serum total adiponectin in nonalcoholic fatty liver disease: a systematic review and meta-analysis. Metabolism. (2011) 60:313–26. doi: 10.1016/j.metabol.2010.09.003
38. Shimada M, Kawahara H, Ozaki K, Fukura M, Yano H, Tsuchishima M, et al. Usefulness of a combined evaluation of the serum adiponectin level, HOMA-IR, and serum type IV collagen 7S level to predict the early stage of nonalcoholic steatohepatitis. Am J Gastroenterol. (2007) 102:1931–8. doi: 10.1111/j.1572-0241.2007.01322.x
39. Younossi ZM, Jarrar M, Nugent C, Randhawa M, Afendy M, Stepanova M, et al. A novel diagnostic biomarker panel for obesity-related nonalcoholic steatohepatitis (NASH). Obes Surg. (2008) 18:1430–7. doi: 10.1007/s11695-008-9506-y
40. Perakakis N, Polyzos SA, Yazdani A, Sala-Vila A, Kountouras J, Anastasilakis AD, et al. Non-invasive diagnosis of non-alcoholic steatohepatitis and fibrosis with the use of omics and supervised learning: a proof of concept study. Metabolism. (2019) 101:154005. doi: 10.1016/j.metabol.2019.154005
41. Valenti L, Rametta R, Ruscica M, Dongiovanni P, Steffani L, Motta BM, et al. The i148m Pnpla3 polymorphism influences serum adiponectin in patients with fatty liver and healthy controls. BMC Gastroenterol. (2012) 12:111. doi: 10.1186/1471-230X-12-111
42. Krawczyk M, Jiménez-Agüero R, Alustiza JM, Emparanza JI, Perugorria MJ, Bujanda L, et al. PNPLA3 p.I148M variant is associated with greater reduction of liver fat content after bariatric surgery. Surg Obes Relat Dis. (2016) 12:1838–46. doi: 10.1016/j.soard.2016.06.004
43. Mato JM, Alonso C, Noureddin M, Lu SC. Biomarkers and subtypes of deranged lipid metabolism in non-alcoholic fatty liver disease. World J Gastroenterol. (2019) 25:3009–20. doi: 10.3748/wjg.v25.i24.3009
44. Kalhan SC, Guo L, Edmison J, Dasarathy S, McCullough AJ, Hanson RW, et al. Plasma metabolomic profile in nonalcoholic fatty liver disease. Metabolism. (2011) 60:404–13. doi: 10.1016/j.metabol.2010.03.006
45. Takahashi Y. The role of growth hormone and insulin-like growth factor-I in the liver. Int J Mol Sci. (2017) 18:E1447. doi: 10.3390/ijms18071447
46. Ichikawa T, Nakao K, Hamasaki K, Furukawa R, Tsuruta S, Ueda Y, et al. Role of growth hormone, insulin-like growth factor 1 and insulin-like growth factor-binding protein 3 in development of non-alcoholic fatty liver disease. Hepatol Int. (2007) 1:287–94. doi: 10.1007/s12072-007-9007-4
47. García-Galiano D, Sánchez-Garrido MA, Espejo I, Montero JL, Costán G, Marchal T, et al. IL-6 and IGF-1 are independent prognostic factors of liver steatosis and non-alcoholic steatohepatitis in morbidly obese patients. Obes Surg. (2007) 17:493–503. doi: 10.1007/s11695-007-9087-1
48. Sumida Y, Yonei Y, Tanaka S, Mori K, Kanemasa K, Imai S, et al. Lower levels of insulin-like growth factor-1 standard deviation score are associated with histological severity of non-alcoholic fatty liver disease. Hepatol Res. (2015) 45:771–81. doi: 10.1111/hepr.12408
49. Dichtel LE, Corey KE, Misdraji J, Bredella MA, Schorr M, Osganian SA, et al. The association between igf-1 levels and the histologic severity of nonalcoholic fatty liver disease. Clin Transl Gastroenterol. (2017) 8:e217. doi: 10.1038/ctg.2016.72
50. Miyauchi S, Miyake T, Miyazaki M, Eguchi T, Niiya T, Yamamoto S, et al. Insulin-like growth factor-1 is inversely associated with liver fibrotic markers in patients with type 2 diabetes mellitus. J Diabetes Investig. (2019) 10:1083–91. doi: 10.1111/jdi.13000
51. Nishizawa H, Iguchi G, Fukuoka H, Takahashi M, Suda K, Bando H, et al. IGF-I induces senescence of hepatic stellate cells and limits fibrosis in a p53-dependent manner. Sci Rep. (2016) 6:34605. doi: 10.1038/srep34605
52. Vali Y, Lee J, Boursier J, Spijker R, Löffler J, Verheij J, et al. Enhanced liver fibrosis test for the non-invasive diagnosis of fibrosis in patients with NAFLD: a systematic review and meta-analysis. J Hepatol. (2020) 73:252–62. doi: 10.1016/j.jhep.2020.03.036
53. Ampuero J, Pais R, Aller R, Gallego-Durán R, Crespo J, García-Monzón C, et al. Development and validation of hepamet fibrosis scoring system–a simple, noninvasive test to identify patients with nonalcoholic fatty liver disease with advanced fibrosis. Clin Gastroenterol Hepatol. (2020) 18:216–25.e5. doi: 10.1016/j.cgh.2019.05.051
54. Polyzos SA, Perakakis N, Boutari C, Kountouras J, Ghaly W, Anastasilakis AD, et al. Targeted analysis of three hormonal systems identifies molecules associated with the presence and severity of NAFLD. J Clin Endocrinol Metab. (2020) 105:e390–e400. doi: 10.1210/clinem/dgz172
Keywords: adiponectin, circulating biomarkers, fibrosis, IGF-1, leptin, lipid metabolism, NAFLD
Citation: Marques V, Afonso MB, Bierig N, Duarte-Ramos F, Santos-Laso Á, Jimenez-Agüero R, Eizaguirre E, Bujanda L, Pareja MJ, Luís R, Costa A, Machado MV, Alonso C, Arretxe E, Alustiza JM, Krawczyk M, Lammert F, Tiniakos DG, Flehmig B, Cortez-Pinto H, Banales JM, Castro RE, Normann A and Rodrigues CMP (2021) Adiponectin, Leptin, and IGF-1 Are Useful Diagnostic and Stratification Biomarkers of NAFLD. Front. Med. 8:683250. doi: 10.3389/fmed.2021.683250
Received: 20 March 2021; Accepted: 10 May 2021;
Published: 23 June 2021.
Edited by:
Javier Egea, Princess University Hospital, SpainReviewed by:
Ana Isabel Alvarez- Mercado, University of Granada, SpainBurcin Ekser, Indiana University School of Medicine, United States
Copyright © 2021 Marques, Afonso, Bierig, Duarte-Ramos, Santos-Laso, Jimenez-Agüero, Eizaguirre, Bujanda, Pareja, Luís, Costa, Machado, Alonso, Arretxe, Alustiza, Krawczyk, Lammert, Tiniakos, Flehmig, Cortez-Pinto, Banales, Castro, Normann and Rodrigues. This is an open-access article distributed under the terms of the Creative Commons Attribution License (CC BY). The use, distribution or reproduction in other forums is permitted, provided the original author(s) and the copyright owner(s) are credited and that the original publication in this journal is cited, in accordance with accepted academic practice. No use, distribution or reproduction is permitted which does not comply with these terms.
*Correspondence: Cecília M. P. Rodrigues, Y21wcm9kcmlndWVzQGZmLnVsaXNib2EucHQ=