 Qi-Shun Geng1
 Jie Zhao
- 1Department of Pharmacy, The First Affiliated Hospital of Zhengzhou University, Zhengzhou, China
- 2Huanghe Science and Technology University, Zhengzhou, China
- 3Internet Medical and System Applications of National Engineering Laboratory, The First Affiliated Hospital of Zhengzhou University, Zhengzhou, China
Background: Thyroid cancer (THCA) is a malignancy affecting the endocrine system, which currently has no effective treatment due to a limited number of suitable drugs and prognostic markers.
Methods: Three Gene Expression Omnibus (GEO) datasets were selected to identify differentially expressed genes (DEGs) between THCA and normal thyroid samples using GEO2R tools of National Center for Biotechnology Information. We identified hub gene FN1 using functional enrichment and protein-protein interaction network analyses. Subsequently, we evaluated the importance of gene expression on clinical prognosis using The Cancer Genome Atlas (TCGA) database and GEO datasets. MEXPRESS was used to investigate the correlation between gene expression and DNA methylation; the correlations between FN1 and cancer immune infiltrates were investigated using CIBERSORT. In addition, we assessed the effect of silencing FN1 expression, using an in vitro cellular model of THCA. Immunohistochemical(IHC) was used to elevate the correlation between CD276 and FN1.
Results: FN1 expression was highly correlated with progression-free survival and moderately to strongly correlated with the infiltration levels of M2 macrophages and resting memory CD4+ T cells, as well as with CD276 expression. We suggest promoter hypermethylation as the mechanism underlying the observed changes in FN1 expression, as 20 CpG sites in 507 THCA cases in TCGA database showed a negative correlation with FN1 expression. In addition, silencing FN1 expression suppressed clonogenicity, motility, invasiveness, and the expression of CD276 in vitro. The correlation between FN1 and CD276 was further confirmed by immunohistochemical.
Conclusion: Our findings show that FN1 expression levels correlate with prognosis and immune infiltration levels in THCA, suggesting that FN1 expression be used as an immunity-related biomarker and therapeutic target in THCA.
Introduction
Thyroid carcinoma (THCA) is the most common type of endocrine cancer (1). Its prevalence has sharply increased in recent decades. In the US, the annual incidence of thyroid cancer increased from 4.9/100,000 in 1975 to 14.3/100,000 in 2009 (2). The observed increase in the incidence is partly due to the increased detection rate. In Beijing, China, the detection rate significantly increased from 16.8% in 1994 to 69.8% in 2015 (P < 0.01) (3). THCA can be subclassified into several histological subtypes, which include papillary thyroid carcinoma (PTC), follicular thyroid carcinoma (FTC), undifferentiated or anaplastic thyroid carcinoma (ATC), and medullary thyroid carcinoma (MTC). THCA occurs mostly in young adults (the average age of diagnosis is 40 years), and more frequently in females (4). The most common treatment of thyroid cancer consists of surgical resection combined with radiotherapy or chemotherapy. However, for PTC, ATC, and MTC, a satisfactory resection is not always feasible, and even after radiotherapy, the risk of cancer recurrence is still high (5, 6). In addition, recently personalized therapy approaches directed against specific targets have become available, only a few suitable targets have been identified thus far. Although the survival rate of patients with thyroid cancer is very high, with the rapid increase in THCA incidence, this disease poses a serious threat to human health (7).
Immune-related processes play an important role in the development of thyroid cancer, and hence, immunotherapy strategies are considered the most promising candidates for the treatment of thyroid cancer in the future (8). Many studies have shown that tumor-infiltrating lymphocytes, such as tumor-associated macrophages, tumor-associated dendritic cells, and tumor-infiltrating neutrophils, affect the prognosis of THCA patients and the efficacy of chemotherapy and immunotherapy (9). Therefore, there is an urgent need to understand which immune cells play a role in the development of THCA, as well as to explore novel immune-related biomarkers that could aid in the diagnosis and prognosis of this disease.
Fibronectin 1 (FN1) encodes a glycoprotein present in a soluble dimeric form in the plasma and a dimeric or multimeric form at the cell surface and in the extracellular matrix. FN1 is involved in cell adhesion and migration processes during embryogenesis, wound healing, blood coagulation, host defense, and metastasis, as well as in cell proliferation (10). Multiple studies have established its involvement in the development of cancer, including oral squamous cell carcinoma (11), renal cancer (12), and thyroid cancer (13). Previous studies have indicated that FN1 is involved in NKp46 receptor-mediated interferon-γ (IFN-γ) production by natural killer cells, with respect to the control of tumor architecture and metastasis (14). BAG5 also promotes invasion of papillary thyroid cancer cells via upregulation of FN1 at the translational level (15). In addition, FN1 plays an important role in glioblastomagrowth and invasion, and is correlated with the low elasticity of thyroid nodules and Malignancy of THCA (16, 17). These findings suggest that FN1 has multifaceted functional roles in tumor progression.
In this study, we comprehensively analyzed the correlation between FN1 expression with the prognosis of patients with THCA, as well as with the presence of tumor-infiltrating immune cells. Our findings highlight the important role of FN1 expression in THCA, and suggest a potential correlation between FN1 expression and tumor-immune interactions. Furthermore, the results were validated by immunohistochemistry and cell biology experiments, which indicate that FN1 is a potential prognostic and immunity-related biomarker in THCA and could potentially be used as a drug target in THCA therapy.
Materials and Methods
Cell Lines and Reagents
The cell lines B-CPAP and KTC-1, belonging to the thyroid cancer cell lines, were obtained from the Institute of Biochemistry and Cell Biology of the Chinese Academy of Sciences, Shanghai, China. All cells were cultured in Roswell Park Memorial Institute (RPMI) 1640 medium (Gibco, Grand Island, NY, USA) supplemented with 10% fetal bovine serum (10%FBS), 100 U/mL penicillin, and 100 mg/mL streptomycin (Invitrogen, Carlsbad, CA, USA). Cells were incubated in a 5% CO2/95% O2 in a humidified atmosphere at 37°C.
Data Sources and Identification of Differentially Expressed Genes (DEGs)
TCGA is a landmark cancer genomics program that characterized over 20,000 primary cancer samples, spanning 33 cancer types and matched to the respective normal samples. Samples are molecularly characterized, and multi-omics data are provided, including gene transcripts, miRNA expression data, and DNA methylation state data. Additionally, it contains abundant and standardized clinical data. All datasets used were downloaded from the Cancer Genomics Browser website of the University of California, Santa Cruz (18). The GEO database (http://www.ncbi.nlm.nih.gov/geo/) stores original submitter-supplied records (series, samples, and platforms), as well as the curated datasets. Using the selection criteria of a number of samples >20 and < 1,000, we selected three gene expression profiles [GSE33630 (19), GSE58545 (20), and GSE60542 (21)]. Among them, GSE33630 (105 samples) and GSE60542 (45 samples) are based on the GPL570 platform, and GSE58545 (92 samples) was obtained with the GPL96 platform. According to the commonly used threshold parameters (adjusted P < 0.05, |log2FoldChange| ≥ 2.0) (22), we determined the DEGs between THCA and normal thyroid samples using the GEO2R online analysis tool, accessible via the National Center for Biotechnology Information website. Then, the interactive tool Venny2.1.0 (23) was used to create a Venn diagram of the DEGs to determine the common DEGs between the three analyzed gene expression profiles.
Functional Enrichment Analysis and Identification of Hub Genes
Gene Ontology (GO) is an initiative that provides a standardized classification of genes by accounting for their functions, biological pathways they participate in, and the cell localization of the corresponding proteins. Genes are categorized into three domains: biological process (BP), molecular function (MF), and cellular component (CC) (24). We annotated the identified DEGs according to the GO classification system using the Database for Annotation, Visualization, and Integrated Discovery (DAVID) tool (https://david.ncifcrf.gov/) (25). The threshold criteria to determine the significantly enriched GO terms were P < 0.05 and gene counts ≥ 5. To identify the hub genes, a protein-protein interaction (PPI) network was constructed for the DEGs that had been annotated in the category BP (P < 0.05) using Search Tool for the Retrieval of Interacting Genes (STRING) (http://string-db.org/) (26). PPI pairs with a combined confidence score ≥ 0.4, were visualized using Cytoscape (version 3.7.2) (27). The Cytoscape plugin Molecular Complex Detection (MCODE) (version 1.4.2), an app to cluster any given network, was used to identify the most important module in the PPI network, and the plugin CytoHubba was used to identify the hub genes in the PPI networks by calculating the degree of connectivity between DEGs. The selection criteria were as follows: MCODE score > 5 points, degree cut-off = 2, node score cut-off = 0.2, maximum depth = 100, and k-score = 2.
Correlation Between Gene Expression and Survival
ONCOMINE is an online cancer microarray database (www.oncomine.org) (28). Gene expression profiles from the website were used to analyze the transcription levels of FN1 in THCA. Furthermore, the correlation between FN1 expression and progression-free survival (PFS) and clinical parameters was analyzed using the TCGA database. In addition, the UALCAN (29), a web resource to analyze cancer OMICS data, was used to investigate the correlation between FN1 expression and cancer stage, and between FN1 expression and promoter methylation level.
Methylation and Immunity Correlation Analysis
MEXPRESS (https://mexpress.be/) is a data visualization tool designed for easy visualization of TCGA expression, DNA methylation, and clinical data, as well as the correlations between them (30, 31). We used this tool to investigate the correlation between hub gene expression and the degree of methylation of the gene promoters. CIBERSORT is an analytical tool used to estimate the abundance of cell types in a mixed cell population using gene expression data (32). We used this tool to assess the degree of immune infiltration. The co-expression analysis of FN1 and B7 family members (including CD274, CD80, CD86, CD276, CD273, CD275, B7-H4, B7-H5, CD28, B7-H7, CD152, CD279, CD278, TLT-2, and NKp30) was assessed in the normal thyroid samples and in the THCA samples from TCGA database. The correlation between FN1, CD273, CD274, CD275, B7-H4, and CD276 was further analyzed in the THCA cohort. GEPIA (http://gepia.cancer-pku.cn/detail.php) (33) and TIMER (39) were used to plot the expression scatterplots between any pair of genes in a given cancer type, while including the Spearman correlation and the statistical significance.
Silencing of FN1 by Small Interfering RNA (siRNA)
The siRNA targeting human FN1 (siFN1) and a non-specific scrambled siRNA sequence (siNC) were purchased from Shanghai Gene Pharma and transiently transfected into B-CPAP and KTC-1 cells using Lipofectamine 3000 (Invitrogen, Carlsbad, CA, USA) according to the manufacturer's instructions. The target sequence in FN1 was: 5′-CAGUCAAAGCAAGCCCGGUUGUUAU-3′. Subsequently, assays were performed 48 h after the transfection. Cell viability was assessed 24, 48, or 72 h after transfection using the commercial kit Cell Counting Kit-8 (CCK-8, Beyotime Biotechnology, China) according to manufacturer's instructions.
Quantitative Reverse Transcription-Polymerase Chain Reaction (RT-qPCR)
RNA was isolated using TRIzol reagent (Invitrogen, Carlsbad, CA, USA), followed by transfer into RNA-free EP tubes and storage at −80°C. Complementary DNA (cDNA) was synthesized from total RNA using the PrimeScript RT reagent Kit (Takara, Dalian, China), and PCR was performed using the SYBR Green RT-PCR Kit (AG11701, Accurate Biotechnology, Hunan, Co., Ltd). PCR was performed on the StepOne Plus Real-Time PCR System (Applied Biosystems, Foster City, CA, USA). Data were analyzed using the 2−ΔΔCT method. The primer sequences used in the experiment are as follows: FN1, 5′-CGGTGGCTGTCAGTCAAAG-3′ (forward), 5′-AAACCTCGGCTTCCTCCATAA-3′ (reverse); CD276, 5′-CTCCCTACAGCTCCTACCCTC-3′ (forward), 5′-TGGTCTGTGTATCGCATCCTT-3′ (reverse).
Immunohistochemistry (IHC) Staining
Samples from cancer patients were obtained from thyroid cancer arrays (DC-Thy11004 Avira Biotechnology Co., Ltd., China), which included 24 cases of thyroid cancer and corresponding paracancerous tissues. Tumor tissues chip were deparaffinized and rehydrated, followed by antigen retrieval. The sections were then blocked with 5% BSA in PBS and incubated with FN1 antibody (1 mg/mL, 1:200; Affinity) and CD276 antibody (1 mg/mL, 1:200; Affinity) at 4°C overnight. After three times washing, tissue sections were incubated with the secondary antibody conjugated with streptavidin–horseradish peroxidases for 1 h at room temperature. The slides were stained with 3, 3-diaminobenzidine tetrahydrochloride (DAB), and the nuclei were counterstained with hematoxylin. Marker density was scored independently by two investigators as follows: 0, negative; 1, weak; 2, moderate; or 3, strong.
Statistical Analyses
All statistical analyses were performed using GraphPad Prism 5.0 (San Diego, CA, USA) and R version 3.6.1. Data from independent experiments performed in triplicate are presented as mean ± standard deviation (SD). Multivariate survival analysis was carried out for all parameters that were significant in the univariate analysis using the Cox regression model. To analyze the significance of differences between groups, unpaired two-tailed Student's t-test and one-way analysis of variance (ANOVA) were performed, and multiple comparisons were accounted for using Bonferroni's correction. Differences were considered significant at P < 0.05.
Results
Identification of the Common DEGs Between the Datasets Used
We obtained three gene expression profiles (GSE33630, GSE58545, and GSE60542) from the GEO database. GSE33630 includes 45 normal thyroid samples and 60 THCA samples; GSE58545 includes 18 normal thyroid samples and 27 THCA samples; GSE60542 includes 30 normal thyroid samples and 33 THCA samples. According to the conventional criteria (adjusted P < 0.05 and |log2FoldChange| ≥ 2.0), 263 genes were identified as DEGs in GSE33630, of which 133 were downregulated and 130 were upregulated; moreover, GSE58545 included 270 DEGs, including 144 downregulated genes and 126 upregulated genes, and GSE60542 contained 228 DEGs, including 107 downregulated genes and 121 upregulated genes (Figures 1A–C). A Venn diagram showed that 98 genes were differentially expressed in the three datasets, of which 46 were downregulated, and 52 were upregulated (Figures 1D,E).
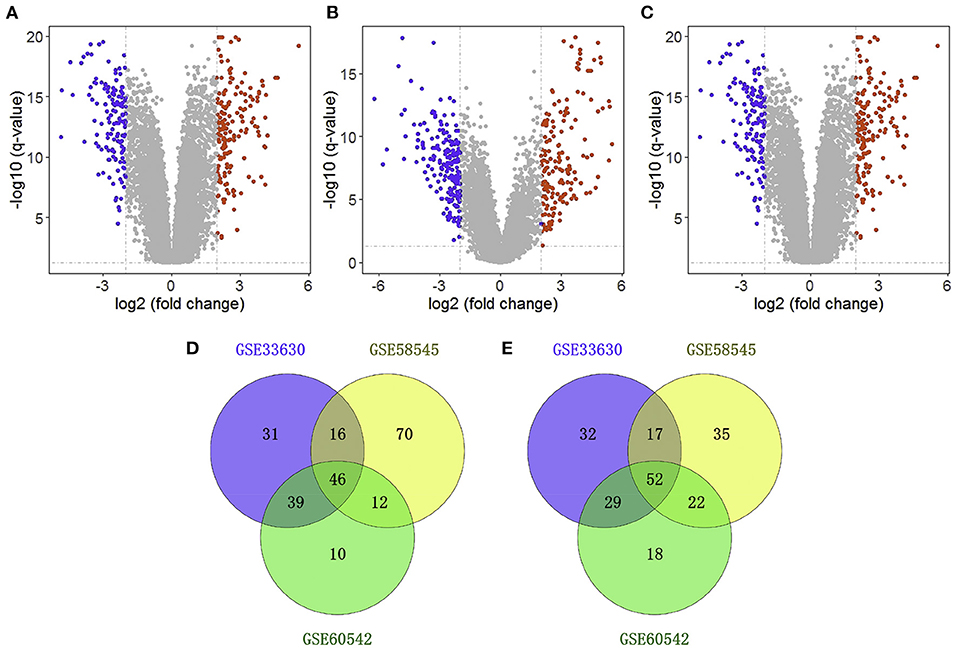
Figure 1. Identification of differentially expressed genes (DEGs). Volcano plot showing the differentially expressed genes of GSE33630 (A), GSE58545 (B), and GSE60542 (C). Veen diagram of downregulated (D) and upregulated (E) common DEGs to three gene expression profiles.
Functional Enrichment Analysis of the Common DEGs
In this study, we performed GO functional analysis of the common DEGs using the tool DAVID. Then, we filtered the results to improve the confidence according to the standard criteria (P < 0.05 and gene counts ≥ 5) (Supplementary Table 1). GO analysis showed that the common DEGs were mainly enriched in the CC category, including the plasma membrane, extracellular exosome, extracellular region, and extracellular space. DEGs annotated as BP were enriched in cell adhesion, signal transduction, extracellular matrix organization, positive regulation of gene expression, positive regulation of cell proliferation, blood coagulation, wound healing, platelet degranulation, and nervous system development, all of which are processes associated with the occurrence and development of tumors.
Identification and Analysis of the Hub Genes
We selected 46 DEGs involved in specific BP (P < 0.05) to build the PPI network (Figure 2A; Table 1). The most important module was obtained using the plugin MCODE in Cytoscape (Figure 2B). The top eight genes, including FN1, TIMP1, SERPINA1, COMP, PROS1, MMRN1, KIT, and TNFRSF11B, were identified as potential hub genes according to the degree score generated by the plugin CytoHubba (Figure 2C; Table 2). This was consistent with their enrichment in the top module determined using MCODE. Among them, FN1 had the highest degree of connectivity in the PPI network. Furthermore, logrank regression and multivariate Cox regression analysis were used to calculate the correlation between gene expression and PFS (Figures 2D,E), indicating FN1 appeared to be the most attractive drug target and prognostic marker. GSEA was used to perform kegg analysis for FN1. The results suggested that most of the involved significant pathways including chemokine signaling pathway, cytokine receptor interaction, Leishmania infection, natural killer cell-mediated cytotoxicity, and T cell receptor signaling pathway, as it has been established that FN1 plays a crucial role in tumor architecture and controls metastasis (Figure 2F) (13).
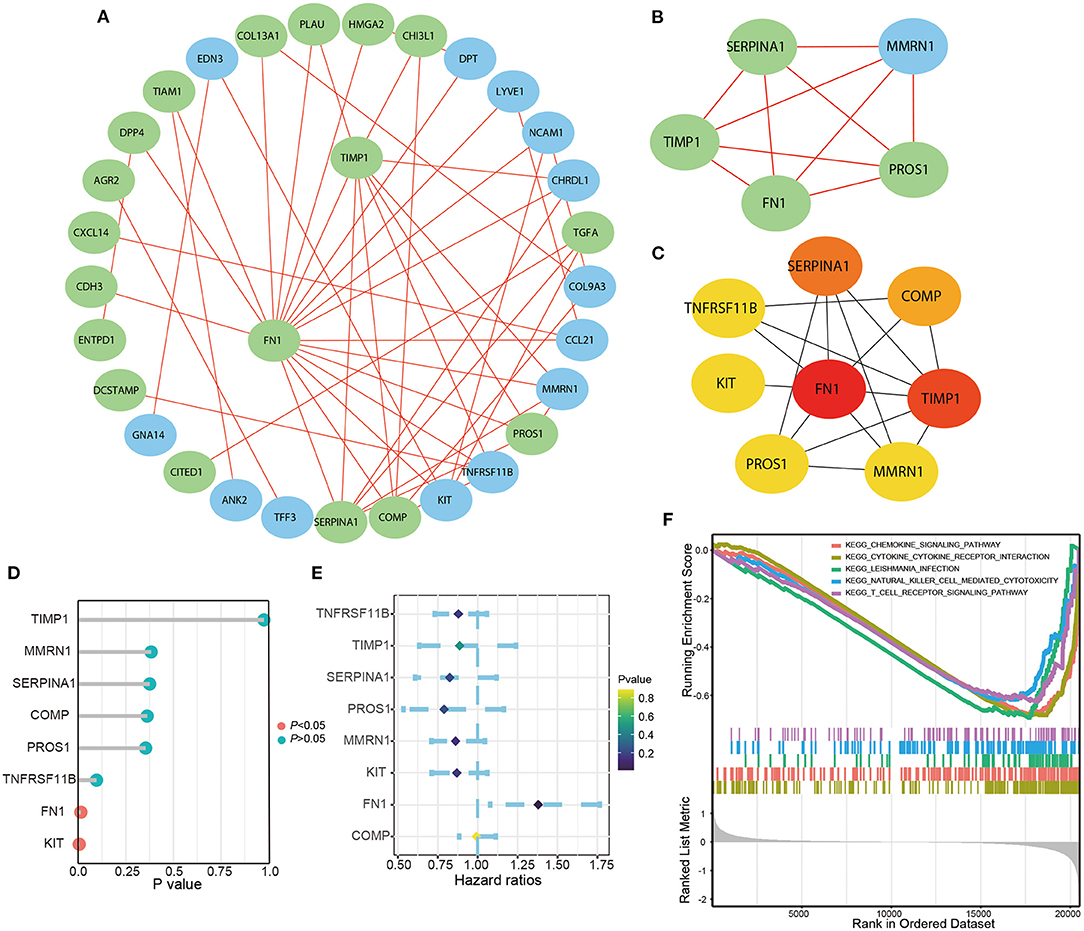
Figure 2. The Screening and identification of key genes. (A) PPI network constructed with the DEGs in biological progress. (B) The most significant module obtained from PPI network. (C) The top eight hub genes. The logrank analysis of hub genes (D) and the multivariate cox logistic regression analysis (E) of hub genes based on the TCGA database. (F) The significant kegg pathways of FN1 in THCA obtained by GSEA.
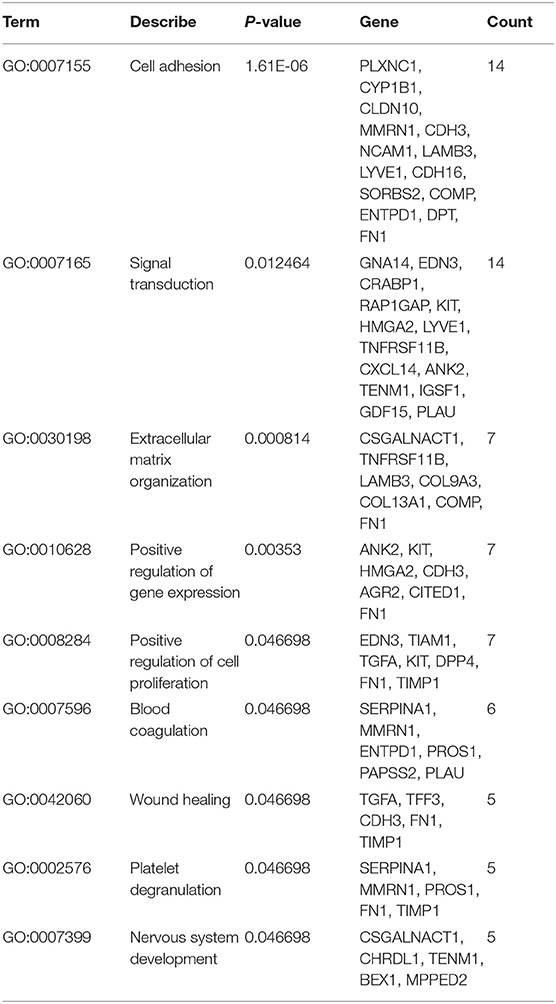
Table 1. The information related to biological processes of statistical significance.

Table 2. Hub genes with higher degree of connectivity.
Expression Levels of FN1 in THCA and Evaluation of Its Value as a Prognostic Marker
We analyzed the expression levels of FN1 in THCA using the Oncomine database. We found that FN1 expression was upregulated in almost all different subtypes of THCA, including PTC and ATC (Figure 3A). We validated these results using the TCGA database, in which FN1 was also significantly high expressed in THCA samples than in normal thyroid samples (P < 0.05) (Figure 3B);. and FN1 expression level was also correlated with PFS of THCA (P < 0.05) (Figure 3C). The area under the curve (AUC) of FN1 from the TCGA dataset was 0.8971 (Figure 3D), highlighting the value of FN1 as a diagnostic marker in THCA. We compared the clinical characteristics (including age, sex, location, clinical stage, progression state, lymph node metastasis, and distant metastasis) between the FN1-high expression and FN1-low expression groups, and observed statistically significant differences in lymph node metastasis, distant metastasis, and progression state, although no significant differences were identified for other clinical features (Table 3). Furthermore, univariate and multivariate Cox regression models revealed that clinical stage and FN1 expression were independent prognostic factors for PFS in patients with THCA (Table 4). In addition, analysis of the UALCAN database showed that FN1 expression levels were closely correlated to cancer stage (Figure 3E) and that the degree of methylation of the FN1 promoter was lower in THCA than that in normal tissues (Figure 3F), indicating that FN1 may be involved in the development of THCA.
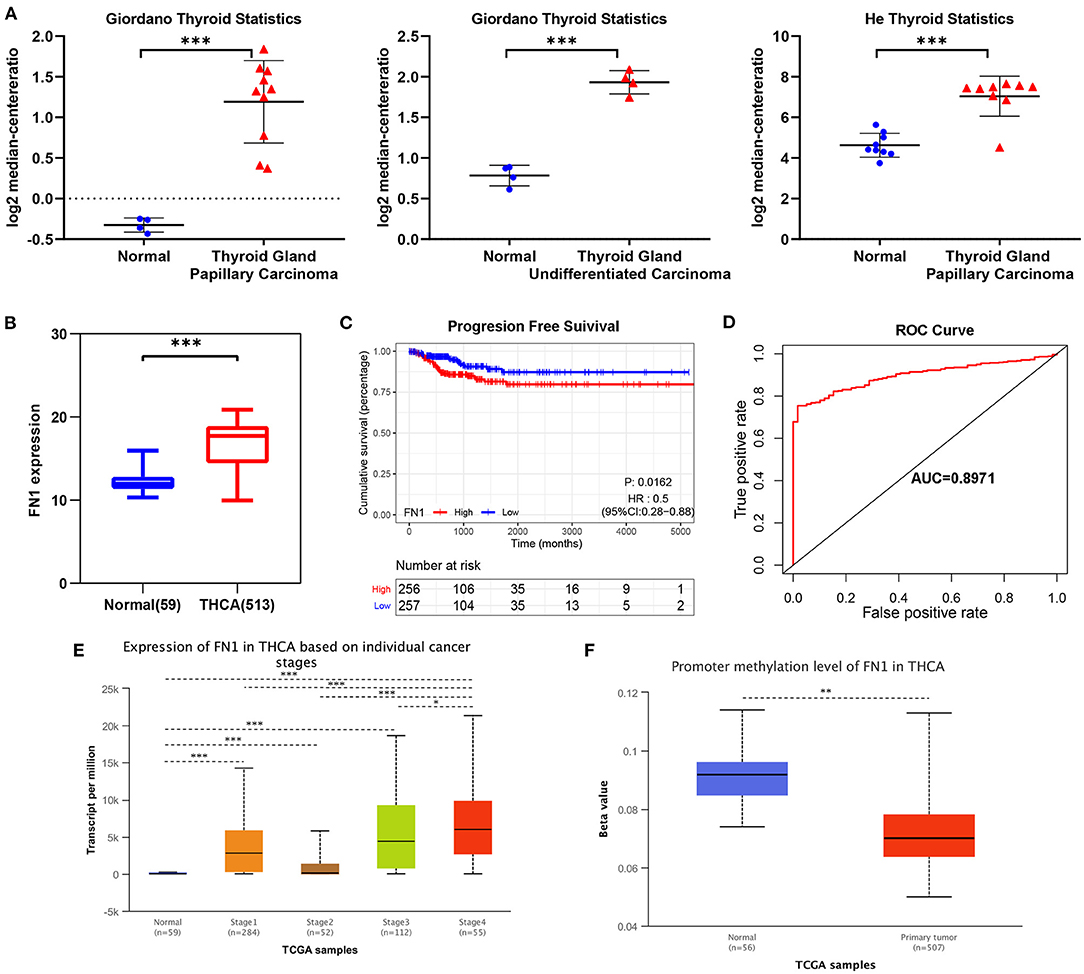
Figure 3. Transcriptional expressions of FN1 significantly correlated with poor survival outcomes in THCA patients from TCGA cohort. (A) The expression of FN1 in different subtypes of THCA. (B) The expressions of FN1 in THCA patients from TCGA-THCA cohort, (C) The correlation between the expression of FN1 and PFS, (D) ROC curve with an AUC of 0.8971. Transcriptional expression of FN1 was significantly correlated with individual cancer stages (E) and promoter methylation (F). *p < 0.05, **p < 0.01, ***p < 0.001.
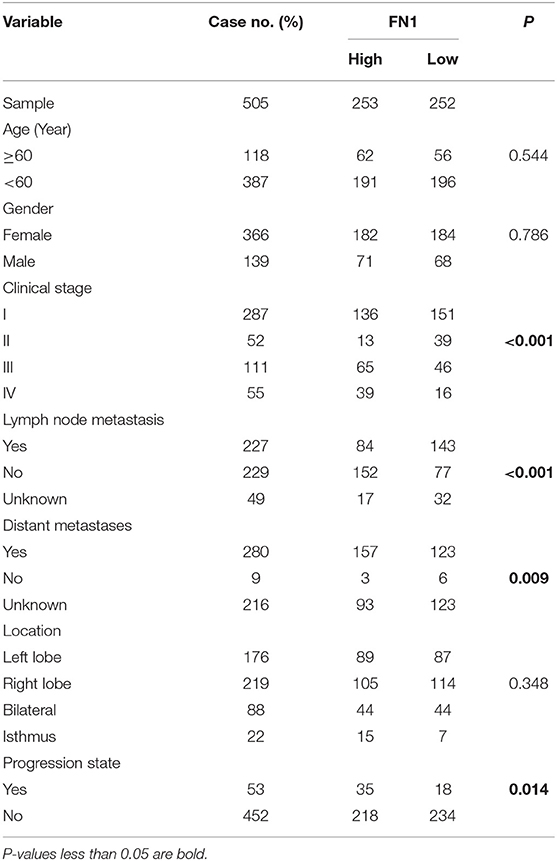
Table 3. Comparison of clinical characteristics between low FN1 group and high FN1 group in THCA cohort.
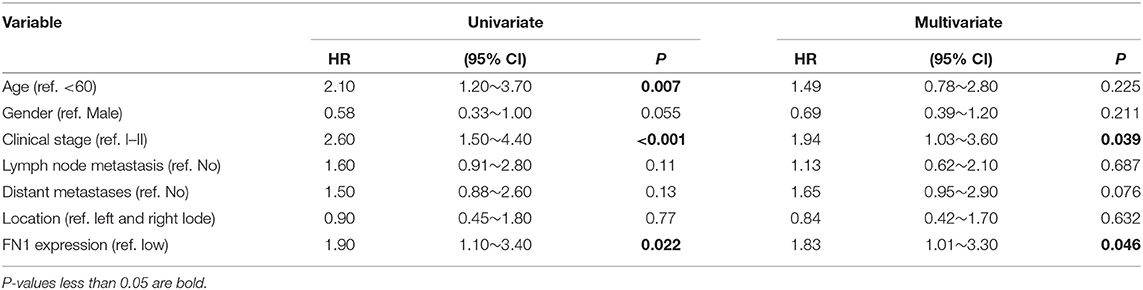
Table 4. Univariate and Multivariate Cox logistic regression analysis of FN1 for predicting PFS in TCGA cohort (PFS, progression free survival; TCGA, The Cancer Genome Atlas).
Analysis of the Potential Genetic and Epigenetic Alterations Underlying FN1 Dysregulation
Next, we investigated the underlying mechanism of FN1 dysregulation in THCA. To determine whether copy number alterations (CNAs) are responsible for the abnormal expression of FN1 in THCA, we analyzed 397 cases from the TCGA database for which CNAs data was available. No differences were observed for CNAs in the FN1-high and FN1-low groups (Figures 4A,B). Another mechanism that could underlie the altered FN1 expression profile observed in THCA samples is promoter hypermethylation, which plays an important role in the occurrence and development of several types of tumors (34, 35). To investigate whether DNA methylation results in FN1 dysfunction, we examined the status of CpG sites in 507 THCA cases from the TCGA database using the tool MEXPRESS. We found that 27 CpG sites had associated data; among which 20 CpG sites showed a negative correlation with FN1 expression (Figure 4C). The Pearson correlation coefficient was calculated for the five CpG sites with the highest correlation coefficient, including cg21494132, cg09040552, cg11309217, cg03228449, and cg03228449 (Figure 4D, all P < 0.05). Our results demonstrate the correlation between DNA methylation and abnormal expression levels of FN1 in THCA, highlighting the need for further investigation of the underlying mechanism.
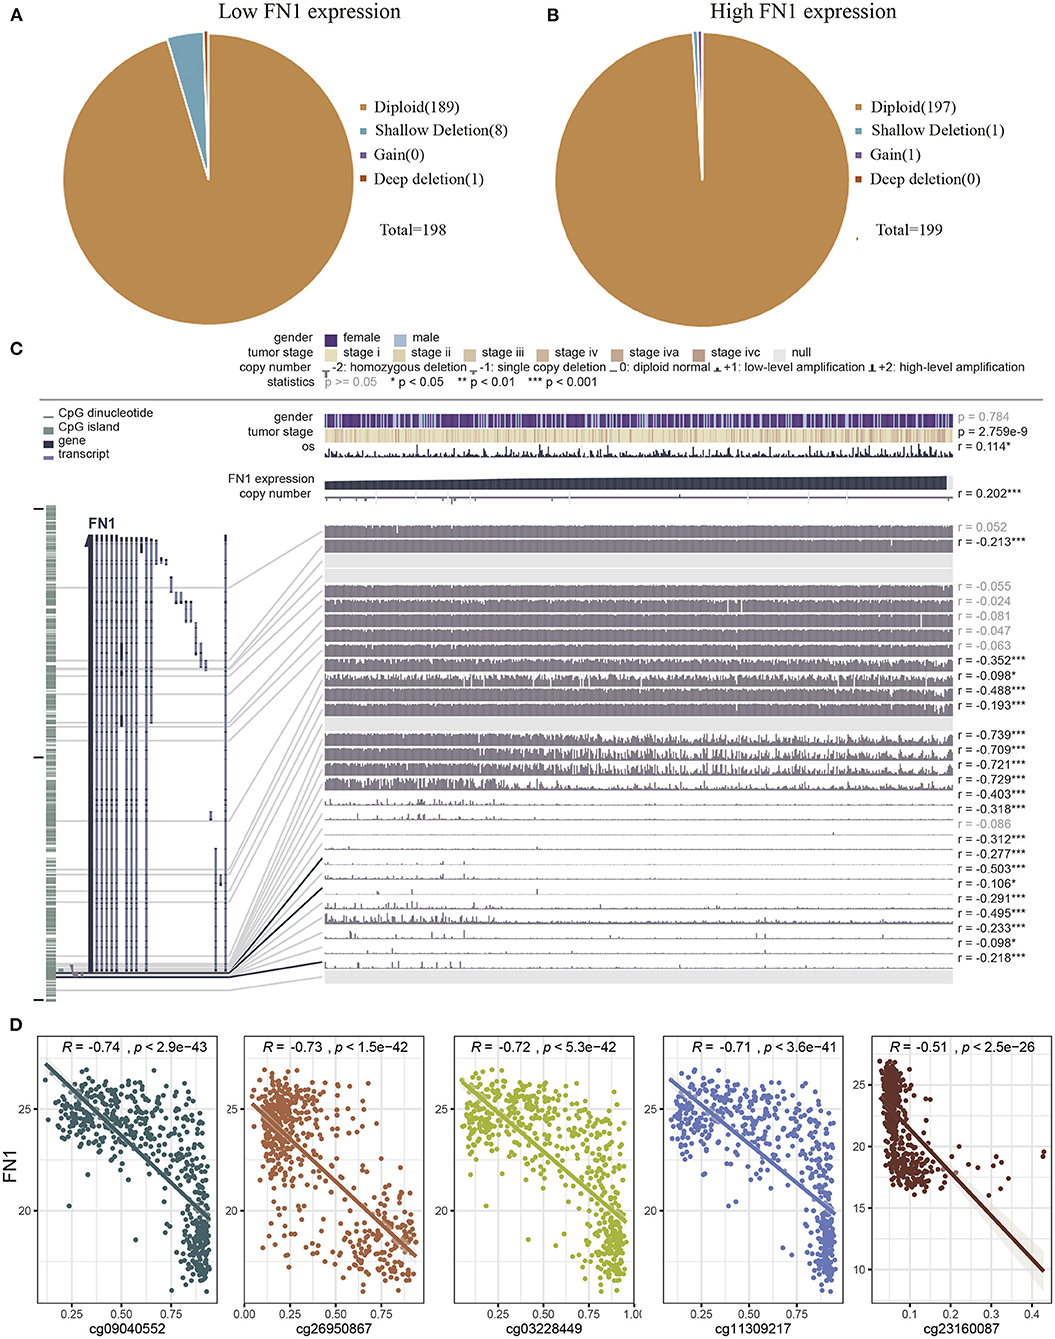
Figure 4. Analysis of the potential genetic and epigenetic alterations associated with FN1 dysregulation. (A,B) The CNAs in FN1-high and low expression groups. (C) Analysis of CpG island methylation and abnormal FN1 expression using TCGA-THCA dataset. (D) Correlation between FN1 expression and CpG island methylation was performed. *p < 0.05, **p < 0.01, ***p < 0.001.
Correlation Between FN1 and Inflammatory Activities
Considering the strong association between FN1 expression levels and THCA prognosis, we hypothesized that FN1 may be associated with inflammatory responses, leading to enhanced survival rates. To identify the FN1 associated immune signature in THCA, we assessed the degree of immune infiltration with CIBERSORT. FN1 expression was closely correlated to the degree of M2 macrophages, resting memory CD4+ T cells, follicular helper T cells, and CD8+ T cell infiltration. The increase in FN1 expression was associated with an increase of the proportion of M2 macrophages and resting memory CD4+ T cells and a decrease of the proportion of follicular helper T cells and CD8+ T cells (Figure 5A). To further investigate the correlation between FN1 and inflammation, we analyzed the co-expression of FN1 and members of the B7-CD28 ligand-receptor family, including CD274, CD80, CD86, CD276, CD273, CD275, B7-H4, B7-H5, CD28, B7-H7, CD152, CD279, CD278, TLT-2, and NKp30, which are closely correlated to T cell function. The result demonstrated that FN1 exhibited a significant co-expression trend with CD273, CD274, CD275, CD276 and B7-H4 (Figure 5B). Furthermore, we investigated the correlation between FN1, CD273, CD274, CD275, CD276, and B7-H4 expression in the THCA cohort, and found a close positive correlation between FN1 and CD276 expression (R = 0.55, P = 0) (Figures 5C,D). This result was validated using TIMER and GEPIA, which provided R-values of 0.682 and 0.79, respectively, for the correlation between FN1 and CD276 in THCA (P < 0.001) (Figures 5E,F).
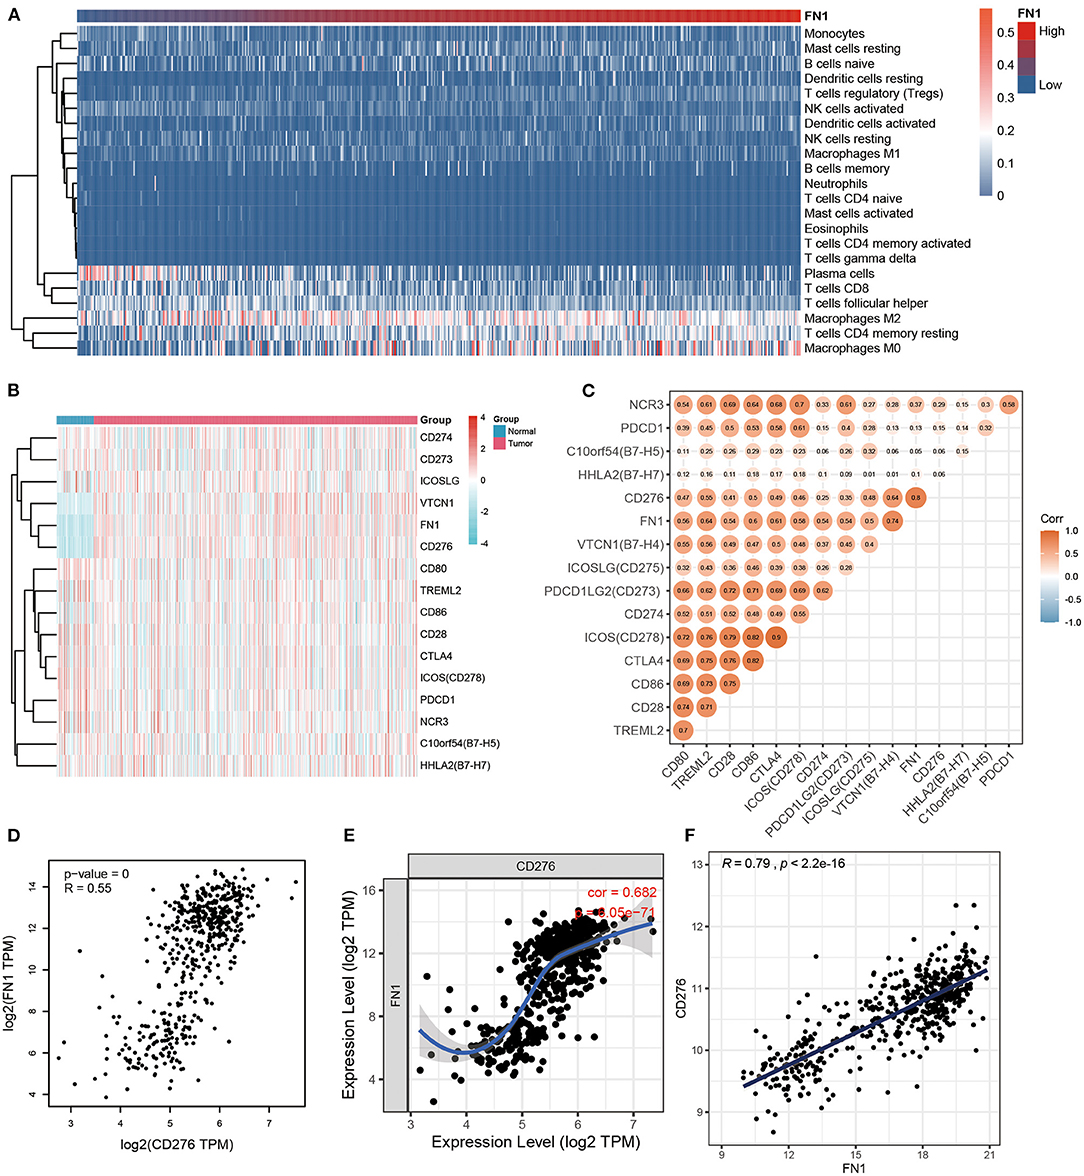
Figure 5. The correlation between FN1 and inflammatory activities. (A) The heatmap of immune infiltration analysis. (B) The coexpression between FN1 and the B7-CD28 ligand-receptor family. (C) The correlation between FN1, CD273, CD274, CD275, CD276, and B7-H4 in THCA cohort. The correlation between FN1 and CD276 analyzed by THCA datasets (D), TIMER (E), and GEPIA (F).
Down-Regulation of FN1 Inhibited Cell Proliferation and Invasion and Decreased CD276 Expression Levels in THCA Samples
To explore the biological significance of FN1 in THCA tumorigenesis, KTC-1 and B-CPAP cells were transfected with siRNA targeting FN1 (siFN1) or negative control siRNA (siNC). Efficient depletion of FN1 expression was confirmed via RT-qPCR (P < 0.05, Figure 6A). Moreover, we found that downregulation of FN1 significantly reduced the expression of CD276 in KTC-1 and B-CPAP cells compared with siNC transfection (Figure 6A), indicating that that the interactions between FN1 and CD276 could be a potential mechanism for the correlation of FN1 expression with immune infiltration and poor prognosis in THCA. Then, we studied the effect of FN1 on THCA cell proliferation and invasion in vitro. The wound-healing assay, cell viability, and cytotoxicity CCK-8 assay, and clone formation assay revealed that downregulation of FN1 in both cell types significantly inhibited cell proliferation and invasion compared to that in the control cells (P < 0.05, Figures 6B–D). These results suggest that the downregulation of FN1 reduces the viability of THCA cell lines.
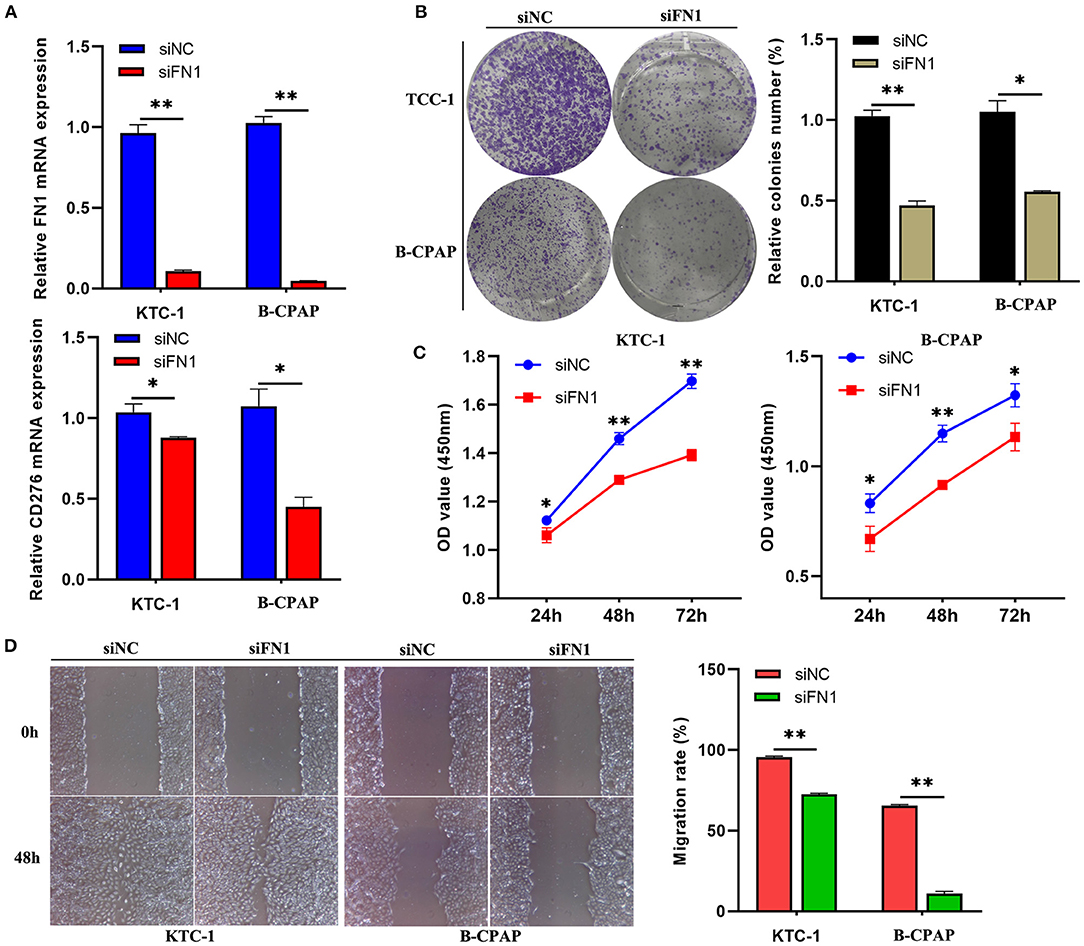
Figure 6. Down-regulation of FN1 suppressed THCA cell migration and invasion in vitro. (A) qRT-PCR showing the efficient depletion of FN1 expression and the expression of CD276 in B-CPAP and KTC-1 cells compared with siNC transfection. Representative photo-images (left) and histograms (right) of the effect of siFN1 on the clone formation (B) and migration (D) of B-CPAP and KTC-1 cells. (C) The proliferative ability of B-CPAP and KTC-1 cells after transfection was evaluated by CCK-8 assay. *p < 0.05, **p < 0.001.
FN1 Is Positively Correlated With CD276
In order to assess FN1 correlation with CD276, we analyzed FN1 and CD276 expression in tumor sites and the adjacent no-tumor samples (Figure 7A). We found that FN1 and CD276 showed significantly higher expression in tumor sites than in the adjacent no-tumor samples (P < 0.05, Figures 7C,D). Furthermore, we divided the tumor sites into two groups according to FN1 expression and found that CD276 levels were positively correlated with the level of FN1(P < 0.05, Figures 7B,E).
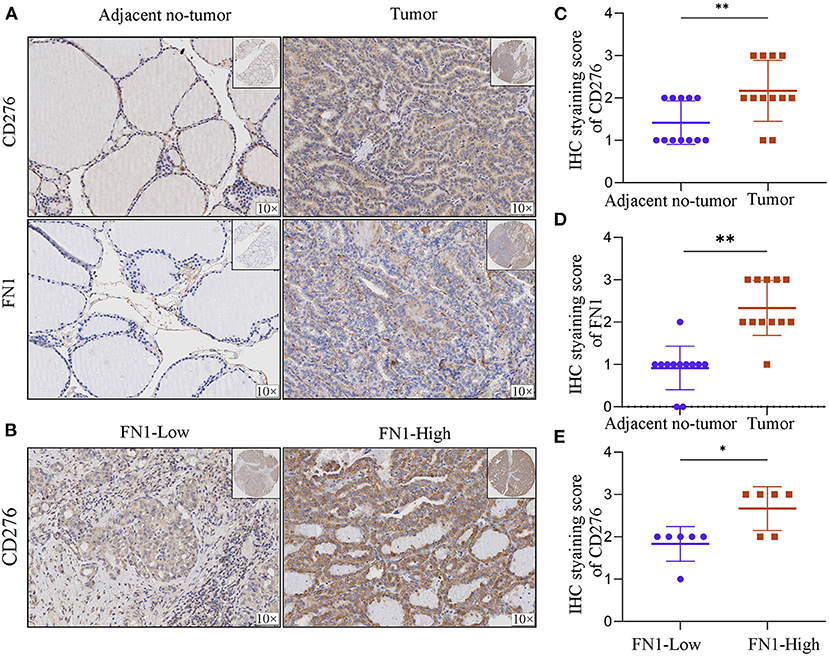
Figure 7. The correlation between FN1 and CD276 in THCA. (A) Representative IHC staining of CD276 and FN1 in tumors and adjacent no-tumor tissues from THCA patients. (B) Representative IHC staining of CD276 in tumor tissues from FN1-high and low patient groups. IHC score of CD276 (C) and FN1 (D) in adjacent no-tumor tissues and tumor tissues form patients with THCA. (E) IHC score of CD276 in tumor tissues from FN1-high and low patient groups, *p < 0.05, **P < 0.01.
Discussion
FN1 is a member of the FN family widely expressed in multiple cell types and is involved in cellular adhesion and migration processes (36). Here, we report that variations in FN1 expression levels correlate with prognosis in THCA patients. High expression levels of FN1 are associated with a poorer prognosis in THCA, indicating that FN1 expression could be used to predict tumor patient' prognosis. Furthermore, our analysis show that immune infiltration levels and immune markers are correlated with FN1 expression level in THCA, suggesting a potential role of FN1 in tumor immunology and its possible used as a cancer biomarker.
In this study, we screened DEGs from three GEO datasets based on functional enrichment analysis and PPI network maps. FN1, which is closely correlated to disease-free survival, was identified as a hub gene. In addition, we found that the promoter region of FN1 had significantly lower methylation levels (P < 0.05) in THCA than in normal thyroid tissues. GSEA analysis also showed that FN1 plays a role in the chemokine signaling pathway, cytokine receptor interaction, natural killer cell-mediated cytotoxicity, and T cell receptor signaling pathway, which is closely correlated to tumorigenesis. Importantly, immune infiltration analysis showed that immune infiltration level and diverse immune marker sets were correlated with FN1 expression level. Therefore, FN1 can be a potential immunity-related biomarker and therapeutic target in THCA. Moreover, using quantitative proteomic approaches, previous studies have proved that FN1 can be a potential novel candidate prognostic biomarker in THCA (37). However, these studies did not specify the exact range of effects of genes on disease prognosis, lacked certain clinical significance. In this study, three GEO datasets were combined to screen the hub genes, providing results with a high statistical and clinical significance. Our research further demonstrates that FN1 is a potential prognostic biomarker and therapeutic target in THCA from the perspective of DNA methylation and tumor immunology.
The important aspect of this study is that FN1 expression is correlated with diverse immune infiltration level in THCA. An increase in FN1 expression level was positively correlated with the proportion of M2 macrophages and resting memory CD4+ T cells but negatively correlated with the proportion of follicular helper T cells and CD8+ T cells. To further investigate the correlation between FN1 and inflammatory activities, the correlation between FN1 and members of the B7-CD28 ligand-receptor family was analyzed, and a close positive correlation between FN1 and CD276 was identified. CD276, a member of the B7 superfamily, has been previously identified as a poor prognostic factor. A previous study demonstrated that CD276, expressed in multiple tumor lines, tumor-infiltrating dendritic cells, and macrophages, can inhibit T-cell activation and autoimmunity (38). Therefore, the interactions between FN1 and CD276 could be a potential mechanism underlying the correlation of FN1 expression with immune infiltration and poor prognosis in THCA.
In summary, increased FN1 expression correlated with poor prognosis and altered immune infiltration levels in THCA, indicating that FN1 is a potential immunity-related biomarker. This study was based on a statistical analysis of bioinformatics methods, and the conclusions obtained were supported by experimental data and multiple databases. Therefore, it is reasonable to believe that FN1 plays an important role in the diagnosis, treatment, and prognosis of THCA.
Conclusion
In summary, we performed a comprehensive analysis using the TCGA dataset and multiple online databases and identified FN1 as a potential immunity-related biomarker and a prognostic marker in THCA. Our results suggest FN1 has a significant part in the diagnosis, treatment, and prognosis of THCA, highlighting the necessity of future clinical research in the topic.
Data Availability Statement
The datasets presented in this study can be found in online repositories. The names of the repository/repositories and accession number(s) can be found in the article/Supplementary Material.
Ethics Statement
All the patients' data involved in this study is open source which is freely available in the public research databases including the Cancer Genome Atlas (TCGA) and Gene Expression Omnibus (GEO). The application of the public data is already properly anonymized and informed consent was also obtained at the time of the original data collection. Samples from cancer patients were obtained from thyroid cancer arrays (DC-Thy11004 Avira Biotechnology Co., Ltd., China). The data is already properly anonymized and informed consent was also obtained at the time of the original data collection.
Author Contributions
Q-SG is responsible for the acquisition of the data, analysis and interpretation of the data. TH and L-FL are responsible for the drafting of the manuscript, and statistical analysis. Z-BS, W-HX,and JZ contributed to the critical revision of the manuscript. All authors contributed to the article and approved the submitted version.
Funding
This work was supported by the Collaborative Innovation Major Project of Zhengzhou (Grant No. 20XTZX08017), National Natural Science Foundation of China (Grant Nos. 82002433 and 82002998), Science and Technology Project of Henan Provincial Department of Education (Grant Nos. 18A320044 and 21A320036), Henan Province Medical Science and Technology Research Project Joint Construction Project (Grant Nos. LHGJ20190003, LHGJ20190055, and LHGJ20190042), First-class Postdoctoral Research Grant in Henan Province (Grant No. 201901007), and Youth Talent Support Project of Henan Province (Grant No. 2021HYTP045) also support this work.
Conflict of Interest
The authors declare that the research was conducted in the absence of any commercial or financial relationships that could be construed as a potential conflict of interest.
Publisher's Note
All claims expressed in this article are solely those of the authors and do not necessarily represent those of their affiliated organizations, or those of the publisher, the editors and the reviewers. Any product that may be evaluated in this article, or claim that may be made by its manufacturer, is not guaranteed or endorsed by the publisher.
Supplementary Material
The Supplementary Material for this article can be found online at: https://www.frontiersin.org/articles/10.3389/fmed.2021.812278/full#supplementary-material
Supplementary Figure 1. Flow diagram of the study.
Supplementary Table 1. The significantly enriched GO terms of the common DEGs (BP, biological process; CC, cellular component; DEG, differentially expressed gene; GO, Gene Ontology; MF, molecular function).
Abbreviations
THCA, Thyroid cancer; GEO, the Gene Expression Omnibus database; DEGs, the differentially expressed genes; DAVID, the Database for Annotation, Visualization, and Integrated Discovery; STRING, the Retrieval of Interacting Genes; PPI, the protein–protein interaction; GEPIA, Gene expression profiling and interactive analyses; PTC, papillary thyroid carcinoma; FTC, follicular thyroid carcinoma; ATC, undifferentiated thyroid carcinoma; MTC, medullary thyroid carcinoma; IHC, Immunohistochemistry.
References
1. Bonhomme B, Godbert Y, Perot G, Al GA, Bardet S, Belleannee G. Molecular pathology of anaplastic thyroid carcinomas: a retrospective study of 144 cases. Thyroid. (2017) 27:682–92. doi: 10.1089/thy.2016.0254
2. Davies L, Welch HG. Current thyroid cancer trends in the United States. JAMA Otolaryngol. (2014) 140:317–22. doi: 10.1001/jamaoto.2014.1
3. Zhao L, Pang P, Zang L, Luo Y, Wang F, Yang G. Features and trends of thyroid cancer in patients with thyroidectomies in Beijing, China between 1994 and 2015: a retrospective study. BMJ Open. (2019) 9:e0233341. doi: 10.1136/bmjopen-2018-023334
4. Aschebrook-Kilfoy B, Ward MH, Sabra MM, Devesa SS. Thyroid cancer incidence patterns in the United States by histologic type, 1992-2006. Thyroid. (2011) 21:125–34. doi: 10.1089/thy.2010.0021
5. Chen AY, Bernet VJ, Carty SE, Davies TF, Ganly I, Inabnet WR. American Thyroid Association statement on optimal surgical management of goiter. Thyroid. (2014) 24:181–9. doi: 10.1089/thy.2013.0291
6. Wang C., Sun P., Yang L. i. J., Yang W., Feng J. (2016). Z, et al. Strategies of laparoscopic thyroidectomy for treatment of substernal goiter via areola approach. Surg Endosc. 30, 4721–4730. doi: 10.1007/s00464-016-4814-0
7. Sipos JA, Mazzaferri EL. Thyroid cancer epidemiology and prognostic variables. Clin Oncol. (2010) 22:395–404. doi: 10.1016/j.clon.2010.05.004
8. Naoum GE, Morkos M, Kim B, Arafat W. Novel targeted therapies and immunotherapy for advanced thyroid cancers. Mol Cancer. (2018) 17:51. doi: 10.1186/s12943-018-0786-0
9. Mlecnik B, Van den Eynde M, Bindea G, Church SE, Vasaturo A, Fredriksen T. Comprehensive intrametastatic immune quantification and major impact of immunoscore on survival. J Natl Cancer Inst. (2018) 110:djx123. doi: 10.1093/jnci/djx123
10. Pankov R, Yamada KM. Fibronectin at a glance. J Cell Sci. (2002) 115(Pt 20):3861–3. doi: 10.1242/jcs.00059
11. Chen Z, Tao Q, Qiao B, Zhang L. Silencing of LINC01116 suppresses the development of oral squamous cell carcinoma by up-regulating microRNA-136 to inhibit FN1. Cancer Manag Res. (2019) 11:6043–59. doi: 10.2147/CMAR.S197583
12. Waalkes S, Atschekzei F, Kramer MW, Hennenlotter J, Vetter G, Becker JU. Fibronectin 1 mRNA expression correlates with advanced disease in renal cancer. BMC Cancer. (2010) 10:503. doi: 10.1186/1471-2407-10-503
13. Sponziello M, Rosignolo F, Celano M, Maggisano V, Pecce V, Rose D, et al. RF, et al. Fibronectin-1 expression is increased in aggressive thyroid cancer and favors the migration and invasion of cancer cells. Mol Cell Endocrinol. (2016) 431:123–32. doi: 10.1016/j.mce.2016.05.007
14. Glasner A, Levi A, Enk J, Isaacson B, Viukov S, Orlanski S. NKp46 receptor-mediated interferon-γ production by natural killer cells increases fibronectin 1 to alter tumor architecture and control metastasis. Immunity. (2018) 48:107–19. doi: 10.1016/j.immuni.2017.12.007
15. Zhang DL, Wang JM, Wu T, Du X, Yan J. Du ZX, et al. BAG5 promotes invasion of papillary thyroid cancer cells via upregulation of fibronectin 1 at the translational level. Biochim Biophys Acta Mol Cell Res. (2020) 1867:118715. doi: 10.1016/j.bbamcr.2020.118715
16. Yu S, Yu X, Sun L, Zheng Y, Chen L, Xu H, et al. GBP2 enhances glioblastoma invasion through Stat3/fibronectin pathway. Oncogene. (2020) 39:5042–55. doi: 10.1038/s41388-020-1348-7
17. Rago T, Scutari M, Loiacono V, Santini F, Tonacchera M, Torregrossa L, et al. Low elasticity of thyroid nodules on ultrasound elastography is correlated with malignancy, degree of fibrosis, and high expression of galectin-3 and fibronectin-1. Thyroid. (2017) 27:103–10. doi: 10.1089/thy.2016.0341
18. Goldman MJ, Craft B, Hastie M, Repečka K, McDade F, Kamath A, et al. Visualizing and interpreting cancer genomics data via the Xena platform. Nat Biotechnol. (2020) 38:675–8. doi: 10.1038/s41587-020-0546-8
19. Tomas G, Tarabichi M, Gacquer D, Hebrant A, Dom G, Dumont JE. A general method to derive robust organ-specific gene expression-based differentiation indices: application to thyroid cancer diagnostic. Oncogene. (2012) 31:4490–8. doi: 10.1038/onc.2011.626
20. Rusinek D, Swierniak M, Chmielik E, Kowal M, Kowalska M, Cyplinska R. BRAFV600E-associated gene expression profile: early changes in the transcriptome, based on a transgenic mouse model of papillary thyroid carcinoma. PLoS ONE. (2015) 10:e143688. doi: 10.1371/journal.pone.0143688
21. Tarabichi M, Saiselet M, Tresallet C, Hoang C, Larsimont D, Andry G. Revisiting the transcriptional analysis of primary tumours and associated nodal metastases with enhanced biological and statistical controls: application to thyroid cancer. Br J Cancer. (2015) 112:1665–74. doi: 10.1038/bjc.2014.665
22. Kameshwar AK, Qin W. Metadata analysis of phanerochaete chrysosporium gene expression data identified common CAZymes encoding gene expression profiles involved in cellulose and hemicellulose degradation. Int J Biol Sci. (2017) 13:85–99. doi: 10.7150/ijbs.17390
23. Khan A, Mathelier A. Intervene: a tool for intersection and visualization of multiple gene or genomic region sets. BMC Bioinformatics. (2017) 18:287. doi: 10.1186/s12859-017-1708-7
24. Chen L, Zhang YH, Lu G, Huang T, Cai YD. Analysis of cancer-related lncRNAs using gene ontology and KEGG pathways. Artif Intell Med. (2017) 76:27–36. doi: 10.1016/j.artmed.2017.02.001
25. Zhao Z, Bai J, Wu A, Wang Y, Zhang J, Wang Z. Co-LncRNA: investigating the lncRNA combinatorial effects in GO annotations and KEGG pathways based on human RNA-Seq data. Database. (2015) 2015:bav082. doi: 10.1093/database/bav082
26. Cook HV, Doncheva NT, Szklarczyk D, von Mering C, Jensen LJ. Viruses.STRING: a virus-host protein-protein interaction database. Viruses. (2018) 10:519. doi: 10.3390/v10100519
27. Doncheva NT, Morris JH, Gorodkin J, Jensen LJ. Cytoscape StringApp: network analysis and visualization of proteomics data. J Proteome Res. (2019) 18:623–32. doi: 10.1021/acs.jproteome.8b00702
28. Rhodes DR, Yu J, Shanker K, Deshpande N, Varambally R, Ghosh D, et al. ONCOMINE: a cancer microarray database and integrated data-mining platform. Neoplasia. (2004) 6:1–6. doi: 10.1016/S1476-5586(04)80047-2
29. Chandrashekar DS, Bashel B, Balasubramanya S, Creighton CJ, Ponce-Rodriguez I, Chakravarthi B. UALCAN: a portal for facilitating tumor subgroup gene expression and survival analyses. Neoplasia. (2017) 19:649–58. doi: 10.1016/j.neo.2017.05.002
30. Koch A, Jeschke J, Van Criekinge W, van Engeland M, Meyer De T. MEXPRESS update 2019. Nucleic Acids Res. (2019) 47:W561–5. doi: 10.1093/nar/gkz445
31. Huang WY, Hsu SD, Huang HY, Sun YM, Chou CH, Weng SL, et al. A database of DNA methylation and gene expression in human cancer. Nucleic Acids Res. (2015) 43:D856–61. doi: 10.1093/nar/gku1151
32. Newman AM, Steen CB, Liu CL, Gentles AJ, Chaudhuri AA, Scherer F. Determining cell type abundance and expression from bulk tissues with digital cytometry. Nat Biotechnol. (2019) 37:773–82. doi: 10.1038/s41587-019-0114-2
33. Tang Z, Li C, Kang B, Gao G, Li C, Zhang Z. GEPIA: a web server for cancer and normal gene expression profiling and interactive analyses. Nucleic Acids Res. (2017) 45:W98–102. doi: 10.1093/nar/gkx247
34. Morgan AE, Davies TJ, Mc AM. The role of DNA methylation in ageing and cancer. Proc Nutr Soc. (2018) 77:412–22. doi: 10.1017/S0029665118000150
35. Flanagan JM, Wilson A, Koo C, Masrour N, Gallon J, Loomis E. Platinum-based chemotherapy induces methylation changes in blood DNA associated with overall survival in patients with ovarian cancer. Clin Cancer Res. (2017) 23:2213–22. doi: 10.1158/1078-0432.CCR-16-1754
36. Ruoslahti E. Fibronectin in cell adhesion and invasion. Cancer Metastasis Rev. (1984) 3:43–51. doi: 10.1007/BF00047692
37. Zhan S, Li J, Wang T, Ge W. Quantitative proteomics analysis of sporadic medullary thyroid cancer reveals FN1 as a potential novel candidate prognostic biomarker. Oncologist. (2018) 23:1415–25. doi: 10.1634/theoncologist.2017-0399
38. Lee YH, Martin-Orozco N, Zheng P, Li J, Zhang P, Tan H, et al. Inhibition of the B7-H3 immune checkpoint limits tumor growth by enhancing cytotoxic lymphocyte function. Cell Res. (2017) 27:1034–45. doi: 10.1038/cr.2017.90
Keywords: thyroid cancer, biomarker, FN1, immunity, survival
Citation: Geng Q-S, Huang T, Li L-F, Shen Z-B, Xue W-H and Zhao J (2022) Over-Expression and Prognostic Significance of FN1, Correlating With Immune Infiltrates in Thyroid Cancer. Front. Med. 8:812278. doi: 10.3389/fmed.2021.812278
Received: 10 November 2021; Accepted: 15 December 2021;
Published: 24 January 2022.
Edited by:
Fu Wang, Xi'an Jiaotong University, ChinaReviewed by:
Zhuo Li, Sun Yat-sen Memorial Hospital, ChinaMengyan Li, Sun Yat-sen University Cancer Center (SYSUCC), China
Copyright © 2022 Geng, Huang, Li, Shen, Xue and Zhao. This is an open-access article distributed under the terms of the Creative Commons Attribution License (CC BY). The use, distribution or reproduction in other forums is permitted, provided the original author(s) and the copyright owner(s) are credited and that the original publication in this journal is cited, in accordance with accepted academic practice. No use, distribution or reproduction is permitted which does not comply with these terms.
*Correspondence: Jie Zhao, emhhb2ppZUB6enUuZWR1LmNu