 An Ran Ran1,2†
 Xi Wang3,4†Poemen P. Chan1,2,5Noel C. Chan1,6,7Wilson Yip1,6,7Alvin L. Young1,6Mandy O. M. Wong1,5Hon-Wah Yung8
 Robert T. Chang9Suria S. Mannil9
 Yih Chung Tham10,11,12
 Ching-Yu Cheng10,11,12
 Hao Chen13Fei Li14
 Xiulan Zhang14Pheng-Ann Heng3‡Clement C. Tham1,2,5‡
 Carol Y. Cheung1,2*‡
- 1Department of Ophthalmology and Visual Sciences, The Chinese University of Hong Kong, Hong Kong, Hong Kong SAR, China
- 2Lam Kin Chung. Jet King-Shing Ho Glaucoma Treatment and Research Centre, The Chinese University of Hong Kong, Hong Kong, Hong Kong SAR, China
- 3Department of Computer Science and Engineering, The Chinese University of Hong Kong, Hong Kong, Hong Kong SAR, China
- 4Department of Radiation Oncology, Stanford University School of Medicine, Stanford, Palo Alto, CA, United States
- 5Hong Kong Eye Hospital, Hong Kong, Hong Kong SAR, China
- 6Department of Ophthalmology, Prince of Wales Hospital, Hong Kong, Hong Kong SAR, China
- 7Department of Ophthalmology, Alice Ho Miu Ling Nethersole Hospital, Hong Kong, Hong Kong SAR, China
- 8Tuen Mun Eye Centre, Hong Kong, Hong Kong SAR, China
- 9Department of Ophthalmology, Byers Eye Institute, Stanford University, Palo Alto, CA, United States
- 10Singapore Eye Research Institute, Singapore National Eye Centre, Singapore, Singapore
- 11Duke-National University of Singapore Medical School, Singapore, Singapore
- 12Department of Ophthalmology, Yong Loo Lin School of Medicine, National University of Singapore, Singapore, Singapore
- 13Department of Computer Science and Engineering, The Hong Kong University of Science and Technology, Hong Kong, Hong Kong SAR, China
- 14State Key Laboratory of Ophthalmology, Zhongshan Ophthalmic Centre, Sun Yat-sen University, Guangzhou, China
Purpose: We aim to develop a multi-task three-dimensional (3D) deep learning (DL) model to detect glaucomatous optic neuropathy (GON) and myopic features (MF) simultaneously from spectral-domain optical coherence tomography (SDOCT) volumetric scans.
Methods: Each volumetric scan was labelled as GON according to the criteria of retinal nerve fibre layer (RNFL) thinning, with a structural defect that correlated in position with the visual field defect (i.e., reference standard). MF were graded by the SDOCT en face images, defined as presence of peripapillary atrophy (PPA), optic disc tilting, or fundus tessellation. The multi-task DL model was developed by ResNet with output of Yes/No GON and Yes/No MF. SDOCT scans were collected in a tertiary eye hospital (Hong Kong SAR, China) for training (80%), tuning (10%), and internal validation (10%). External testing was performed on five independent datasets from eye centres in Hong Kong, the United States, and Singapore, respectively. For GON detection, we compared the model to the average RNFL thickness measurement generated from the SDOCT device. To investigate whether MF can affect the model’s performance on GON detection, we conducted subgroup analyses in groups stratified by Yes/No MF. The area under the receiver operating characteristic curve (AUROC), sensitivity, specificity, and accuracy were reported.
Results: A total of 8,151 SDOCT volumetric scans from 3,609 eyes were collected. For detecting GON, in the internal validation, the proposed 3D model had significantly higher AUROC (0.949 vs. 0.913, p < 0.001) than average RNFL thickness in discriminating GON from normal. In the external testing, the two approaches had comparable performance. In the subgroup analysis, the multi-task DL model performed significantly better in the group of “no MF” (0.883 vs. 0.965, p-value < 0.001) in one external testing dataset, but no significant difference in internal validation and other external testing datasets. The multi-task DL model’s performance to detect MF was also generalizable in all datasets, with the AUROC values ranging from 0.855 to 0.896.
Conclusion: The proposed multi-task 3D DL model demonstrated high generalizability in all the datasets and the presence of MF did not affect the accuracy of GON detection generally.
Introduction
Glaucoma is the leading cause of visual morbidity and blindness worldwide, and it is projected to affect 111.8 million people by 2040 (1, 2). Prompt and accurate detection of glaucoma is extremely important in preventing and reducing irreversible visual loss. Spectral-domain optical coherence tomography (SDOCT), a non-contact and non-invasive imaging technology for cross-sectional and three-dimensional (3D) view of the retina and optic nerve head (ONH), is now commonly used to evaluate glaucomatous optic neuropathy (GON), the structural change of glaucoma (3–5). SDOCT is widely used to quantify retinal nerve fibre layer (RNFL), neuro-retinal rim, and other inner retinal layers (e.g., ganglion cell layer, inner plexiform layer). SDOCT is sensitive and specific for detecting glaucoma, especially when combined with other ophthalmoscopic modalities (3, 4, 6).
Nevertheless, myopic features (MF), including peripapillary atrophy (PPA), optic disc tilting, and fundus tessellation, could influence GON identification based on RNFL thickness measurement alone, which should be considered when interpreting the optic disc and its circumpapillary regions for diagnosis (7). For example, PPA beta zone correlates with glaucoma, while gamma zone is related to axial globe elongation. A higher degree of vertical optic disc tilting is associated with a more temporally positioned RNFL thickness peak, and a higher degree of fundus tessellation is associated with thinner RNFL (8–10). Eyes with longer axial length are associated with significantly higher percentages of false-positive errors based on an SDOCT built-in normative database (11). Hence, evaluating GON using SDOCT based on RNFL thickness and built-in normative databases alone may not be reliable. As illustrated in Supplementary Figure 1A, MF can also result in thinning of RNFL thickness (i.e., outside of the normal RNFL range) in eyes without GON which is similar to eyes with GON (Supplementary Figure 1B). Other diagraphs and metrics, such as topographical ONH measurements, RNFL thickness map, RNFL deviation map, circumpapillary RNFL thickness with “double-hump pattern” should also be evaluated to differentiate these two pathologies carefully. For example, in purely myopic eyes, the “double-hump pattern” is still existed but with temporal shift due to optic disc tilting. The RNFL thickness map also shows normal thickness except that the angle between superior and inferior RNFL bundles is smaller. While in GON eyes, RNFL “double hump pattern” is altered and thinner RNFL thickness appears at specific regions. Thus, interpretation of the results requires experienced glaucoma specialists or highly trained assessors who have good knowledge on both GON and OCT limitations.
Deep learning (DL), composed of multiple processing layers, allows computational models to learn representative features with multiple levels of abstraction. These models showed promise in pattern recognition and image analysis (12). Currently, automated image analysis based on DL technology has been developed to detect GON from different kinds of images, such as fundus photographs (FP) and OCT images (13–20). We previously developed a 3D DL model to detect GON from SDOCT volumetric scans, which performed non-inferiorly to glaucoma specialists (21). However, all these DL algorithms only detected GON without learning features of Yes/No MF. Previous studies showed an increased risk of glaucoma among myopic eyes and high myopia is also a risk factor of GON progression (22, 23). Besides, there is a lack of knowledge whether MF affects DL model’s discriminative ability for GON detection. Having additional information on yes/no MF may help to evaluate subjects with glaucoma further. Multi-task learning is a training paradigm to train DL models with data from multiple tasks simultaneously, using shared representations to learn the common features between a collection of related tasks (24). It has been used in ultrasound, CT, and dermoscopic images (25–27), which showed potential advantages of integrating information across domains and extracting more general features for different tasks. Our previous work also applied multi-task technique for detecting GON and predicting visual field (VF) metrics (28), or detecting different kinds of retinal diseases (29, 30) from OCT images.
In this study, we aimed to train and validate a multi-task 3D DL model to analyze SDOCT volumetric scans and identify GON and MF simultaneously. We hypothesise that the model with multi-task technique would extract common features and achieve high generalizability for both tasks. Besides, the proposed model could achieve better or comparable performance when comparing with conventional RNFL thickness.
Materials and Methods
This study was a multi-centred retrospective study. It was approved by the Research Ethics Committee of the Hospital Authority, Hong Kong (HK), the SingHealth Centralised Institutional Review Board, Singapore, and Stanford University’s Institutional Review Board/Ethics Committee, the United States (US). The study adhered to the Declaration of Helsinki. As the study involved only retrospective analysis using fully anonymized SDOCT images, informed consent was exempted.
Training, Tuning, and Internal Validation Dataset
The dataset for training, tuning, and internal validation was inherited from our previous study (21). It was collected from existing database of electronic medical and research records at the Chinese University of Hong Kong (CUHK) Eye Centre and the Hong Kong Eye Hospital (HKEH). The inclusion criteria were (1) age equal to or older than 18 years old, (2) gradable SDOCT optic disc scans and en face images, (3) reliable VF tests, and (4) confirmed diagnosis of glaucoma or healthy subjects. The exclusion criteria were (1) other ocular or systemic diseases that may cause optic disc abnormalities or VF defect; (2) missing data on VF, SDOCT optic disc scans, or en face images. The non-glaucomatous subjects from the research centre were volunteers from existing cohorts in CUHK Eye Centre. The non-glaucomatous subjects from the eye clinics were subjects who seek for opportunistic eye check-ups. All study subjects underwent SDOCT imaging by Cirrus HD-OCT (Carl Zeiss Meditec, Inc., Dublin, CA, United States) using the optic disc cube scanning protocol, which generated the RNFL thickness map (6 mm2× 6 mm2) around the optic disc. The VF of each study subject was determined by static automated white-on-white threshold perimetry using the Humphrey Field Analyzer II (Carl Zeiss Meditec, Inc., Dublin, CA, United States). For each feasible eye, 3D SDOCT optic disc scan and 2D en face fundus image could be extracted simultaneously.
External Testing Datasets
We used five independent datasets from other eye centres to test the performance of the DL model: External testing 1, Prince of Wales Hospital (PWH), HK; External testing 2, Tuen Mun Eye Centre (TMEC), HK; External testing 3, Alice Ho Miu Ling Nethersole Hospitals (AHNH), HK; External testing 4, Byers Eye Institute, Stanford University (Stanford), United States; and External testing 5, Singapore Eye Research Institute (SERI), Singapore. The inclusion criteria, exclusion criteria, VF and OCT device, and ground truth labelling for the external testing datasets were the same as the development dataset.
Ground Truth Labelling
For the ground truth labelling, we first excluded ungradable images and then classified GON and MF in each gradable images, which was consistent with our previous studies (21, 31). The criteria were as follow:
Ungradable SDOCT images was defined as signal strength (SS) less than 5 or any artefacts influencing the measurement circle or > 25% of the peripheral area (31). GON was defined as RNFL thinning on gradable SDOCT images, with a structural defect that correlated in position with the VF defect which fulfilled the definition of glaucomatous VF defect (32). These eyes were labelled as “Yes GON.” Eyes without GON were defined as normal VF with no obvious glaucomatous optic disc cupping and loss of neuro-retinal rim, and these eyes were labelled as “No GON.”
Myopic features included presence of (1) PPA, chorioretinal thinning and disruptive of the retinal pigment epithelium (RPE) (33), (2) optic disc tilting, the ratio between the shortest and longest metres (tilt ratio) less than 0.8 (34), and (3) fundus tessellation, increased visibility of the large choroidal vessels outside of the parapapillary area (8). Eyes with one or more of these features were labelled as “Yes MF,” while eyes without any features were labelled as “No MF” (Supplementary Figure 2).
Following the definitions, SDOCT scans and LSO en face images were subjected to a tiered grading system by trained assessors, ophthalmologists, and glaucoma specialists, for assessing image quality, MF, and GON, respectively. Images were labelled when two graders arrived at the same categorization separately. For those cases on which the two graders did not arrive at the same categorization in their independent evaluations, the cases were reviewed and categorised by senior graders.
Data Pre-processing
We applied standardisation and normalisation for data pre-processing. Specifically, standardisation was used to transfer data to have zero mean and unit variance, and normalisation rescaled the data to the range of 0–1. To alleviate the over-fitting issue, during the training process, we used several data augmentation techniques, including random cropping and random flipping at three axes, to enrich training samples for the 3D SDOCT volumetric data. Consequently, the final input size of the network was 200 × 1000 × 200.
We implemented the DL model using Keras package and python on a workstation equipped with 3.5 GHz Intel® Core™ i7-5930K CPU and GPUs of Nvidia GeForce GTX Titan X. We set the learning rate as 0.0001 and optimised the weights of the networks with Adam stochastic gradient descent algorithm.
Development of the Multi-Task Deep Learning Model
The proposed network included three modules, (1) shared feature extraction module, (2) GON classification module, and (3) MF detection module, respectively. The constructed network was similar to our previous study (21) with ResNet-37 as the backbone. We used shortcut connections to perform identity mapping and evade vanishing gradient problem during backpropagation. We removed the fully connected layer from the 3D ResNet-37. This module acted as the shared feature extraction module. In the GON classification module, a fully connected layer with softmax activation accepted the feature from the first module and output the classification probabilities for “Yes GON” and “No GON.” Likewise, there was also a fully connected layer with softmax activation in the MF detection module. Figure 1 displays the structure of the multi-task 3D DL model.
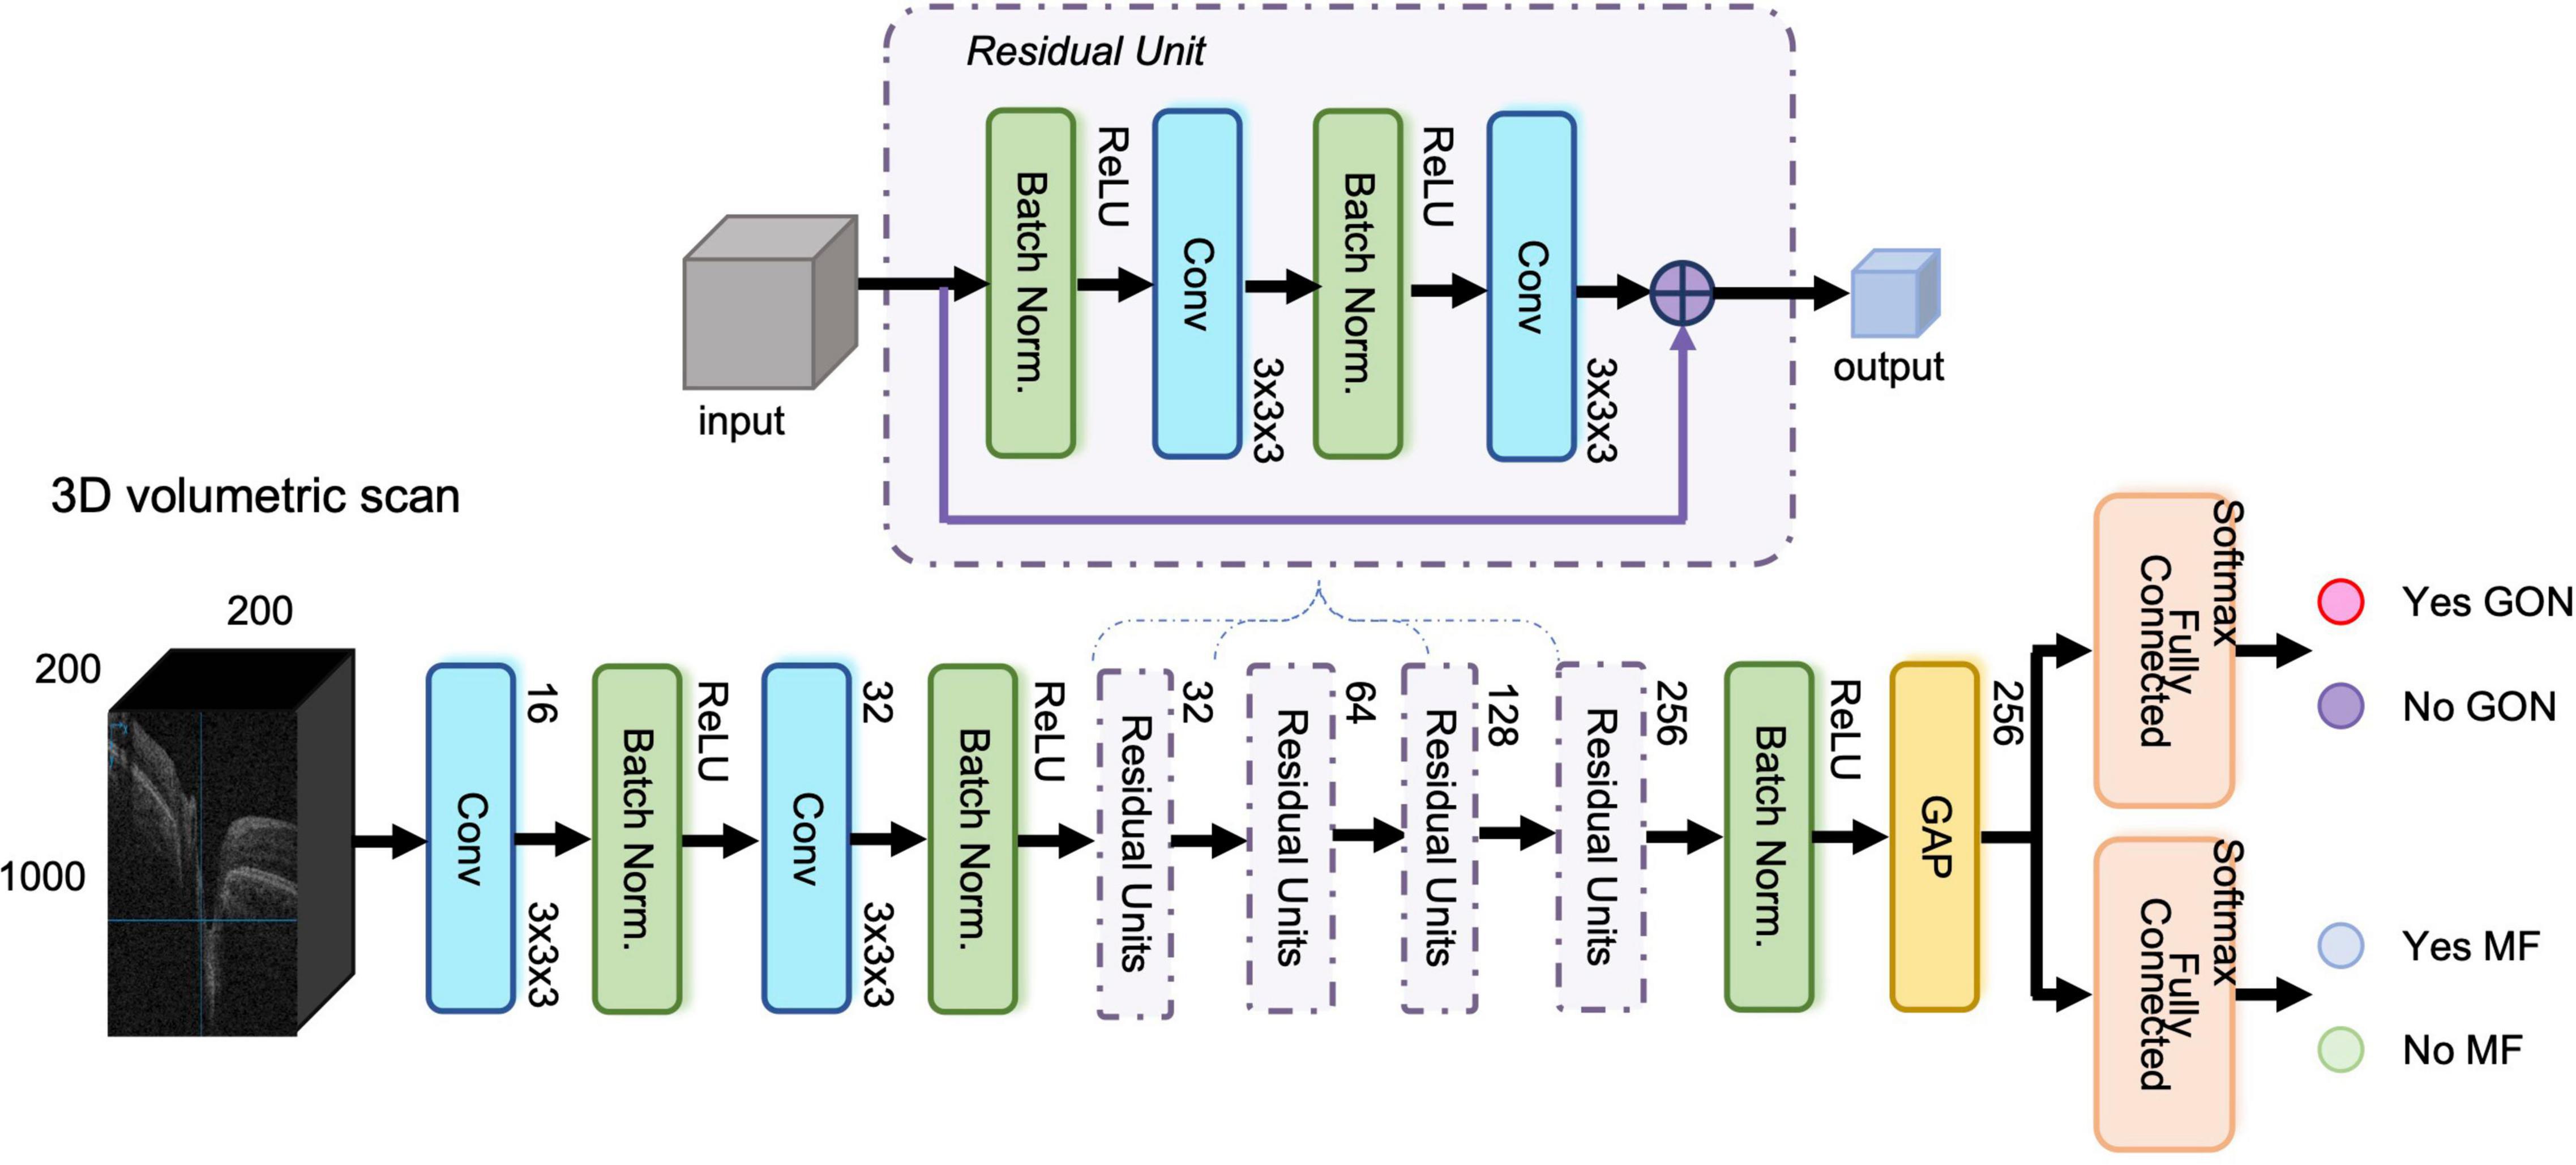
Figure 1. The structure of the three-dimensional (3D) multi-task deep learning model. The proposed network included three modules, (1) shared feature extraction module, (2) glaucomatous optic neuropathy (GON) classification module, and (3) myopic features (MF) detection module, respectively. It was built based on ResNet-37 network with 3D convolutional layers and global average pooling layer. The input was an OCT volumetric scan of size 200 × 1000 × 200 pixels after image pre-processing and the output was Yes/No GON and Yes/No MF.
All gradable SDOCT volumetric scans collected from CUHK Eye Center and HKEH were randomly divided for training (80%), tuning (10%), and internal validation (10%) at the patient level. In each set, the ratio of “Yes GON and Yes MF,” “Yes GON and No MF,” “No GON and Yes MF,” and “No GON and No MF” was similar, and multiple images from the same subjects were in the same set to prevent leakage or performance overestimation. We trained the multi-task DL model from scratch, and the tuning dataset was used to select and modify the optimum model during training. During the training, tuning, and internal validation, we observed the training-validation curve to evaluate over-fitting issue, which could also provide a further reference to the generalizability of the models. Additionally, SDOCT volumetric scans from PWH, TMEC, AHNH, Stanford, and SERI were used for external testing.
Finally, we generated heatmaps for selected eyes by class activation map (CAM) (35) to evaluate the model performance qualitatively.
Development of Single-Task Models and a 2D Model for Performance Comparison
We trained and tested two 3D single-task DL models using the same split dataset as the proposed 3D multi-task model for GON and MF detection, respectively. We also used segmentation-free 2D OCT B-scans as the input to train and test a 2D multi-task DL model using the same split dataset as the proposed 3D multi-task model. Each OCT volumetric scan contained 200 B-scans and the mean predictions of these B-scans were used as the volume-level prediction. All the models were tested on the same testing sets for final performance comparison.
Statistical Analysis
The statistical analyses were performed by RStudio Version 1.1.463 (2009–2018 RStudio, Inc.). One-way ANOVA and chi-square test were performed for numerical and categorical data, respectively, to analyse demographic characteristics of all the participants and data variances of different datasets. The area under the receiver operating characteristic curve (AUROC) with 95% confidence interval (CI), sensitivity, specificity, and accuracy were calculated to evaluate the discriminative performance (Yes/No GON and Yes/No MF) of the 3D multi-task DL model, 3D single-task model, and 2D multi-task DL model in all the datasets. For GON detection, we further compared the performance of the proposed multi-task 3D DL model to that of the average RNFL thickness measurement generated from the SDOCT device. Delong test was used to compare the AUROCs of different methods. To investigate whether MF can affect the model’s performance on GON detection, we also conducted subgroup analyses in groups stratified by Yes/No MF. All the hypotheses tested were two-sided, and a p-value of less than 0.05 were considered statistically significant.
Results
Table 1 displays the characteristics of all the datasets. We investigated 2,541 subjects, including 1,452 glaucoma patients and 1,089 non-glaucomatous subjects. In the total of 8,151 SDOCT volumetric scans from 3,609 eyes were collected. To develop the multi-task DL model, we used 3,919 scans from 1,196 eyes for training, 460 scans from 180 eyes for tuning, and 454 scans from 196 eyes for internal validation. For the external testing, we collected five independent datasets from different eye centres and used 545, 267, 515, 933, and 1,058 SDOCT volumetric scans, from 417, 261, 428, 399, and 532 eyes, respectively. There was no significant difference in age, gender (male vs. female), and eye (right vs. left) of subjects among all the groups in tuning and internal validation set. For training set, age and gender had a significant difference.
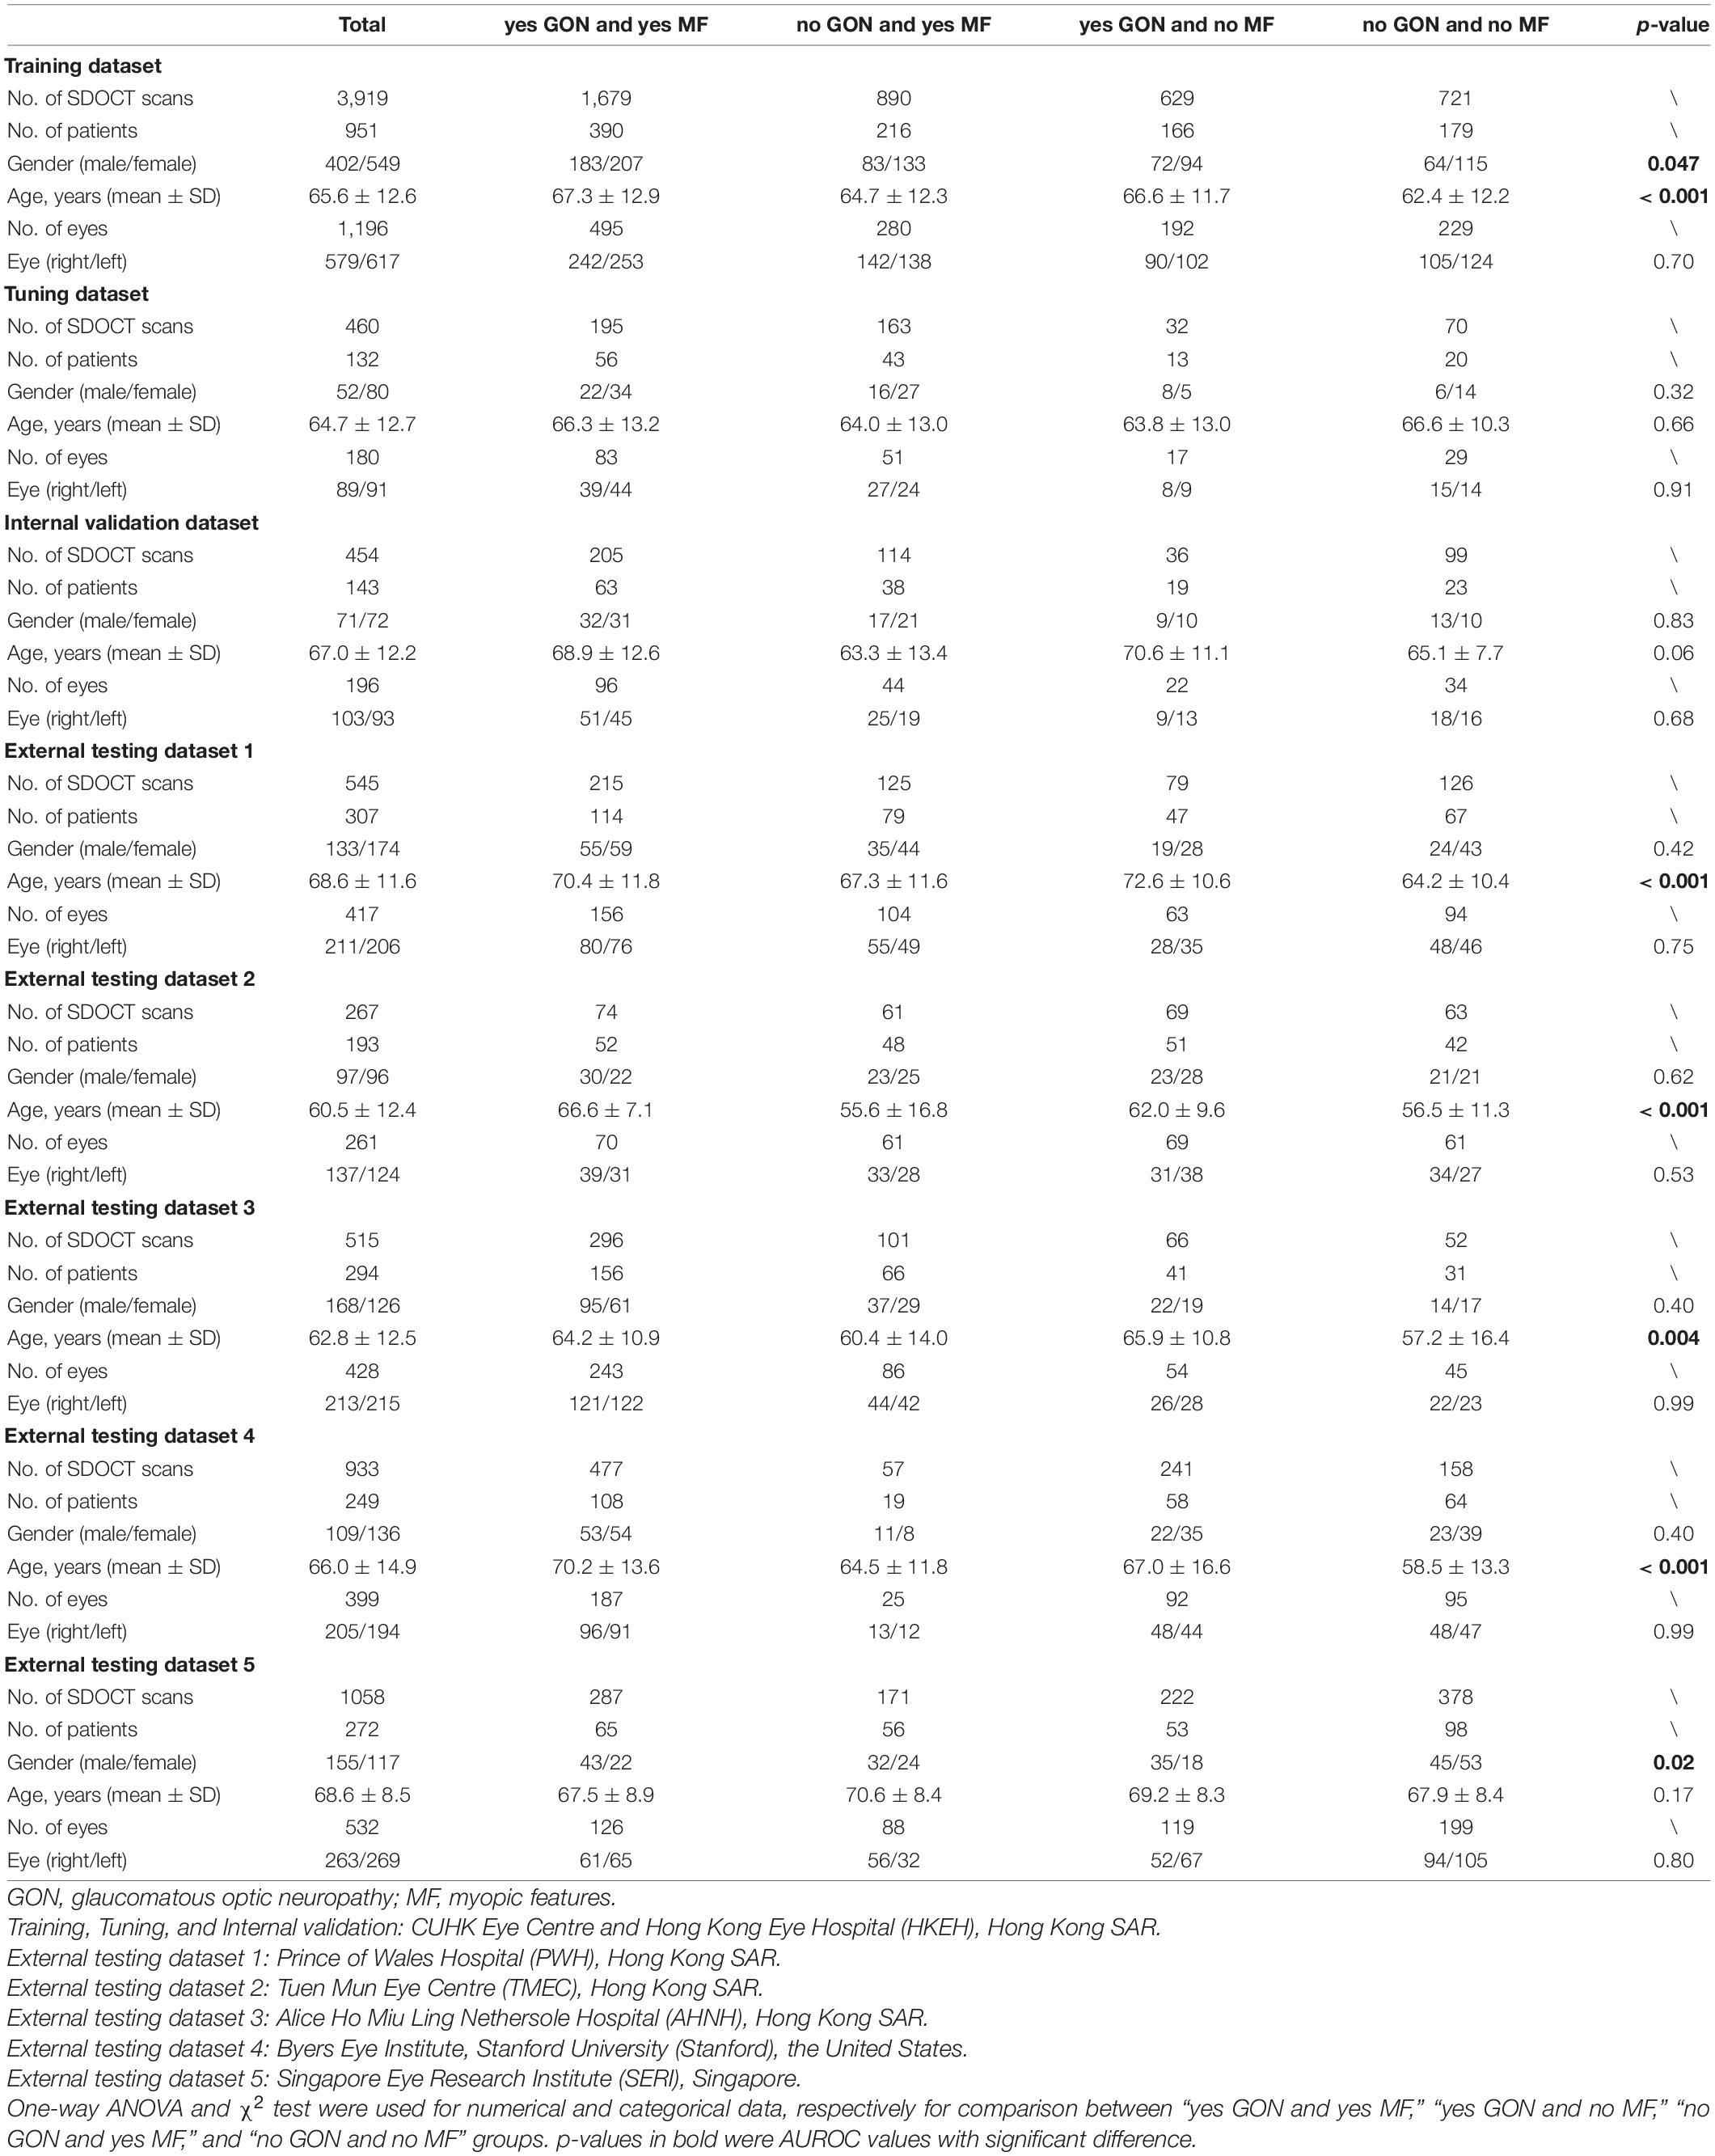
Table 1. Summary of the study subjects and data distribution.
Table 2 demonstrates the performance of the 3D multi-task DL model for GON identification and the comparison to average RNFL thickness, a 3D single-task DL model, and a 2D multi-task model. In the internal validation dataset, the proposed model had significantly higher AUROC (0.949 vs. 0.913, p < 0.001) than that of RNFL thickness. In the five external testing datasets, the two methods (DL model vs. RNFL thickness) had comparable AUROC values (0.890 vs. 0.890, 0.903 vs. 0.915, 0.906 vs. 0.913, 0.950 vs. 0.950, and 0.930 vs. 0.921, respectively). Figures 2A,B shows the ROC curves and AUROC values using the 3D multi-task DL model and RNFL thickness to identify GON in internal validation and external testing. The proposed 3D multi-task model also achieved generally better performance than a 3D single-task model and a 2D multi-task model.
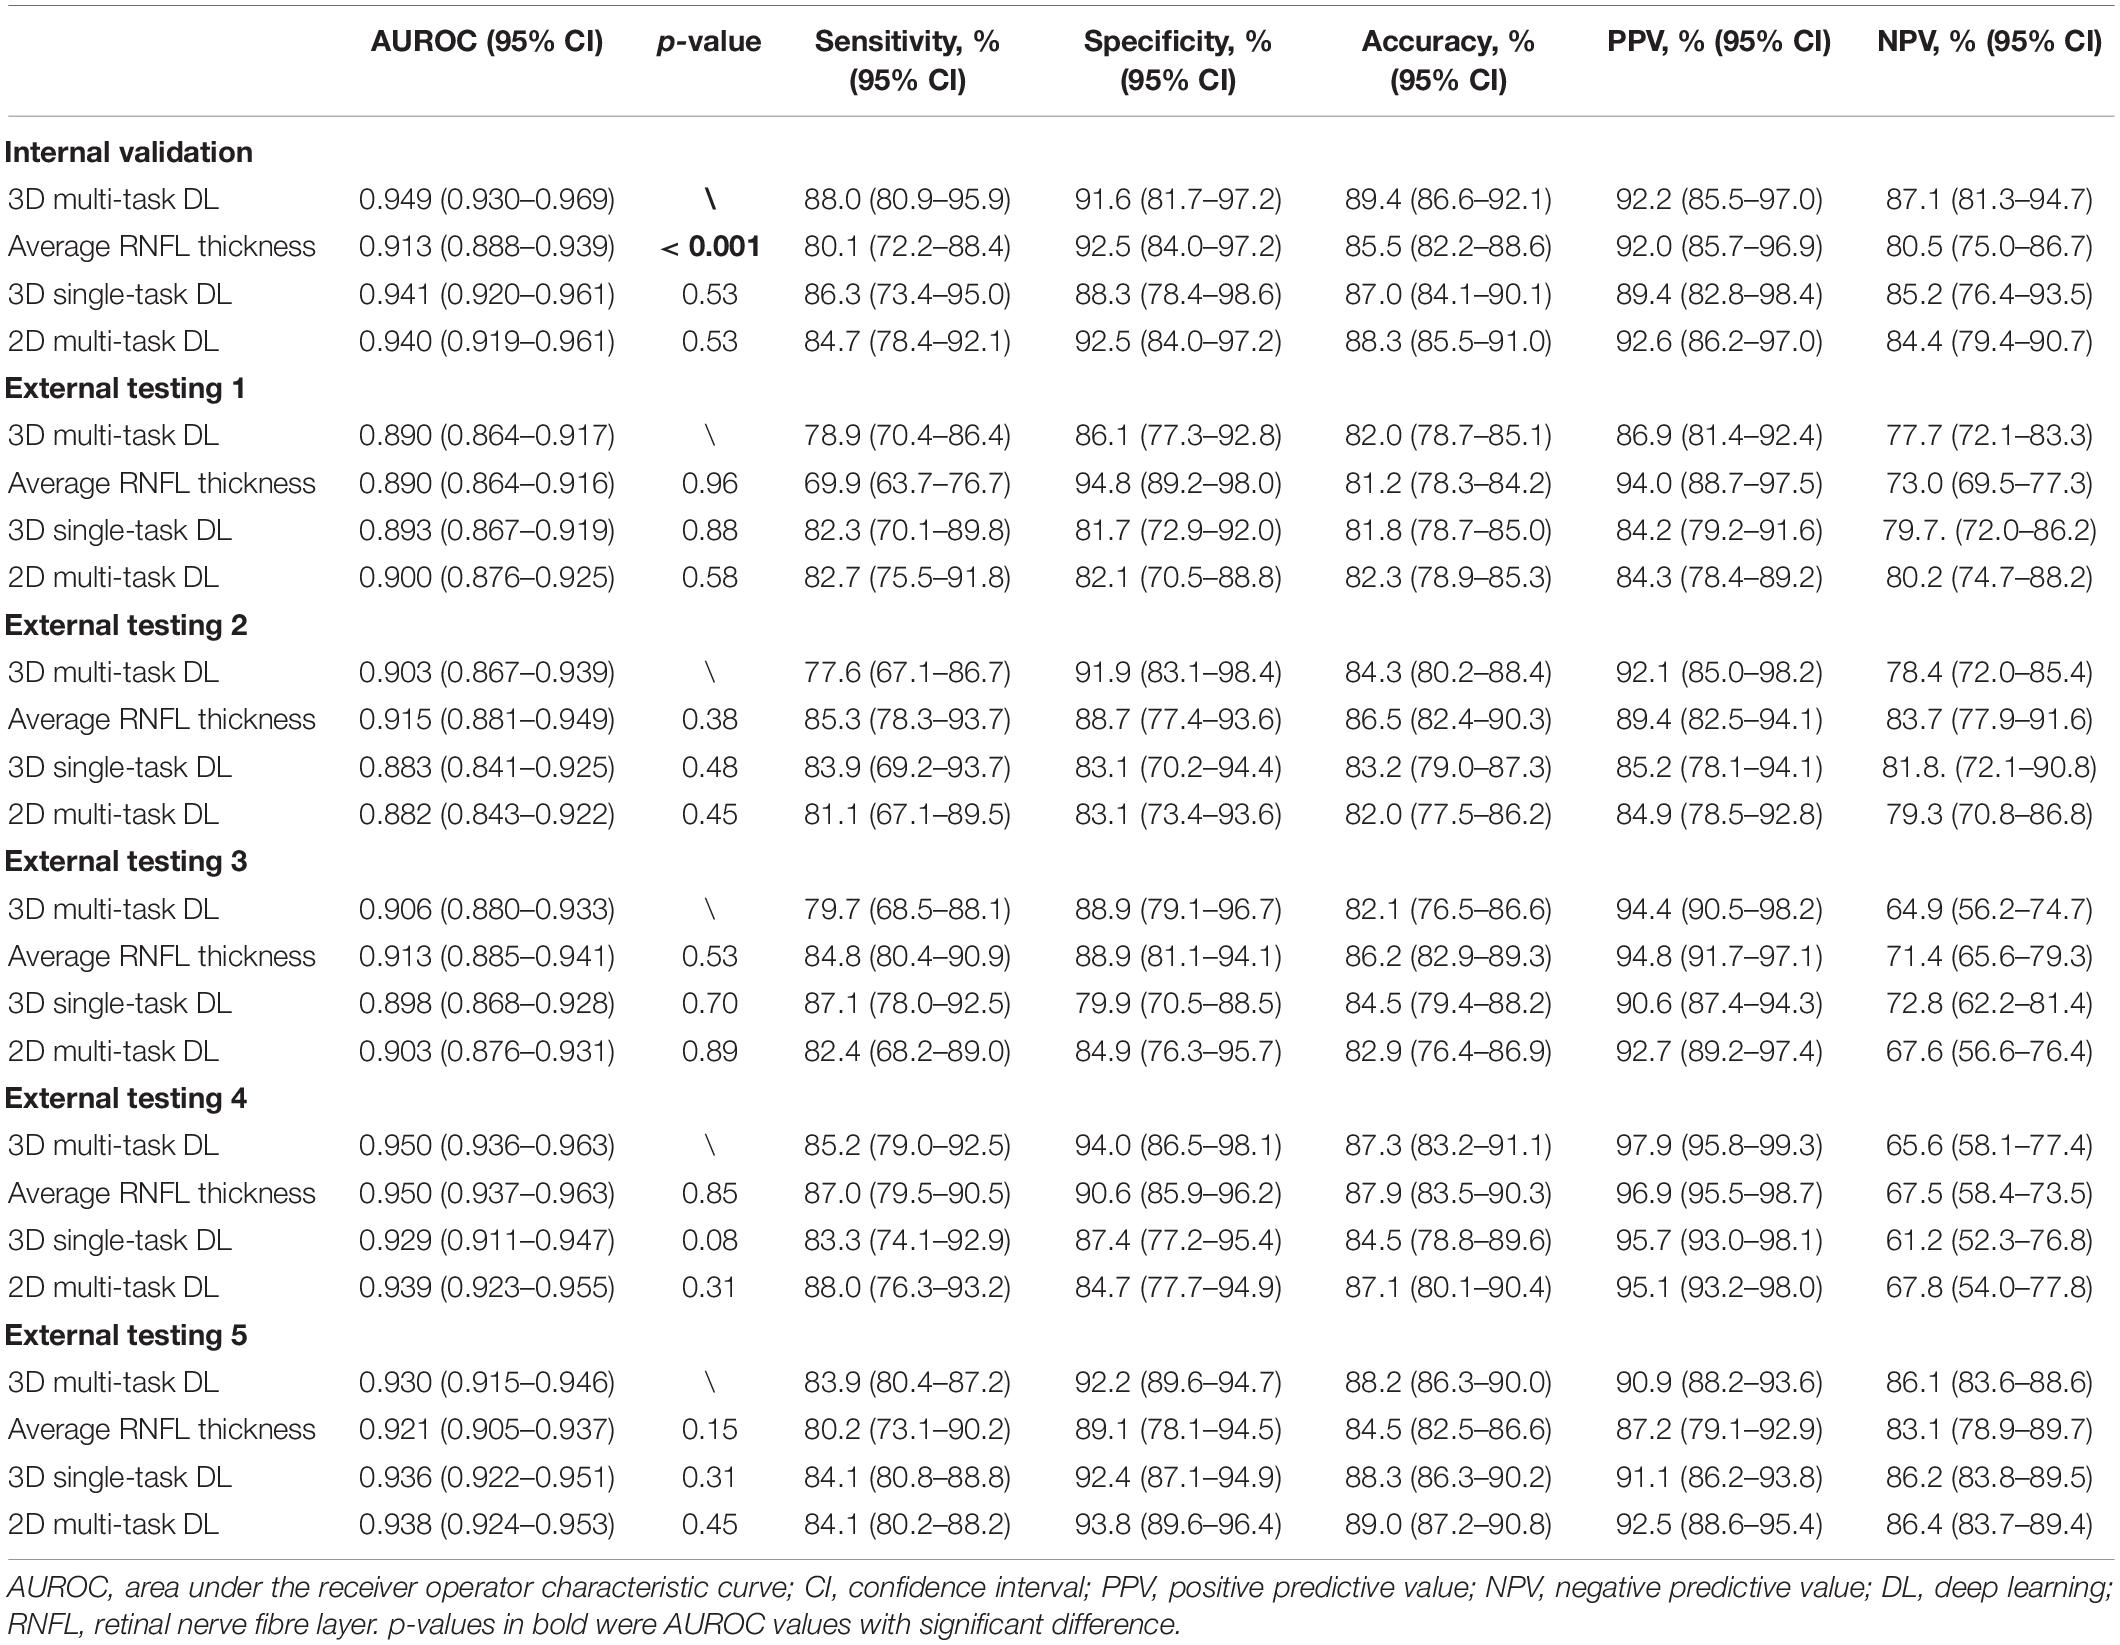
Table 2. The discriminative performance of the multi-task 3D deep learning model for detecting glaucomatous optic neuropathy and the comparison to average retinal nerve fibre layer thickness, a single-task 3D deep learning model, and a multi-task 2D deep learning model in all datasets.
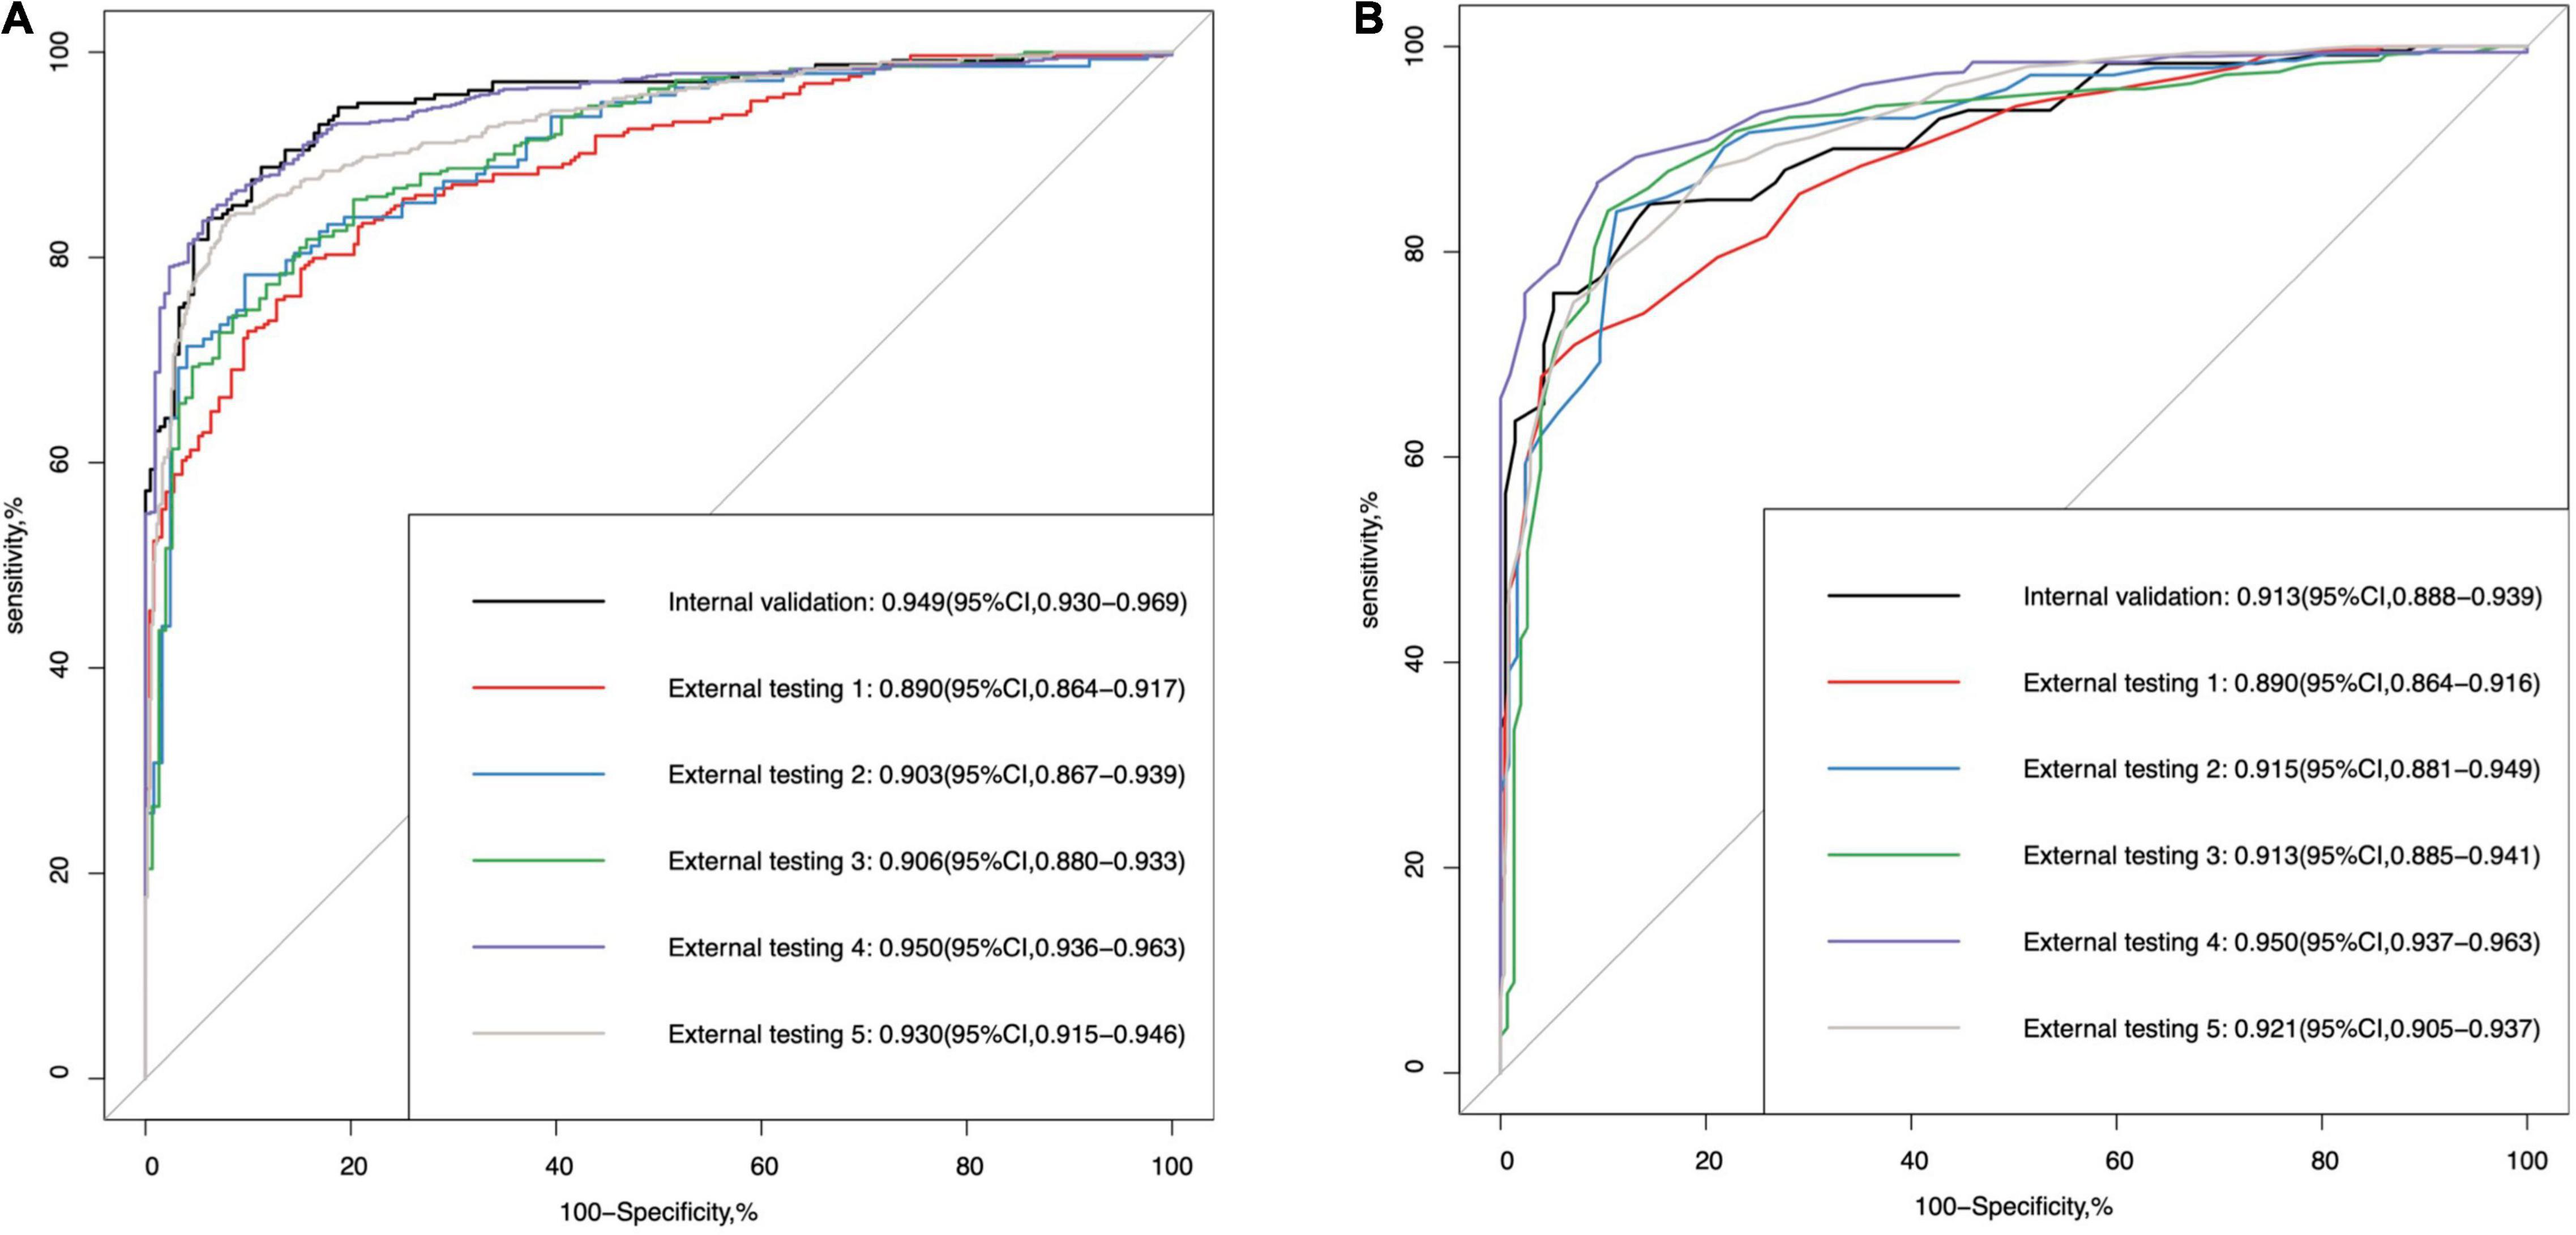
Figure 2. The area under the receiver operating characteristic (ROC) curve (AUROC) values of (A) the multi-task deep learning model and (B) retinal nerve fibre layer thickness in internal validation and external testing for glaucomatous optic neuropathy detection.
In the sub-analysis stratified by Yes/No MF, there was no significant difference in internal validation (0.938 vs. 0.952, p-value = 0.65) and External testing 1 (0.884 vs. 0.896, p-value = 0.67), External testing 2 (0.926 vs. 0.900, p-value = 0.47), External testing 4 (0.941 vs. 0.940, p-value = 0.95), and External testing 5 (0.923 vs. 0.925, p-value = 0.93). In External testing 3, the multi-task DL model performed significantly better in the group of “no MF” (0.883 vs. 0.965, p-value < 0.001) (Table 3).
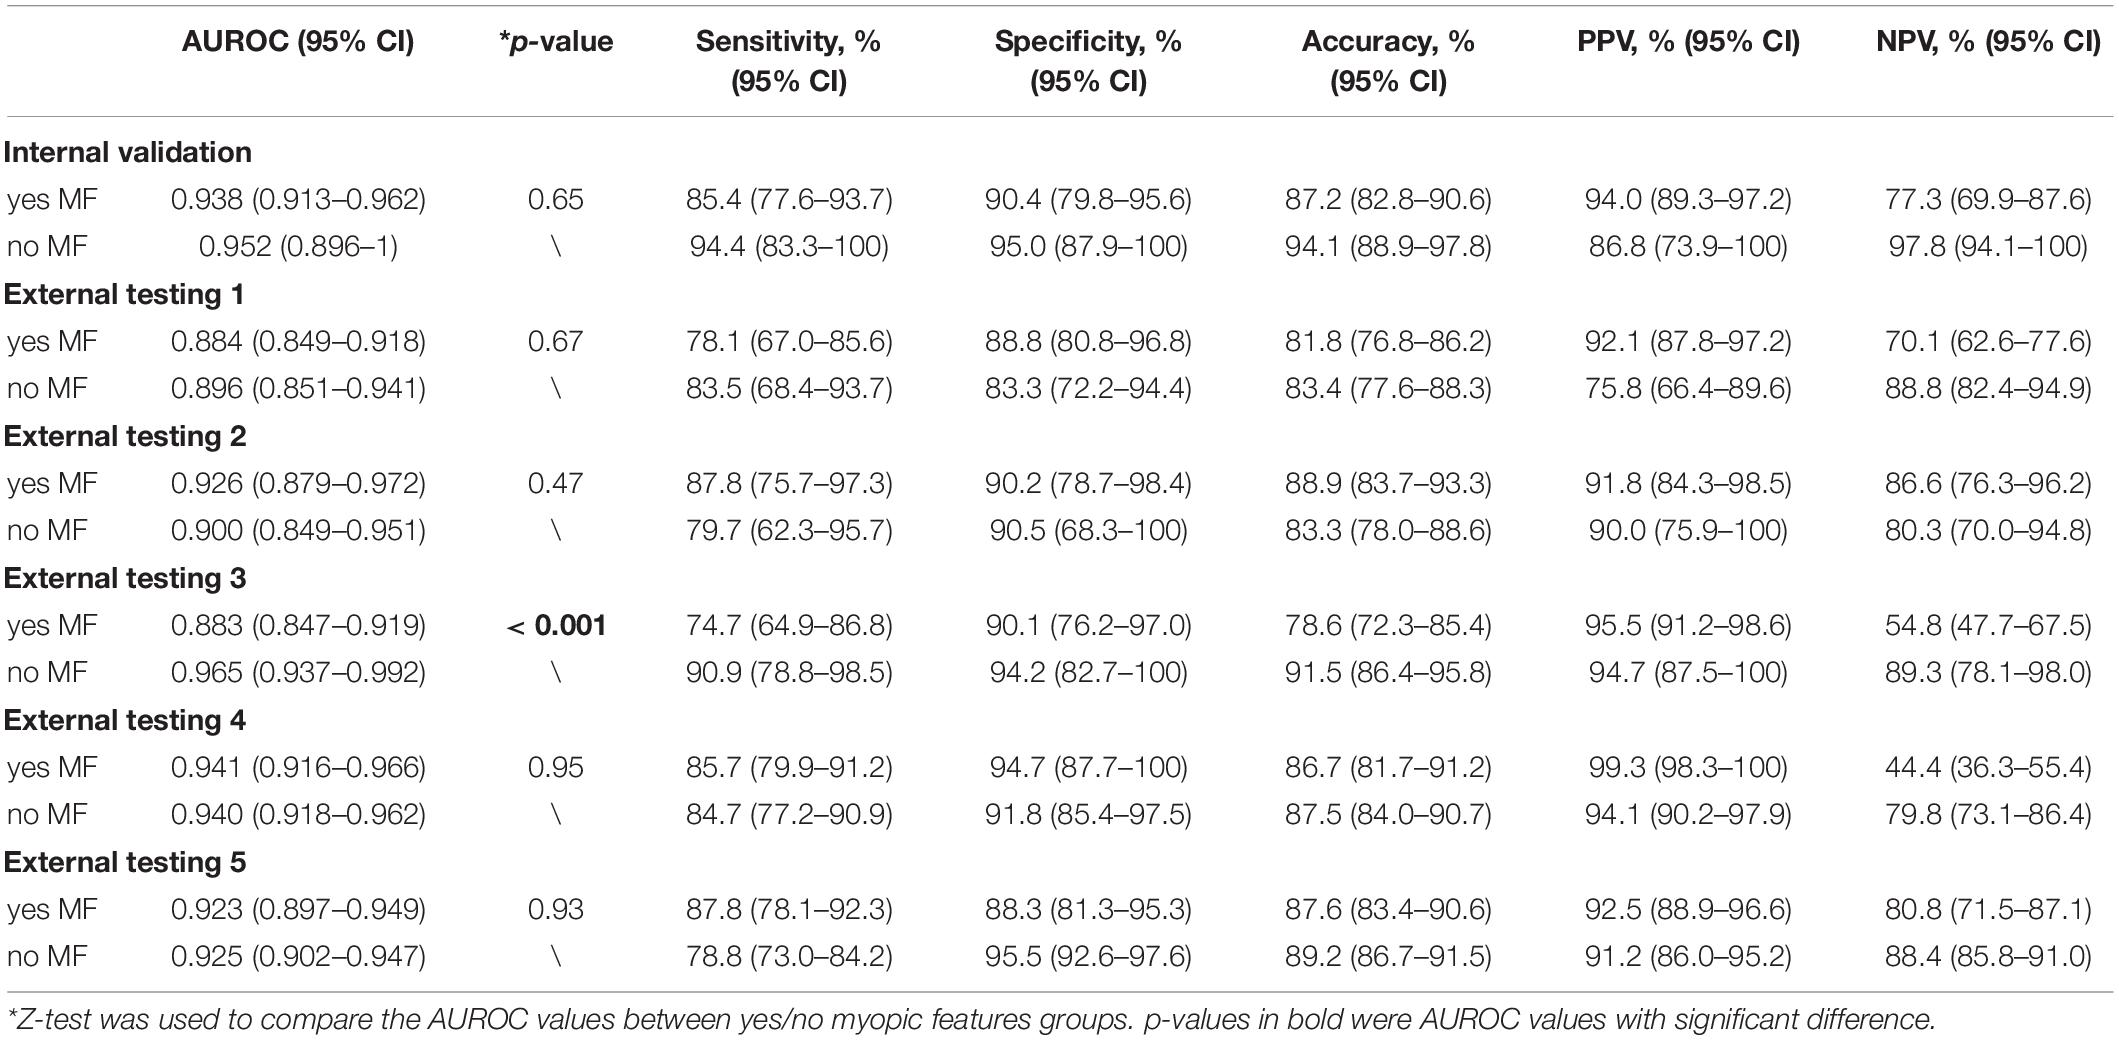
Table 3. Subgroup analysis for detecting glaucomatous optic neuropathy in groups stratified by yes/no myopic features.
Table 4 and Supplementary Figure 3 illustrate the DL model’s performance to detect MF. It was generalizable in internal validation and five external testing datasets, with the AUROC values of 0.892 (95% CI, 0.860–0.924), 0.885 (95% CI, 0.855–0.915), 0.855 (95% CI, 0.811–0.899), 0.886 (95% CI, 0.856–0.916), 0.866 (95% CI, 0.843–0.888), and 0.875 (95% CI, 0.854–0.896), respectively. When comparing with a 3D single-task model and a 2D multi-task model, the proposed 3D multi-task showed better performance with higher generalizability in external testing.
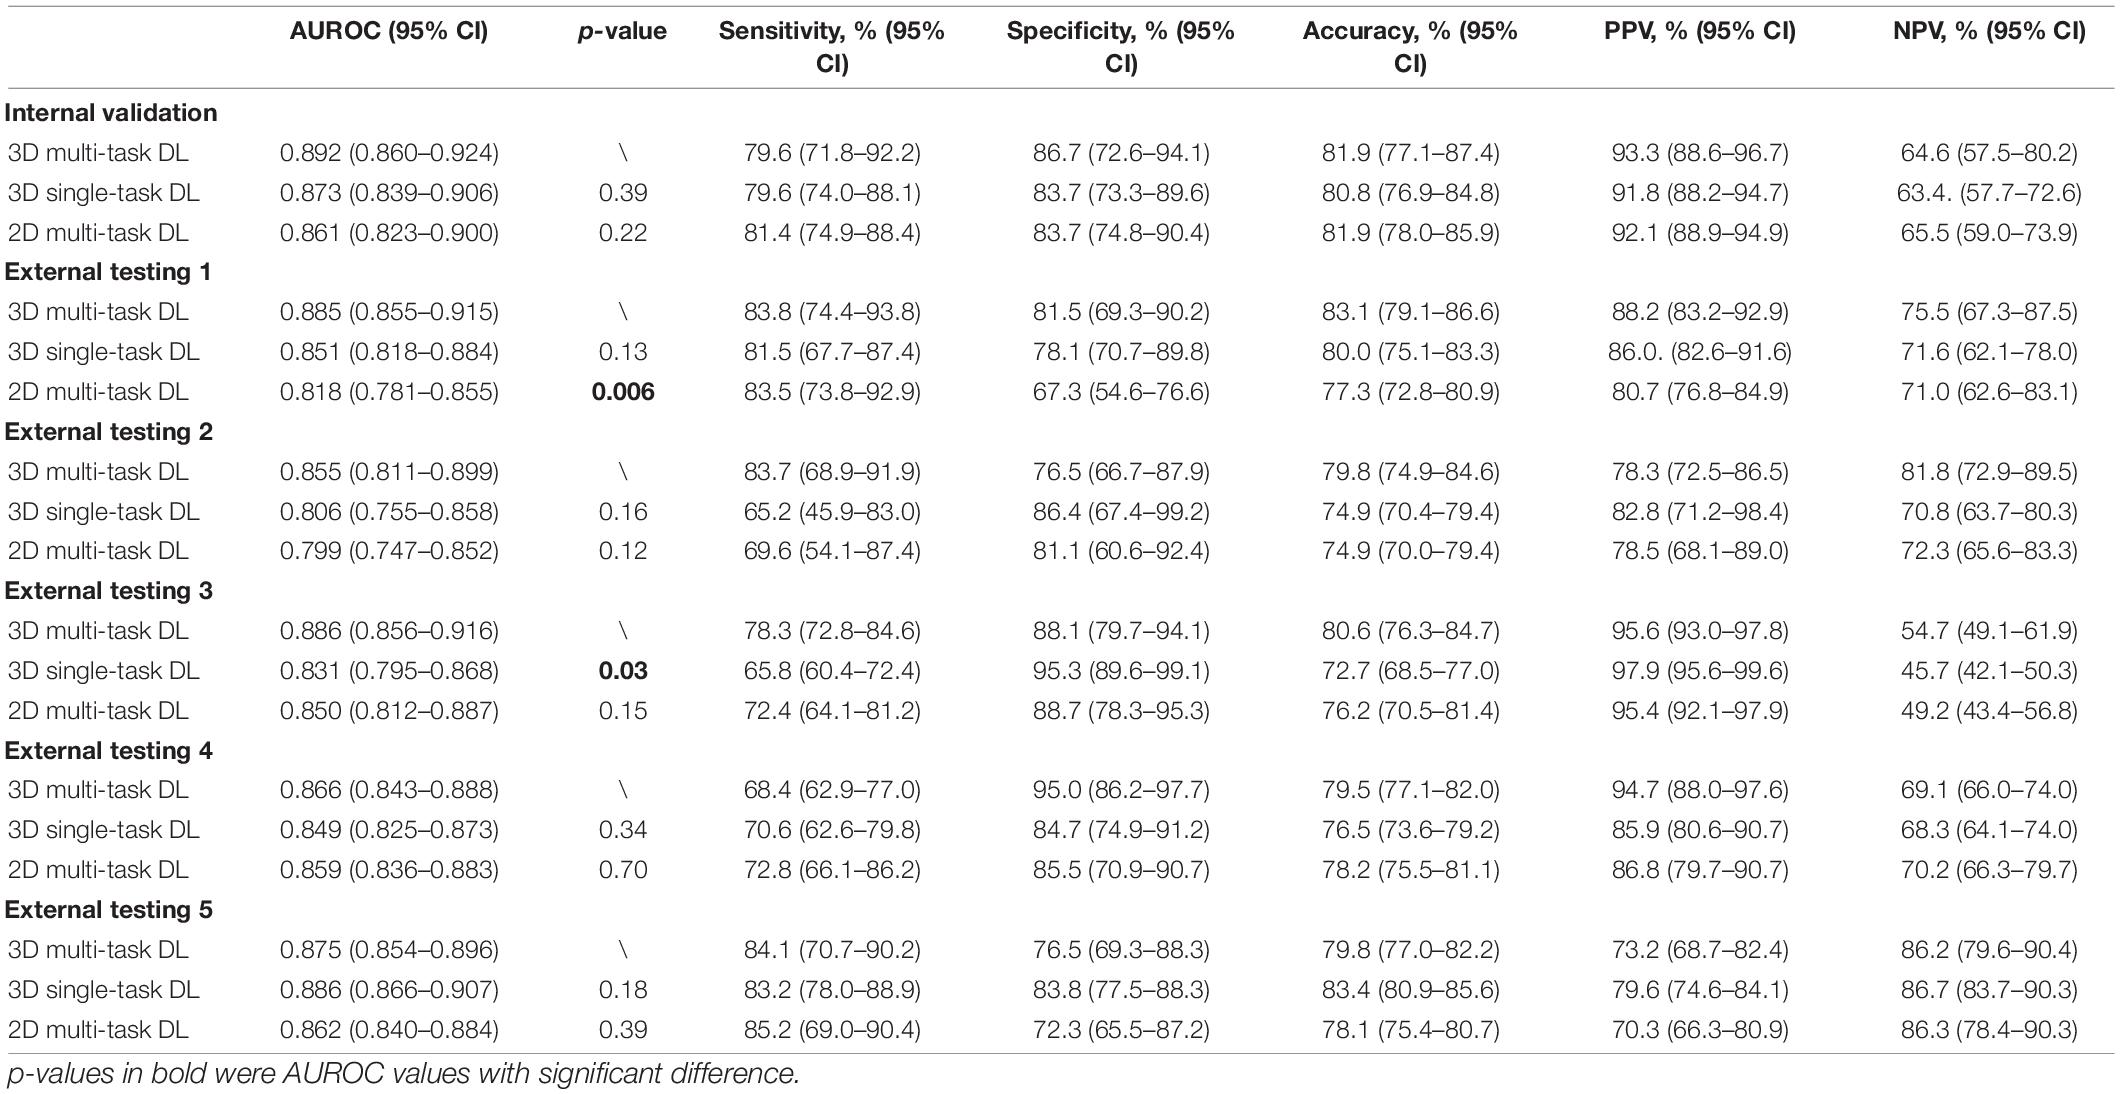
Table 4. The discriminative performance of the multi-task 3D deep learning model for detecting myopic feature and the comparison to a single-task 3D deep learning model in all datasets.
The training-tuning curve (Supplementary Figure 4) showed that the multi-task 3D DL model converged approximately around the 30th epoch and kept stable without significant oscillation after the 50th epoch. This finding, combined with the discriminative performance results in all the datasets, suggested that the multi-task 3D DL model had learned general knowledge to identify both GON and MF, and was not overfitted.
On the heatmaps (Figure 3), the red-orange-coloured area has the most discriminatory power to detect MF. The optic disc and PPA areas were red-orange-coloured in the truly detected eye with PPA. It demonstrated that the 3D multi-task DL model could discriminate MF around the ONH. While for the truly detected SDOCT scans as “no MF,” the heatmaps showed that only the optic disc area was red-orange-coloured.
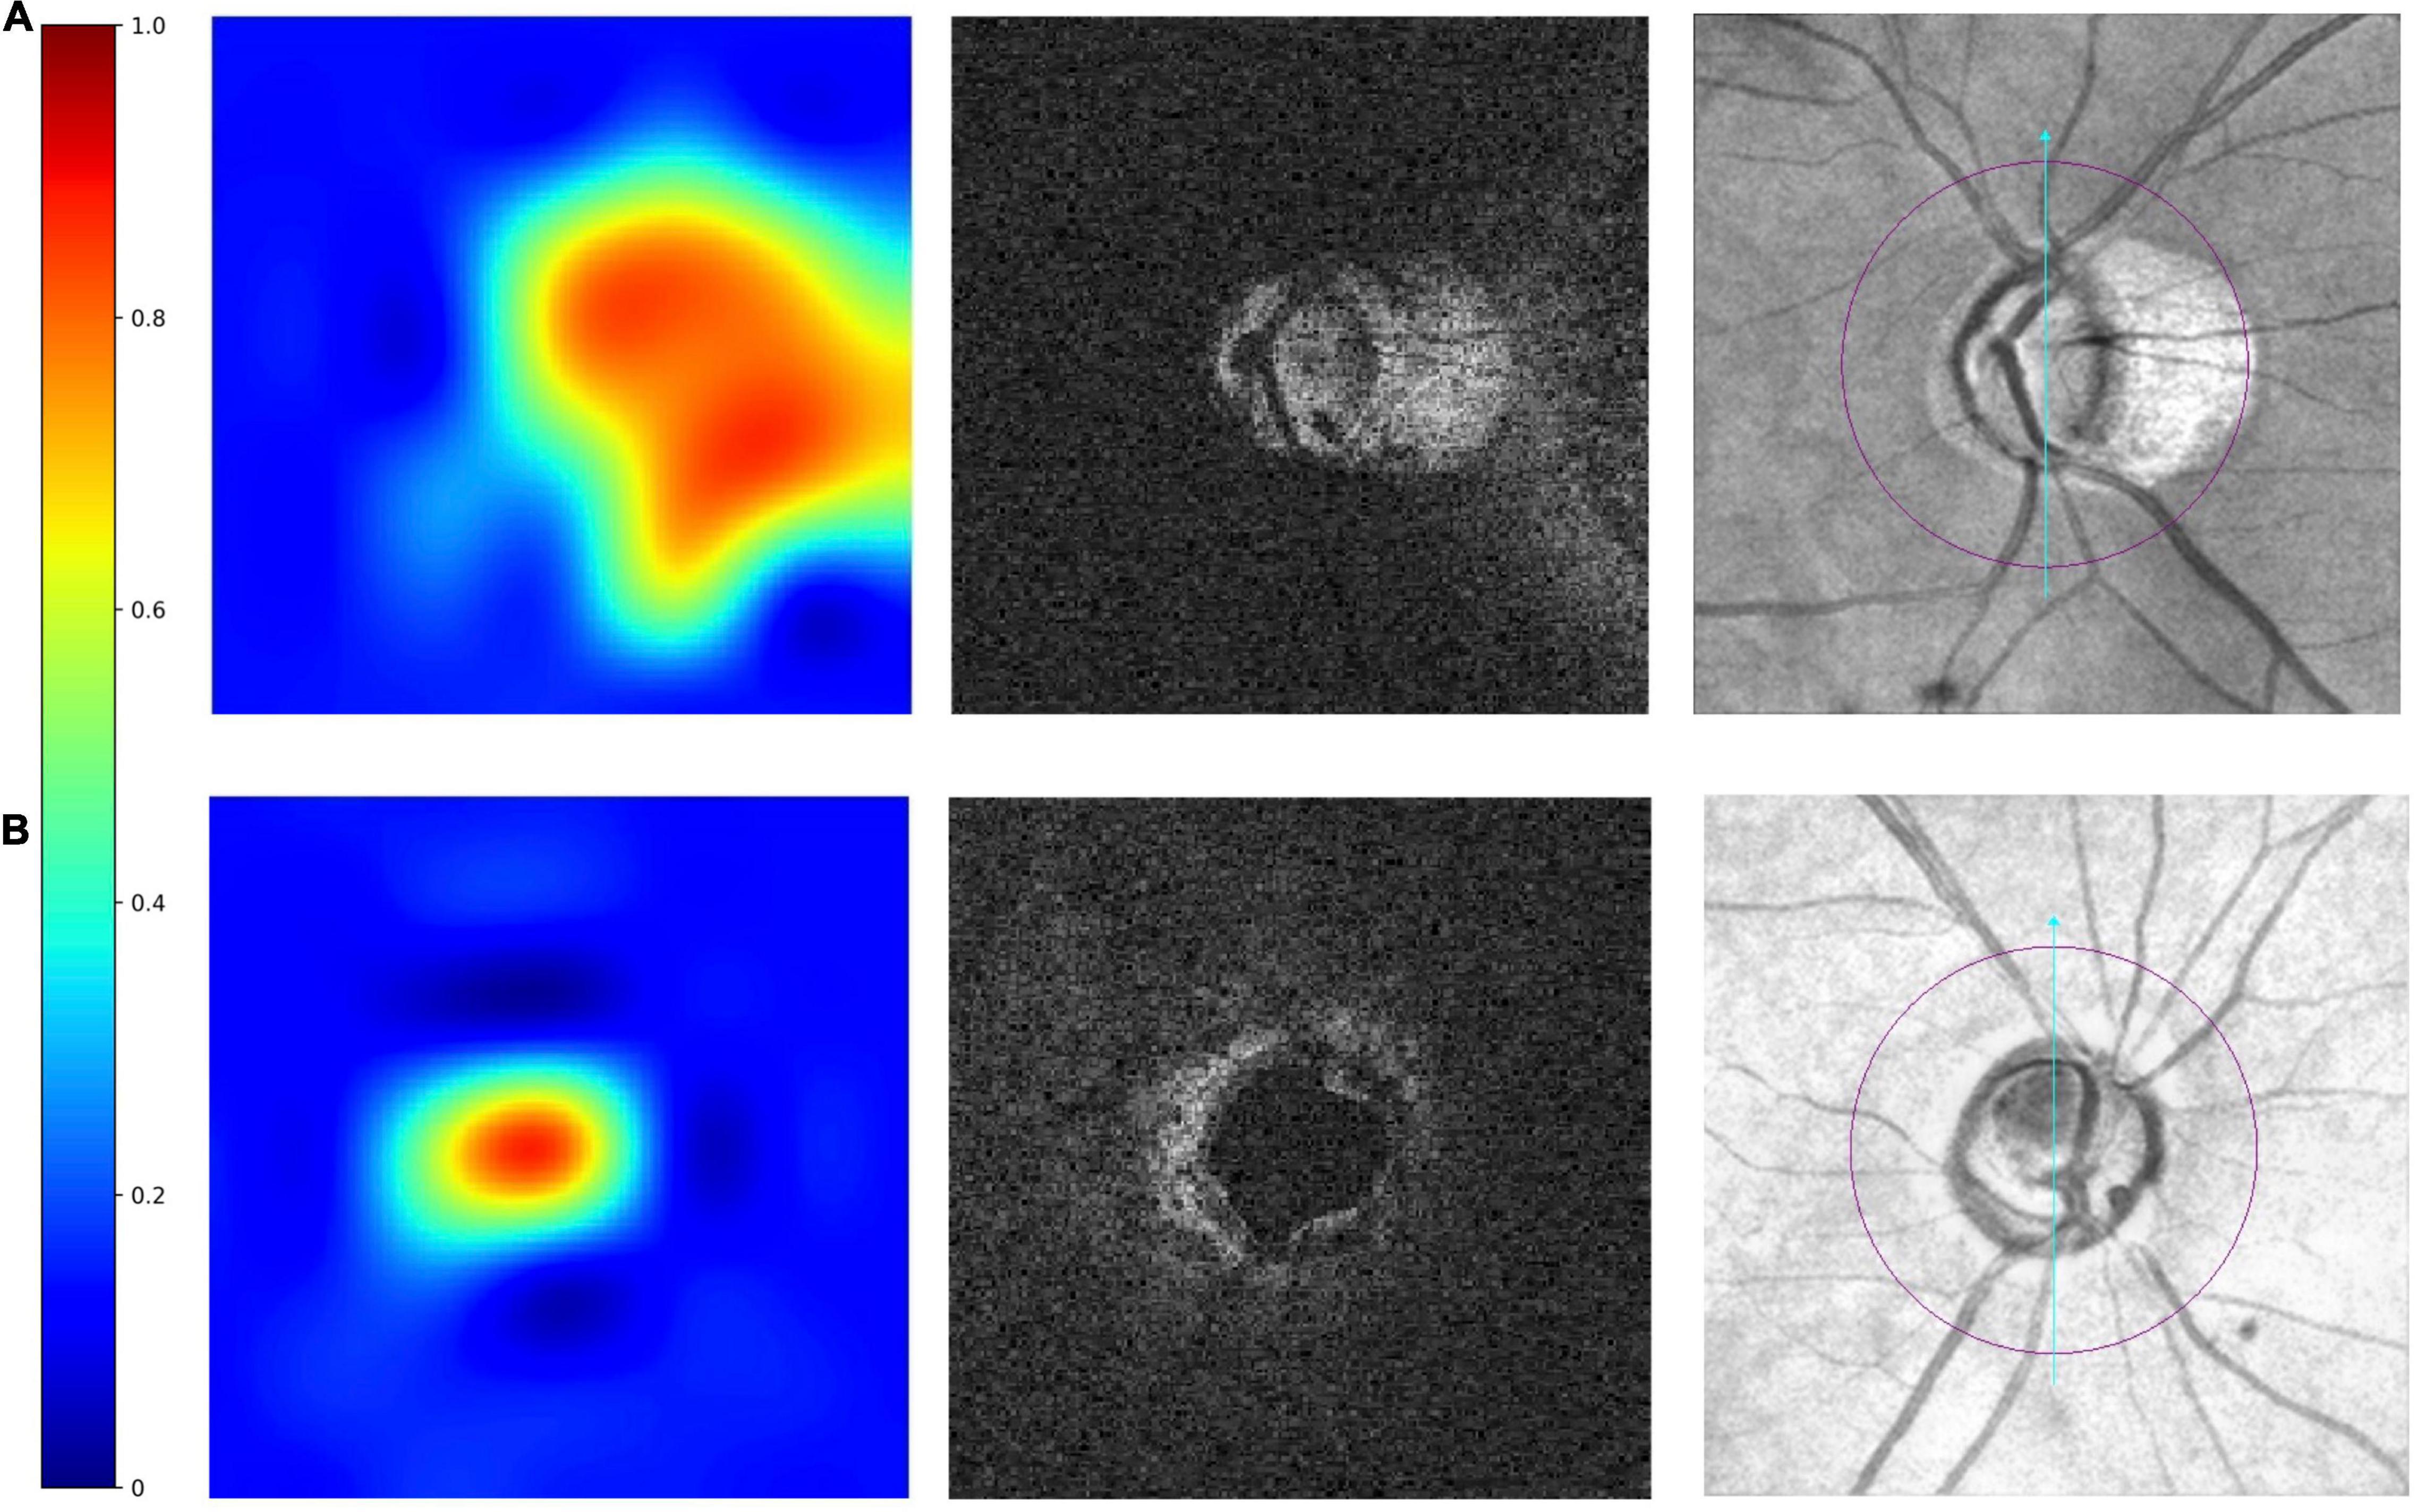
Figure 3. Examples of truly detected eyes by the multi-task 3D DL model. From left to right were heatmaps, raw images, and the corresponding en face fundus images. The red–orange-coloured area on heatmaps has the most discriminatory power to detect MF. The heatmaps shows in panel (A) an eye with myopic features (peripapillary atrophy, PPA), the optic disc area and the areas with PPA is red-orange-coloured. In panel (B) an eye without myopic features, only optic disc was red-orange-coloured.
Discussion
To the best of our knowledge, the proposed multi-task 3D DL model is the first reported attempt to automatically detect GON and MF from SDOCT volumetric data simultaneously. The results showed a generalised performance for both tasks among the datasets and the presence of MF did not significantly affect DL model’s ability to identify GON.
Compared with a single task model, a multi-task model learned shared features from multiple tasks simultaneously. These shared features can potentially increase data efficiency and yield faster learning speed for related or down-stream tasks, which may alleviate DL’s weakness of requiring large-scale data and computation power (24). The proposed 3D DL multi-task model showed higher generalizability to detect GON when comparing with our previous single task model (21). When tested on two newly collected unseen datasets from HK (External testing 3) and Singapore (External testing 5), it achieved AUROC values of 0.906 and 0.930, respectively. To be more precise, we also trained single-task models with the exact same split data as the multi-task model. We found that the multi-task model had generally better performance for GON detection. The sub-analysis also reflected that except External testing 3, the presence or absence of MF did not influence the discriminative performance of the proposed multi-task DL model for GON detection in internal validation and external testing, which proved that during the training process, the multi-task model learned effective features to identify GON in eyes with or without MF, so that when testing on unseen datasets, the performance of GON detection will not be influenced by presence or absence of MF. Hence, after applying the multi-task learning strategy and providing additional information of Yes/No MF during the training process, the proposed multi-task 3D DL model learned more general features and demonstrated a robust discriminative ability in the task of identifying GON when tested on different datasets.
Compared with conventional method, i.e., RNFL thickness measurement, the DL model performed better in internal validation and comparable in five external testing datasets for GON identification. In addition to the good performance, this automated DL model can provide a straightforward classification result, i.e., Yes or No GON, which was more advantageous than current discriminative capability based on RNFL thickness and built-in normative databases as the RNFL thickness is affected by various factors including axial length, myopia, age, optic disc size, and SS (36–41). Experienced ophthalmologists are needed to interpret and classify GON based on a series of outputs from the SDOCT report. Therefore, the proposed multi-task model can potentially be applied in primary settings without glaucoma specialists or even ophthalmologists on site, which may help primary care clinicians to identify GON simply from the binary output of the DL model, and then refer to ophthalmologists.
In addition, the multi-task DL model also offered an output of “Yes/No MF” for each image with good and consistent performance in internal and external datasets. Myopia is one of the risk factors for glaucoma (23, 42–44) and the ONH deformations in myopic eyes may predispose toward glaucoma (45). Features observed on areas around ONH on the fundus, such as the location of principal RNFL bundles, optic disc tilting, and optic disc torsion, were also related to spherical error and glaucoma severity (7, 46). Our multi-task 3D DL model can detect the presence or absence of these features and give clinicians more information. The heatmaps also proved that for MF discrimination, the 3D multi-task DL model paid more attention on the ONH and the surrounding areas. Besides, the multi-task model showed significantly higher generalizability when comparing with single-task model for MF detection. Thus, it further proved aforementioned advantage of the multi-task model that learning both GON and MF features during training could potentially improve the model’s generalizability for both tasks when testing on unseen datasets.
Our study has several strengths. First, we collected our datasets from different eye centres from different countries and regions including different ethnic backgrounds. It performed consistently well in all the datasets. The training-tuning curves also illustrated that the proposed DL model was not overfitted. Thus, our multi-task 3D DL model could potentially be applied on other unseen datasets, even among different populations. Second, we used multi-task technique to provide additional information on MF without influencing GON identification. Current model could detect two kinds of abnormalities simultaneously and will potentially assist clinicians with less experience in classifying glaucoma. Third, the multi-task DL model can generate straightforward output of Yes/No GON and MF and can be incorporated with our previously developed image quality assessment model in the future (31), which will further strengthen SDOCT as a screening tool in settings without sufficient ophthalmologists on site. Fourth, we developed a 3D multi-task model which could use of all the information in the volumetric scan and showed generally better performance than 2D model trained with B-scans for both tasks. It will provide volume-level output which would be more straightforward for physicians (non-ophthalmologists) and could also save manpower or computation power to deal with large number of B-scans. One of the limitations was that we used SDOCT paired en face photographs instead of colour FP to label MF due to the lack of unpaired OCT and FP in most patients. Besides, we only labelled the Yes/No MF instead of Yes/No myopia as the data of spherical error and AL for most of the patients was lacking due to the nature of retrospective study. However, information of anatomical features could be more useful when detecting GON in myopic eyes. In future, we may obtain a small dataset with paired OCT, FP, spherical error, or AL, for data annotation and apply advanced DL techniques, such as generative adversarial network (GAN) (47) or semi-supervised learning (28), to generate pseudo-labels for other data, which will further refine our model and enhance its feasibility to detect GON in high myopic eyes. We also intend to investigate whether increase the number of related tasks will further enhance the DL model’s discriminative ability and data-efficiency for GON detection.
In conclusion, with multi-task learning technique, the proposed 3D DL model demonstrated high generalizability in all the datasets to detect GON and MF simultaneously. It would potentially enhance clinicians’ capability to identify GON in eyes with MF and be applied in primary settings without sufficient specialists on site.
Data Availability Statement
The de-identified individual participant data, the study protocol, the statistical analysis plan, and the coding are available upon reasonable request. Such requests are decided on a case-by-case basis. Proposals should be directed to CYC, Y2Fyb2xjaGV1bmdAY3Voay5lZHUuaGs=.
Ethics Statement
The studies involving human participants were reviewed and approved by the Research Ethics Committee of the Hospital Authority, Hong Kong; the SingHealth Centralized Institutional Review Board, Singapore; Stanford University’s Institutional Review Board/Ethics Committee, the United States. The patients/participants provided their written informed consent to participate in this study.
Author Contributions
CYC and AR conceived and designed the study and wrote the initial draft. XW developed and validated the DL model supervised by HC and P-AH with the help of clinical input from AR, CYC, PC, NC, MW, and CT. PC, MW, and CT provided data from CUHK Eye Centre and HKEH. NC, WY, and AY provided data from PWH and AHNH. H-WY provided the data from TMEC. SM and RC provided the data from the Stanford. YT and C-YC provided the data from SERI. AR and XW performed the statistical analysis. XZ and FL provided clinical support during the model development. All authors subsequently critically edited the report and read and approved the final report.
Funding
This study was funded by Innovation and Technology Fund, Hong Kong SAR, China (MRP/056/20X).
Conflict of Interest
The authors declare that the research was conducted in the absence of any commercial or financial relationships that could be construed as a potential conflict of interest.
Publisher’s Note
All claims expressed in this article are solely those of the authors and do not necessarily represent those of their affiliated organizations, or those of the publisher, the editors and the reviewers. Any product that may be evaluated in this article, or claim that may be made by its manufacturer, is not guaranteed or endorsed by the publisher.
Acknowledgments
Lam Kin Chung. Jet King-Shing Ho Glaucoma Treatment and Research Centre, The Chinese University of Hong Kong, Hong Kong SAR, China.
Supplementary Material
The Supplementary Material for this article can be found online at: https://www.frontiersin.org/articles/10.3389/fmed.2022.860574/full#supplementary-material
References
1. Bourne RR, Stevens GA, White RA, Smith JL, Flaxman SR, Price H, et al. Causes of vision loss worldwide, 1990-2010: a systematic analysis. Lancet Glob Health. (2013) 1:e339–49. doi: 10.1016/S2214-109X(13)70113-X
2. Tham YC, Li X, Wong TY, Quigley HA, Aung T, Cheng CY. Global prevalence of glaucoma and projections of glaucoma burden through 2040: a systematic review and meta-analysis. Ophthalmology. (2014) 121:2081–90. doi: 10.1016/j.ophtha.2014.05.013
3. Leung CK, Cheung CY, Weinreb RN, Qiu Q, Liu S, Li H, et al. Retinal nerve fiber layer imaging with spectral-domain optical coherence tomography: a variability and diagnostic performance study. Ophthalmology. (2009) 116:1263.e1–2.. doi: 10.1016/j.ophtha.2009.04.013
4. Koh V, Tham YC, Cheung CY, Mani B, Wong TY, Aung T, et al. Diagnostic accuracy of macular ganglion cell-inner plexiform layer thickness for glaucoma detection in a population-based study: comparison with optic nerve head imaging parameters. PLoS One. (2018) 13:e0199134. doi: 10.1371/journal.pone.0199134
5. Mwanza JC, Budenz DL, Godfrey DG, Neelakantan A, Sayyad FE, Chang RT, et al. Diagnostic performance of optical coherence tomography ganglion cell–inner plexiform layer thickness measurements in early glaucoma. Ophthalmology. (2014) 121:849–54. doi: 10.1016/j.ophtha.2013.10.044
6. Chang RT, Knight OJ, Feuer WJ, Budenz DL. Sensitivity and specificity of time-domain versus spectral-domain optical coherence tomography in diagnosing early to moderate glaucoma. Ophthalmology. (2009) 116:2294–9.
7. Baniasadi N, Wang MY, Wang H, Mahd M, Elze T. Associations between optic nerve head-related anatomical parameters and refractive error over the full range of glaucoma severity. Transl Vis Sci Technol. (2017) 6:9. doi: 10.1167/tvst.6.4.9
8. Yan YN, Wang YX, Xu L, Xu J, Wei WB, Jonas JB. Fundus tessellation: prevalence and associated factors: the Beijing Eye Study 2011. Ophthalmology. (2015) 122:1873–80. doi: 10.1016/j.ophtha.2015.05.031
9. Hwang YH, Yoo C, Kim YY. Myopic optic disc tilt and the characteristics of peripapillary retinal nerve fiber layer thickness measured by spectral-domain optical coherence tomography. J Glaucoma. (2012) 21:260–5.
10. Jonas JB, Jonas SB, Jonas RA, Holbach L, Dai Y, Sun X, et al. Parapapillary atrophy: histological gamma zone and delta zone. PLoS One. (2012) 7:e47237. doi: 10.1371/journal.pone.0047237
11. Qiu KL, Zhang MZ, Leung CKS, Zhang RP, Lu XH, Wang G, et al. Diagnostic classification of retinal nerve fiber layer measurement in myopic eyes: a comparison between time-domain and spectral-domain optical coherence tomography. Am J Ophthalmol. (2011) 152:646–53. doi: 10.1016/j.ajo.2011.04.002
13. Xiangyu C, Yanwu X, Wong DWK, Wong TY, Jiang L. Glaucoma detection based on deep convolutional neural network. Annu Int Conf IEEE Eng Med Biol Soc. (2015) 2015:715–8.
14. Muhammad H, Fuchs TJ, De Cuir N, De Moraes CG, Blumberg DM, Liebmann JM, et al. Hybrid deep learning on single wide-field optical coherence tomography scans accurately classifies glaucoma suspects. J Glaucoma. (2017) 26:1086–94. doi: 10.1097/IJG.0000000000000765
15. Christopher M, Belghith A, Bowd C, Proudfoot JA, Goldbaum MH, Weinreb RN, et al. Performance of deep learning architectures and transfer learning for detecting glaucomatous optic neuropathy in fundus photographs. Sci Rep. (2018) 8:16685. doi: 10.1038/s41598-018-35044-9
16. Medeiros FA, Jammal AA, Thompson AC. From machine to machine: an OCT-trained deep learning algorithm for objective quantification of glaucomatous damage in fundus photographs. Ophthalmology. (2018) 126:513–21. doi: 10.1016/j.ophtha.2018.12.033
17. Maetschke S, Antony B, Ishikawa H, Wollstein G, Schuman J, Garnavi R. A feature agnostic approach for glaucoma detection in OCT volumes. PLoS One. (2019) 14:e0219126. doi: 10.1371/journal.pone.0219126
18. Thompson AC, Jammal AA, Medeiros FA. A deep learning algorithm to quantify neuroretinal rim loss from optic disc photographs. Am J Ophthalmol. (2019) 201:9–18. doi: 10.1016/j.ajo.2019.01.011
19. Li Z, He Y, Keel S, Meng W, Chang RT, He M. Efficacy of a deep learning system for detecting glaucomatous optic neuropathy based on color fundus photographs. Ophthalmology. (2018) 125:1199–206. doi: 10.1016/j.ophtha.2018.01.023
20. Shibata N, Tanito M, Mitsuhashi K, Fujino Y, Matsuura M, Murata H, et al. Development of a deep residual learning algorithm to screen for glaucoma from fundus photography. Sci Rep. (2018) 8:14665.
21. Ran AR, Cheung CY, Wang X, Chen H, Luo L-Y, Chan PP, et al. Detection of glaucomatous optic neuropathy with spectral-domain optical coherence tomography: a retrospective training and validation deep-learning analysis. Lancet Digit Health. (2019) 1:e172–82. doi: 10.1016/S2589-7500(19)30085-8
22. Jonas JB, Holbach L, Panda-Jonas S. Peripapillary ring: histology and correlations. Acta Ophthalmol. (2014) 92:e273–9. doi: 10.1111/aos.12324
23. Qiu M, Wang SY, Singh K, Lin SC. Association between myopia and glaucoma in the United States Population. Invest Ophth Vis Sci. (2013) 54:830–5. doi: 10.1167/iovs.12-11158
24. Crawshaw M. Multi-task learning with deep neural networks: a survey. arXiv. [Preprint]. (2020). Available online at: https://arxiv.org/abs/2009.09796 (accessed September 10, 2022).
25. Sobhaninia Z, Rafiei S, Emami A, Karimi N, Najarian K, Samavi S, et al. Fetal ultrasound image segmentation for measuring biometric parameters using multi-task deep learning. Annu Int Conf IEEE Eng Med Biol Soc. (2019) 2019:6545–8. doi: 10.1109/EMBC.2019.8856981
26. Amyar A, Modzelewski R, Li H, Ruan S. Multi-task deep learning based CT imaging analysis for COVID-19 pneumonia: classification and segmentation. Comput Biol Med. (2020) 126:104037.
27. Song L, Lin JZ, Wang ZJ, Wang HQ. An end-to-end multi-task deep learning framework for skin lesion analysis. IEEE J Biomed Health. (2020) 24:2912–21. doi: 10.1109/JBHI.2020.2973614
28. Wang X, Chen H, Ran AR, Luo L, Chan PP, Tham CC, et al. Towards multi-center glaucoma OCT image screening with semi-supervised joint structure and function multi-task learning. Med Image Anal. (2020) 63:101695. doi: 10.1016/j.media.2020.101695
29. Tang F, Wang X, Ran AR, Chan CKM, Ho M, Yip W, et al. A multitask deep-learning system to classify diabetic macular edema for different optical coherence tomography devices: a multicenter analysis. Diabetes Care. (2021) 44:2078–88. doi: 10.2337/dc20-3064
30. Yang DW, Sun ZH, Shi J, Ran AR, Tang FY, Tang ZQ, et al. A multitask deep-learning system for assessment of diabetic macular ischemia on optical coherence tomography angiography images. Retina. (2022) 42:184–94. doi: 10.1097/IAE.0000000000003287
31. Ran AR, Shi J, Ngai AK, Chan WY, Chan PP, Young AL, et al. Artificial intelligence deep learning algorithm for discriminating ungradable optical coherence tomography three-dimensional volumetric optic disc scans. Neurophotonics. (2019) 6:041110. doi: 10.1117/1.NPh.6.4.041110
32. Collaborative Normal-Tension Glaucoma Study Group. The effectiveness of intraocular pressure reduction in the treatment of normal-tension glaucoma. Collaborative Normal-Tension Glaucoma Study Group. Am J Ophthalmol. (1998) 126:498–505. doi: 10.1016/s0002-9394(98)00272-4
33. Manjunath V, Shah H, Fujimoto JG, Duker JS. Analysis of peripapillary atrophy using spectral domain optical coherence tomography. Ophthalmology. (2011) 118:531–6. doi: 10.1016/j.ophtha.2010.07.013
34. Tay E, Seah SK, Chan SP, Lim ATH, Chew SJ, Foster PJ, et al. Optic disk ovality as an index of tilt and its relationship to myopia and perimetry. Am J Ophthalmol. (2005) 139:247–52. doi: 10.1016/j.ajo.2004.08.076
35. Zhou B, Khosla A, Lapedriza A, Oliva A, Torralba A. Learning Deep Features for Discriminative Localization. 2016 IEEE Conference on Computer Vision and Pattern Recognition (CVPR). Las Vegas, NV: IEEE (2016). p. 2921–9.
36. Knight OJ, Girkin CA, Budenz DL, Durbin MK, Feuer WJ Cirrus OCT Normative Database Study Group. Effect of race, age, and axial length on optic nerve head parameters and retinal nerve fiber layer thickness measured by Cirrus HD-OCT. Arch Ophthalmol. (2012) 130:312–8.
37. Cheung CYL, Leung CKS, Lin DS, Pang CP, Lam DSC. Relationship between retinal nerve fiber layer measurement and signal strength in optical coherence tomography. Ophthalmology. (2008) 115:1347–51.
38. Leung CKS, Yu M, Weinreb RN, Mak HK, Lai G, Ye C, et al. Retinal nerve fiber layer imaging with spectral-domain optical coherence tomography: interpreting the rnfl maps in healthy myopic eyes. Invest Ophth Vis Sci. (2012) 53:7194–200. doi: 10.1167/iovs.12-9726
39. Biswas S, Lin C, Leung CK. Evaluation of a myopic normative database for analysis of retinal nerve fiber layer thickness. JAMA Ophthalmol. (2016) 134:1032–9. doi: 10.1001/jamaophthalmol.2016.2343
40. Chang RT, Singh K. Myopia and glaucoma: diagnostic and therapeutic challenges. Curr Opin Ophthalmol. (2013) 24:96–101.
41. Cheung CY, Chen D, Wong TY, Tham YC, Wu RY, Zheng YF, et al. Determinants of quantitative optic nerve measurements using spectral domain optical coherence tomography in a population-based sample of non-glaucomatous subjects. Invest Ophth Vis Sci. (2011) 52:9629–35. doi: 10.1167/iovs.11-7481
42. Xu L, Wang Y, Wang S, Wang Y, Jonas JB. High myopia and glaucoma susceptibility the Beijing Eye Study. Ophthalmology. (2007) 114:216–20. doi: 10.1016/j.ophtha.2006.06.050
43. Marcus MW, de Vries MM, Montolio FGJ, Jansonius NM. Myopia as a risk factor for open-angle glaucoma: a systematic review and meta-analysis. Ophthalmology. (2011) 118:1989–1994.e2. doi: 10.1016/j.ophtha.2011.03.012
44. Shen L, Melles RB, Metlapally R, Barcellos L, Schaefer C, Risch N, et al. The association of refractive error with glaucoma in a multiethnic population. Ophthalmology. (2016) 123:92–101. doi: 10.1016/j.ophtha.2015.07.002
45. Tan NYQ, Sng CCA, Ang M. Myopic optic disc changes and its role in glaucoma. Curr Opin Ophthalmol. (2019) 30:89–96.
46. Elze T, Baniasadi N, Jin Q, Wang H, Wang M. Ametropia, retinal anatomy, and OCT abnormality patterns in glaucoma. 1. Impacts of refractive error and interartery angle. J Biomed Opt. (2017) 22:1–11.
Keywords: artificial intelligence, deep learning, multi-task, glaucomatous optic neuropathy, glaucoma, myopic features, myopia, optical coherence tomography
Citation: Ran AR, Wang X, Chan PP, Chan NC, Yip W, Young AL, Wong MOM, Yung H-W, Chang RT, Mannil SS, Tham YC, Cheng C-Y, Chen H, Li F, Zhang X, Heng P-A, Tham CC and Cheung CY (2022) Three-Dimensional Multi-Task Deep Learning Model to Detect Glaucomatous Optic Neuropathy and Myopic Features From Optical Coherence Tomography Scans: A Retrospective Multi-Centre Study. Front. Med. 9:860574. doi: 10.3389/fmed.2022.860574
Received: 23 January 2022; Accepted: 25 April 2022;
Published: 15 June 2022.
Edited by:
Michaël J. A. Girard, Singapore National Eye Centre, SingaporeReviewed by:
Jiong Zhang, University of Southern California, United StatesAristeidis Konstantinidis, University Hospital of Alexandroupolis, Greece
Copyright © 2022 Ran, Wang, Chan, Chan, Yip, Young, Wong, Yung, Chang, Mannil, Tham, Cheng, Chen, Li, Zhang, Heng, Tham and Cheung. This is an open-access article distributed under the terms of the Creative Commons Attribution License (CC BY). The use, distribution or reproduction in other forums is permitted, provided the original author(s) and the copyright owner(s) are credited and that the original publication in this journal is cited, in accordance with accepted academic practice. No use, distribution or reproduction is permitted which does not comply with these terms.
*Correspondence: Carol Y. Cheung, Y2Fyb2xjaGV1bmdAY3Voay5lZHUuaGs=
†These authors have contributed equally to this work and share first authorship
‡These authors have contributed equally to this work and share senior authorship